
Reducing Regional Health Disparities: Challenges & Opportunities
Triono Soendoro Ministry of Health, Indonesia

Questions
1. What are the parameters/indicators that determines regional disparities?
2. What areas have seen the most progress?
3. What are the remaining challenges and gaps?

Questions: 1
What are the indiators that determines regional disparities?

The Indicators: PHDI (1)
1. Indonesia MoH made a composite index to describe life expectancy named Public Health Development Index (PHDI): used to rank district by level of "public health development progress" from poor to better development
2. Formulated based on community data from the National Basic Health Research (Riskesdas) 2007, National Socio-economic Survey (Susenas) 2007, and Survey of Village Potential (Podes) 2008.
3. The PHDI calculate from 24 health indicators.

The Indicators: PHDI (2)
1. The “absolute” indicators (5): wasting, malnutrition, stunting, monthly growth monitoring, clean wates, sanitation facilities,, immunization, delivery assisted by health worker, doctor to health centre (puskesmas), midwife at village.
2. The “important” indicators (4) are: overweight, diarrhoea, pneumonia, hypertension, hand washing behaviour.
3. The “need” indicators (3): smoking, dental

The Purpose: PHDI
• Describe public health development progress for entire districts in Indonesia
• Focused programs interventions (local specific) in each districts.

The Benefits • A tool to evaluate the process of improving
a certain area (district/municipality) on health status over time.
• An advocacy for province and district government to increase their health status using focused resources and programs interventions priority.
• As a criteria of health fund allocation from central to province and district government.

The Challenges
–Why is there is no clear connection between a government’s national health expenditures and the health status of the people?
Or
–Why don’t increasing investments in the budget of a Ministry of Health always lead to clearly measurable improvements in the health of the population?

Questions: 2
What areas have seen the most progress?

District DBK: The Areas
Category 2007 2012
• District/Urban DBK 130 156
• District/Urban Non
DBK 310 341
Jumlah 440 497

P-DBK: 10 Prov as of ‘11
Aceh (14/21)
NTB ( 6/9)
NTT (11/16)
Sulteng (7/10)
Sultra (8/10)
Gorontl (5/5)
Sulbar (4/5)
Maluku (5/8)
Pap Bar (6/9)
Papua (14/20)
• Prop DBK: # total : 28 prop 130 kab/kot • Prop > 50% Kab DBK : 10 prop* 80 kab/kot • Prop < 50% Kab DBK : 18 prop 50 kab/kot

PDBK
Reformasi
Planing
Penguatan Petugas
Lapangan
P.Pusat
P.Prop P.Kab/Kota
IPKM
Kinerja
Daya ungkit
SPM
P.Pusat
P.Prop
P.Kab/kota
Alur P-DBK
Integrated Planning
IPKM/Riskesdas
Sikon Daerah

The Intervention: Areas • Mentoring Guidelines
• Intervention in the provinces (8 of 10) that have more than 50% underdeveloped districts.
• Each provinces: guided by 10-12 persons program staff from MOH as mentor and 1-2 NIHRD researcher for each districts as “Pengamat”.
• Total of 64 districts are included in the intervention.
• .

The Principles: Dialog & Action
• Implement learning organization principles through dialogue “kalakarya and mentoring” at all level forllow by “local action”.
• Assess the impact of the PDBK (kalakarya and mentoring) on reformulation of district’s policies, programs, and activities including local creativities in reducing disparities of PHDI.

Training
Actions
Organizational Change
Start End
Actions
RDS RDS Trans lation
Internal Support Group
Mentoring
Learning History: Cohort of PDBK
The Challenges: Partnership

Comitment & Involvement

ACTION: Posyandu

The Most Progress Areas
• In 2010: 8 provinces and districts
• In 2011: 64 districst, 8 provinces
followed by 29 districts and 3 cities, had kalakarya & visited > than once
• In 2012: newly 18 districts and 3 cities, followed by intensive interaction of districts visited in 2010, 2011
• Dynamic movement is different for each districts.

Questions: 3
What are the remaining challenges and gaps?
(Underveloped districts/DBK)

RisKesDas, IPKM, & P-DBK
2010 2013
Inisiasi: RKDAS, PODES, IPKM
O.R: Learning History
RPJMN, Renstra, Road Map, Ref-Birokr, dll
2007 2016
Intervensi: Isu Str’gis, PDBK, BOK

Kab. Sampang
Profil2010
Densus Profil2010
Densus Profil2010
Densus Gizburkur
Jumlah Ditimbang Gizburkur IPKM2007
84,115 84,125
53,537
67,300
1,431
12,100
26,075
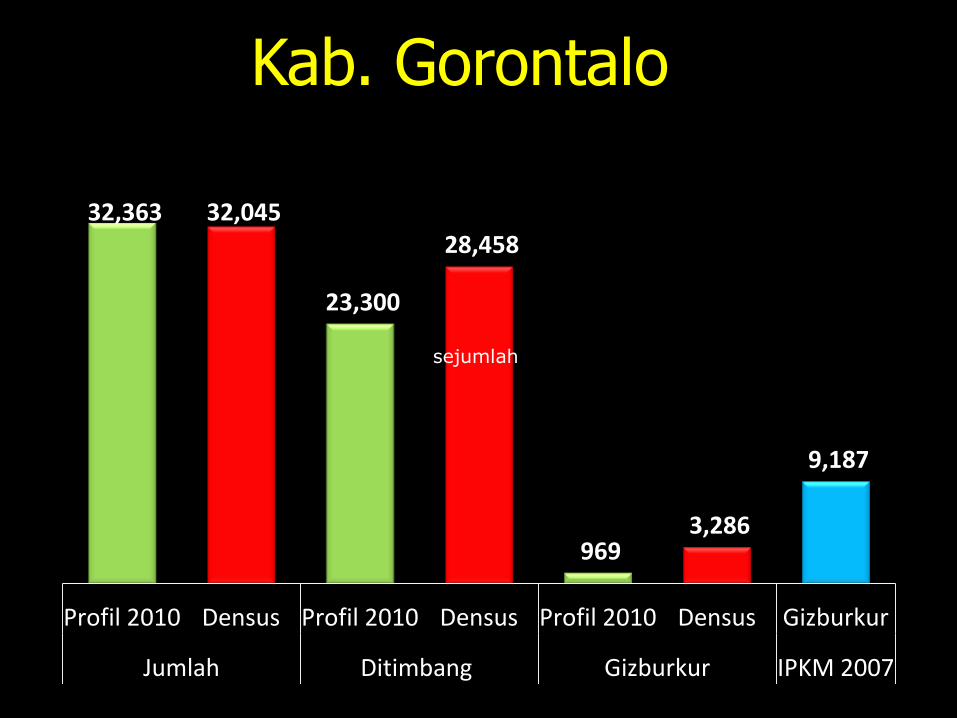
Kab. Gorontalo
32,363 32,045
23,300
28,458
969 3,286
9,187
Profil 2010 Densus Profil 2010 Densus Profil 2010 Densus Gizburkur
Jumlah Ditimbang Gizburkur IPKM 2007
sejumlah

Kab. Dompu
30,560
22,228
15,851
20,874
350
3,641
9,165
Profil 2009 Densus Profil 2009 Densus Profil 2009 Densus Gizburkur
Jumlah Ditimbang Gizburkur IPKM 2007

% D/S KLU 2011 vs 2012 (Jun)
0
10
20
30
40
50
60
70
80
90
100
KLU

0
20
40
60
80
100
2011 Januari Februari Maret April Mei Juni Target
KLU
PEMENANG + NIPAH
% D/S Rerata ‘11 & ‘12 (KLU

D/S KLU Jan-Juni 2012
0.0
10.0
20.0
30.0
40.0
50.0
60.0
70.0
80.0
90.0
Januari Februari Maret April MeiJuni
BAYANKAYANGANGANGGATANJUNGPEMENANG + NIPAHKLU

Fragmented: The Shift? • Health worker & Communities: ownership,
household production of health
• Fragmented, linier thinking: non health and communities left as target
• Focus on material
• Indicators as objective
• Lack of Interactions, skill.
• Teamwork, strategic leadership
• Deep learning – systems thinking
• Learning organization at all level

Material-Non Material: Shift?
• Health worker & Communities: ownership, household production of health
• Fragmented, linier thinking
• Focus on material
• Indicators as objective
• Interactions, skill.
• Teamwork, strategic leadership
• Deep learning – systems thinking
• Learning organization at all level

Challenges
• It tells us “WHAT
• It tells us “PROBLEM”
• But it does not tell us “HOW?
• Left us with:
‘ISSUES , UNCERTAINTIES, and ‘HOPES’
Action Non Material Approach


