
Reduce Cropping
Risks by Making the
Most of Seed Manitoba
Pam de Rocquigny Provincial Cereal Crops Specialist
Seed Manitoba Coordinator Manitoba Agriculture, Food & Rural Initiatives
Crops Knowledge Centre, Carman
Outline • Introduction
• Where Does the Information Come From?
• Reading the Tables
• Online Tools www.seedmb.ca
Seed Interactive (www.seedinteractive.ca)
• Summary & Questions

Sorting Through the Data
• Yield is based on the genetic potential and environmental conditions in which the crop is grown
• Farmers should select those varieties that perform well not only in their area but across experimental sites and years Use long-term, multi-site data to select the best, yield-stable
varieties
This will increase the likelihood that given next years environment (which cannot be controlled) the variety selected will perform well
• But don’t forget about the agronomic package maturity, standability, disease package

Data Provided by:
• MCVET – Manitoba Crop Variety Evaluation Team/Trials Spring Wheat, Winter Wheat, Barley, Oats, Flax, Peas, Industrial Hemp
• Commodity Groups Manitoba Pulse Growers Association
• Soybeans: Western MB Adaptation, Natto, Conventional & Roundup Ready
• Fababeans
• Field Beans: Western MB Adaptation & Wide Row
• Lentils
Canola Council of Canada - Canola Performance Trials
National Sunflower Association of Canada Inc.
Manitoba Corn Committee
Manitoba Forage Council

• 2011 Crop Testing Matrix
• > 8200 plots! • Spring wheat – 1053
• Oat – 468
• Barley – 957
• Soybean - >2300

July/August/September/October
• Plot Tours
• Harvest
• Samples cleaned, weighed and sub-sampled
• Samples sent for quality testing (protein, oil)
• Data sent to Craig Linde for data analysis
• Internal data review meeting
• MCVET team data review • Presentation of ANOVA tables, overall data summaries
• Accept/Reject data

Mid October - November • Data inputted into database (MCPIQ)
• Long term data averages → Commodity Specialists
• Commodity groups – their own process
• Tables created (& other info) → sent to FBC
• Proofing – 2nd week of November
• FBC inserts ads, etc & shipped to printers end of 3rd week of November
• First copies arrive the Friday before the launch

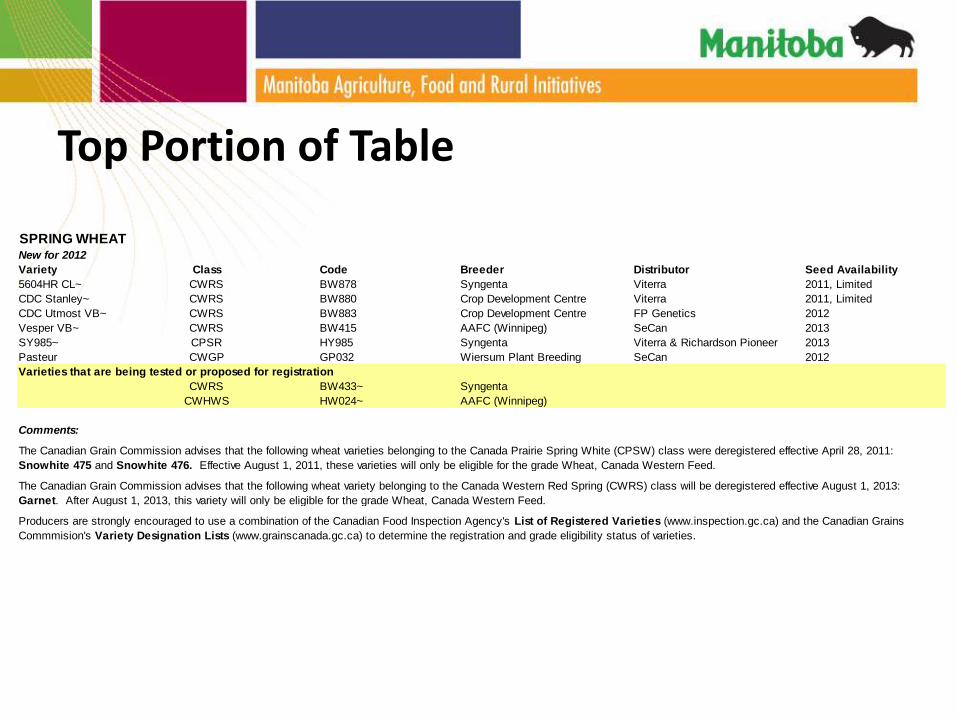
Top Portion of Table
SPRING WHEATNew for 2012
Variety Class Code Breeder Distributor Seed Availability
5604HR CL~ CWRS BW878 Syngenta Viterra 2011, Limited
CDC Stanley~ CWRS BW880 Crop Development Centre Viterra 2011, Limited
CDC Utmost VB~ CWRS BW883 Crop Development Centre FP Genetics 2012
Vesper VB~ CWRS BW415 AAFC (Winnipeg) SeCan 2013
SY985~ CPSR HY985 Syngenta Viterra & Richardson Pioneer 2013
Pasteur CWGP GP032 Wiersum Plant Breeding SeCan 2012
Varieties that are being tested or proposed for registration
CWRS BW433~ Syngenta
CWHWS HW024~ AAFC (Winnipeg)
Comments:
The Canadian Grain Commission advises that the following wheat varieties belonging to the Canada Prairie Spring White (CPSW) class were deregistered effective April 28, 2011:
Snowhite 475 and Snowhite 476. Effective August 1, 2011, these varieties will only be eligible for the grade Wheat, Canada Western Feed.
The Canadian Grain Commission advises that the following wheat variety belonging to the Canada Western Red Spring (CWRS) class will be deregistered effective August 1, 2013:
Garnet. After August 1, 2013, this variety will only be eligible for the grade Wheat, Canada Western Feed.
Producers are strongly encouraged to use a combination of the Canadian Food Inspection Agency's List of Registered Varieties (www.inspection.gc.ca) and the Canadian Grains
Commmision's Variety Designation Lists (www.grainscanada.gc.ca) to determine the registration and grade eligibility status of varieties.

Variety Description Table
Varieties that are being tested or proposed for registration
Canada Western Red Spring
BW433~ 100 10 0.5 2 1 Y G I S I R R MR
Canada Western Hard White Spring
HW024~ 92 9 -0.4 -2 0 N VG I MS MS I R MS
CHECK CHARACTERISTICS
AC Barrie 54 217 14.5% 99 37
bu/acre site years protein days inches
Yield Site Days to Fusarium2
% Years Protein Maturity Height Spike Loose Common Leaf1 Stem Leaf Head
Variety Check Tested +/- Check +/-Check +/-Check Awned Lodging Smut Bunt Spots Rust Rust Blight
Canada Western Red Spring (% of AC Barrie)
5602HR~ 111 89 0.3 1 0 Y F R MR I R R MR
5603HR~ 111 28 -0.2 2 0 Y G MS I MR MR R I
5604HR CL~ 108 27 0.1 -1 -1 Y G MS I MS R R I
AC Barrie~ 100 217 0 0 0 N G MR I MS MR MS I
AC Cadillac 105 41 - -1 3 N F R R I R MR I
AC Cora 99 37 - -2 2 N F MR R MR R R I
AC Domain 97 59 0.8 -2 -1 N VG R I S R I MS
AC Intrepid~ 105 34 - -4 -1 N G I R I MR MR MS
AC Splendor 88 33 - -5 0 N F I I I R MR MS
Alvena~ 104 30 0.2 -2 0 N G MR I - MR I MS
Carberry~ 105 27 0.2 2 -5 Y VG MR R MS MR R MR
CDC Abound~ 101 42 -0.2 2 -4 Y G I I MS R MS S
CDC Go 116 24 -0.3 -1 -2 Y G MS I S R I MS
CDC Imagine~ 103 39 0.5 0 -1 N G MR MR MS I I MS
CDC Kernen~ 105 15 0.5 1 1 Y G R I MS MR MR I
CDC Stanley~ 99 11 0.4 0 -1 N G MR S I R MR MS
Resistance Level:

Yield Comparison Table
Variety 2011 A
vera
ge
Yie
ld
Sit
e
Years
Teste
d
Arb
org
Beau
sejo
ur
Bo
issevain
Dau
ph
in
Ham
iota
Neep
aw
a
Ro
seb
an
k
So
uri
s
St.
Ad
olp
he
Sto
new
all
Th
orn
hil
l
Win
nip
eg
Bradley~ 105 13 89 118 124 101 106 98 126 101 92 104 118 98
CDC Big Brown~ 99 13 90 117 89 108 93 84 104 83 111 93 112 107
CDC Minstrel~ 111 13 111 127 123 108 95 95 111 97 109 108 136 109
CDC ProFi 97 11 88 116 119 95 89 80 98 81 83 101 120 -
CDC Seabiscuit~ 105 12 85 112 110 100 111 109 97 109 107 111 111 109
Furlong~ 100 2 - - - - - - - - - 107 - -
Leggett~ 100 13 100 100 100 100 100 100 100 100 100 100 100 100
Summit~ 111 13 108 97 147 97 118 104 116 100 102 102 165 101
Triactor~ 104 2 - - - - - - - - - 117 - -
Varieties that are being tested or proposed for registration
OT2069~ 104 12 97 107 98 112 100 104 93 112 112 108 103 106
CHECK YIELD Leggett (bu/ac) 137 100 96 145 160 90 131 108 130 72 134 119
CV % 4.1 4.6 4.7 5.4 4.9 4.1 5.0 3.4 4.2 4.9 9.1 5.7
LSD % 7 9 13 - 9 7 9 6 8 9 20 10
Sign Diff Yes Yes Yes No Yes Yes Yes Yes Yes Yes Yes Yes
2011 Yield: % of Leggett
106 – Why is that?
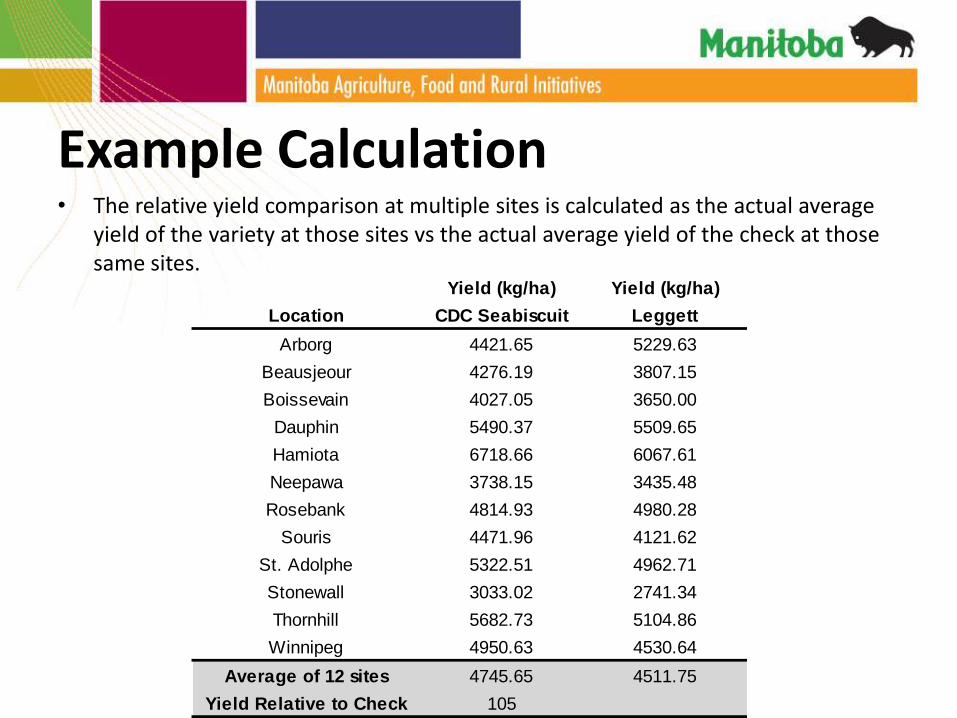
Example Calculation • The relative yield comparison at multiple sites is calculated as the actual average
yield of the variety at those sites vs the actual average yield of the check at those same sites.
Yield (kg/ha) Yield (kg/ha)
Location CDC Seabiscuit Leggett
Arborg 4421.65 5229.63
Beausjeour 4276.19 3807.15
Boissevain 4027.05 3650.00
Dauphin 5490.37 5509.65
Hamiota 6718.66 6067.61
Neepawa 3738.15 3435.48
Rosebank 4814.93 4980.28
Souris 4471.96 4121.62
St. Adolphe 5322.51 4962.71
Stonewall 3033.02 2741.34
Thornhill 5682.73 5104.86
Winnipeg 4950.63 4530.64
Average of 12 sites 4745.65 4511.75
Yield Relative to Check 105

Reading the 2011 Yield Results
• CV% = Cofficient of Variation measures amount of
variation caused by factors not uniform over an entire site (15%)
• Sign Diff = Significant Difference YES – variety yields at that
site are truly different NO – varieties all yielded
the same at that site
• LSD% = Least Significant Difference percentage the varieties
must differ by before their yields are significantly different
2011 Yield: % of Leggett
Variety 2011 A
vera
ge
Yie
ld
Sit
e
Years
Teste
d
Arb
org
Beau
sejo
ur
Bo
issevain
Dau
ph
in
Bradley~ 105 13 89 118 124 101
CDC Big Brown~ 99 13 90 117 89 108
CDC Minstrel~ 111 13 111 127 123 108
CDC ProFi 97 11 88 116 119 95
CDC Seabiscuit~ 105 12 85 112 110 100
Furlong~ 100 2 - - - -
Leggett~ 100 13 100 100 100 100
Summit~ 111 13 108 97 147 97
Triactor~ 104 2 - - - -
Varieties that are being tested or proposed for registration
OT2069~ 104 12 97 107 98 112
CHECK YIELD Leggett (bu/ac) 137 100 96 145
CV % 4.1 4.6 4.7 5.4
LSD % 7 9 13 -
Sign Diff Yes Yes Yes No

An Example 2011 Yield: % of CDC Falcon
Variety 2011 A
vera
ge
Yie
ld
Sit
e Y
ears
Teste
d
Arb
org
Bo
issevain
Canada Western Red Winter
CDC Buteo 95 6 102 101
CDC Falcon 100 6 100 100
Flourish~ 99 6 96 103
McClintock~ 98 6 102 99
Moats~ 102 6 104 97
Canada Western General Purpose
Accipiter~ 103 6 107 100
Broadview~ 106 6 107 111
CDC Ptarmigan 94 6 104 115
Peregrine~ 105 6 106 104
Sunrise 101 6 99 111
Varieties that are being tested or proposed for registration
Canada Western Red Winter
DH00W31N*34 106 6 106 87
Canada Western General Purpose
DH99W18I*45 110 6 100 90
DH99W19H*16 102 6 110 109
CHECK YIELD CDC Falcon (bu/ac) 68 61
CV % 6.1 4.8
LSD % - 12
Sign Diff No Yes
100 + 12 = 112
100 – 12 = 88
97 + 12 = 109
97 – 12 = 85
Comparing to CDC Falcon:
Comparing to Moats:

Caution in Using One Year of Data
Variety 2011 A
vera
ge
Yie
ld
Sit
e Y
ears
Teste
d
Arb
org
Beau
sejo
ur
Bo
issevain
Dau
ph
in
Ham
iota
Ro
seb
an
k
So
uri
s
St.
Ad
olp
he
Sto
new
all
Th
orn
hil
l
Canada Western Red Spring
5604HR CL~ 103 11 81 103 145 109 92 104 107 87 90 118
AC Barrie~ 100 11 100 100 100 100 100 100 100 100 100 100
Carberry~ 103 11 101 127 154 105 79 99 84 106 92 104
CDC Kernen~ 101 11 91 104 123 90 101 97 127 109 92 107
CDC Stanley~ 99 11 85 104 103 98 92 101 109 101 98 110
CDC Thrive~ 101 11 91 104 123 90 101 97 127 109 92 107
CDC Utmost VB~ 111 11 85 111 184 108 121 106 130 106 104 107
Glenn~ 115 2 - - - - - - - - 99 -
Goodeve VB~ 106 11 115 107 175 91 98 94 108 87 89 125
KANE~ 101 11 83 111 133 107 90 94 108 91 86 117
Muchmore~ 106 11 93 126 121 112 82 102 80 104 99 131
Shaw VB~ 109 11 102 110 165 103 110 103 113 109 99 118
Stettler~ 99 11 100 111 103 105 95 86 87 102 94 114
Unity VB~ 112 11 103 105 186 109 106 108 136 103 101 117
Vesper VB~ 119 11 106 117 195 109 116 128 130 112 102 116
WR859 CL~ 103 11 88 114 157 103 83 104 91 106 94 109
2011 Yield: % of AC Barrie
CHECK YIELD AC Barrie (bu/ac) 61 60 22 71 57 49 38 44 61 60
CV% 10.1 3.0 8.2 3.7 7.8 5.4 7.9 6.6 3.9 8.6
LSD% 17 6 20 7 13 9 14 12 6 16
Sign Diff Yes Yes Yes Yes Yes Yes Yes Yes Yes Yes

If We Take a Closer Look
• CV
• Check Yield – 22bu/ac
• 95% increase = 43 bu/ac
Variety 2011 A
vera
ge
Yie
ld
Sit
e Y
ears
Teste
d
Canada Western Red Spring
5604HR CL~ 103 11
AC Barrie~ 100 11
Carberry~ 103 11
CDC Kernen~ 101 11
CDC Stanley~ 99 11
CDC Thrive~ 101 11
CDC Utmost VB~ 111 11
Glenn~ 115 2
Goodeve VB~ 106 11
KANE~ 101 11
Muchmore~ 106 11
Shaw VB~ 109 11
Stettler~ 99 11
Unity VB~ 112 11
Vesper VB~ 119 11
WR859 CL~ 103 11
CHECK YIELD AC Barrie (bu/ac)
CV%
LSD%
Sign Diff
Bo
issevain
145
100
154
123
103
123
184
-
175
133
121
165
103
186
195
157
22
8.2
20
Yes

Protein Comparison Table
Variety 2011 A
vera
ge %
Pro
tein
Sit
e Y
ears
Teste
d
Arb
org
Bo
issevain
Carm
an
Ro
bli
n
Sto
new
all
Win
nip
eg
Canada Western Red Winter
CDC Buteo 10.9 6 10.0 12.0 12.4 11.4 11.1 8.4
CDC Falcon 11.1 6 10.1 11.9 12.4 11.8 11.4 8.9
Flourish~ 11.3 6 10.1 12.4 12.6 11.8 11.5 9.3
McClintock~ 11.5 6 9.8 13.1 13.2 11.6 11.6 9.9
Moats~ 11.5 6 9.8 12.5 13.1 12.0 12.1 9.7
Canada Western General Purpose
Accipiter~ 10.8 6 9.3 11.8 12.3 11.4 11.4 8.7
Broadview~ 10.6 6 9.6 11.7 11.9 11.3 10.7 8.3
CDC Ptarmigan 9.3 6 7.7 10.8 10.1 9.8 9.5 7.6
Peregrine~ 10.8 6 9.9 12.3 12.3 10.9 11.1 8.5
Sunrise 10.2 6 8.6 11.7 10.7 11.3 10.8 8.1
Varieties that are being tested or proposed for registration
Canada Western Red Winter
DH00W31N*34 11.2 6 9.7 12.2 13.0 11.8 11.7 8.8
Canada Western General Purpose
DH99W18I*45 11.1 6 10.3 11.8 12.2 11.9 11.5 9.1
DH99W19H*16 11.2 6 9.8 12.7 12.2 12.3 11.6 8.3
2011 % Protein

Commodity Editors:
• Pam de Rocquigny – Cereals, Corn • Tel: 745.5676
• Email: [email protected]
• Anastasia Kubinec – Canola, Flax, Mustard • Email: [email protected]
• Dennis Lange – Soybeans, Edible Beans, Field Peas • Email: [email protected]
• Glenn Friesen – Forages • Email: [email protected]
• Patti Cuthbert – MCVET Coordinator • Email: [email protected]

www.seedmb.ca


Now Available!!
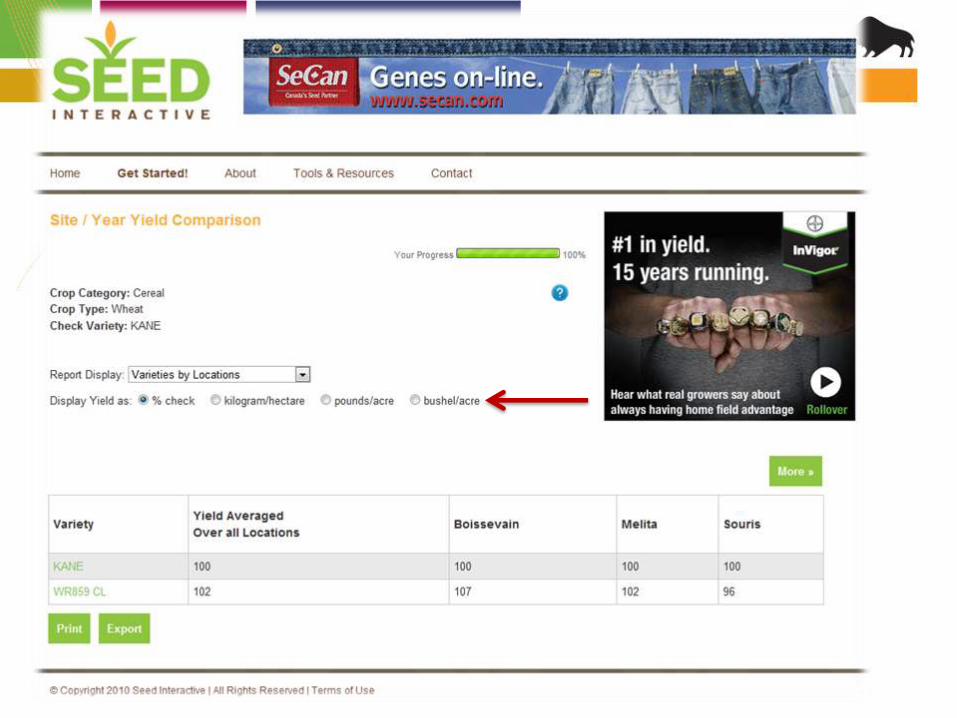
www.seedinteractive.ca • SEED INTERACTIVE was created to improve Manitoba’s grain
producers’ competitive ability by providing them an online decision tool to help make variety choices for their farms.
• The biggest advantage of SEED INTERACTIVE is it allows producers to tailor output taking into consideration their own agronomic and management requirements.


→ Most Commonly
Grown category will
give you the largest
dataset which
increases the
reliability of the
generated report

→ Ability to
compare multiple
varieties


→ Ability to only
compare two
varieties


Summary
• Suite of tools available to producers • Seed Manitoba guide
• www.seedmb.ca
• Seed Interactive
• Multi-site data important for yield evaluations
• Agronomics & end market
• Improved variety selection can reduce cropping risks increasing productivity & profitability

Questions?
Pam de Rocquigny Provincial Cereal Crops Specialist
Manitoba Agriculture, Food & Rural Initiatives
204.745.5676


