Quelle/Publication:
Ausgabe/Issue:
Seite/Page:
European Coatings Journal
11/2003
14
Real-time UV cure monitoring
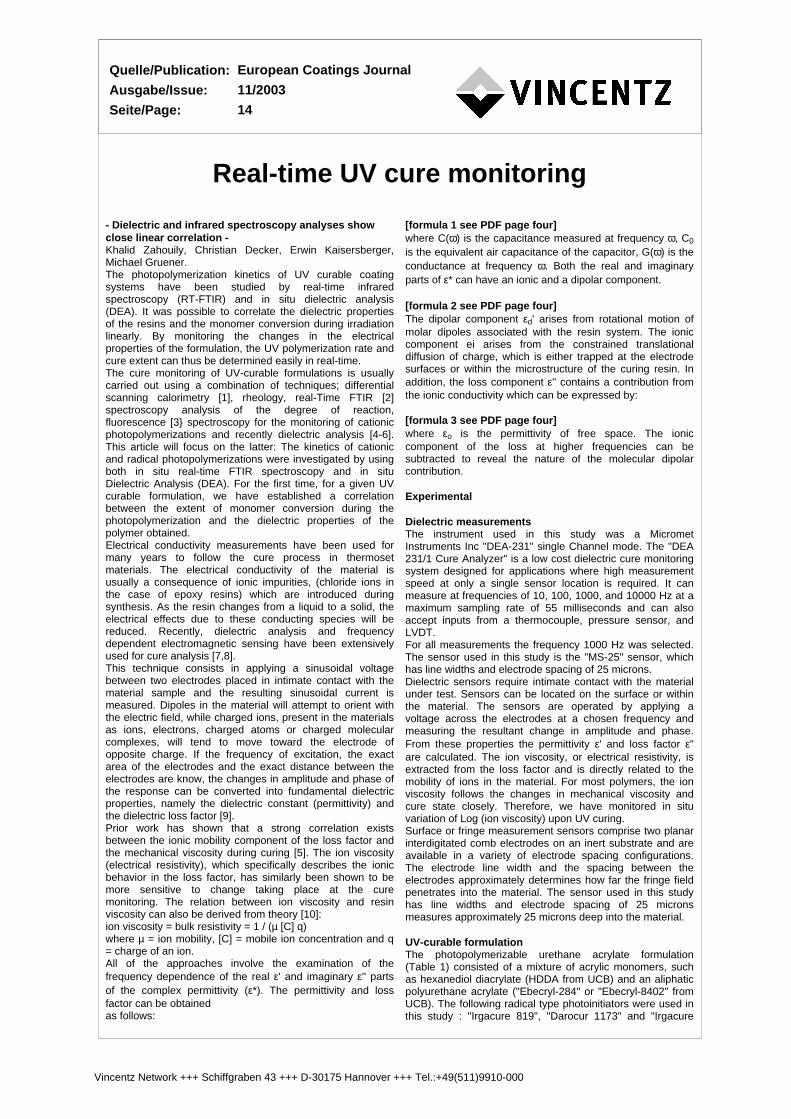
- Dielectric and infrared spectroscopy analyses showclose linear correlation -Khalid Zahouily, Christian Decker, Erwin Kaisersberger,Michael Gruener.The photopolymerization kinetics of UV curable coatingsystems have been studied by real-time infraredspectroscopy (RT-FTIR) and in situ dielectric analysis(DEA). It was possible to correlate the dielectric propertiesof the resins and the monomer conversion during irradiationlinearly. By monitoring the changes in the electricalproperties of the formulation, the UV polymerization rate andcure extent can thus be determined easily in real-time.The cure monitoring of UV-curable formulations is usuallycarried out using a combination of techniques; differentialscanning calorimetry [1], rheology, real-Time FTIR [2]spectroscopy analysis of the degree of reaction,fluorescence [3} spectroscopy for the monitoring of cationicphotopolymerizations and recently dielectric analysis [4-6].This article will focus on the latter: The kinetics of cationicand radical photopolymerizations were investigated by usingboth in situ real-time FTIR spectroscopy and in situDielectric Analysis (DEA). For the first time, for a given UVcurable formulation, we have established a correlationbetween the extent of monomer conversion during thephotopolymerization and the dielectric properties of thepolymer obtained.Electrical conductivity measurements have been used formany years to follow the cure process in thermosetmaterials. The electrical conductivity of the material isusually a consequence of ionic impurities, (chloride ions inthe case of epoxy resins) which are introduced duringsynthesis. As the resin changes from a liquid to a solid, theelectrical effects due to these conducting species will bereduced. Recently, dielectric analysis and frequencydependent electromagnetic sensing have been extensivelyused for cure analysis [7,8].This technique consists in applying a sinusoidal voltagebetween two electrodes placed in intimate contact with thematerial sample and the resulting sinusoidal current ismeasured. Dipoles in the material will attempt to orient withthe electric field, while charged ions, present in the materialsas ions, electrons, charged atoms or charged molecularcomplexes, will tend to move toward the electrode ofopposite charge. If the frequency of excitation, the exactarea of the electrodes and the exact distance between theelectrodes are know, the changes in amplitude and phase ofthe response can be converted into fundamental dielectricproperties, namely the dielectric constant (permittivity) andthe dielectric loss factor [9].Prior work has shown that a strong correlation existsbetween the ionic mobility component of the loss factor andthe mechanical viscosity during curing [5]. The ion viscosity(electrical resistivity), which specifically describes the ionicbehavior in the loss factor, has similarly been shown to bemore sensitive to change taking place at the curemonitoring. The relation between ion viscosity and resinviscosity can also be derived from theory [10]:ion viscosity = bulk resistivity = 1 / (µ [C] q)where µ = ion mobility, [C] = mobile ion concentration and q= charge of an ion.All of the approaches involve the examination of thefrequency dependence of the real ε' and imaginary ε'' partsof the complex permittivity (ε*). The permittivity and lossfactor can be obtainedas follows:
[formula 1 see PDF page four]where C(ω) is the capacitance measured at frequency ω, C0
is the equivalent air capacitance of the capacitor, G(ω) is theconductance at frequency ω. Both the real and imaginaryparts of ε* can have an ionic and a dipolar component.
[formula 2 see PDF page four]The dipolar component εd' arises from rotational motion ofmolar dipoles associated with the resin system. The ioniccomponent ei arises from the constrained translationaldiffusion of charge, which is either trapped at the electrodesurfaces or within the microstructure of the curing resin. Inaddition, the loss component ε'' contains a contribution fromthe ionic conductivity which can be expressed by:
[formula 3 see PDF page four]where εo is the permittivity of free space. The ioniccomponent of the loss at higher frequencies can besubtracted to reveal the nature of the molecular dipolarcontribution.
Experimental
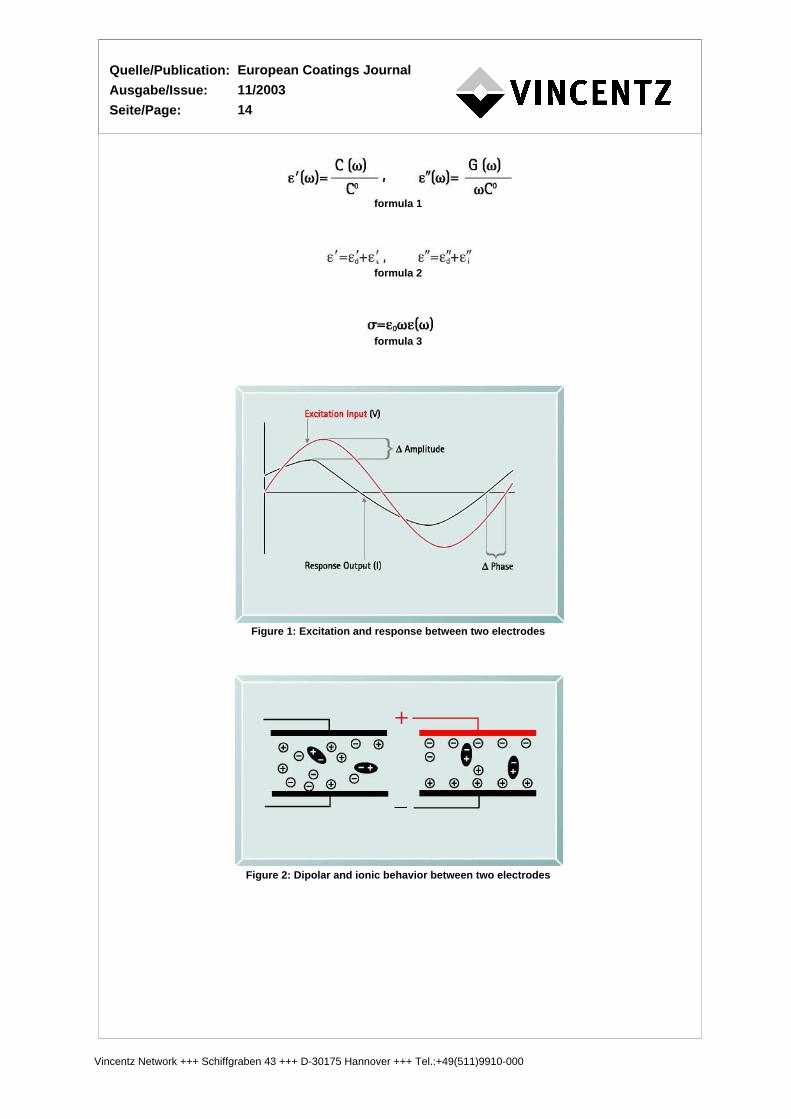
Dielectric measurementsThe instrument used in this study was a MicrometInstruments Inc "DEA-231" single Channel mode. The "DEA231/1 Cure Analyzer" is a low cost dielectric cure monitoringsystem designed for applications where high measurementspeed at only a single sensor location is required. It canmeasure at frequencies of 10, 100, 1000, and 10000 Hz at amaximum sampling rate of 55 milliseconds and can alsoaccept inputs from a thermocouple, pressure sensor, andLVDT.For all measurements the frequency 1000 Hz was selected.The sensor used in this study is the "MS-25" sensor, whichhas line widths and electrode spacing of 25 microns.Dielectric sensors require intimate contact with the materialunder test. Sensors can be located on the surface or withinthe material. The sensors are operated by applying avoltage across the electrodes at a chosen frequency andmeasuring the resultant change in amplitude and phase.From these properties the permittivity ε' and loss factor ε"are calculated. The ion viscosity, or electrical resistivity, isextracted from the loss factor and is directly related to themobility of ions in the material. For most polymers, the ionviscosity follows the changes in mechanical viscosity andcure state closely. Therefore, we have monitored in situvariation of Log (ion viscosity) upon UV curing.Surface or fringe measurement sensors comprise two planarinterdigitated comb electrodes on an inert substrate and areavailable in a variety of electrode spacing configurations.The electrode line width and the spacing between theelectrodes approximately determines how far the fringe fieldpenetrates into the material. The sensor used in this studyhas line widths and electrode spacing of 25 micronsmeasures approximately 25 microns deep into the material.
UV-curable formulationThe photopolymerizable urethane acrylate formulation(Table 1) consisted of a mixture of acrylic monomers, suchas hexanediol diacrylate (HDDA from UCB) and an aliphaticpolyurethane acrylate ("Ebecryl-284" or "Ebecryl-8402" fromUCB). The following radical type photoinitiators were used inthis study : "Irgacure 819", "Darocur 1173" and "Irgacure
Vincentz Network +++ Schiffgraben 43 +++ D-30175 Hannover +++ Tel.:+49(511)9910-000

Quelle/Publication:
Ausgabe/Issue:
Seite/Page:
European Coatings Journal
11/2003
14
651" from Ciba SC, at typical concentrations of 1 wt%, 2wt%, and 2 wt% , respectively.The cationic UV curable formulation consisted of a mixtureof a "Cyracure" cycloaliphatic epoxy resin ("UVR-6105") andan aryl sulfonium salt photoinitiator ("UVI-6976"), both fromDow Chemical. The cationic photoinitiator was used attypical concentrations of 2%.
IrradiationThe UV-curable formulation was applied onto a sensor, or aBaF2 crystal with a calibrated coater bar to obtain a layerwith a typical thickness of 30µm. It was exposed for a shorttime to the radiation of a minicure lamp from EFOS, the UVlight intensity at the sample position being set at 300 mW cm-2. The light intensity at the sample position was measuredby radiometry (international light IL-390). All experimentswere performed at ambient temperature in the presence ofair.The extent of the polymerization reaction upon UV exposurewas evaluated quantitatively by Real-Time FTIR infraredspectroscopy [2,11], by following the decrease of the IRband at 810 cm-1, which is characteristic of the acrylatedouble bond, or at 790 cm-1, which is characteristic of theepoxy group, in case of the cationic formulation. Thisanalytical method permits to determine the final conversion,and thus the amount of residual unsaturation in theUV-cured resin.
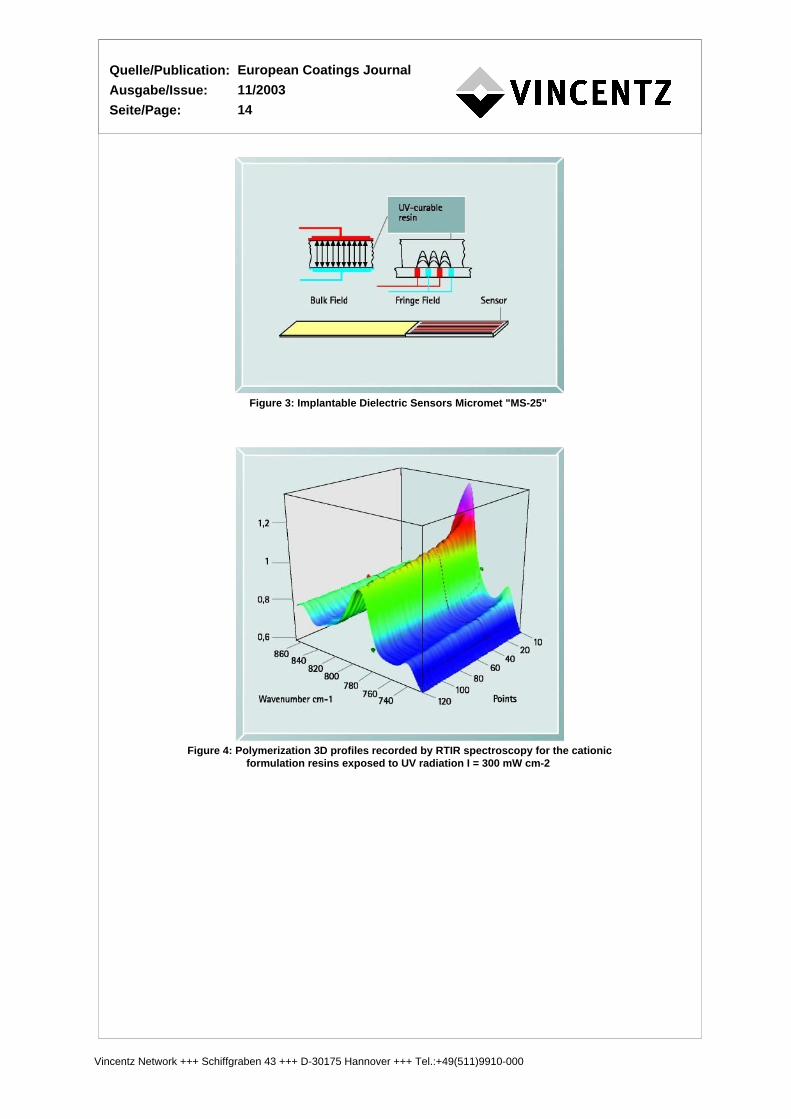
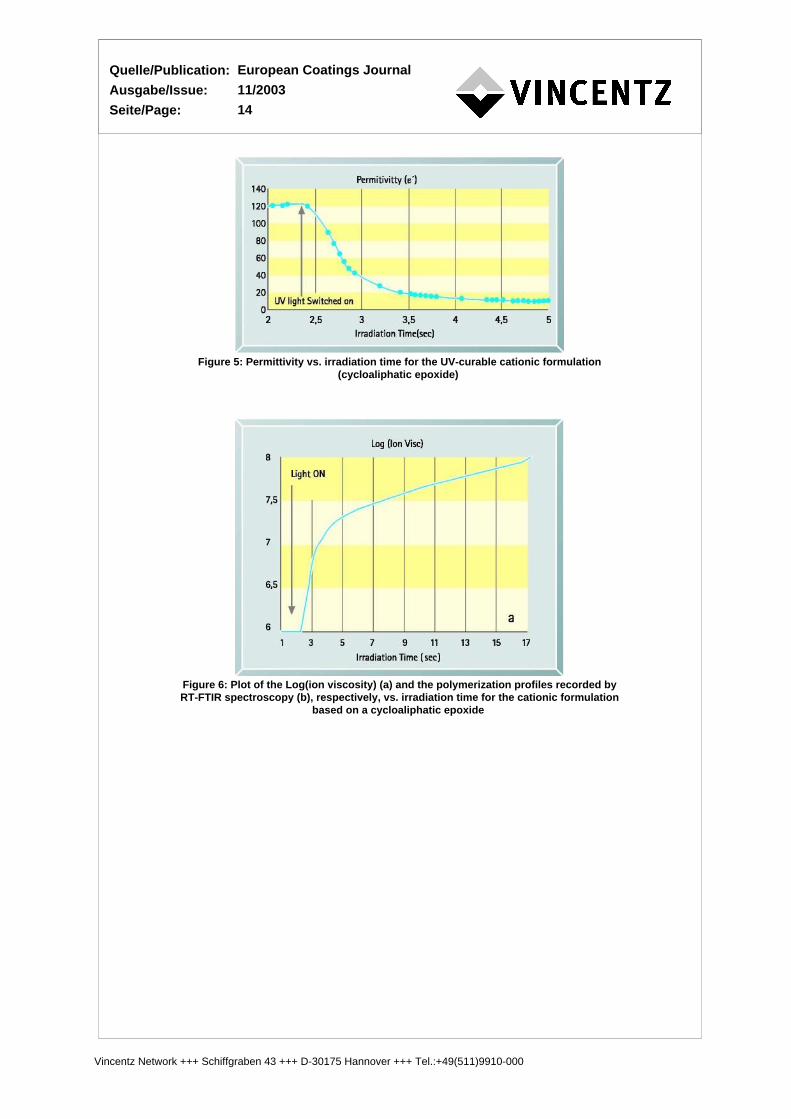
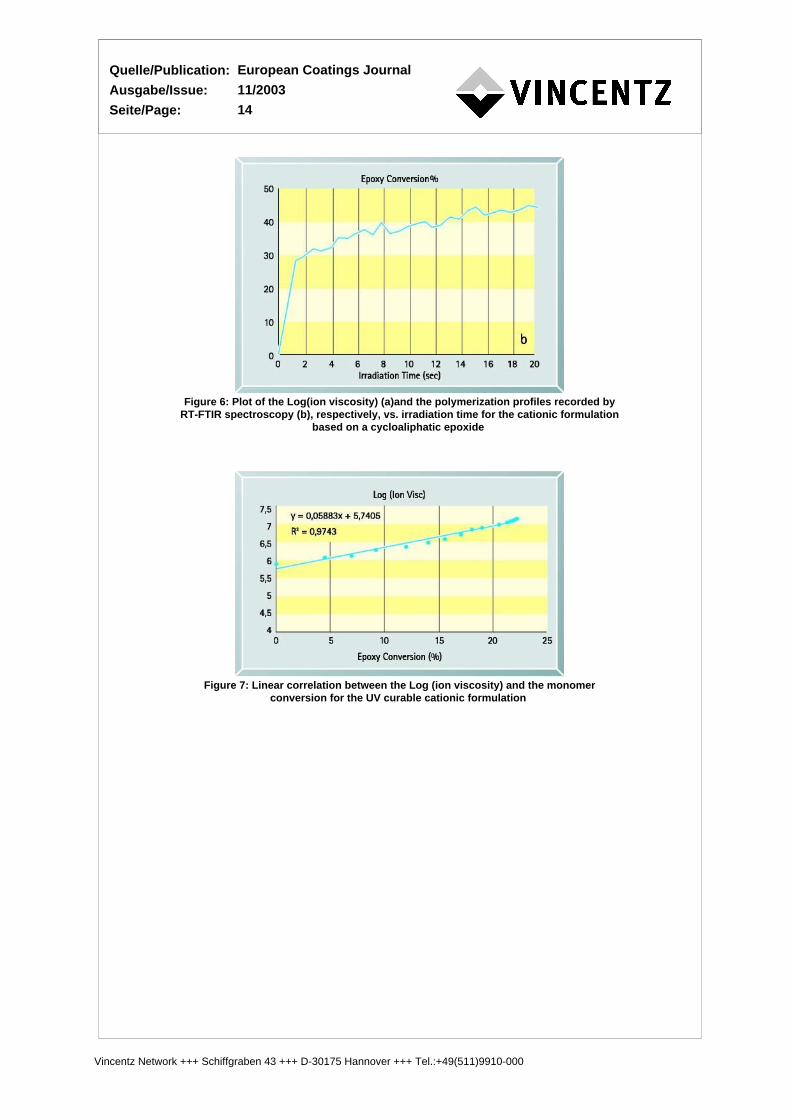
Data collection every 50 millisecondsFigure 5 shows an example of a typical decrease of thepermittivity e'(w) at 1000 Hz upon UV irradiation of theUV-cationic formulation film (thickness 24 µm). As thepolymerization proceeds, the resin viscosity increases,affecting the ionic motion. It is important to note thatdielectric measurements retain sensitivity also, when ionand physical viscosity deviate. Consequently, with properinterpretation, dielectric measurements are useful during theentire curing process, in order to determine changes inviscosity and rigidity, and they are extremely sensitive indetermining the end of cure. This example shows that wecan follow the photopolymerization reaction with ahigh-resolution data collection every 50 milliseconds.In the following, we will focus our study only on the Log(ionviscosity), which completely describes all dielectricproperties of our obtained UV curable polymer materials.Figure 6a shows the Log(ion viscosity) data during the cureof an UV-curable sample. As the irradiation time increases,the photochemical reaction is initiated (causing decreasedion mobility due to crosslinking) and the reaction competeswith the exothermic temperature effect. This results in ionviscosity followed by a rapid increase in viscosity as reactionbegins to dominate. Gradually, as the reaction slows down,the rate of increase in ion viscosity also slows; showing thecure is near completion. As cure proceeds, the physicalnature of the UV curable mixture changes from a Newtonianfluid to a gel and finally a glassy solid [12]. Gelationcorresponds to the point at which an infinite network isformed, while the vitrification is the point at which the chainsbecome closely packed and there is insufficient volume forco-operative motion to occur. At vitrification, the materialchanges from a rubber to a glass and the reaction iseffectively quenched (for reactions where intramolecularreactions are not important).We notice the same tendency for both the curvesrepresenting the Log(Ion viscosity) and the epoxyconversion, measured by FTIR (Figure 6 a and b,respectively).
Dielectric measurements allow to calculate the degree
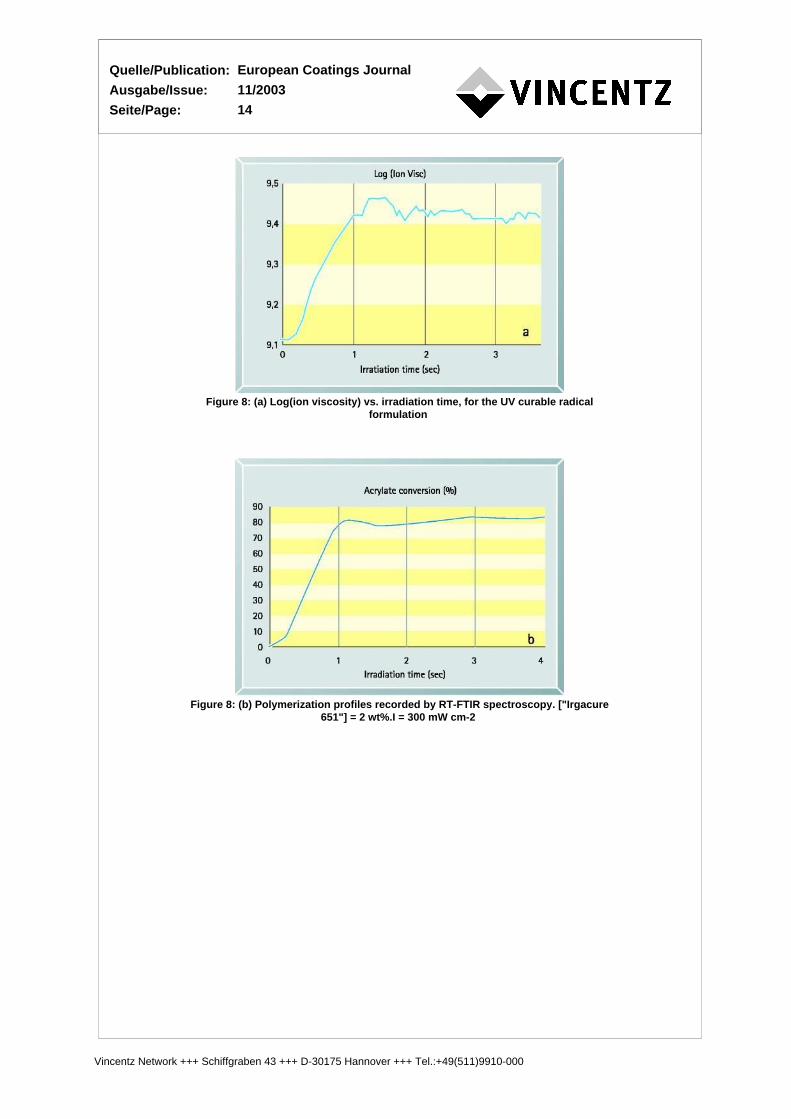
of cureFigure 7 shows a linear variation correlation of the Log(ionviscosity) and the epoxy conversion. Thus, with the dielectricmeasurements, we can easily calculate the extent of cure.Hence, this technique could supply to the manufacturersand industries that use the UV-curing technology a reliableand fast method for the online process control of the curingof UV curable coatings and materials.The same trend was observed for the UV curable radicaltype acrylate resin. A linear correlation was found againbetween the Log(ion viscosity) and the degree of cure of theacrylate monomer monitored by real time IR spectroscopy(Figures 8 a and b, and Figure 9).
ConclusionDielectric analysis has become an effective instrumentalmethod for monitoring a variety of polymer resin processingproperties. This is because the dielectric properties aresensitive to the changes of resin properties linked to themobility of the polymer molecules. A linear correlation wasfound between the dielectric loss factor and acrylate orepoxy monomer conversion for radical or cationicphotopolymerization reactions. By this technique, for thesame sample, other properties can also be monitored inon-line processing, such as the diffusion properties incoating films and the effect of moisture, temperature,viscosity, Tg or shrinkage. DEA measurements areespecially attractive because it has the potential of providingfundamental information on the curing processes and canbe performed on-line in UV-curing industrial applications.
References[1] Kloosterboer, J.G. Adv. Polym. Sci. 1988, 84, p. 1.[2] C.Decker, K. Moussa, Macromolek. 189(1988) p. 2381.[3] E.W. Nelson, T.P. Carter and A.B. Scranton,Macromolecules, 27 (1994), p. 1013.[4] Day, D, Rand D., Shepard, D., Proceedings of the 16thNATAS Conference, 1987, p. 52[5] Gotro, J.,Proceeding of the NATAS 19thconference,1990, p. 523.[6] N.T. Smith, T.F. O'Malley, Micromet report N° RP113[7] Kranbuehl D.E. In: Lee S.M. (ed.), Cure monitoring.Encyclopaedia of composites, New York. VCH 1989. p. 531.[8] Kranbuehl D.E. In: Lee S.M. (ed.), Flow and cure ofpolymers-measurement and control. Shawbury, UK: RAPRATechnology; 1990.[9] N.T. Smith and A.D. Shepard, Sensors, October 1995[10] R. A. Pethrick, D. Hayward , Prog. Polym. Sci. 27(2002) p. 1983.[11] Decker, C.; Moussa, K. J., Coatings Tech. 62 (1990), p.55.[12] Mijovic J, Kenny J, Maffezzoli A, Trivisano A, Bellucci F,Nicolais L,. Compos Sci Technol 49 (1993), p. 277.
The authors:-> Dr Khalid Zahouily received his Doctorate at theUniversity of Haute Alsace (Mulhouse, France) in 1992, andsince then has been working in the departement ofPolymers and Photochemistry there. In 2001 he foundedPhoto 'n Polymers Experts, a company specializing in R&Dof Photopolymer Materials, particularly for UV-curingtechnologies.-> Professor Christian Decker is head of the Photochemistryof Polymers laboratory at the National Center for ScientificResearch (CNRS) in Mulhouse, France.-> Erwin Kaisersberger graduated in Physics fromLudwig-Maximilian-University of Munich, Germany. Hejoined NetzschGerätebau GmbH in Selb, Germany, in 1973,where he is now Sales and Applications Support Manager,
Vincentz Network +++ Schiffgraben 43 +++ D-30175 Hannover +++ Tel.:+49(511)9910-000

Quelle/Publication:
Ausgabe/Issue:
Seite/Page:
European Coatings Journal
11/2003
14
specialised in applications of thermal analysis on polymers,high tech ceramics, superconductors, and coupled methodsfor gas analysis by Fourier-transform infrared spectroscopyand mass spectrometry.-> Michael Gruener graduated in Physics fromFriedrich-Schiller-University in Jena, Germany, and joinedNetzsch Gerätebau in 1990. Today, he is sales manager forSouth-West Germany.
Vincentz Network +++ Schiffgraben 43 +++ D-30175 Hannover +++ Tel.:+49(511)9910-000
Quelle/Publication:
Ausgabe/Issue:
Seite/Page:
European Coatings Journal
11/2003
14
formula 1.
formula 2.
formula 3.
Figure 1: Excitation and response between two electrodes.
Figure 2: Dipolar and ionic behavior between two electrodes.
Vincentz Network +++ Schiffgraben 43 +++ D-30175 Hannover +++ Tel.:+49(511)9910-000
Quelle/Publication:
Ausgabe/Issue:
Seite/Page:
European Coatings Journal
11/2003
14
Figure 3: Implantable Dielectric Sensors Micromet "MS-25".
Figure 4: Polymerization 3D profiles recorded by RTIR spectroscopy for the cationicformulation resins exposed to UV radiation I = 300 mW cm-2.
Vincentz Network +++ Schiffgraben 43 +++ D-30175 Hannover +++ Tel.:+49(511)9910-000
Quelle/Publication:
Ausgabe/Issue:
Seite/Page:
European Coatings Journal
11/2003
14
Figure 5: Permittivity vs. irradiation time for the UV-curable cationic formulation(cycloaliphatic epoxide).
Figure 6: Plot of the Log(ion viscosity) (a) and the polymerization profiles recorded byRT-FTIR spectroscopy (b), respectively, vs. irradiation time for the cationic formulation
based on a cycloaliphatic epoxide.
Vincentz Network +++ Schiffgraben 43 +++ D-30175 Hannover +++ Tel.:+49(511)9910-000
Quelle/Publication:
Ausgabe/Issue:
Seite/Page:
European Coatings Journal
11/2003
14
Figure 6: Plot of the Log(ion viscosity) (a)and the polymerization profiles recorded byRT-FTIR spectroscopy (b), respectively, vs. irradiation time for the cationic formulation
based on a cycloaliphatic epoxide.
Figure 7: Linear correlation between the Log (ion viscosity) and the monomerconversion for the UV curable cationic formulation.
Vincentz Network +++ Schiffgraben 43 +++ D-30175 Hannover +++ Tel.:+49(511)9910-000
Quelle/Publication:
Ausgabe/Issue:
Seite/Page:
European Coatings Journal
11/2003
14
Figure 8: (a) Log(ion viscosity) vs. irradiation time, for the UV curable radicalformulation.
Figure 8: (b) Polymerization profiles recorded by RT-FTIR spectroscopy. ["Irgacure651"] = 2 wt%.I = 300 mW cm-2.
Vincentz Network +++ Schiffgraben 43 +++ D-30175 Hannover +++ Tel.:+49(511)9910-000

Quelle/Publication:
Ausgabe/Issue:
Seite/Page:
European Coatings Journal
11/2003
14
Figure 9: Linear correlation between the Log (Ion Viscosity) and the monomerconversion for the UV curable acrylate resin .
Vincentz Network +++ Schiffgraben 43 +++ D-30175 Hannover +++ Tel.:+49(511)9910-000

Quelle/Publication:
Ausgabe/Issue:
Seite/Page:
European Coatings Journal
11/2003
14
.
Vincentz Network +++ Schiffgraben 43 +++ D-30175 Hannover +++ Tel.:+49(511)9910-000


