
REACTION-DIFFUSION MODELLING: QUANTITATIVE STUDY OF
GEOMETRY-ACTIVITY RELATIONSHIP OF FINNED ZEOLITE CATALYST
& MODEL STUDY OF MAXWELL-STEFAN FORMUALATION WITH
DIFFERENT ADSORPTION MECHANISMS
By
YILIN YANG
A thesis submitted to Johns Hopkins University in conformity with the requirements for the degree of
Master of Science in Engineering
Baltimore, Maryland
May,2021

ii
Abstract
The improved catalytic performance of nano-sized zeolite with considerably reduced internal
diffusion limitation has stimulated the research on the synthesis of new structure/geometry of
catalyst for industry application. In 2020, Rimer’s group developed a new finned zeolite catalyst
with significant reduced internal diffusion limitation by epitaxial growth of finned like
protrusion.[4] The first chapter of this thesis focusses on the simulation of the effect of geometry
of this finned zeolite on selectivity and diffusion limitation. A reaction-diffusion mathematical
model is built to examine the geometry-selectivity relationship via simulation of two parallel liquid
phase reactions (self-etherification and alkylation). Finned catalysts with four different geometries
are chosen and compared with conventional sphere catalyst of similar size.
The second chapter of this thesis is about the modelling of zeolite catalyzed reaction, adsorption,
and diffusion inside the zeolite crystal via using Stefan-maxwell and Langmuir-Hinshelwood
formulation. Two mostly common adsorption approach, multicomponent Langmuir isotherm
(MCL) and Ideal adsorption solution theory (IAST) are applied in the model. By simulating gas
n-Hexane isomerization reaction in MFI zeolite, the difference of reaction-diffusion models with
IAST model and MCL model is shown. The simulation results are compared with results reference
papers.[20][21]
Advisor: Dr. Michael Tsapatsis
Reader: Dr. Chao Wang

iii
Acknowledgement
I would like to express thankfulness to my research advisor Dr.Michael Tsapatsis for his
patience and thoughtful guidance in my research. During my one year’s master research,
Dr.Tsapatsis taught me from the very beginning stage and provided me all ability needed to be a
qualified researcher. It is my honor to have Dr Tsapatsis to be my advisor.
I also want to thank Dr.Dandan Xu for her assistance on understanding of reference papers
and terminologies. I want to thank Dr. Zhe Li for his spiritual encouragement and persuasion all
the time.

iv
Contents
Abstract ......................................................................................................................................................... ii
Acknowledgement ....................................................................................................................................... iii
List of Tables ................................................................................................................................................ v
List of Figures .............................................................................................................................................. vi
Chapter 1 ....................................................................................................................................................... 1
Introduction ............................................................................................................................................... 1
Modeling ................................................................................................................................................... 3
Result and discussion ................................................................................................................................ 7
Conclusion .............................................................................................................................................. 12
Chapter 2 ..................................................................................................................................................... 13
Introduction ............................................................................................................................................. 13
Modelling ................................................................................................................................................ 17
Simulation result ..................................................................................................................................... 20
Conclusion .............................................................................................................................................. 22
Supplementary material .............................................................................................................................. 23

v
List of Tables
Table 1 the parameters of self-etherification and alkylation ......................................................................... 4
Table 2 geometries, external acid site faction & surface areas of finned catalysts ....................................... 6
Table 3 parameters for MCL-LH model ................................................ Error! Bookmark not defined.18
Table 4 Dual-site Langmuir parameters for nC6 and 2DMB ..................................................................... 27
Table S1 simulation results for finned catalyst .......................................................................................... 27
Table S2 comparations between finned and sphere catalysts with α=50nm β=500nm............................... 27
Table S3 comparations between finned and sphere catalyst with α=35nm β=390nm ................................ 27
Table S4 comparations between finned and sphere catalyst with α=35nm β=250nm ................................ 27

vi
List of Figures
Figure 1 Idealized schematic of a finned zeolite and Transmission electron micrograph of a representative
finned ZSM-11 crystal ................................................................................................................................... i
Figure 2 the mechanisms for benzyl alcohol etherification (left) and alkylation (right) reactions in liquid
phase ............................................................................................................................................................. v
Figure 3 the geometry of catalyst in the simulation, with fin dimensions , interior dimension , and fin
pitch ............................................................................................................................................................ 1
Figure 4 the fin region for validity test (blue region in left figure) and concentration profile (the right figure)
at 1:10 aspect ratio ........................................................................................................................................ 1
FIgure 5 the comparation between analytical solution and numerical solution at aspect ratios from 1 to 100
...................................................................................................................................................................... 1
Figure 6 comparations between four finned catalysts ................................................................................... 3
Figure 7 comparations between finned and sphere catalyst with α=50nm β=500nm ................................... 6
Figure 8 comparations between finned and sphere catalyst with α=35nm β=250nm ................................. 13
Figure 9 comparations between finned and sphere catalyst with α=25nm β=250nm ................................. 13
Figure 10 selectivity as a function of external acid site fraction fext and the effectiveness factor ηm ........ 13
Figure 11 Effectiveness vs Thiele modulus ................................................................................................ 13

1
Chapter 1
Introduction
The well-defined channel framework of zeolite has been applied to many industry applications from
catalyst, adsorbent to selective separation. One of objective for zeolite design is to reduce diffusion
limitation and increase accessibility of acid site via increasing mesopores and micropores, therefore
enhance selectivity, activity, and reduce accumulation of coke species. Recently, Multiple literature have
revealed that,[1] [2] Nano-sized zeolite crystal, like self-pillared zeolite and 2-dimensional zeolite, have
shown better selectivity and longer lifetime compared to conventional zeolite. [3] Nano-sized crystal can
have a few units cell thickness, with more acid site on external surface and more mesopore, which show
favorable effect on mass transfer and selectivity. In 2020. Rimer’s group synthesized a finned like zeolite
catalyst, with rough protrusion on the external surface of nano-sized seed MFI type (ZSM-5 and ZSM-11)
crystal. [4] The geometry of this new catalyst is shown in figure 1. It is reported that this new geometry
catalyst has markedly reduced the diffusion path length with increasing molecular uptake rate in fin, which
result in less coke formation on the external surface and high product selectivity.[4] This thesis is trying to
simulate and verify the effect of the fin (protrusion) geometry on the mass transfer properties via building
a reaction and diffusion model. The validity of the numerical model is verified by comparing with the
analytical model. The activity of the finned catalyst will compare with activity of same size conventional
spherical catalysts, which is calculated by analytical method. This model could lead to rational design of
this finned catalyst.
To reveal the effect of the geometry on the performance (selectivity) of the catalyst, especially the
difference between the external surface and seed crystal, two parallel test reaction, self-esterification, and
alkylation reaction with mesitylene are chosen. The reaction mechanism is shown in figure 2. The benzyl

2
alcohol is converted to 1,3,5-trimethyl-2-benzylbenzene and benzyl ether in liquid phase. Alkylation
reaction only occurs at the surface of the crystal and self-etherification reaction occur at both micropore
and surface of crystal. Therefore, the selectivity of two reactions can provide a quantitative assessment of
activity of external surface and internal micropores.
Figure 2 the mechanisms for benzyl alcohol etherification (left) and alkylation (right) reactions in liquid phase*
*Picture come from the literature.[5]
Figure 2 Idealized schematic of a finned zeolite and Transmission electron micrograph of a representative finned ZSM-11 crystal. *
*pictures come from literature [4]

3
Modeling
Reaction mechanism
The reaction mechanism is shown in figure 1. A Bronsted acid site(BAS) adsorbs the benzyl alcohol
and prontonate it to form a carbonium ion(A’*).The free or weakly adsorbed mestylene(S) may react with
the Protonated benzyl alcohol and form 1,3,5-trimethyl-2-benzylbenzene(P). Carbonium also could react
with another adsorbed benzyl alcohol(B*) to form benzyl ether. The kinetic rate expression for alkylation
at the external surface is shown as equation 1, which is derived in literature [5], assumes that all adsorbed
steps are quasi-equilibrium equation. Protonated benzyl alcohol(A’*). and co-adsorbed benzyl alcohol (B*)
are the dominant surface species.
𝑟𝑃 =𝑑𝐶𝑃
𝑑𝑡=
𝑘1𝑠
1+𝐾𝐵𝐶𝐴𝐶𝐻+𝑓𝑒𝑥𝑡 Equation 1
Cp represent the concentration of 1,3,5-trimethyl-2-benzylbenzene. CA is the concentration of benzyl
alcohol. KB denote the equilibrium constant for formation of co-adsorbed benzyl alcohol. K1s represents
effective alkylation rate constant related to reaction. CH+ is the concentration of BAS in catalyst. Since the
Si/Al ratio of finned MFI catalyst made by seeded analysis =32.6, which is close to the ratio of 0.2 µm MFI
synthesized by Dandan.et.al (Si/Al=33), therefore we assume the BAS density of finned MFI catalyst is
equal to that of 0.2 µm MFI, which is 489 𝜇𝑚𝑜𝑙
𝑔. BAS concentration 𝐶𝐻+ =BAS density×weight of
catalyst/volume of reactor, where weight of catalyst is 0.025g. and volume of reactor is15.25mL.
𝑓𝑒𝑥𝑡 is the external acid site fraction which is defined as amount of acid site in external section over
the amount of total acid site. The external surface fraction is determined by depth that dTBP can penetrated
from the surface(0.5nm). Assuming the BASs are evenly distributed. The external acid site fraction
𝑓𝑒𝑥𝑡 :𝑒𝑥𝑡𝑒𝑟𝑛𝑎𝑙 𝑎𝑐𝑖𝑑 𝑠𝑖𝑡𝑒 𝑓𝑟𝑎𝑐𝑡𝑖𝑜𝑛 =𝑣𝑜𝑙𝑢𝑚𝑒 𝑜𝑓 𝑒𝑥𝑡𝑒𝑟𝑛𝑎𝑙 𝑠𝑢𝑟𝑓𝑎𝑐𝑒 𝑤𝑖𝑡ℎ𝑖𝑛 𝑑𝑇𝐵𝑃 𝑎𝑐𝑐𝑒𝑠𝑠𝑖𝑏𝑙𝑒 𝑑𝑒𝑝𝑡ℎ∗𝐵𝐴𝑆 𝑑𝑒𝑛𝑠𝑖𝑡𝑦
𝑡𝑜𝑡𝑎𝑙 𝑣𝑜𝑙𝑢𝑚𝑒 𝑜𝑓 𝑐𝑎𝑡𝑎𝑙𝑦𝑠𝑡 𝑝𝑎𝑟𝑡𝑖𝑐𝑙𝑒∗𝐵𝐴𝑆 𝑑𝑒𝑛𝑠𝑖𝑡𝑦
The kinetic rate expression for self-etherification is shown as Equation 2.
𝑟𝐵 =𝑑𝐶𝐵
𝑑𝑡=
𝑘2𝐾𝐵𝐶𝐴
(1+𝐾𝐵𝐶𝐴)∗ 𝐶𝐻+𝑓𝑒𝑥𝑡 + 𝑘2𝑖𝑛𝑡𝐶𝐴
𝐶𝐻+(1 − 𝑓𝑒𝑥𝑡) Equation 2
𝐶𝐴 =
𝐾𝐶𝐴
1+𝐾𝐶𝐴𝐶𝐴
𝑚𝑎𝑥 Equation 3

4
the kinetic parameter 𝑘2𝑖𝑛𝑡 represents the effective rate constant of etherification reaction. 𝐶𝐴 is the
concentration of benzyl alcohol adsorbed on the acid site, which is denoted by equation 3. Equation 3 is
derived from the Langmuir adsorption isotherm [6]. K is the adsorption equilibrium constant. 𝐶𝐴𝑚𝑎𝑥 is the
maximum adsorbed concentration of benzyl alcohol. The estimated parameters, which taken from the
literature [5]. The diffusivity 𝑫𝒎𝑨 is taken from diffusion limited data of conventional MFI catalyst. are shown
in table 1.
parameters estimated value
𝒌𝟏𝒔(/𝒔) 0.0025 ± 0.0001
𝒌𝟐(/𝒔) 0.0013 ± 0.00005
𝑲𝑩(𝑳/𝒎𝒐𝒍) 3.9 ± 0.1
𝒌𝟐𝒊𝒏𝒕(𝑳𝒄𝒂𝒕/[𝒎𝒐𝒍/𝒔]) 0.0014 ± 0.0001
𝑫𝒎𝑨(𝒎𝟐/𝒔) (4.4 ± 1.2) ∗ 10−20
𝑲(𝑳/𝒎𝒐𝒍) 62
𝑪𝑨𝒎𝒂𝒙 (𝒎𝒐𝒍/𝑳_𝒄𝒂𝒕) 1.35
Table 1 the parameters of self-etherification and alkylation
The Diffusion models
To simulate the effect of micropore diffusion on the self-etherification reaction, A material balance of
benzyl alcohol (A) using Fick’s law is applied. Assuming steady state:
∇ ∙ 𝐽𝐴 = 𝑟𝐴
𝐽𝐴 = −𝐷𝑚𝐴∇𝐶𝐴 Equation 4
𝐷𝑚𝐴 is the effective diffusion coefficient. 𝐽𝐴 is the mass flux of A (𝑚𝑜𝑙
𝑚2𝑠). 𝑟𝐴 is the reaction rate (
𝑚𝑜𝑙
𝑚3𝑠) =
𝑑𝐶𝐴
𝑑𝑡.
For the sphere geometry, the material balance can be further derived into equation 5:
𝐷𝑚𝐴 (𝑑2𝐶𝐴
𝑑𝑅2 +2
𝑅) = −𝑟𝐴 Equation 5
with boundary condition:

5
{
𝐶𝐴 = 𝐶𝐴𝑆 𝑎𝑡 𝑅 = 𝑟𝑎𝑑𝑖𝑢𝑠 𝑜𝑓 𝑠𝑝ℎ𝑒𝑟𝑒𝑑𝐶𝐴
𝑑𝑅= 0 𝑎𝑡 𝑅 = 0
𝐶𝐴𝑆 is the concentration of benzyl alcohol at the surface, which is equal to 0.17 mol/L
Geometry
In this simulation, the geometry of finned catalyst is assumed as a sphere with cylinder-shape fin
which have diameter α and length α. The smallest distance between the edge of two cylinder is defined as
fin pitch γ. The diameter of sphere is β. The geometry is shown in figure 3.
Figure 3 the geometry of catalyst in the simulation(A), with fin dimensions , interior dimension , and fin pitch (B).
For the geometry design, fin pitch and Interior dimension are two variables considered in this work.
catalyst 1 and 2 are geometries that the Rimer’s group paper used in Monte carlo simulation. They have
same interior dimension (500nm), and fin dimension (50nm), while the fin pitches are different (50nm
and 25nm, respectively). catalyst 3 4 are possible geometries of catalysts that Rimer’s group synthetized.
They have same fin dimension(35nm) and pitch(17.5nm), but the interior dimensions are different
(250nm and 390nm, respectively). To evaluate the effect of fin on the mass transfer, conventional spherical
catalysts with diameter β+2α and β are simulated and compared with finned catalyst with interior and fin
dimension and , respectively. The detail of the geometry of finned catalyst is shown in table 2.
Simulation
Equation 4 combining with equation 2 describes the reaction and diffusion model of self-etherification.
The model is built on COMSOL software which apply finite element method to solve the problem. Fin part
of the catalyst is discretized into “free tetrahedral mesh” with “finer” mesh size. The seed crystal part is
discretized with “boundary layer method” due to the uniform shape. The module chosen in the simulation
A B

6
is ‘Transport of diluted species in porous media module’. The specific procedures have been recorded as a
video.[23]
geometry 𝜶 𝜸 𝜷 External acid
site fraction
for MFI
material*
Surface area
𝑐𝑎𝑡𝑎𝑙𝑦𝑠𝑡 1∗ 50nm 50nm 500nm 0.0976 1865800nm2
𝑐𝑎𝑡𝑎𝑙𝑦𝑠𝑡 2∗ 50nm 25nm 500nm 0.0119 1444600nm2
𝑐𝑎𝑡𝑎𝑙𝑦𝑠𝑡 3 35nm 17.5nm* 250nm 0.0225 470090nm2
𝑐𝑎𝑡𝑎𝑙𝑦𝑠𝑡 4 35nm 17.5nm* 390nm 0.0155 1161500nm2
Table 2 geometries, external acid site faction & surface areas of finned catalysts

7
Result and discussion
Validity of the model
The validity of the model is tested via comparing the reaction rates from numerical models with
analytical method at different geometries of catalysts. In particular, the reaction rates in the fin region of
the numerical model are compared with the analytical reaction rates in cylinder geometry catalysts which
have exactly same size to the fin in numerical model. To simplify the calculation process, an isothermal,
isobaric first order reaction is assumed:
𝑟 = 𝑘𝑣𝐶𝐴 equation 6
Where 𝑘𝑣 = 0.01 𝑠−1
For diffusion model, fick’s law is applied to represents the equimolar flux, which is equation 4. In
this case, the Thiele modulus and effectiveness factor for cylinder can be calculated as:[7]
𝜙 = 𝑅𝑝√𝑘𝑣
𝐷𝑒𝑓𝑓 equation 7
𝜂 =2𝐼1(𝜙)
𝜙𝐼0(𝜙) equation 8
Where 𝐼𝑖represent modified Bessel function of order i, which is represented by an integral formula
[7]:
𝐼𝑖(𝜙) =1
𝜋∫ 𝑒𝜙𝑐𝑜𝑠𝜃𝑐𝑜𝑠𝑖
𝜋
0𝜃𝑑𝜃 −
𝑠𝑖𝑛𝑖𝜋
𝜋∫ 𝑒−𝜙𝑐𝑜𝑠ℎ𝑡−𝑖𝑡𝑑𝑡
∞
0 equation 9
According to the definition of effectiveness factor, the analytic solution of reaction rate 𝑟𝑎𝑛𝑎𝑙𝑦𝑡𝑖𝑐 can
be calculated as:
𝑟𝑎𝑛𝑎𝑙𝑦𝑡𝑖𝑐 = 𝜂 ∗ 𝑟𝑚𝑎𝑥 =2𝐼1(𝜙)
𝜙𝐼0(𝜙)∗ 𝑘𝑣𝐶𝐴0 ∗ 𝑉 equation 10
Where 𝑟𝑚𝑎𝑥 is the reaction rate. 𝐶𝐴0 is the surface concentration. V is the volume of one fin. For the
numerical model, we calculate the reaction rate in the volume of one fin of the finned catalyst (shown in
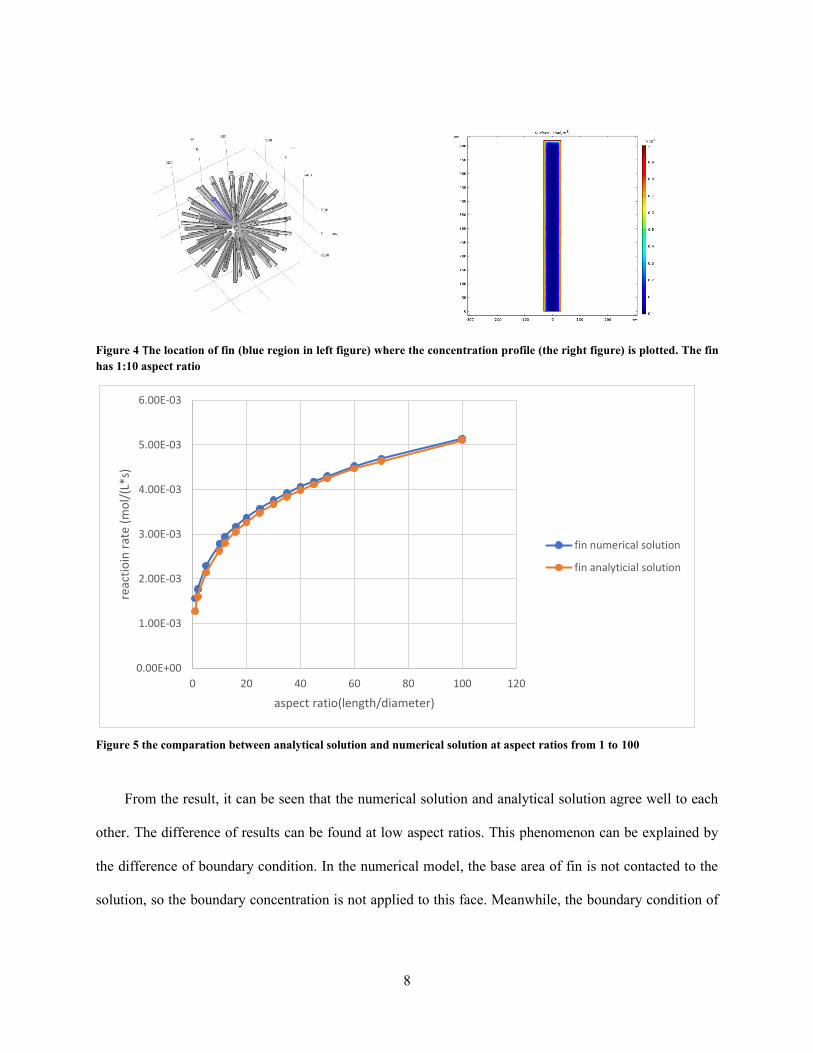
Figure 4). For the geometry, the aspect ratio (length/ diameter) is set from 1 to 100. The comparation of
the reaction rate is shown in figure 4
8
Figure 4 The location of fin (blue region in left figure) where the concentration profile (the right figure) is plotted. The fin
has 1:10 aspect ratio
Figure 5 the comparation between analytical solution and numerical solution at aspect ratios from 1 to 100
From the result, it can be seen that the numerical solution and analytical solution agree well to each
other. The difference of results can be found at low aspect ratios. This phenomenon can be explained by
the difference of boundary condition. In the numerical model, the base area of fin is not contacted to the
solution, so the boundary concentration is not applied to this face. Meanwhile, the boundary condition of
0.00E+00
1.00E-03
2.00E-03
3.00E-03
4.00E-03
5.00E-03
6.00E-03
0 20 40 60 80 100 120
reac
tio
in r
ate
(mo
l/(L
*s)
aspect ratio(length/diameter)
fin numerical solution
fin analyticial solution

9
analytical model includes every faces of the geometry. Therefore, the small aspect ratios result in large base
area and therefore large deviation of the result.
Comparation of finned catalysts in different geometries
Comparation between the alkylation and etherification reaction rate for four finned catalyst are shown
in Figure 4. The comparation between catalyst 1 and 2 revealed that both the alkylation and etherification
reaction rate is increasing with smaller fin pitch (more numbers of fins) on the surface of crystal. From the
difference between catalyst 3 and 4. it can be found that the reaction rates are increasing with larger interior
dimension. These differences can be explained by larger surface area as the number of fins increases,
therefore more accessible acid site in the external surface.
0
2E-08
4E-08
6E-08
8E-08
0.0000001
1.2E-07
1.4E-07
catalyst 1 catalyst 2 catalyst 3 catalyst 4
reac
tio
n r
ate
mo
l/L
s
alkylation rate mol/L s self-etherification rate mol/L s
Figure 6 comparations between four finned catalysts

10
From the comparison between the reaction rates in conventional catalyst and finned catalyst in figure 4,
figure 5, and figure 6, it can be seen that the finned catalysts show higher activities than conventional
catalyst.
Figure 7 comparations between finned and sphere catalyst with α=50nm β=500nm
finnedcatalyst 3
sphere diameter=
320nm(β+2α)
sphere diameter=250
nm(β)
alkylation rate mol/L s 1.87E-08 1.13E-08 1.44E-08
etherfication rate mol/L s 1.31E-07 7.79E-08 9.92E-08
0.00E+00
2.00E-08
4.00E-08
6.00E-08
8.00E-08
1.00E-07
1.20E-07
1.40E-07
reac
tio
n r
ate
mo
l/L
s
Figure 8 comparations between finned and sphere catalyst with α=35nm β=250nm
finnedcatalyst 1
finnedcatalyst 2
sphere diameter=
600nm(β+2α)
sphere diameter=5
00nm(β)
alkylation rate mol/L s 7.4107E-09 1.4468E-08 5.97E-09 7.22E-09
ethfication rate mol/L s 8.18E-08 9.8398E-08 4.18E-08 5.00E-08
0
2E-08
4E-08
6E-08
8E-08
0.0000001
1.2E-07
reac
tio
n r
ate
mo
l/L
s
Figure 9 comparations between finned and sphere catalyst with α=25nm β=250nm
finnedcatalyst 4
sphere diameter=460
nm(β+2α)
sphere diameter= 390nm(β)
alkylation rate mol/L s 1.87E-08 7.85E-09 9.25E-09
etherfication rate mol/L s 1.31E-07 5.44E-08 6.40E-08
0.00E+00
2.00E-08
4.00E-08
6.00E-08
8.00E-08
1.00E-07
1.20E-07
1.40E-07
reac
tio
n r
ate
mo
l/L
s

11
In figure 7 the selectivity of finned catalysts calculated from the model is plotted against the dimensionless
term (1
𝑓𝑒𝑥𝑡− 1) 𝜂𝑚 . The blue line represents expression of selectivity derived by Dandan et al [5], which
is shown by equation 6. The selectivity is defined as the reaction rate of self-etherification over the reaction
rate of alkylation. Figure 7 reveals that the simulation result is agreed well with analytical solution.
𝑆𝐵
𝑃
~ (𝑘2𝐾𝐵
𝑘1𝑆) 𝐶𝐴0 + (
𝑘2𝑖𝑛𝑡
𝑘1𝑠) (
𝐾𝐶𝐴0
1+𝐾𝐶𝐴0𝐶𝐴
𝑚𝑎𝑥 ) (1 + 𝐾𝐵𝐶𝐴0) (1
𝑓𝑒𝑥𝑡− 1) 𝜂 Equation 6
𝜂 =tanh(𝜙)
𝜙, 𝜙 = 𝑥𝑝√2𝑘2𝑖𝑛𝑡𝐶𝐻,𝑖𝑛𝑡
+ /𝐷𝑚𝐴
𝐶𝐻,𝑖𝑛𝑡+ denote the BAS concentration inside the catalyst, which is 𝐶𝐻,𝑖𝑛𝑡
+ = 𝐵𝐴𝑆(1 − 𝑓𝑒𝑥𝑡)𝜌𝑧𝑒𝑜𝑙𝑖𝑡𝑒
𝜂 is the effectiveness factor for the first-order self-etherification.
Figure 10 The selectivity as a function of external acid site fraction fext and the effectiveness factor 𝛈𝐦.
*catalyst 3 and 4 overlap to each other.

12
The effect of internal mass tranfer limiation can be revealed by the effectiveness vs thiele modulus
plot( figure 8). The purple line reperesnts the predicted effectivesss vs thiele modulus calculated by 𝜂 =
tanh(𝜙)
𝜙 The plot shows that there are strong mass transfer limiations inside the four finned catalysts.
Conclusion
To reveal the effect of the geometry on the selectivity of the catalyst and diffusion
limitation, a reaction-diffusion model with finned sphere geometry catalyst is built via using
COMSOL. Two parallel reactions (self-esterification and alkylation) are carried out inside the
catalyst to test the selectivity. Simulation results shows that the selectivity will increase with
smaller fin pitch (more fin on the surface). The effectiveness factor for the self-esterficaiotion
shows that the diffusion limitation is reduced with more Smaller fin pitch (more fins on the
surface).
Figure 11 Effectiveness vs Thiele modulus
horizontal lines: Model predication

13
Chapter 2
Introduction
Zeolites are commonly used as catalytic material for many reactions like xylene isomerization,
hexane isomerization, amortization, alkylation, and esterification in the industry.[9] During the
catalytic process of microporous zeolite crystalline material, the reaction rate are determined by
three phenomena happening inside the zeolite particle, diffusion, adsorption, and reaction. The
diffusion limitation for different reactant and productions has huge influence on the conversion
and reactivity of reaction. The diffusivity is influenced by size of molecules, shape of molecules
and configuration [10], For instance, p-xylene can diffuse freely inside the channel of MFI zeolite,
however, o-xylene, the isomer of p-xylene, prefer to stay in intersection of channels due to more
“leg rooms”.[11]. Since there are only 4 intersection per cell in MFI zeolite, the ‘infection isotherm’
phenomenon [12] will happen if the molar loading larger than 4 molecules per unit cell. In this
case, o-xylene molecules will be pushed into somewhere else in the channel, result in additional
active site accommodated in the channel with loading increase. This additional push causes the
loading dependence of Mexwell-stefan diffusivity. According to Krishna and others’ work [13-
16], the Diffusivity will decrease with the loading with the relation:
𝐷𝑖 = 𝐷𝑖(0)𝜃𝑉 equation 7
𝐷𝑖(0) is diffusivity with zero loading. 𝜃𝑉 is the fractional occupancy vacancy. This scenario is
called the ‘strong confinement scenario’.
For large molecules with molar loading smaller than 4 molecule per cell, and other small
molecules like He, Ar in MFI, the diffusivity is independent of the loading:
𝐷𝑖 = 𝐷𝑖(0)

14
In this thesis, the inter-crystalline diffusion is described by maxwell-Stefan functions.
Compare with fick’law, Maxwell-Stefan (MS) model can describe the interaction between each
species in a mixture more accurately. For n component mixture, the MS equation is shown as
below:[16]
∇𝜇 = 𝑅𝑇 ∑𝜃𝑗(𝑢𝑖−𝑢𝑗)
𝐷𝑖,𝑗
𝑛𝑗=1 +
𝑅𝑇𝑢𝑖
𝐷𝑖, 𝑖 = 1,2, … 𝑛 equation 8
−∇𝜇𝑖 is chemical potential, which can be interpreted as the force acting on species i which
has velocity 𝑢𝑖. The first term on the right-hand side describes the friction force on species i from
other species j. 𝐷𝑖,𝑗 represents the inverse drag coefficient between j and i species. The second
term may interpret as the friction between species i and the internal surface of crystal. 𝐷𝑖 represents
the inverse drag coefficient between adsorbate and surface. 𝜃𝑗 is the fractional occupancy of
fractional phase =𝑞𝑖
𝑞𝑠𝑎𝑡
The chemical gradient can be related to thermodynamic correction factor in terms of loading by
[17]
𝑞
𝑅𝑡∇𝜇 = ∑ Γ𝑖𝑗∇𝑞𝑖
𝑛𝑗=1 ; Γ𝑖𝑗 =
𝑞𝑖
𝑝𝑖
𝜕𝑝𝑖
𝜕𝑞𝑗 equation 9
According to definition of mass flux 𝑁𝑖 = 𝑢𝑖𝜌𝑞𝑖, velocity 𝑢𝑖 can be expressed as 𝑁𝑖
𝜌𝑞𝑖.
Combining equation 8 and 9, we can get an equation in matrix form
𝜌𝑞
𝑅𝑡∇𝜇 = ∑ B𝑖𝑗Nj
𝑛𝑗=1 equation 10
Where 𝐵𝑖𝑖 =1
𝐷𝑖+ ∑
𝑥𝑗
𝐷𝑖𝑗, 𝐵𝑖𝑗 = −
𝑥𝑖
𝐷𝑖𝑗
𝑛𝑗=1 , 𝑖, 𝑗 = 1,2 … . 𝑛
𝑥𝑖 is the mole fractions in the adsorbed phase, which is defined as:
𝑥𝑖 =𝑞𝑖
𝑞1+𝑞2+⋯𝑞𝑛 equation 11
Equation 10 can be casted into matrix form
(𝑁) = −𝜌[𝐵]−1[Γ]∇(𝑞) equation 12

15
if there are no interaction between two species (facile exchange), then 𝐷𝑖𝑗 →
∞ ,[𝐵]−1=[𝐷1 00 𝐷2
]
Then for two component system, the flux expression can be simplified to
𝑁1 = −𝜌𝐷1[Γ11∇𝑞1 + Γ12∇𝑞2] = −𝜌𝐷1 [𝑞1
𝑝1
𝜕𝑝1
𝜕𝑞1∇𝑞1 +
𝑞1
𝑝1
𝜕𝑝1
𝜕𝑞1∇𝑞2] equation 13
𝑐 = −𝜌𝐷2[Γ21∇𝑞1 + Γ22∇𝑞2] = −𝜌𝐷2 [𝑞2
𝑝2
𝜕𝑝2
𝜕𝑞1∇𝑞1 +
𝑞2
𝑝2
𝜕𝑝2
𝜕𝑞2∇𝑞2] equation 14
if mass flux equations are expressed in term of pressure 𝑝𝑖
𝑁1 = −𝜌𝐷1 [𝑞1
𝑝1∇𝑝1] equation 15
𝑁2 = −𝜌𝐷2 [𝑞2
𝑝2∇𝑝2] equation 16
The relationship between partial pressure p and loading q is described by adsorption model. In
this thesis, multicomponent Langmuir isotherm and Ideal adsorption theory (IAST) with single
component Langmuir isotherm are considered as adsorption models. Multicomponent Langmuir
adsorption model (MCL)is shown below:
𝑞𝑖 =𝑞𝑖𝑠𝑎𝑡𝑏𝑖𝑝𝑖
1+∑ 𝑏𝑖𝑝𝑖𝑖=𝑛𝑖=1
equation 17
𝑏𝑖 is the Langmuir adsorption constant. 𝑞𝑖𝑆𝑎𝑡is the saturated loading of each species.
IAS theory is proposed by Myers and Prausnitz in 1965[18]. It is a thermodynamic consist model
for predict the adsorption equilibria of mixture. The equation of IAS theory is analogue to
Raoult’s law:
𝑝𝑖 = 𝑃𝑖0𝑥𝑖 equation 18
𝑝𝑖 is the partial fugacities in the bulk fluid phase. 𝑃𝑖0 is the pressure for sorption of every
component i, which yields the same spreading pressure, 𝜋 for each of the pure component.
Therefore, for each component:

16
𝜋𝐴
𝑅𝑇= ∫
𝑞10(𝑓)
𝑓𝑑𝑓 = ∫
𝑞20(𝑓)
𝑓𝑑𝑓 = ⋯ ∫
𝑞𝑛0(𝑓)
𝑓𝑑𝑓
𝑃𝑛0
0
𝑃20
0
𝑃10
0 equation 19
where 𝑞𝑖0 is the pure component adsorption isotherm, which can be described by single or multi-
site Langmuir isotherm.
A key assumption of the IAST is that the enthalpies and surface areas of the adsorbed molecules
do not change upon mixing:
𝐴
𝑞𝑡=
𝐴𝑥1
𝑞10(𝑃1
0)+
𝐴𝑥2
𝑞20(𝑃2
0)+ ⋯
𝐴𝑥𝑛
𝑞𝑛0(𝑃𝑛
0) equation 20
Where the total loading 𝑞𝑡 = 𝑞1 + 𝑞2 + ⋯ 𝑞𝑛 . 𝑞𝑖0(𝑃i
0) are determined from pure component
adsorption isotherm. 𝐴
𝑞𝑡 represents the surface area covered by adsorbents. The equation15-17 need
to be solved together to find the relation between 𝑝𝑖 and 𝑞𝑖. Especially, when the saturation loading
𝑞𝑠𝑎𝑡 of every species are the same, IAST model will be same as Multicomponent Langmuir model.
Langmuir-Hinshelwood (LH) mechanism are commonly used to explain the surface reaction in
the catalyst. Generally, this mechanism considers the reaction rate depend on the number of
densities of adsorbed molecules on the catalyst surfaces.[19] For a reversible isomerization
reaction A(1) ↔ 𝐵(2)The global reaction rate equation is shown below:
𝑟 = 𝑘1𝜃𝜃1 − 𝑘2
𝜃𝜃2 = 𝑘1𝑞1 − 𝑘2𝑞2 = (𝑘1𝑝𝑝1 − 𝑘2
𝑝𝑝2)𝜃𝑣 equation 21
Where 𝜃1 and 𝜃2 is the fractional loading occupancy, which is defined as 𝑞1
𝑞𝑠𝑎𝑡and
𝑞2
𝑞𝑠𝑎𝑡. The
relationship between 𝑘𝑖𝑝 and k is explained by MCL isotherm or IAST model.
In this thesis, we choose a MCL-LH model example and an IAST-LH model example from two
Krishna’s papers [20][21] to prove the validity of our model. All parameters are from the same
paper.

17
Modelling
Effectiveness factor of catalyst with MCL-LH model
An isomerization reaction 2-methylpentane 2𝑀𝑃(1) ↔2,2 dimethyl-butane22𝐷𝑀𝐵(2) in
MFI zeolite is considered for modelling.[20] The kinetic rate equation can be written as
𝑅𝑘𝑔 = 𝑘1𝑞1 − 𝑘2𝑞2 equation 22
where 𝑘1 and 𝑘2is reaction rate constant 1/s. The unit of 𝑅𝑘𝑔 is 𝑚𝑜𝑙 𝑘𝑔 𝑐𝑎𝑡𝑎𝑙𝑦𝑠𝑡−1𝑠−1
Under steady state, the continuity equation for diffusion and reaction in the spherical zeolite
crystalline with radius 𝑟1 is shown below:
1
𝑟2
𝜕
𝜕𝑟(𝑟2𝑁𝑖) = 𝜌𝑣𝑖Rkg equation 23
Where 𝑣1 = −1, 𝑣2 = 1. 𝑅𝑘𝑔 = 𝑘1𝑞1 − 𝑘2𝑞2
If multicomponent Langmuir model (equation 14) is applied, the mass flux equation 12 and
13 can be further simplified into
𝑁𝑖 = −𝜌𝐷𝑖 ∑ Γ𝑖𝑗𝜕𝑞𝑗
𝜕𝑟
𝑛𝑗=1 equation 24
Where thermodynamic correction factor equal
Γ𝑖𝑗 = 𝛿𝑖𝑗 +𝑞𝑖
𝑞𝑗,𝑠𝑎𝑡𝜃𝑣 equation 25
𝛿𝑖𝑗 is the Kronecker delta. 𝜃𝑣 is the occupancy vacancy fraction =1−𝑞1
𝑞𝑠𝑎𝑡−
𝑞2
𝑞𝑠𝑎𝑡
The effectiveness factor 𝜂 is
𝜂 =∫ 𝑅𝑘𝑔𝑟2𝑑𝑟
𝑟0
𝑅𝑘𝑔 ∫ 𝑟2𝑑𝑟𝑟
0
equation 26
If Fick’s law is applied, the thermodynamic correction factor is further simplified to Γ𝑖𝑗 = 𝛿𝑖𝑗
And the mass flux become 𝑁𝑖 = −𝜌𝐷𝑖𝜕𝑞𝑖
𝜕𝑟 equation 27
Strong
The analytical solution of the effectiveness factor can be found from textbook [19]
𝜂 =1
𝜙(
1
tanh(3𝜙)−
1
3𝜙) equation 28

18
The corresponding Thiele modulus
𝜙 =𝑟𝑐
3√
𝑘1
𝐷1(0)+
𝑘2
𝐷2(0) equation 29
The partial pressures at the surface of the catalyst are 10kPa for both 22DMB and 2MP. The
corresponding loading at the surface of catalyst can be calculated via MCL model. Then the
boundary condition for two differential equations become
{𝑞1 = 0.1655
𝑚𝑜𝑙
𝑘𝑔, 𝑎𝑡 𝑟 = 𝑟1
𝜕𝑞1
𝜕𝑟= 0, 𝑎𝑡 𝑟 = 0
{𝑞2 = 0.29
𝑚𝑜𝑙
𝑘𝑔, 𝑎𝑡 𝑟 = 𝑟1
𝜕𝑞2
𝜕𝑟= 0, 𝑎𝑡 𝑟 = 0
The value of parameter 𝑘1, 𝑘2, 𝐷1, 𝐷2 𝑏1, 𝑏2 comes from Krishna’s work [20].
parameters 𝒆𝒔𝒕𝒊𝒎𝒂𝒕𝒆𝒅 𝒗𝒂𝒍𝒖𝒆
Reaction rate constant k1 0.0011𝑠−1
Reaction rate constant k2 0.00055𝑠−1 D1
𝑟1
0.005𝑠−1
D2
𝑟2
0.0000625𝑠−1
𝑏1 0.000127 𝑃𝑎−1
𝑏2 0.0000712 𝑃𝑎−1 Table 3 parameters for MCL-LH model
Effectiveness factor of catalyst with IAST-LH model
For the IAST-LH model, we choose an example from Krishna’s paper [21]. A reversible
isomerization 𝑛𝐶6(n-hexane)(1) ↔22DMB(2,2-dimethylbutane) (2) reacts inside the spherical
MFI catalyst. The continuity equation is same as equation 22, where 𝑁1 and 𝑁2 is expressed as
equation 14 and 15.
The reaction equation is 𝑅𝑘𝑔 = 𝑘1𝑞1 − 𝑘2𝑞2. The IAST model applies the equation 15-17.
Equation 15 become
𝑝1 = 𝑃10𝑥1 equation 30

19
𝑝2 = 𝑃20𝑥2 equation 31
Equation 16 become
∫𝑞1
0(𝑓)
𝑓𝑑𝑓 = ∫
𝑞20(𝑓)
𝑓𝑑𝑓
𝑃20
0
𝑃10
0 equation 32
Equation 17 become
𝑞1 + 𝑞2 =1
𝑥1
𝑞10(𝑃1
0)+
𝑥2
𝑞20(𝑃2
0)
equation 33
A double site Langmuir isotherm (equation 30) is used to describe the pure adsorption
isotherm 𝑞𝑖0(𝑃𝑖
0) with parameters shown in table 4.
𝑞𝑖0(𝑃𝑖
0) =𝑞𝑖,𝑠𝑎𝑡,𝐴𝑏𝑖,𝐴𝑃𝑖
0
1+𝑏𝑖,𝐴𝑃𝑖0 +
𝑞𝑖,𝑠𝑎𝑡,𝐵𝑏𝑖,𝐵𝑃𝑖0
1+𝑏𝑖,𝐵𝑃𝑖0 equation 34
Component Temperature(K) Site A Site B
𝑏𝑖𝐴(𝑃𝑎−1) 𝑞𝑖,𝑠𝑎𝑡,𝐴(𝑚𝑜𝑒𝑐𝑢𝑙𝑒𝑠
𝑝𝑒𝑟 𝑢𝑛𝑖𝑡 𝑐𝑒𝑙𝑙)
𝑏𝑖,𝐵(𝑃𝑎−1) 𝑞𝑖,𝑠𝑎𝑡,𝐵
nC6 362K 0.0632 4 0.0017 4
2DMB 362K 0.01085 4 - -
Table 4 Dual-site Langmuir parameters for nC6 and 2DMB
To transfer the unit of 𝑞𝑖𝑠𝑎𝑡,𝐴 𝑡𝑜
𝑚𝑜𝑙
𝑘𝑔, the number in table 4 need to be multiplied by 0.17337.
[20] All parameters in this model comes from the Krishna’s paper [21]. Generally, zero loading
diffusivity 𝐷1(0)
𝐷2(0)=10.Kinetic constant
𝑘1
𝑘2= 2 the bulk partial pressure at the surface of catalyst
𝑝1 = 𝑝2 = 10𝑘𝑃𝑎.
The effectiveness factor for the numerical solution is calculated via equation 22. The Thiele
modulus is defined as
𝜙 =𝑟
3√
𝑘1
𝑏1𝐷1+
𝑘2
𝑏2𝐷2 equation 35

20
Simulation method
COMSOL software with “general form PDE interface” is used for solving the differential
equations numerically. A 3-D sphere geometry is built. Normal sized mesh is applied to discretize
the model. For IAST-LH model, firstly the IAST theory (equation 26 to 30) is solved via MATLAB
to find the expression loading 𝑞𝑖 in terms of partial pressure 𝑓𝑖. Then the expressions are inputted
into the COMSOL.
Simulation result
The concentration profile and effectiveness factor via simulating MCL-LH model is shown
below. We try three different scenarios: strong confinement scenario with MS model, weak
confinement scenario with MS model and fick’s law model. The loading profile and effectiveness
factor calculated in Krishna’s paper can be found in supplementary information. The difference
between three scenarios shows the thermodynamic coupling effect on the diffusion. The agreement
between our results and Krishna’s paper proves the validity of our model.
Figure 12 loading profile along the radial direction when Thiele modulus=1.0011

21
For the IAST-LH model, firstly we compare the predication of component fugacity as a
function of fractional occupancy vacancy 1- 𝜃𝑛𝑐6- 𝜃22𝐷𝑀𝐵via using IAST approach and MCL
approach. The ratio of the loading of nC6 and 2DMB is kept at 3. From figure 14, When the
vacancy 0.1,0.2.0.9, the effectiveness factor of IAST-LH model and MCL-LH model is shown in
figure 15. The significance difference of two model can be found when the vacancy is small
(loading is high). This phenomenon is due to the configurational entropy effect [21][22]. The
results from our model are same as results calculated in Krishna’s paper (see supplementary
information.)
Figure 13 effectiveness factor when partial pressure at the surface of
crystal p1=p1=10kPa k1/k2=2 D1/D2=80
Figure 14 Compare MCL and IAST model: component fugacity vs fractional
vacancy (𝟏 − 𝜽𝒏𝒄𝟔 − 𝟑𝜽𝟐𝟐𝑫𝑴𝑩) when loading 𝜽𝒏𝒄𝟔 = 𝟑𝜽𝟐𝑫𝑴𝑩

22
Figure 15 effectiveness factor for weak confinement scenario vis simulating IAST-LH model and MCL-LH model. The
fractional loading at the surface is kept at θs,nC6 = 3θs,22DMB.
Conclusion
Two reaction- diffusion models with different adsorption mechanisms (MCL and IAST) are
formulated via using COMSOL software. For MCL-LH model, three different scenarios (weak
confinement scenario, strong confinement scenario and ficken scenario) are simulated. The
difference between IAST-LH approach and MCL-LH approach at low vacancy (high loading) is
shown via plotting component fugacity and effectiveness at different fractional fugacity. Due to
the advantage and simplicity of COMSOL software, this model may be applied to catalyst crystal
with odd geometry and couple with complex scenario in reactor simulation.

23
Supplementary material
1.simulation results of 4 finned catalysts
Table S1 simulation results for the effectiveness factor, alkylation rate, etherification rate and external fraction for four finned catalysts.
2.Comparation between finned and sphere catalysts
α=50nm β=500nm finned
catalyst 1
finned
catalyst 2
sphere diameter=
600nm(β+2α)
sphere
diameter=500nm(β)
effectiveness factor 0.056695 0.068291 0.028857 0.034524
selectivity 6.9499 6.8011 7.0058 6.9256
alkylation rate
mol/L s
7.4107E-09 1.4468E-08 5.97E-09 7.22E-09
etherification rate
mol/L s
8.18E-08 9.8398E-08 4.18E-08 5.00E-08
External fraction 0.009761005 0.011952945 4.95E-03 0.005988008
α=50nm
β=500nm
finned
catalyst 1
finned
catalyst 2
sphere diameter=
600nm(β+2α)
sphere
diameter=500nm(β)
effectiveness
factor
0.056695 0.068291 0.028857 0.034524
selectivity 6.9499 6.8011 7.0058 6.9256
alkylation rate
mol/L s
7.4107E-09 1.4468E-08 5.97E-09 7.22E-09
etherification
rate mol/L s
8.18E-08 9.8398E-08 4.18E-08 5.00E-08
fraction 0.009761005 0.011952945 4.95E-03 0.005988008
Table S2 comparations between finned and sphere catalysts with α=50nm β=500nm
α=35nm β=390nm finned catalyst
4
Sphere
diameter=460nm(β+2α)
sphere diameter=
390nm(β)
effectiveness factor 0.09182 0.037568 0.044286
selectivity 7.0416 6.9306 6.9218
alkylation rate mol/L s 1.87E-08 7.85E-09 9.25E-09
etherification rate
mol/L s
1.31E-07 5.44E-08 6.40E-08
fraction 0.015531564 0.006507572 0.007672601
Table S3 comparations between finned and sphere catalyst with α=35nm β=390nm
α=35nm β=250nm finned catalyst 3 sphere diameter=
320nm(β+2α)
sphere
diameter=250nm(β)
effectiveness factor 0.09182 0.053937 0.068855
selectivity 7.0416 6.9099 6.8808
alkylation rate mol/L s 1.87E-08 1.13E-08 1.44E-08
etherification rate
mol/L s
1.31E-07 7.79E-08 9.92E-08
fraction 0.015531564 0.009345734 0.011952064
Table S4 comparations between finned and sphere catalyst with α=35nm β=250nm

24
2-D Concentration profile for benzyl alcohol Catalyst 1 𝛼 = 50𝑛𝑚 𝛾 = 50𝑛𝑚 𝛽 = 500𝑛𝑚 Catalyst 2 𝛼 = 50𝑛𝑚 𝛾 = 25𝑛𝑚 𝛽 = 500𝑛𝑚
1D Concentration profile from the surface of fin to about 10nm depth in
radial direaction Catalyst 1 𝛼 = 50𝑛𝑚 𝛾 = 50𝑛𝑚 𝛽 = 500𝑛𝑚 Catalyst 2 𝛼 = 50𝑛𝑚 𝛾 = 25𝑛𝑚 𝛽 = 500𝑛𝑚
𝛾
𝛽
𝛼
The location where the profile is plotted:
𝛼

25
Comparation of concentration profiles between catalyst 1 and catalyst 2
-20
0
20
40
60
80
100
120
140
160
180
0 2 4 6 8 10 12
con
cen
trat
ion
mo
l/m
^3
distance from surface
concentration for catalyst 1with alpha=50nmgamma=50nm beta=500nm
concentration for catalyst 2with alpha=25nmgamma=50nm beta=500nm

26
2-D Concentration profile Catalyst 3 𝛼 = 35𝑛𝑚 𝛾 = 17.5𝑛𝑚 𝛽 = 250𝑛𝑚 Catalyst 4 𝛼 = 35𝑛𝑚 𝛾 = 17.5𝑛𝑚 𝛽 = 390𝑛𝑚
1D Concentration profile from the surface of fin to about 10nm depth in
radial direaction
The location where the concentration profile is plotted The location where the concentration profile is plotted:
𝛾
𝛼
𝛽
𝛼
Catalyst 3 𝛼 = 35𝑛𝑚 𝛾 = 17.5𝑛𝑚 𝛽 = 250𝑛𝑚 Catalyst 4 𝛼 = 35𝑛𝑚 𝛾 = 17.5𝑛𝑚 𝛽 = 390𝑛𝑚

27
Comparation of concentration profiles between catalyst 3 and catalyst 4
-20
0
20
40
60
80
100
120
140
160
180
0 2 4 6 8 10 12
con
cen
trat
ion
mo
l/m
^3
distance from the surface mm
concentration profile for catalylstwith alpha =35nm gamma=17.5nmbeta=250 nm
concentration profile for catalylstwith alpha =35nm gamma=17.5nmbeta=390nm
aspect ratio(length/diameter)
length of fin (nm)
radius of fin (nm)
fin analyticial solution(mol/(L s))
fin numerical solution(mol/(L s))
1 135 67.8 0.00128 0.00156
2 214.31 53.6 0.0016 0.00177
5 394.76 39.48 0.00214 0.00229
10 620 31.5 0.00263 0.00278
12 707.64 29.48 0.0028 0.00294
16 857.24 26.79 0.00305 0.00317
20 994.7 24.87 0.00326 0.00337
25 1154.3 23.1 0.00348 0.00357
30 1303.5 21.7 0.00367 0.00376
35 1444.6 20.6 0.00384 0.00392
40 1579 19.7 0.00399 0.00406
45 1708 19 0.00411 0.00418
50 1832.3 18.3 0.00425 0.0043
60 2069 17.2 0.00447 0.00452
70 2293 16.4 0.00464 0.00469
100 2908.6 14.5 0.00511 0.00514
Table S5 comparation between analytical solution and numerical solution at different aspact ratios

28
The reference results of MCL-LH model in Krishna’s paper[20]
a) Calculation of the effectiveness factor, η, for MFI catalyst carrying out the 2MP(1) ⇄
22DMB(2) reaction at 473 K.
c) The loading profile along the radial direction
The reference results of IAST-LH model in Krishna’s paper [21]
a) Fugacity (partial pressure) fi of nC6 and 22DMB as a function of the
vacancy θV = 1 − θnC6 − θ22DMB.
b) Effectiveness versus Thiele modulus at weak confinement scenario and facile exchange
𝐷𝑖𝑗 → ∞. The fractional loadings at the surface of the zeolite crystal is fixed
with θs,nC6 = 3θs,22DMB. Fractional occupancy varies from 0.1 to 0.9.

29
MATLAB code for solving IAST theory to find the expression of qi in terms of fi
syms x1 x2 qt q1 q2 f1 f2
%x1 is the mole fraction of 2-methylpentane in the adsorbed phase
%x2 is the mole fraction of dimethyl-butane in the adsorbed phase
%f1 is the partial pressure of 2-methylpentane
%f2 is the partial pressure of dimethyl-butane
%qt is the total loading ins the adsorbed phase
%q1 is the loading of 2-methylpentane in the adsorbed phase
%q2 is the loading of dimethyl-butane in the adsorbed phase
q1sa=0.6935% mol/kg the saturated adsorption loading of 2-
methylpentane at site A 4*0.17337
q1sb=0.6935% mol/kg the saturated adsorption loading of 2-
methylpentane at site B 4*0.17337
q2sa=0.6935% mol/kg the saturated adsorption loading of dimethyl-
butane at site A 4*0.17337
b1a=0.0632 %pa^-1
b1b=0.0017 %pa^-1
b2a=0.01085%pa^-1
f=(x1)/((q1sa*b1a*f1/(x1))/(1+b1a*f1/(x1))+q1sb*b2a*f1/(x1)/(1+b1b*f1/
(x1)))+(x2)/(q2sa*b2a*f2/(x2)/(1+b2a*f2/x2))-1/(qt); %combination of
equation 32 & 33
g=q1sa*log(1+b1a*f1/x1)+q1sb*log(1+b1b*f1/x1)-
0.6935*log(1+b2a*f2/x2); %equation 31
h=x1+x2-1
n=q1-x1*qt%equation 11
j=q2-x2*qt% equation 12
[x10,x20,qt0,q1,q2]=solve(f,g,h,n,j,x1,x2,qt,q1,q2)
[q1]=simplify(q1)
[q2]=simplify(q2)

30
Literature cited
[1] A. Hwang et al., (2019). Effects of diffusional constraints on lifetime and selectivity in
methanol to-olefins catalysis on HSAPO-34. J. Catal. 369, 122-132
[2] H. Awala et al., (2015).Template-free nanosized faujasite-type zeolites. Nat. Mater. 14, 447-
451
[3] K. A. Cychosz, R. Guillet-Nicolas, J. Garcia-Martinez, M. Thommes, (2017).Recent advances
in the textural characterization of hierarchically structured nanoporous materials. Chem. Soc. Rev.
46, 389-414
[4] Dai, H., Shen, Y., Yang, T. et al. (2020). Finned zeolite catalysts. Nat. Mater. 19, 1074–1080
[5]Xu, D., Abdelrahman, O., Ahn, S. H., Guefrachi, Y., Kuznetsov, A., Ren, L., . . . Tsapatsis, M.
(2019). A quantitative study of the structure–activity relationship in hierarchical zeolites using
liquid‐phase reactions. AIChE Journal, 65(3), 1067-1075. doi:10.1002/aic.16503
[6] Zhang X, Liu D, Xu D, et al. (2012) Synthesis of self-pillared zeolite Nanosheets by repetitive
branching. Science.;336:1684-1687.
[7] Davis, Mark E. and Davis, Robert J. (2003) Fundamentals of chemical reaction
engineering. McGraw-Hill chemical engineering series. McGraw-Hill Higher Education , New
York, NY. ISBN 007245007X.
[8] MILNE-THOMSON, L. (1945). A Treatise on the Theory of Bessel
Functions. Nature 156, 190–191 https://doi.org/10.1038/156190a0
[9] Degnan, T. F. (2003). The implications of the fundamentals of shape selectivity for the
development of catalysts for the petroleum and petrochemical industries. Journal of Catalysis,
216(1-2), 32-46. doi:10.1016/s0021-9517(02)00105-7

31
[10] Davis, M. E. (1991). Zeolites and Molecular SIEVES: Not just ordinary catalysts. Industrial
& Engineering Chemistry Research, 30(8), 1675-1683. doi:10.1021/ie00056a001
[11] Gupta, A.; Clark, L. A.; Snurr, R. Q. (2000). Grand canonical Monte Carlo simulations of
nonrigid molecules: Siting and segregation in silicalite zeolite. Langmuir, 16, 3910-3919.
[12]Krishna, R.; Baur, R. (2003). Modelling Issues in Zeolite Based Separation Processes. Sep.
Purif. Technol. 33, 213-254
[13] D.Paschek, R.Krishna (2001),Inter-relation between self-and jump-diffusivities in zeolites,
Chem. Phys. Lett. 333 278–284.
[14] R. Krishna, D. Paschek, Verification of the Maxwell–Stefan theory for tracer diffusion
in zeolites, Chem. Eng. J. 85 (2002) 7–15.
[15] Skoulidas and David S. Sholl (2002). Transport b Diffusivities of CH4, CF4, He, Ne, Ar, Xe,
and SF6 in Silicalite from Atomistic Simulations Anastasios I. The Journal of Physical Chemistry
B 2002 106 (19), 5058-506 DOI: 10.1021/jp014279x
[17] R. Krishna,(1993)A unified approach to the modelling of intraparticle diffusion in adsorption
processes,Gas Separation & Purification,Volume 7, Issue 2,,Pages 91-104,ISSN 0950-
4214,https://doi.org/10.1016/0950-4214(93)85006-H.
[18] Myers, A. L., & Prausnitz, J. M. (1965). Thermodynamics of mixed-gas adsorption. AIChE
Journal, 11(1), 121-127. doi:10.1002/aic.690110125
[19]Davis, M. E., & Davis, R. J. (2012). Fundamentals of chemical reaction engineering. Mineola,
NY: Dover Publications.

32
[20] Krishna, R., Baur, R., & Van Baten, J. M. (2017). Highlighting diffusional coupling effects
IN Zeolite catalyzed reactions by combining THE Maxwell–Stefan AND LANGMUIR–
HINSHELWOOD FORMULATIONS. Reaction Chemistry & Engineering, 2(3), 324-336.
doi:10.1039/c7re00001d
[21] BAUR, R., & KRISHNA, R. (2004). Effectiveness factor for zeolite catalysed isomerization
reactions. Chemical Engineering Journal, 99(2), 105-116. doi:10.1016/j.cej.2003.09.007
[22] Krishna, R., Baur, R., & Van Baten, J. M. (2017). Highlighting diffusional coupling effects
IN Zeolite catalyzed reactions by combining THE Maxwell–Stefan AND LANGMUIR–
HINSHELWOOD FORMULATIONS. Reaction Chemistry & Engineering, 2(3), 324-336.
doi:10.1039/c7re00001d
[23] https://youtu.be/3uvxOZkwR9w


