
Q3 & 9 Months Ended September 30, 2019
Financial Results

2
DISCLAIMERFORWARD-LOOKING STATEMENTS & INFORMATION
This document includes "forward-looking statements" intended to qualify for the safe harbor from liability established by
the Private Securities Litigation Reform Act of 1995 in order to encourage companies to provide prospective information
about their business. These statements include statements about our plans, strategies, goals financial performance,
prospects or future events or performance and involve known and unknown risks that are difficult to predict. As a result,
our actual results, performance or achievements may differ materially from those expressed or implied by these
forward-looking statements. In some cases, you can identify forward-looking statements by the use of words such as
"may," "could," "expects," "seeks," "predict," "schedule," "projects," "intends," "plans,“ "anticipates," "believes," "estimates,"
"potential," "likely" and variations of these terms and similar expressions, or the negative of these terms or similar
expressions.
Such forward-looking statements are necessarily based upon estimates and assumptions. Although the Company
believes that these assumptions were reasonable when made, because these assumptions are inherently subject to
significant uncertainties and contingencies which are difficult or impossible to predict and are beyond the Company's
control, the Company cannot assure you that it will achieve or accomplish these expectations, beliefs or projections.
The Company’s actual results may differ, possibly materially, from those anticipated in these forward-looking statements
as a result of certain factors, including changes in the Company’s financial resources and operational capabilities and
as a result of certain other factors listed from time to time in the Company's filings with the U.S. Securities and Exchange
Commission. For more information about risks and uncertainties associated with our business, please refer to our filings
with the U.S. Securities and Exchange Commission, including without limitation, under the caption “Risk Factors” in our
Annual Report on Form 20-F for the fiscal year ended December 31, 2018. We caution you not to place undue reliance
on any forward looking statements, which are made as of the date of this document. We undertake no obligation to
update publicly any information in this document, including forward-looking statements, to reflect actual results, new
information or future events, changes in assumptions or changes in other factors affecting forward-looking statements,
except to the extent required by applicable laws.
This presentation and any oral statements made in connection with it are for informational purposes only and do not
constitute an offer to buy or sell our securities. For more complete information about us, you should read the information
in this presentation together with our filings with the SEC, which may be accessed at the SEC’s website
(http://www.sec.gov).

3
Q3 2019 SUMMARY
Improving performance
► Time charter equivalent revenues of $6.2 million*, up 140% from Q3 ‘18
►Net loss of $0.8 million, or $0.04 loss per share, basic and diluted
►Adjusted EBITDA ** of $2.1 million vs negative $1.5 million in Q3 ’18
►Continued discipline with total operational costs, but higher interest burden
►As of November 11th, four vessels are contracted under staggered TCs – 57% days
covered for balance of FY19 (to earliest re-delivery, excluding options); Avg. MR2
gross TC rate of ~ $15.3K/day
►At September 30, 2019 net funded debt / total capitalization of 60%
Sector fundamentals continue to firm
►Charter rates continue positive trend
►MR2 tanker orderbook still historically low and declining
►Due to positive sector supply/demand fundamentals and upcoming new IMO
regulations on fuel, we expect a sustainable improvement in charter rates
►Acquisitions of second-hand MR2 tankers remain attractive with vessel prices at or
below 10 year averages
Q3 2019 Financial &
Operational
Highlights
MR2 Product Tanker
Market Update
* Time charter equivalent (“TCE”) revenues are Revenues, net less voyage related costs and commissions; please see Exhibit II – Definitions
** Please see Exhibit I – Non-GAAP Measures

4
FLEET & EMPLOYMENT OVERVIEWPOSITIONED FOR UPSIDE OPPORTUNITIES
Fle
et
De
tails
Fle
et
Em
plo
ym
en
t O
ve
rvie
w
Our mixed chartering strategy provides upside opportunities through spot trading when rates improve and
stable, visible cash flows from time charters
Current Charter
Vessel ShipyardVessel
Type
Carrying
Capacity
(dwt)
Year BuiltType of
Charter
Charter
rate (1)Earliest
Redelivery Date
Pyxis Epsilon (2) SPP / S.Korea MR 50,295 2015 Time $15,350 March 2020
Pyxis Theta (2) SPP / S.Korea MR 51,795 2013 Time $15,375 May 2020
Pyxis Malou SPP / S.Korea MR 50,667 2009 Time $15,500 April 2020
Pyxis Delta Hyundai / S.Korea MR 46,616 2006 Time $14,500 November 2019
Northsea Alpha (3) Kejin / China Small Tanker 8,615 2010 Spot n/a n/a
Northsea Beta (3) Kejin / China Small Tanker 8,647 2010 Spot n/a n/a
Total 216,635Avg. Age
9 Years
57% of the remaining days of 2019 & 18% of 2020, are covered, exclusive of charters’ options
(1) These tables are dated as of November 11th , 2019 and show gross rates and do not reflect commissions payable.
(2) Pyxis Theta & Pyxis Epsilon have granted the charterer an option to extend the one year time charter for an additional 12 months (+/- 30 days) at a gross charter rate of $17,500/d.
(3) Management pursuing sale or other long-term strategy for small tankers.
Vessel
Oct Dec Jan Feb Apr May June July Aug Sept
Pyxis Epsilon
Pyxis Theta
Pyxis Malou
Pyxis Delta
Northsea Alpha
Northsea Beta
Nov
Fixed Employment Charterers Optional Period Spot Employment Open Days
Mar
2019 2020
MARKET UPDATEPRODUCT TANKER INDUSTRY

6
MR2 PRODUCT TANKER MARKET UPDATERECENT CHARTERING CONDITIONS
Chartering Market – Positive Momentum
► Overall improvement since depressed industry conditions of Q3, 2018
► Until recently, lackluster spot charter market in 2019, while time charter rates
have steadily improved with widening modern Eco-premium:
• MR2 spot voyages YTD averaged ~ $10.4K/d (TCE basket) but October
sharp rise
• Better rates in period market with one year time charter ~$16K/d for
standard MR which is higher than 7 year average of $14.6K/d*
• Eco-premium - up to $2.5K/d for young MR2
► Recent choppy conditions now leading towards better times:
• Slowing demand growth for refined petroleum products due to lower
global economic activity
• Seasonal (historical) softness of summer months
• Significant new product tankers deliveries in 2019 but very low thereafter
• Longer than normal refinery maintenance programs, which temporarily
reduce available cargoes, have concluded resulting in higher refinery
throughput
• Inventories of refined products worldwide at or below 5 year averages
* Source: Clarksons, September 2019
Improving
Chartering
Environment

7
Solid Demand Growth Expected
► Demand growth estimated at 3%/yr. led by increasing global consumption of
refined products and modest ton-mile expansion from changing refinery
landscape and trade patterns; high historical correlation to global GDP growth
which has been revised by IMF (October 2019) to average 3.2% / yr. thru 2020
► Q4 seasonal uplift due to greater home heating oil cargoes in northern
hemisphere and winter weather delays
► Positive impact to MR2 sector due to worldwide introduction of Low Sulphur
Fuel Oil (“LSFO”) regulations in January, 2020 which should result in incremental
demand
Moderating Vessel Supply
► Declining MR2 order book
► Low new ordering with limited capacity additions scheduled beyond 2020
► Slippage still a factor for MR2 newbuild deliveries – 17.9% recorded in 2018*
► Currently low demolition levels but increased scrapping likely over long-term as
6%* of global fleet or 102 MR2 are 20 yrs old or more
► New environmental regulations for ballast water treatment upgrade (starting
September 2019) and installation of scrubbers should require significant
additional capital expenditures/ship and more dry-docking days
► Higher bunker fuel prices starting 2020 should result in some slow steaming on
ballast legs, effectively reducing capacity
Constrained Capital Environment
► Access to flexible, cost effective capital continues to be challenging and further
limits new vessel ordering
MR2 PRODUCT TANKER MARKET UPDATE - continuedLOOKING AHEAD
* Source: Drewry – September 2019, excludes Jones Act vessels
Attractive Long-
term Industry
Fundamentals
with IMO 2020
Catalyst
8
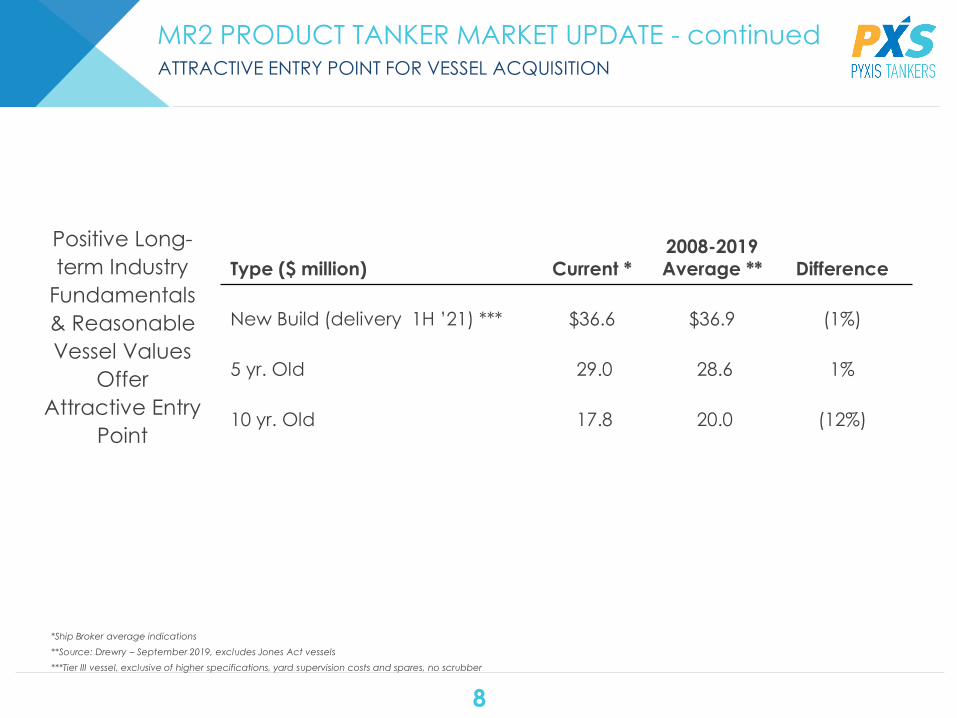
MR2 PRODUCT TANKER MARKET UPDATE - continuedATTRACTIVE ENTRY POINT FOR VESSEL ACQUISITION
*Ship Broker average indications
**Source: Drewry – September 2019, excludes Jones Act vessels
***Tier III vessel, exclusive of higher specifications, yard supervision costs and spares, no scrubber
Positive Long-
term Industry
Fundamentals
& Reasonable
Vessel Values
Offer
Attractive Entry
Point
Type ($ million) Current *2008-2019 Average ** Difference
New Build (delivery 1H ’21) *** $36.6 $36.9 (1%)
5 yr. Old 29.0 28.6 1%
10 yr. Old 17.8 20.0 (12%)

PYXIS TANKERSFINANCIAL SUMMARY – THREE & NINE MONTHS ENDED SEPTEMBER 30, 2019

10
UNAUDITED FINANCIAL HIGHLIGHTSTHREE & NINE MONTHS ENDED SEPTEMBER 30, 2018 & 2019
Overall
Improvement due
to Higher T/C Rates
for the MRs and
Greater Utilization
Nine Months EndedSeptember 30,
Three Months endedSeptember 30,
2018 2019 2018 2019
In ‘000 USD except for daily TCE rates
Time / spot charter revenue mix 44% / 56% 69% / 31% 16% / 84% 74% / 26%
Revenues, net $20,982 $20,493 $7,415 $7,313
Voyage related costs & commissions (8,783) (4,059) (4,844) (1,133)
Time charter equivalent revenues * $12,199 $16,434 $2,571 $6,180
Total operating days1,355 1,424 431 500
Daily time charter equivalent rate *$9,003 $11,540 $5,967 $12,360
Fleet Utilization 84.6% 88.4% 80.1% 90.6%
* Subject to rounding; Please see Exhibit II –Definitions

11
Nine Months EndedSeptember 30,
Three Months EndedSeptember 30,
2018 2019 2018 2019
In ‘000 USD except per share data
Revenues, net $20,982 $20,493 $7,415 $7,313
Expenses:
Voyage related costs and commissions (8,783) (4,059) (4,844) (1,133)
Vessel operating expenses (9,468) (9,465) (3,130) (3,063)
General and administrative expenses (1,793) (1,778) (546) (591)
Management fees, related parties (538) (542) (181) (183)
Management fees, other (697) (697) (232) (232)
Amortization of special survey costs (88) (188) (33) (71)
Depreciation (4,119) (4,086) (1,381) (1,381)
Vessel impairment charge (1,543) - - -
Bad debt provisions (13) (26) 2 -
Operating (loss) / income (6,060) (348) (2,930) 659
Other (expenses) / income:
Gain from debt extinguishment 4,306 - - -
Gain / (Loss) from financial derivative instruments 12 (27) 5 (2)
Interest and finance costs, net (3,032) (4,374) (1,196) (1,469)
Net loss ($4,774) ($4,749) ($4,121) ($812)
Loss per share (basic & diluted) ($0.23) ($0.23) ($0.20) ($0.04)
Adjusted EBITDA* $(310) $3,926 $(1,516) $2,111
UNAUDITED INCOME STATEMENTTHREE & NINE MONTHS ENDED SEPTEMBER 30, 2018 & 2019
Improving 2019
Results –
Greater TCE
Revenues
which more
than Offset
Higher Interest
Costs
* Please see Exhibit I – Non-GAAP Measures

12
(amounts in $)Nine Months Ended
September 30,Three Months Ended
September 30,
2018 2019 2018 2019
Eco-Efficient MR2: (2 of our vessels)
Average TCE * 10,303 14,185 4,150 15,193
Opex * 6,044 5,768 6,399 5,762
Utilization % 90.2% 100.0% 82.9% 100.0%
Eco-Modified MR2: (1 of our vessels)
TCE 11,925 13,046 12,143 13,432
Opex ** 6,435 6,894 5,779 6,236
Utilization % 86.9% 98.8% 92.4% 100.0%
Standard MR2: (1 of our vessels)
TCE 9,019 12,867 4,737 13,934
Opex 5,893 5,926 6,017 5,860
Utilization % 94.5% 99.6% 87.0% 98.9%
Small Tankers: (2 of our vessels)Average TCE 5,831 5,581 4,603 6,621
Opex 5,133 5,156 4,715 4,836
Utilization % 73.1% 66.7% 67.9% 72.3%
Fleet: (6 of our vessels)
TCE 9,003 11,540 5,967 12,360
Opex 5,780 5,778 5,670 5,549
Utilization % 84.6% 88.4% 80.1% 90.6%
RECENT DAILY FLEET DATATHREE & NINE MONTHS ENDED SEPTEMBER 30, 2018 & 2019
Overall
Improvement in
TCEs &
Utilization; Opex
Remained
Stable
* Please see Exhibit II – Definitions
** Pyxis Malou completed her special survey during Q1 2019

13
TOTAL DAILY CASH OPERATIONAL COSTSECO-EFFICIENT VESSELS - THREE & NINE MONTHS ENDED SEPTEMBER 30, 2019
Our Eco Efficient
MR2 tankers’
Total Daily
Operational
Costs Continue to
be Stable and
Competitive
Nine Months EndedSeptember 30, 2019
Three Months EndedSeptember 30, 2019
(amounts in $/day)
Opex $5,768 $5,762
Technical & commercial management fees 757 752
G&A expenses 1,076 1,025
Total daily operational costs per vessel $7,601 $7,539
* Please see Exhibit II - Definitions
14
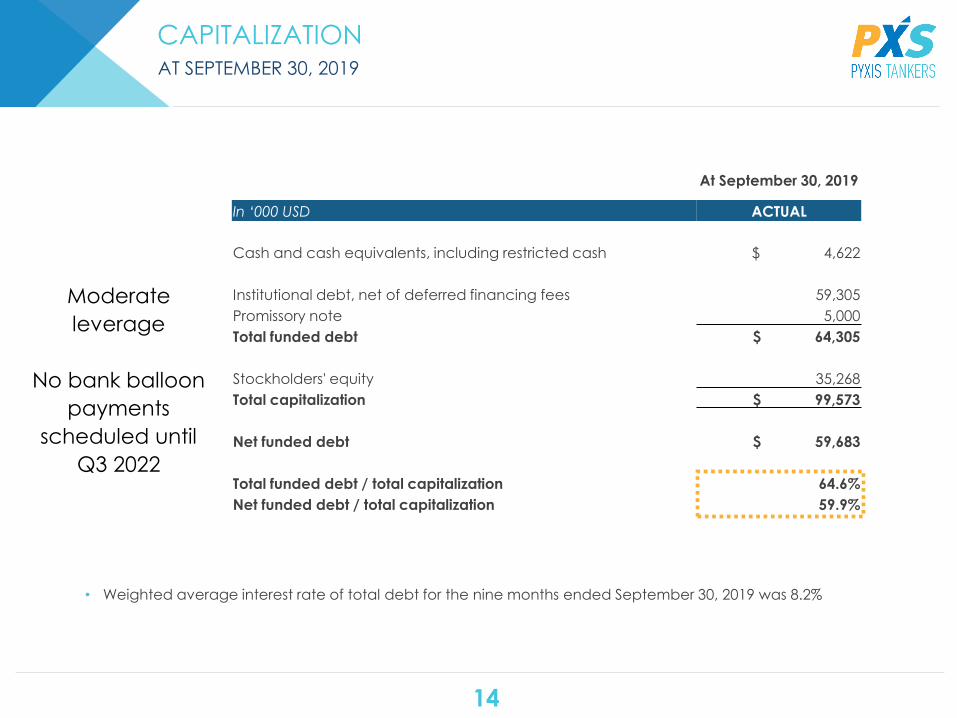
At September 30, 2019
In ‘000 USD ACTUAL
Cash and cash equivalents, including restricted cash $ 4,622
Institutional debt, net of deferred financing fees 59,305
Promissory note 5,000
Total funded debt $ 64,305
Stockholders' equity 35,268
Total capitalization $ 99,573
Net funded debt $ 59,683
Total funded debt / total capitalization 64.6%
Net funded debt / total capitalization 59.9%
CAPITALIZATIONAT SEPTEMBER 30, 2019
• Weighted average interest rate of total debt for the nine months ended September 30, 2019 was 8.2%
Moderate
leverage
No bank balloon
payments
scheduled until
Q3 2022

15
COMPANYEMERGING GROWTH - PURE PLAY PRODUCT TANKER COMPANY
► Focus on modern medium range (“MR”) product tankers with “eco” features
►Modern tanker fleet of six IMO-certified vessels - weighted average age of ~8.7 years
►Management pursuing sale or other long-term strategy for small tankers
Growth Oriented
with Attractive,
Modern Fleet
► Long-standing relationships with first-class customers worldwide
►All MRs currently fixed under TCs; small tankers in spot market
►57% of remaining available days in 2019 booked (to earliest re-delivery date and exclusive
of options); average MR rate $15.3K/day
►Positioned to capitalize when charter rates improve
Reputable Customer
Base & Diversified
Chartering Strategy
►Disciplined, substantially fixed cost structure creates opportunity for greater earnings power
when rates improve
►Competitive total daily operational costs to peer group
►Moderate capitalization with long-lived debt
Stable, Competitive
Cost Structure &
Moderate
Capitalization
► Strong mgmt. team with 90+ years of combined industry and capital markets experience
► Founder/CEO has proven track record and is a major shareholder
►Board members consist of respected industry figures with significant experience
Experienced,
Incentivized
Management
& Prominent Board
►Historically low and rapidly declining MR2 orderbook
► IMF’s global average annual growth of 3.2% should result in demand outpacing net supply
growth through 2020
►New environmental regulations, led by IMO 2020, should be positive for MR2 sector with
incremental demand combined with lower available capacity
Favorable Industry
Fundamentals +
IMO 2020 Create
Attractive Entry
Point

NON-GAAP MEASURESEXHIBIT I

17
EXHIBIT I | NON-GAAP MEASURES
(in thousands of U.S. Dollars)
Nine Months EndedSeptember 30,
Three Months Ended September 30,
2018 2019 2018 2019
Reconciliation of Net loss to Adjusted EBITDA
Net loss $ (4,774) $ (4,749) $ (4,121) $ (812)
Depreciation 4,119 4,086 1,381 1,381
Amortization of special survey costs 88 188 33 71
Interest and finance costs, net 3,032 4,374* 1,196 1,469*
EBITDA $ 2,465 $ 3,899 $ (1,511) $ 2,109
Vessel impairment charge 1,543 - - -
Gain from debt extinguishment (4,306) - - -
(Gain) / Loss from financial derivative instrument (12) 27 (5) 2
Adjusted EBITDA $ (310) $ 3,926 $ (1,516) $ 2,111
* Includes non-cash interest expense for the nine and three month periods of $113 and $57, respectively,
associated with the Promissory Note.

DEFINITIONSEXHIBIT II
19
EXHIBIT II | DEFINITIONS
Earnings before interest, taxes, depreciation and amortization (“EBITDA”) represents the sum of net income / (loss), interest and finance costs,
depreciation and amortization and, if any, income taxes during a period. Adjusted EBITDA represents EBITDA before certain non-operating or
non-recurring charges, such as, vessel impairment charges, gain from debt extinguishment and stock compensation. EBITDA and Adjusted
EBITDA are not recognized measurements under U.S. GAAP. EBITDA and Adjusted EBITDA are presented as we believe that they provide
investors with means of evaluating and understanding how our management evaluates operating performance. These non-GAAP measures
should not be considered in isolation from, as substitutes for, or superior to financial measures prepared in accordance with U.S. GAAP. In
addition, these non-GAAP measures do not have standardized meanings, and are therefore, unlikely to be comparable to similar measures
presented by other companies. EBITDA and Adjusted EBITDA do not reflect cash requirements for capital expenditures or debt service, nor
changes in working capital.
Daily time charter equivalent (“TCE”) rate is a standard shipping industry performance measure of the average daily revenue performance of a
vessel on a per voyage basis. TCE is not calculated in accordance with U.S. GAAP. We utilize TCE because we believe it is a meaningful
measure to compare period-to-period changes in our performance despite changes in the mix of charter types (i.e., spot charters, time
charters and bareboat charters) under which our vessels may be employed between the periods. Our management also utilizes TCE to assist
them in making decisions regarding employment of the vessels. We calculate TCE by dividing voyage revenues after deducting voyage related
costs and commissions by operating days for the relevant period. Voyage related costs and commissions primarily consist of brokerage
commissions, port, canal and fuel costs that are unique to a particular voyage, which would otherwise be paid by the charterer under a time
charter contract.
Vessel operating expenses (“Opex”) per day are our vessel operating expenses for a vessel, which primarily consist of crew wages and related
costs, insurance, lube oils, communications, spares and consumables, tonnage taxes as well as repairs and maintenance, divided by the
ownership days in the applicable period.
We define total daily operational costs as vessel Opex, technical and commercial management fees plus allocable general and administrative
expenses, applied on a daily basis, typically in comparison of our eco-efficient and eco-modified MR’s. These costs can vary period to period
by fleet composition, vessel delivery, operating structure, management organization and dry-dockings.
We calculate fleet utilization (“Utilization”) by dividing the number of operating days during a period by the number of available days during
the same period. We use fleet utilization to measure our efficiency in finding suitable employment for our vessels and minimizing the amount of
days that our vessels are off-hire for reasons other than scheduled repairs or repairs under guarantee, vessel upgrades, special surveys and
intermediate dry-dockings or vessel positioning. Ownership days are the total number of days in a period during which we owned each of the
vessels in our fleet. Ownership days are an indicator of the size of our fleet over a period and affect both the amount of revenues generated
and the amount of expenses incurred during the respective period. Available days are the number of ownership days in a period, less the
aggregate number of days that our vessels were off-hire due to scheduled repairs or repairs under guarantee, vessel upgrades or special
surveys and intermediate dry-dockings and the aggregate number of days that we spent positioning our vessels during the respective period
for such repairs, upgrades and surveys. Available days measures the aggregate number of days in a period during which vessels should be
capable of generating revenues. Operating days are the number of available days in a period, less the aggregate number of days that our
vessels were off-hire or out of service due to any reason, including technical breakdowns and unforeseen circumstances. Operating days
measures the aggregate number of days in a period during which vessels actually generate revenues.

20
CONTACT
Pyxis Tankers Inc.
K.Karamanli 59
Maroussi 15125, Greece
Email: [email protected]
www.pyxistankers.com
Henry Williams
CFO & Treasurer
Phone: +1 516 455 0106/ +30 210 638 0200
Email: [email protected]


