
Q1 Q2 Q3 Q4 Q4 Q3 Q2 Q1 Q1 Q2 Q3 Q4
Q4 Q3 Q2 Q1 Q1 Q2 Q3 Q4 Q4 Q3 Q2 Q1
Q3 Q2 Q1 Q1 Q2 Q3 Q4 Q4 Q3 Q2 Q1
Q2 Q3 Q4 Q4 Q3 Q2 Q1 Q1 Q2 Q3 Q4A Greentech Media Company
U.S. SOLAR MARKET INSIGHTREPORT | Q1 2014 | EXECUTIVE SUMMARY

U.S. Solar Market Insight Report Introduction
© 2014, Greentech Media, Inc. and Solar Energy Industries Association. All Rights Reserved │ 2
U.S. Solar Market Insight® is a quarterly publication of GTM Research and the Solar EnergyIndustries Association (SEIA)®. Each quarter, we collect granular data on the U.S. solar market from nearly200 utilities, state agencies, installers, and manufacturers. This data provides the backbone of this U.S. SolarMarket Insight® report, in which we identify and analyze trends in U.S. solar demand, manufacturing, andpricing by state and market segment. We also use this analysis to look forward and forecast demand over thenext five years. All forecasts are from GTM Research; SEIA does not predict future pricing, bid terms, costs,deployment or supply.
* References, data, charts or analysis from this executive summary should be attributed to “GTM Research/SEIA: U.S.Solar Market Insight®.”
* Media inquiries should be directed to Mike Munsell ([email protected]) at GTM Research and Ken Johnson([email protected]) at SEIA.
* All figures are sourced from GTM Research. For more detail on methodology and sources, visitwww.gtmresearch.com/solarinsight.
Our coverage in the U.S. Solar Market Insight reports include 30 individual states and Washington, D.C.However, the national totals reported include all 50 states, Washington, D.C., and Puerto Rico.
Detailed data and forecasts for all 30 states are contained within the full version of this report, available atwww.greentechmedia.com/research/ussmi.
AUTHORS
GTM Research
Shayle Kann, Senior Vice President
MJ Shiao, Director
Shyam Mehta, Lead Upstream Analyst
Cory Honeyman, Solar Analyst
Nicole Litvak, Solar Analyst
Jade Jones, Solar Analyst
SEIA
Justin Baca, Director of Research
Shawn Rumery, Research Manager
Aaron Holm, Research Analyst
U.S. Solar Market Insight Report Introduction
© 2014, Greentech Media, Inc. and Solar Energy Industries Association. All Rights Reserved │ 3
1. IntroductionThe U.S. solar market continued to expand in the first quarter of 2014. Photovoltaic (PV) installations reached1,330 MWdc in Q1, up 79% over the same quarter in 2013. The utility PV market was responsible for the lion’sshare of this growth, installing 873 MWdc in Q1 2014, up from 322 MWdc in Q1 2013. We expect this segmentto fuel growth throughout the year, and our forecast calls for nearly 3.8 gigawatts (GWdc) of utility PV to beconnected to the grid by December 31. To put this in context, 3.8 GWdc is more utility solar capacity than wasinstalled in the entire history of the market through 2012. The pipeline of projects that were announced andcontracted from 2010-2012 is coming to fruition now, and newer markets such as North Carolina areproviding a valuable supplement to the incumbent states of California, Arizona, and Nevada. The U.S. alsocompleted 517 MWac of concentrating solar power (CSP) in Q1 2014, more than was installed in all of 2013.
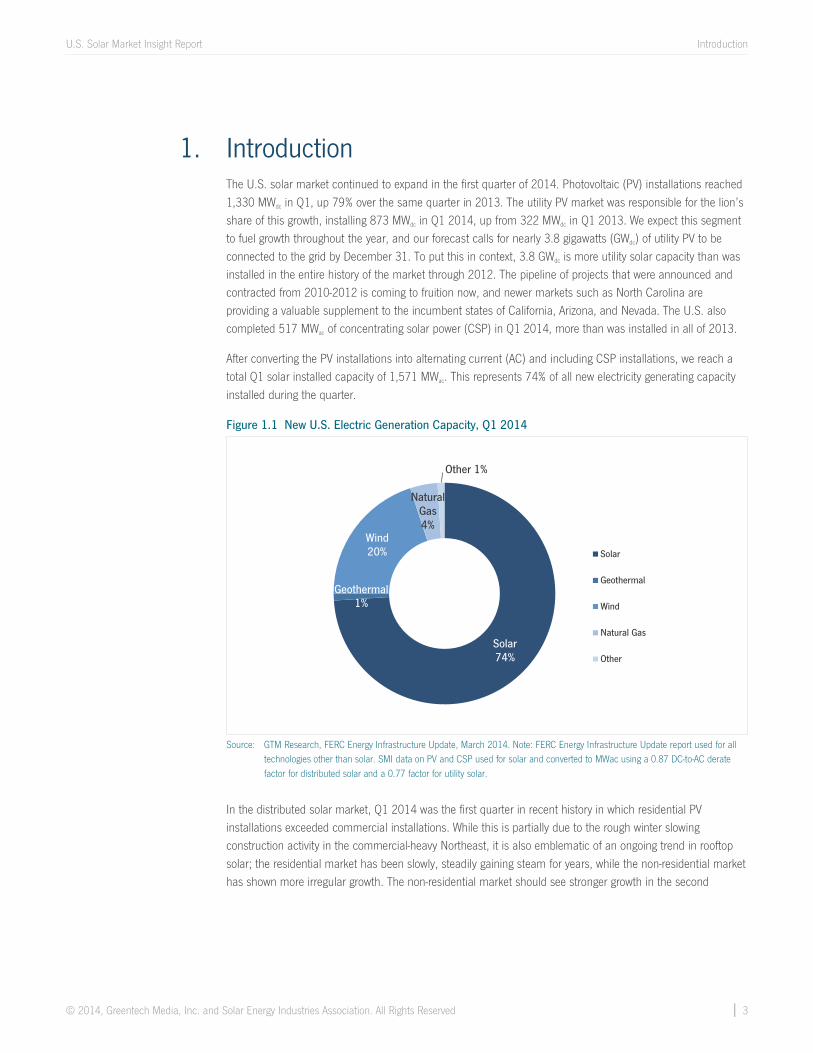
After converting the PV installations into alternating current (AC) and including CSP installations, we reach atotal Q1 solar installed capacity of 1,571 MWac. This represents 74% of all new electricity generating capacityinstalled during the quarter.
Figure 1.1 New U.S. Electric Generation Capacity, Q1 2014
Source: GTM Research, FERC Energy Infrastructure Update, March 2014. Note: FERC Energy Infrastructure Update report used for alltechnologies other than solar. SMI data on PV and CSP used for solar and converted to MWac using a 0.87 DC-to-AC deratefactor for distributed solar and a 0.77 factor for utility solar.
In the distributed solar market, Q1 2014 was the first quarter in recent history in which residential PVinstallations exceeded commercial installations. While this is partially due to the rough winter slowingconstruction activity in the commercial-heavy Northeast, it is also emblematic of an ongoing trend in rooftopsolar; the residential market has been slowly, steadily gaining steam for years, while the non-residential markethas shown more irregular growth. The non-residential market should see stronger growth in the second
Solar74%
Geothermal1%
Wind20%
NaturalGas4%
Other 1%
Solar
Geothermal
Wind
Natural Gas
Other

U.S. Solar Market Insight Report Introduction
© 2014, Greentech Media, Inc. and Solar Energy Industries Association. All Rights Reserved │ 4
quarter, once again overtaking residential installations, but our forecast now reflects our view that theresidential market will be larger than the non-residential market on an annual basis as soon as 2016.
Of course, there are risks on both sides of our market forecasts. The downside risk in the residential marketremains net energy metering and electricity rate structure reform. Although early outcomes in thesebattlegrounds have been largely favorable for the solar market, we would be remiss to assume that the futurewill resemble the past. There are more than twenty states with some form of net energy metering legislation orregulation currently in process, and we will be monitoring each one closely. On the non-residential side, thereis upside potential in the opportunity to solve a longstanding barrier to growth: the difficulty in financingsmaller commercial projects (<250 kWdc). This market has always had massive potential but has suffered fromcapital constraints; however, there are a number of possible solutions being commercialized today.
Overall, the U.S. solar market is off to a strong start in 2014. Despite some headwinds (which might better bedescribed as strong breezes), we anticipate another year of significant growth. We forecast that 6.6 GWdc of PVwill be installed this year, up 39% over 2013 and nearly double the market size in 2012. Aside from the 517MWac of CSP already brought on-line, an additional 340 MWac of CSP should be completed by the end of theyear, making 2014 the largest single year of CSP installations in history.
President Obama has repeatedly highlighted the statistic from this report series that a solar installation in theU.S. is completed every four minutes. If our forecast is accurate, the true rate in 2014 will be a completedsolar installation every 2.4 minutes.
U.S. Solar Market Insight Report Introduction
© 2014, Greentech Media, Inc. and Solar Energy Industries Association. All Rights Reserved │ 5
Key Figures
The U.S. installed 1,330 MWdc of solar PV in Q1 2014, up 79% over Q1 2013, making it the second-largestquarter for solar installations in the history of the market.
Cumulative operating PV capacity stood at 13,395 MWdc, with 482,000 individual systems on-line as of theend of Q1 2014.
Growth was driven primarily by the utility solar market, which installed 873 MWdc in Q1 2014, up from 322MWdc in Q1 2013.
Q1 2014 was the first time residential PV installations exceeded non-residential (commercial) installationsnationally since 2002.
For the first time ever, more than 1/3 of residential PV installations came on-line without any stateincentive in Q1 2014.
Q1 2014 saw school, government, and nonprofit PV installations add more than 100 MWdc for the secondstraight quarter.
74% of new electric generating capacity in the U.S. in Q1 2014 came from solar.
We forecast that PV installations will reach 6.6 GWdc in 2014, up 39% over 2013 and nearly double themarket size in 2012.
Q1 2014 was the largest quarter ever for concentrating solar power due to the completion of the 392 MWac
Ivanpah project and Genesis Solar project’s second 125 MWac phase. With a total of 857 MWac expected tobe completed by year’s end, 2014 will likely be the largest year for CSP in history.
Cumulative operating CSP capacity was 1,435 MWac as of the end of Q1 2014.
U.S. Solar Market Insight Report Photovoltaics
© 2014, Greentech Media, Inc. and Solar Energy Industries Association. All Rights Reserved │ 6
2. Photovoltaics2.1. Installations
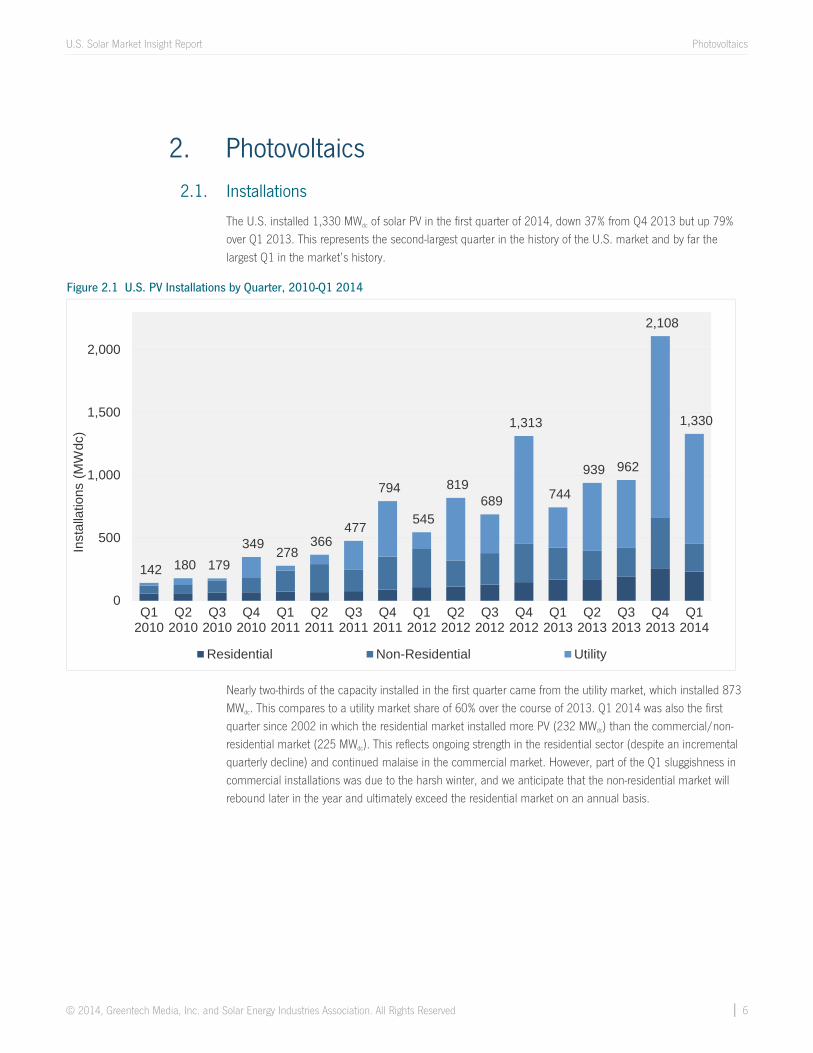
The U.S. installed 1,330 MWdc of solar PV in the first quarter of 2014, down 37% from Q4 2013 but up 79%over Q1 2013. This represents the second-largest quarter in the history of the U.S. market and by far thelargest Q1 in the market’s history.
Figure 2.1 U.S. PV Installations by Quarter, 2010-Q1 2014
Nearly two-thirds of the capacity installed in the first quarter came from the utility market, which installed 873MWdc. This compares to a utility market share of 60% over the course of 2013. Q1 2014 was also the firstquarter since 2002 in which the residential market installed more PV (232 MWdc) than the commercial/non-residential market (225 MWdc). This reflects ongoing strength in the residential sector (despite an incrementalquarterly decline) and continued malaise in the commercial market. However, part of the Q1 sluggishness incommercial installations was due to the harsh winter, and we anticipate that the non-residential market willrebound later in the year and ultimately exceed the residential market on an annual basis.
142 180 179349
278366
477
794
545
819689
1,313
744
939 962
2,108
1,330
0
500
1,000
1,500
2,000
Q12010
Q22010
Q32010
Q42010
Q12011
Q22011
Q32011
Q42011
Q12012
Q22012
Q32012
Q42012
Q12013
Q22013
Q32013
Q42013
Q12014
Inst
alla
tions
(MW
dc)
Residential Non-Residential Utility
U.S. Solar Market Insight Report Photovoltaics
© 2014, Greentech Media, Inc. and Solar Energy Industries Association. All Rights Reserved │ 7
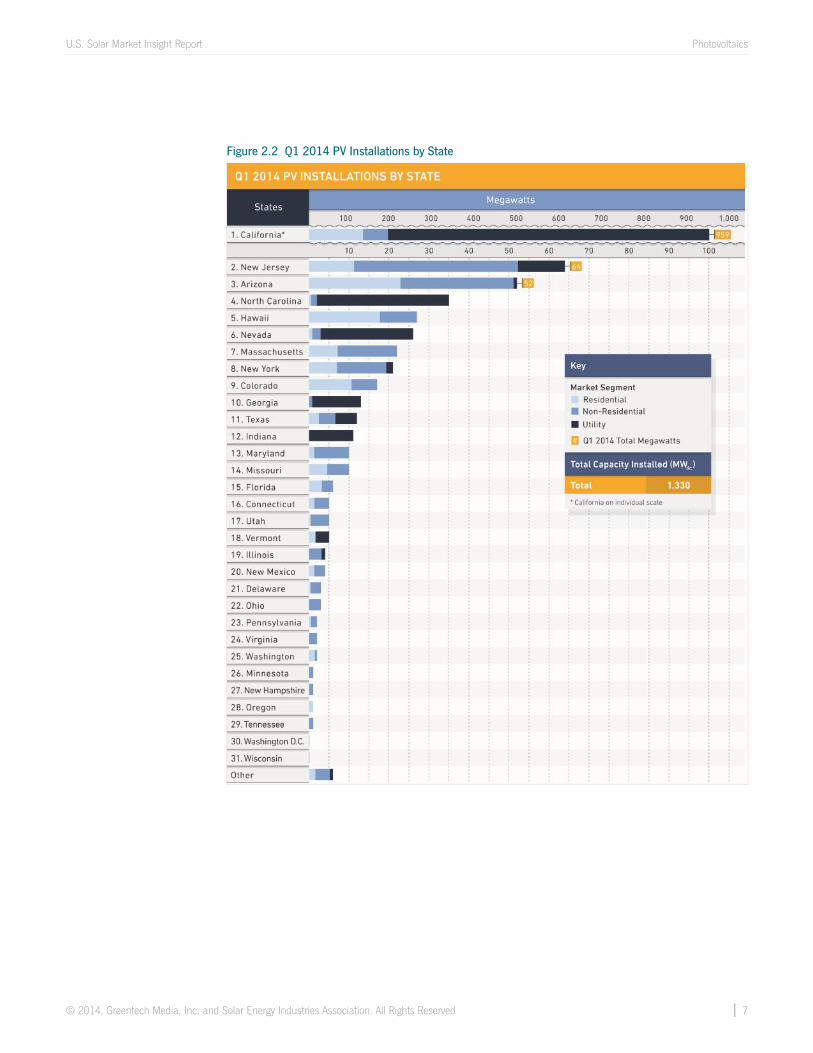
Figure 2.2 Q1 2014 PV Installations by State
U.S. Solar Market Insight Report Photovoltaics
© 2014, Greentech Media, Inc. and Solar Energy Industries Association. All Rights Reserved │ 8
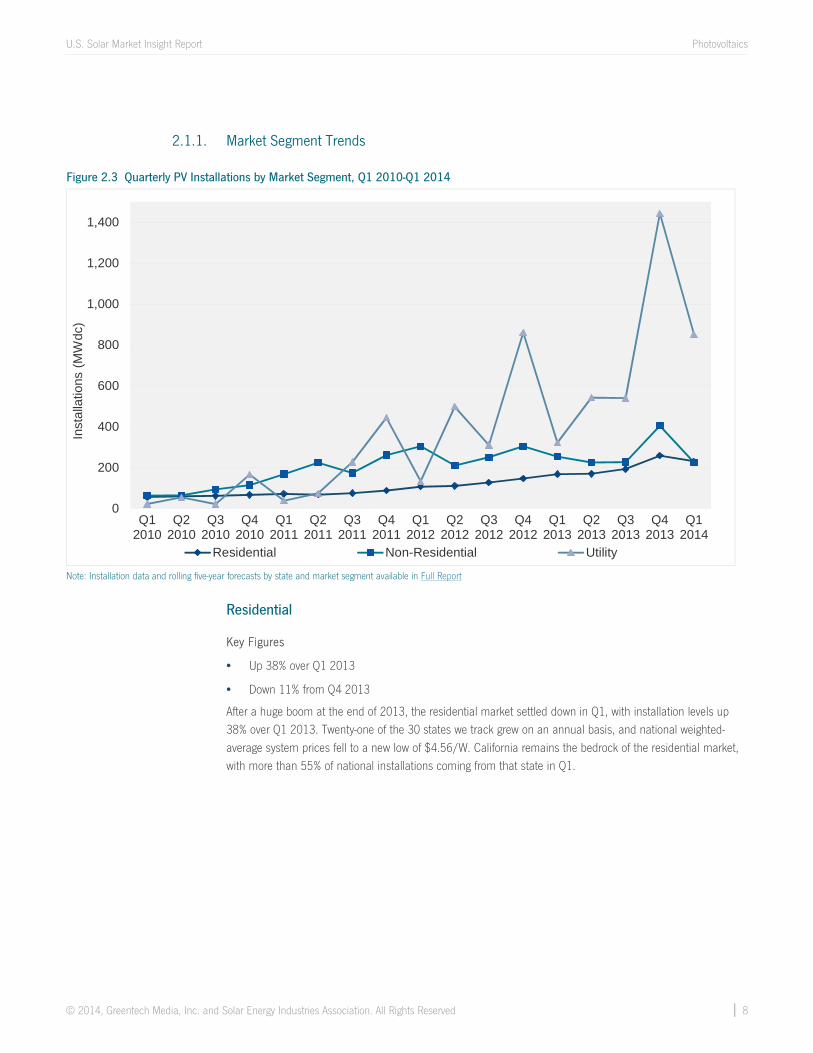
2.1.1. Market Segment Trends
Figure 2.3 Quarterly PV Installations by Market Segment, Q1 2010-Q1 2014
Note: Installation data and rolling five-year forecasts by state and market segment available in Full Report
Residential
Key Figures
Up 38% over Q1 2013
Down 11% from Q4 2013
After a huge boom at the end of 2013, the residential market settled down in Q1, with installation levels up38% over Q1 2013. Twenty-one of the 30 states we track grew on an annual basis, and national weighted-average system prices fell to a new low of $4.56/W. California remains the bedrock of the residential market,with more than 55% of national installations coming from that state in Q1.
0
200
400
600
800
1,000
1,200
1,400
Q12010
Q22010
Q32010
Q42010
Q12011
Q22011
Q32011
Q42011
Q12012
Q22012
Q32012
Q42012
Q12013
Q22013
Q32013
Q42013
Q12014
Inst
alla
tions
(MW
dc)
Residential Non-Residential Utility
U.S. Solar Market Insight Report Photovoltaics
© 2014, Greentech Media, Inc. and Solar Energy Industries Association. All Rights Reserved │ 9
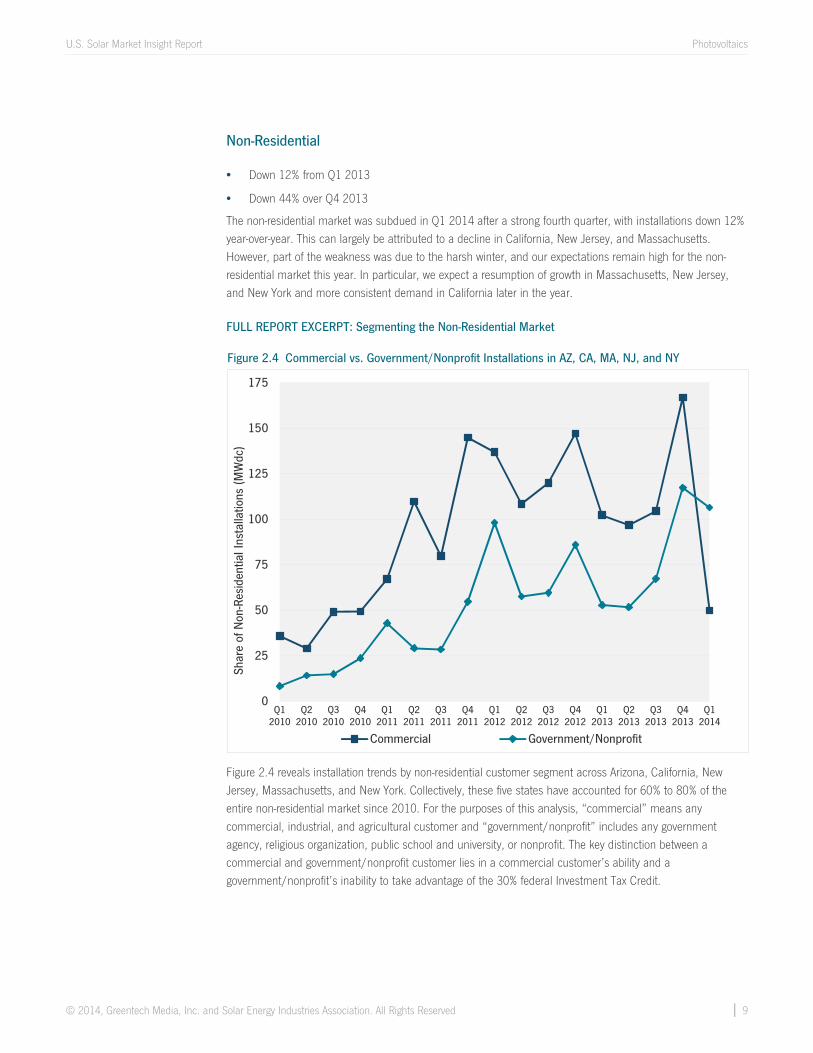
Non-Residential
Down 12% from Q1 2013
Down 44% over Q4 2013
The non-residential market was subdued in Q1 2014 after a strong fourth quarter, with installations down 12%year-over-year. This can largely be attributed to a decline in California, New Jersey, and Massachusetts.However, part of the weakness was due to the harsh winter, and our expectations remain high for the non-residential market this year. In particular, we expect a resumption of growth in Massachusetts, New Jersey,and New York and more consistent demand in California later in the year.
FULL REPORT EXCERPT: Segmenting the Non-Residential Market
Figure 2.4 Commercial vs. Government/Nonprofit Installations in AZ, CA, MA, NJ, and NY
Figure 2.4 reveals installation trends by non-residential customer segment across Arizona, California, NewJersey, Massachusetts, and New York. Collectively, these five states have accounted for 60% to 80% of theentire non-residential market since 2010. For the purposes of this analysis, “commercial” means anycommercial, industrial, and agricultural customer and “government/nonprofit” includes any governmentagency, religious organization, public school and university, or nonprofit. The key distinction between acommercial and government/nonprofit customer lies in a commercial customer’s ability and agovernment/nonprofit’s inability to take advantage of the 30% federal Investment Tax Credit.
0
25
50
75
100
125
150
175
Q12010
Q22010
Q32010
Q42010
Q12011
Q22011
Q32011
Q42011
Q12012
Q22012
Q32012
Q42012
Q12013
Q22013
Q32013
Q42013
Q12014
Shar
e of
Non
-Res
iden
tial I
nsta
llatio
ns (M
Wdc
)
Commercial Government/Nonprofit
U.S. Solar Market Insight Report Photovoltaics
© 2014, Greentech Media, Inc. and Solar Energy Industries Association. All Rights Reserved │ 10
As shown in Figure 2.4, for these top five non-residential state markets, growth rates for government/nonprofitinstallations significantly outpaced commercial installations in 2013 and Q1 2014. During the last two years,government/nonprofit installations grew year-over-year in all but two quarters, while commercial installationsonly grew year-over-year in Q3 2012 and Q4 2013. Unlike the residential market, which has increasinglystarted to operate independently of state incentives, non-residential installation trends remain primarily afunction of state incentive availability and market design. Looking out to the second half of 2014 (2H 2014),two state markets in particular present new development opportunities for small-scale government/nonprofit(Massachusetts) and large-scale commercial (New York).
Massachusetts: Beginning in 2H 2014, the second state SREC program will take effect and offer higherSREC production factors for projects of 650 kWdc or less and with solar carports, with demand for thelatter primarily being driven by large educational offtakers. Meanwhile, SREC II will limit annualdevelopment opportunities for commercial projects larger than 650 kWdc as part of a “managed growth”sector, capped at 26 MWdc in 2014.
New York: NYSERDA has restructured its next incentive program for non-residential PV projects above200 kWdc by condensing the number of incentive payment schemes from two upfront rebates and aproduction-based incentive (PBI) for the first three years of system production to one upfront rebate and aPBI for the first two years of production. Expect this incentive reform to ease large-scale commercialdevelopers’ access to financing by allowing them to monetize the upfront rebates with lower transactioncosts and capture all PBI payments one year sooner than was previously allowed.
Utility PV
873 MWdc installed in Q1 2014
Second-largest quarter ever for utility PV (ranking behind Q4 2013)
After a record-breaking 1.4 GWdc of utility PV installations came on-line in the final quarter of 2013, Q1 2014once again benefited from the full or partial completion of several mega-scale solar PV projects. This includedthe commercial operation of the 266 MWdc Mount Signal Solar Farm, co-developed by 8minutenergy and SilverRidge Power, which currently ranks as the fifth-largest PV project in operation to date in the U.S.
U.S. Solar Market Insight Report Photovoltaics
© 2014, Greentech Media, Inc. and Solar Energy Industries Association. All Rights Reserved │ 11
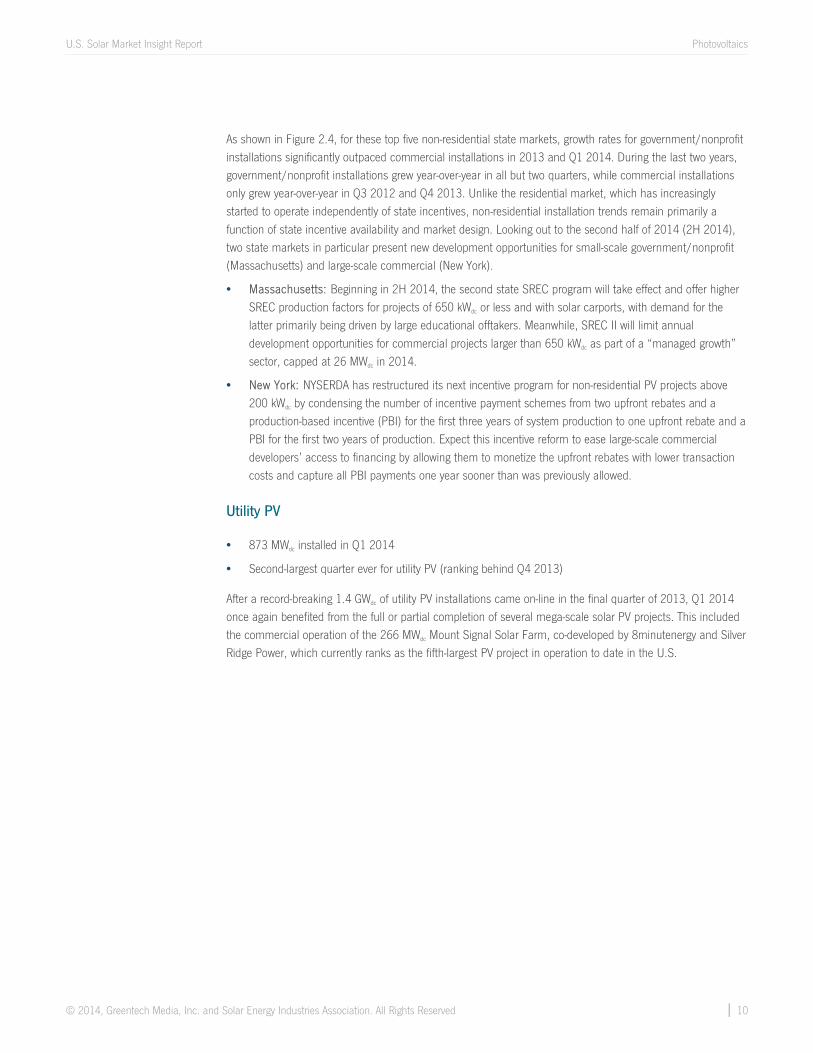
Figure 2.5 Utility PV Pipeline
Even more so than distributed solar, the utility PV market has seen significant installation growth concentratedin the final quarter of each year due to extended project development cycles and a rush to complete individuallarge-scale projects before year’s end to take advantage of the federal investment tax credit. But as Q1 2014’simpressive installation figure demonstrates, developers are in a full steam ahead approach to complete asmany projects as possible ahead of the impending reduction of the federal ITC on January 1, 2017. Whatremains uncertain is whether developers can continue to match their rate of pipeline replenishment with theirimpressive and expedited build rates.
While pipeline replenishment failed to keep pace with the gigawatt-level surge of installations completed at theend of 2013, the contracted pipeline has since jumped from 11.7 GWdc in Q4 2013 to 12.5 GWdc in Q1 2014.This rebound is primarily linked to factors such as developers’ ability to contract multiple PPAs for the sameproject in order to deliver power to utilities with pre- and post-2017 RPS obligations; diversification intosecondary markets such as Colorado, North Carolina, Georgia, and Texas; and utility PV’s ability to win PPAsas hedges against natural gas price volatility and as part of peak capacity solicitations that directly pit utility PVagainst natural gas projects.
6,684
27,895
3,444
0
5,000
10,000
15,000
20,000
25,000
30,000
Operating Contracted (PPA Signed) Announced (Pre-Contract)
Capa
city
(MW
dc)
In Construction
12,517
U.S. Solar Market Insight Report Photovoltaics
© 2014, Greentech Media, Inc. and Solar Energy Industries Association. All Rights Reserved │ 12
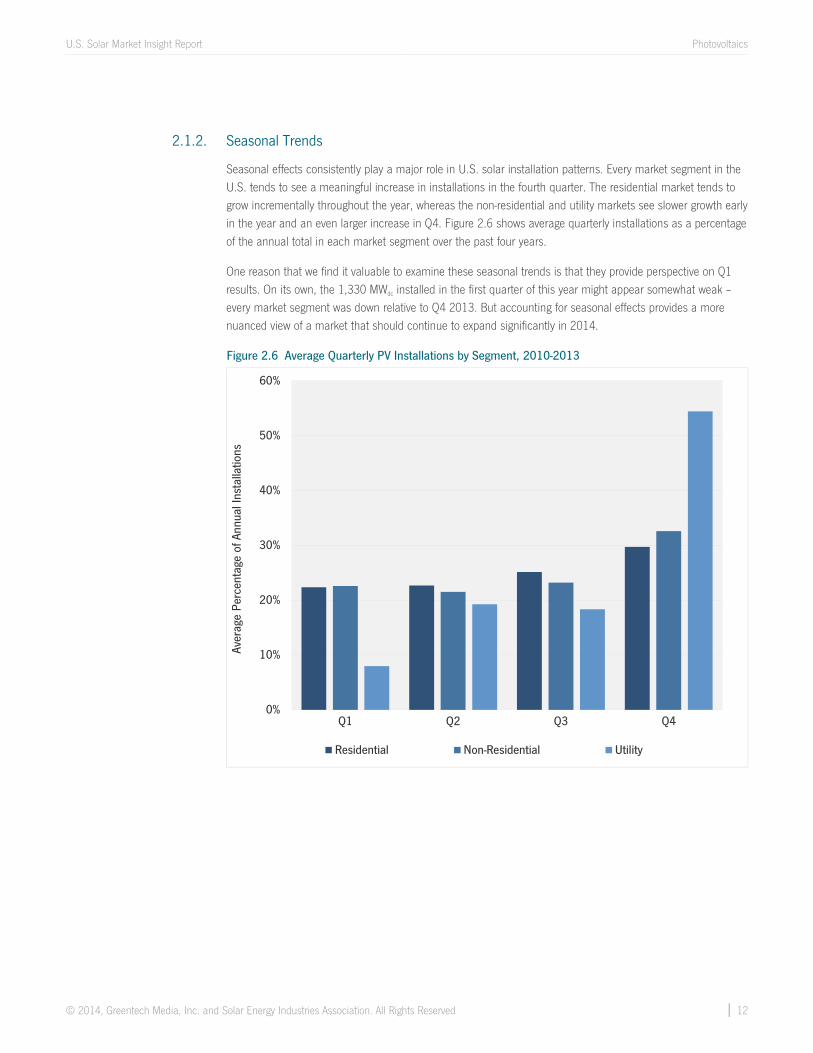
2.1.2. Seasonal Trends
Seasonal effects consistently play a major role in U.S. solar installation patterns. Every market segment in theU.S. tends to see a meaningful increase in installations in the fourth quarter. The residential market tends togrow incrementally throughout the year, whereas the non-residential and utility markets see slower growth earlyin the year and an even larger increase in Q4. Figure 2.6 shows average quarterly installations as a percentageof the annual total in each market segment over the past four years.
One reason that we find it valuable to examine these seasonal trends is that they provide perspective on Q1results. On its own, the 1,330 MWdc installed in the first quarter of this year might appear somewhat weak –every market segment was down relative to Q4 2013. But accounting for seasonal effects provides a morenuanced view of a market that should continue to expand significantly in 2014.
Figure 2.6 Average Quarterly PV Installations by Segment, 2010-2013
0%
10%
20%
30%
40%
50%
60%
Q1 Q2 Q3 Q4
Aver
age
Perc
enta
ge o
f Ann
ual I
nsta
llatio
ns
Residential Non-Residential Utility

U.S. Solar Market Insight Report Photovoltaics
© 2014, Greentech Media, Inc. and Solar Energy Industries Association. All Rights Reserved │ 13
2.2. National System Pricing
Starting this quarter, we have added bottom-up system cost modeling as a supplement to reported nationalsystem pricing. Our previous methodology used capacity-weighted average system pricing directly from utilityand state incentive programs, but we have long felt that the data presented an out-of-date view of the market,as it often represented systems quoted in quarters well prior to the installation and connection date.
The bottom-up cost methodology is based on tracked wholesale pricing of major solar components and datacollected from major installers, with national average pricing supplemented by data collected from systeminstallers and EPCs, along with utility and state programs.
It is important to note that our new price reporting methodology represents an estimated price for a standardPV system within each market segment in the previous quarter. There are many factors that create variationsin pricing between systems, including but not limited to special architectural or engineering needs, variations inpermitting requirements, the valuation of solar benefits, and market maturity.
In this Q1 2014 U.S. Solar Market Insight report, capacity-weighted average system prices are reported basedon state and utility incentive program data for the last time, while also introducing our new national systempricing data for Q1 2014.
Figure 2.7 Bottom-Up Average System Prices, Q1 2014 Figure 2.8 Weighted Average System Prices, Q1 2012-Q1 2014
According to national weighted average system prices by market segment, residential and utility system pricesdropped quarter-over-quarter, while non-residential prices increased over Q4 2013.
From Q1 2013 to Q1 2014, residential system prices fell 7%, from $4.91/W to $4.56/W. Quarter-over-quarter, installed prices declined by 1%. Installed prices came down in most major residential marketsincluding California, Arizona, Massachusetts, and New York.
Non-residential system prices fell 5.7% year-over-year, from $3.95/W to $3.72/W, while quarter-over-quarter installed costs increased by 4%. Higher priced government/nonprofit projects accounted for the
$3.73
$2.53
$1.77
$0.00
$0.50
$1.00
$1.50
$2.00
$2.50
$3.00
$3.50
$4.00
Residential Commercial Utility
Cost
($/W
dc)
Modules Inverters and AC Subsystem DC Electrical BOSStructural BOS Direct Labor Engineering and PII
$4.56
$3.72
$1.85
$0.00
$1.00
$2.00
$3.00
$4.00
$5.00
$6.00
$7.00
$8.00
$9.00
$10.00
Residential Commercial Utility
Repo
rted
Sys
tem
Pric
es ($
/Wdc
)
Q1 2012 Q2 2012 Q3 2012 Q4 2012 Q1 2013 Q2 2013 Q3 2013 Q4 2013 Q1 2014
U.S. Solar Market Insight Report Photovoltaics
© 2014, Greentech Media, Inc. and Solar Energy Industries Association. All Rights Reserved │ 14
majority of installations across the top five non-residential markets, which include California, Arizona,Massachusetts, New Jersey, and New York.
Utility system prices once again declined quarter-over-quarter and year-over-year, down from $2.14/W inQ1 2013 and $1.96/W in Q4 2013, settling at $1.85/W in Q1 2014.
As Figures 2.7 and 2.8 reveal, and due in part to the timing issues discussed earlier, the bottom-upmethodology used for reporting system prices by market segment results in lower average system pricesacross all three market segments in Q1 2014. For further visibility into how the bottom-up methodology isapplied, the following carve-out of the national residential system pricing section provides added context.
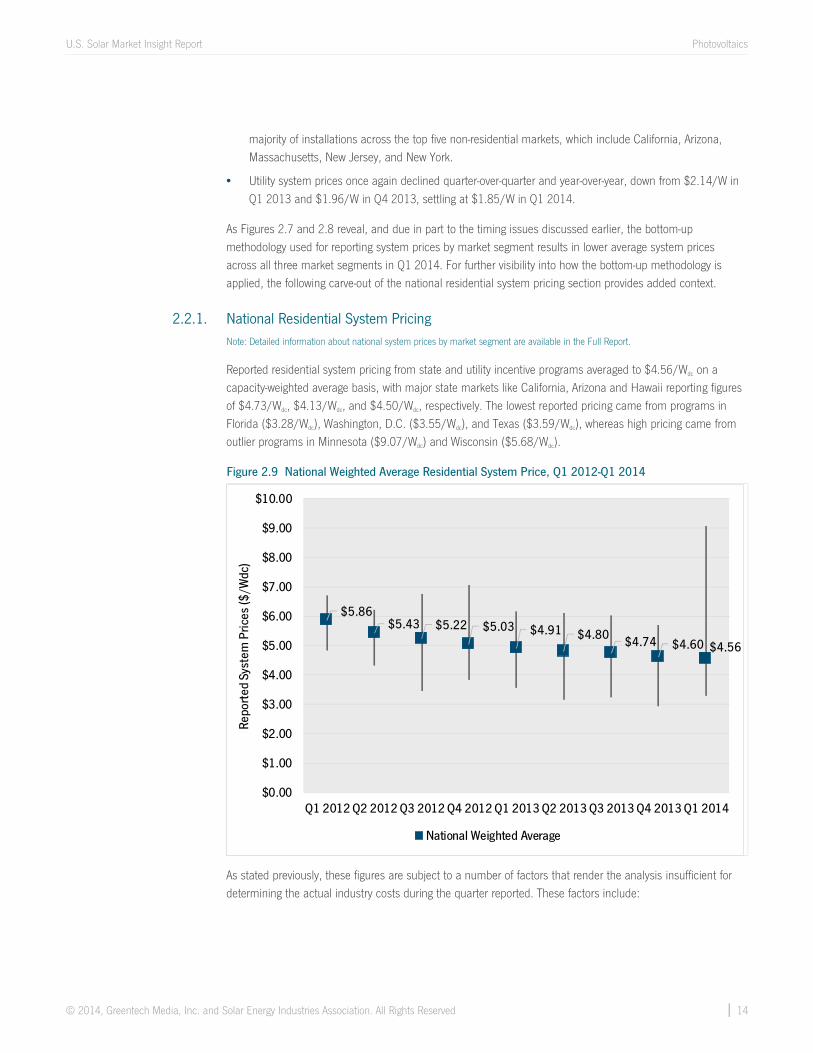
2.2.1. National Residential System PricingNote: Detailed information about national system prices by market segment are available in the Full Report.
Reported residential system pricing from state and utility incentive programs averaged to $4.56/Wdc on acapacity-weighted average basis, with major state markets like California, Arizona and Hawaii reporting figuresof $4.73/Wdc, $4.13/Wdc, and $4.50/Wdc, respectively. The lowest reported pricing came from programs inFlorida ($3.28/Wdc), Washington, D.C. ($3.55/Wdc), and Texas ($3.59/Wdc), whereas high pricing came fromoutlier programs in Minnesota ($9.07/Wdc) and Wisconsin ($5.68/Wdc).
Figure 2.9 National Weighted Average Residential System Price, Q1 2012-Q1 2014
As stated previously, these figures are subject to a number of factors that render the analysis insufficient fordetermining the actual industry costs during the quarter reported. These factors include:
$5.86$5.43 $5.22 $5.03 $4.91 $4.80 $4.74 $4.60 $4.56
$0.00
$1.00
$2.00
$3.00
$4.00
$5.00
$6.00
$7.00
$8.00
$9.00
$10.00
Q1 2012 Q2 2012 Q3 2012 Q4 2012 Q1 2013 Q2 2013 Q3 2013 Q4 2013 Q1 2014
Repo
rted
Sys
tem
Pric
es ($
/Wdc
)
National Weighted Average
U.S. Solar Market Insight Report Photovoltaics
© 2014, Greentech Media, Inc. and Solar Energy Industries Association. All Rights Reserved │ 15
Various definitions of “cost” that may or may not be inclusive of fair market valuation and othercomponents that do not necessarily reflect the true cost of solar installations
Dated reporting of system pricing, reflecting quotes from as much as a year previous to the installation date
Pricing for systems installed outside of state and utility incentive programs are not accounted for
As such, we have supplemented this reported data with more formal inquiries on system pricing with major PVsystem installers and investors. In turn, our estimates for actual system pricing in the quarter lands at aconsiderably lower figure of $3.98/Wdc. Higher upfront cost systems, such as those utilizing microinvertertechnology, premium high-efficiency modules, or complex roof concerns result in system pricing of around$4.90/Wdc. Meanwhile, simple systems, especially with low levels of related soft costs (e.g., customeracquisition, permitting) can result in system pricing as low as $3.25/Wdc.
As a further step, we have built a bottom-up model of residential system costs that better elucidates componentand categorical costs for PV systems built during the quarter. Due to the data sources for this information, thesecosts are reflective of EPC pricing on standard systems for firms installing a total of more than 1 MWdc (~150systems) per quarter. For residential PV systems, our breakdown reflects the following parameters:
6.5 kWdc residential system
Standard multicrystalline silicon PV modules
6 kWac string inverter with integrated DC disconnect
Standard rail-and-clamp racking system with flashed mounting
Rectangular array on composite shingle roof
PV module and inverters reflect “factory-gate” pricing with distribution and low volume markups reflectedin the supply chain category
Our modeled costs show string-inverter-based residential systems at $3.73/Wdc, with “Supply Chain, Overheadand Margins” as the largest cost category at $1.56/Wdc, or 40% of total costs. These costs represent the bulk ofsoft costs and include substantial allocations for customer acquisition, distribution markups (often even medium-sized residential installers procure through distributors), and EPC margins. Other significant costs to the systeminclude the PV module (20% of total pricing) and direct installation labor (13% of total pricing).
2.3. Component Pricing: Polysilicon, Wafers, Cells and ModulesNote: Detailed component pricing, including inverters and mounting structures, is available in the Full Report.
2.3.1. Delivered U.S. Module Pricing, 1-5 MWdc Order, Q1 2014
Module pricing in the U.S. differs widely based on order volume, producer region, individual firm, and saleschannel (direct vs. distributor). Delivered prices for Chinese modules in Q1 2014 ranged from $0.66/Wdc onthe low side (corresponding to order volumes larger than 10 MWdc for less established firms) to $0.74/W onthe high side (established, bankable firms, order volumes less than 1 MWdc). Blended delivered pricing forChinese modules was estimated at $0.72/Wdc, which represented a 3% increase quarter-over-quarter, and a14% increase year-over-year. This has largely been due to a significant increase in the price of Taiwanese cells(which are used in Chinese-assembled modules shipped to the U.S. to avoid tariffs placed on Chinese cells)

U.S. Solar Market Insight Report Photovoltaics
© 2014, Greentech Media, Inc. and Solar Energy Industries Association. All Rights Reserved │ 16
over this period. Prices for European, U.S. and Japanese modules (selling mostly into the residential and smallcommercial sector) were notably higher at $0.78-$0.85/Wdc. A few Taiwanese and Korean suppliers wereoffering pricing in between these two points ($0.75-$0.80/Wdc), albeit at limited volumes.
Figure 2.10 Delivered U.S. Module Pricing, 1-5 MWdc Order, Q1 2014
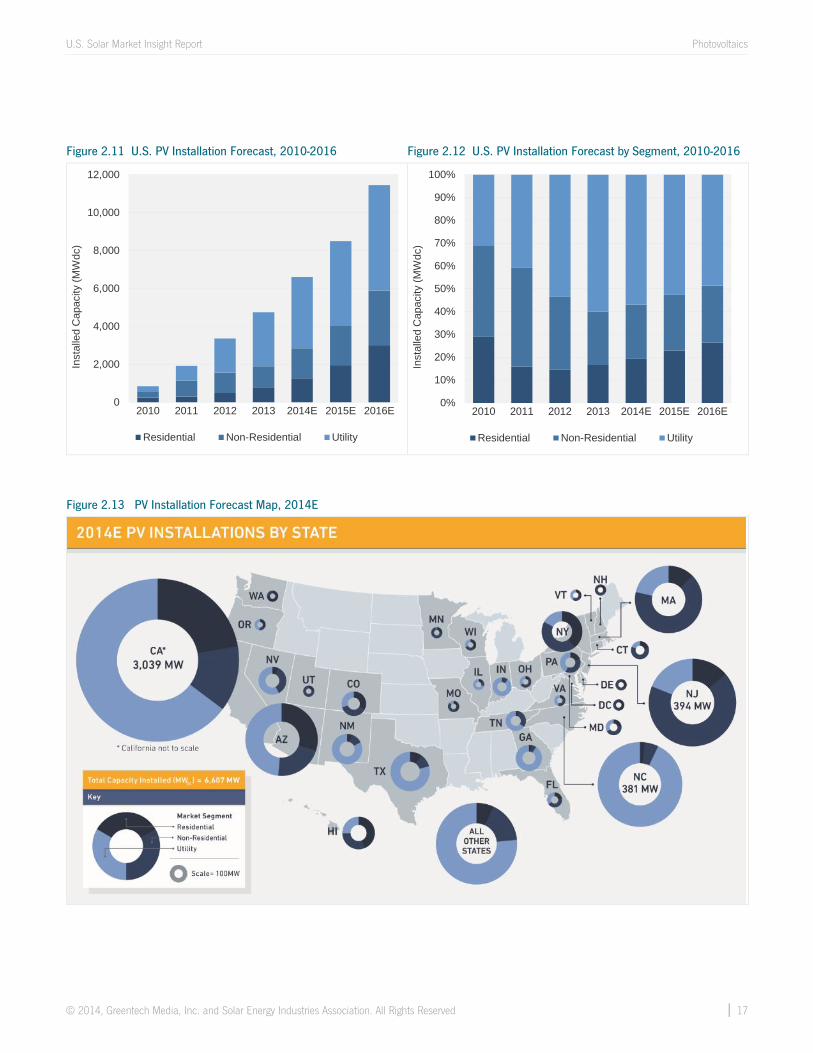
2.4. Market Outlook
We expect another strong year for the U.S. PV market in 2014, with installations reaching 6.6 GWdc, a 33%increase over 2013. The fastest growth will come from the residential segment (61% year-over-year), followedby the non-residential segment (41%) and the utility segment (32%). We have increased our forecasts thisquarter, primarily in the residential segment (especially in California and New York), as well as the utilitysegment (thanks to greater pipeline visibility).
Forecast details by state (30 states) and market segment through 2018 are available in the Full Report.
$0.68
$0.72
$0.77
$0.83
$0.60
$0.65
$0.70
$0.75
$0.80
$0.85
$0.90
China T2 China T1 Korea Europe/U.S./Japan
$/W
U.S. Solar Market Insight Report Photovoltaics
© 2014, Greentech Media, Inc. and Solar Energy Industries Association. All Rights Reserved │ 17
Figure 2.11 U.S. PV Installation Forecast, 2010-2016 Figure 2.12 U.S. PV Installation Forecast by Segment, 2010-2016
Figure 2.13 PV Installation Forecast Map, 2014E
0
2,000
4,000
6,000
8,000
10,000
12,000
2010 2011 2012 2013 2014E 2015E 2016E
Inst
alle
d C
apac
ity (M
Wdc
)
Residential Non-Residential Utility
0%
10%
20%
30%
40%
50%
60%
70%
80%
90%
100%
2010 2011 2012 2013 2014E 2015E 2016EIn
stal
led
Cap
acity
(MW
dc)
Residential Non-Residential Utility
U.S. Solar Market Insight Report Concentrating Solar Power
© 2014, Greentech Media, Inc. and Solar Energy Industries Association. All Rights Reserved │ 18
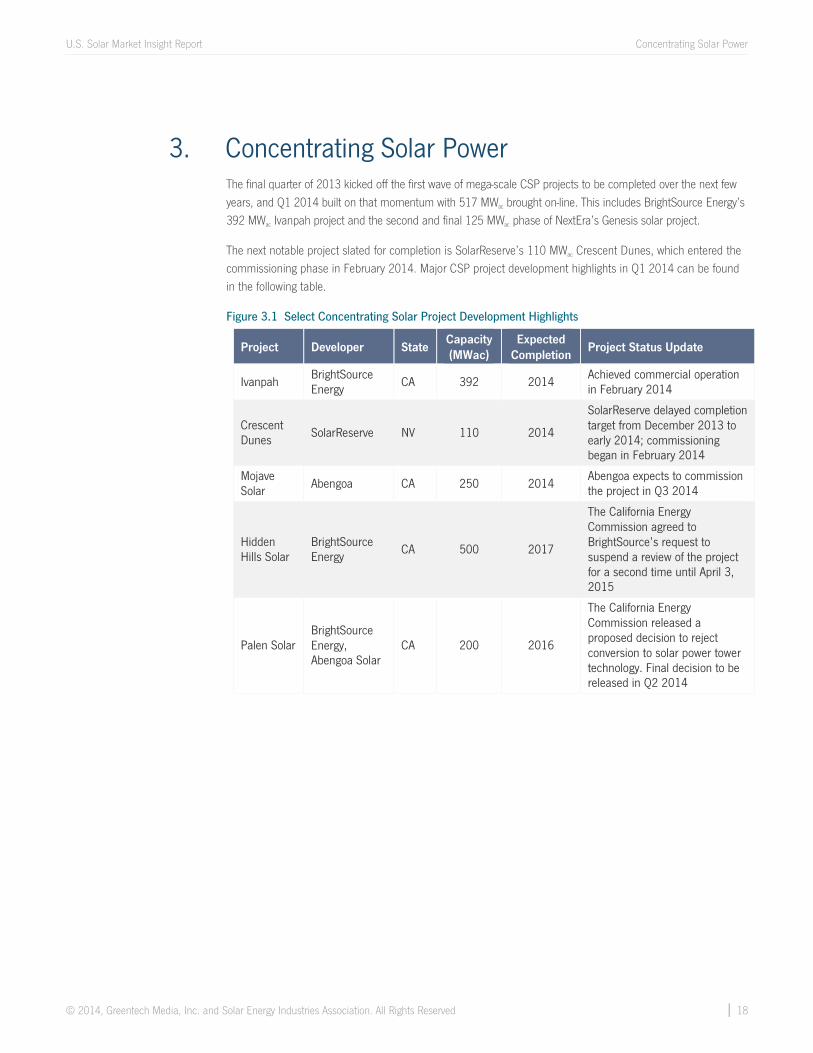
3. Concentrating Solar PowerThe final quarter of 2013 kicked off the first wave of mega-scale CSP projects to be completed over the next fewyears, and Q1 2014 built on that momentum with 517 MWac brought on-line. This includes BrightSource Energy’s392 MWac Ivanpah project and the second and final 125 MWac phase of NextEra’s Genesis solar project.
The next notable project slated for completion is SolarReserve’s 110 MWac Crescent Dunes, which entered thecommissioning phase in February 2014. Major CSP project development highlights in Q1 2014 can be foundin the following table.
Figure 3.1 Select Concentrating Solar Project Development Highlights
Project Developer StateCapacity(MWac)
ExpectedCompletion
Project Status Update
IvanpahBrightSourceEnergy
CA 392 2014Achieved commercial operationin February 2014
CrescentDunes
SolarReserve NV 110 2014
SolarReserve delayed completiontarget from December 2013 toearly 2014; commissioningbegan in February 2014
MojaveSolar Abengoa CA 250 2014
Abengoa expects to commissionthe project in Q3 2014
HiddenHills Solar
BrightSourceEnergy
CA 500 2017
The California EnergyCommission agreed toBrightSource’s request tosuspend a review of the projectfor a second time until April 3,2015
Palen SolarBrightSourceEnergy,Abengoa Solar
CA 200 2016
The California EnergyCommission released aproposed decision to rejectconversion to solar power towertechnology. Final decision to bereleased in Q2 2014
Please find a more detailed content and pricing matrix on the reverse side of this page.A Greentech Media Company
U.S. SOLARMARKET INSIGHT
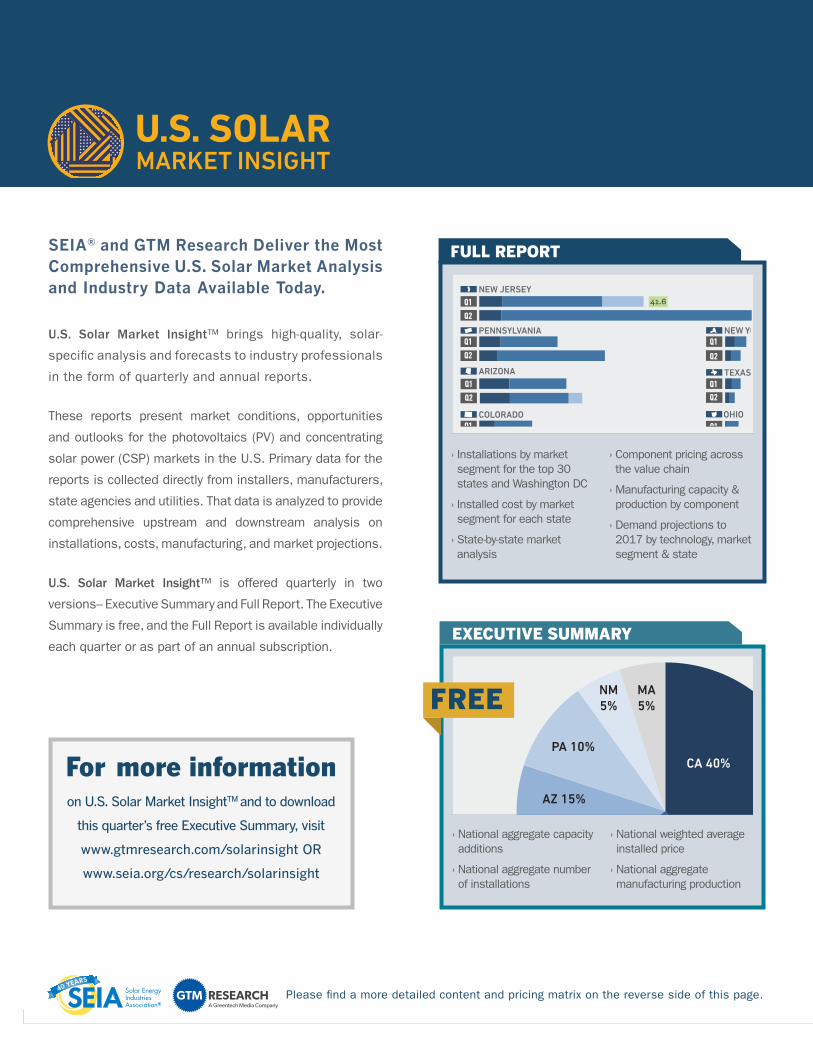
SEIA® and GTM Research Deliver the Most Comprehensive U.S. Solar Market Analysis and Industry Data Available Today.
U.S. Solar Market Insight™ brings high-quality, solar-
specific analysis and forecasts to industry professionals
in the form of quarterly and annual reports.
These reports present market conditions, opportunities
and outlooks for the photovoltaics (PV) and concentrating
solar power (CSP) markets in the U.S. Primary data for the
reports is collected directly from installers, manufacturers,
state agencies and utilities. That data is analyzed to provide
comprehensive upstream and downstream analysis on
installations, costs, manufacturing, and market projections.
U.S. Solar Market Insight™ is offered quarterly in two
versions– Executive Summary and Full Report. The Executive
Summary is free, and the Full Report is available individually
each quarter or as part of an annual subscription.
› National aggregate capacity additions
› National aggregate number of installations
› National weighted average installed price
› National aggregate manufacturing production
FREE
EXECUTIVE SUMMARY
› Installations by market segment for the top 30 states and Washington DC
› Installed cost by market segment for each state
› State-by-state market analysis
› Component pricing across the value chain
› Manufacturing capacity & production by component
› Demand projections to 2017 by technology, market segment & state
FULL REPORT
For more informationon U.S. Solar Market InsightTM and to download
this quarter’s free Executive Summary, visit
www.gtmresearch.com/solarinsight OR
www.seia.org/cs/research/solarinsight
PA 10%CA 40%
NM 5%
MA 5%
AZ 15%
WISCONSINQ1
Q2
WASHINGTONQ1
Q2
TEXASQ1
Q2
Q1
Q2
PENNSYLVANIA
OREGONQ1
Q2
OHIOQ1
Q2
NORTH CAROLINAQ1
Q2
NEW YORKQ1
Q2
NEW MEXICOQ1
Q2
41.675.7
Q1
Q2
NEW JERSEY
NEVADAQ1
Q2
MASSACHUSETTSQ1
Q2
MARYLANDQ1
Q2
HAWAIIQ1
Q2
FLORIDAQ1
Q2
DELAWAREQ1
Q2
CONNECTICUTQ1
Q2
COLORADOQ1
Q2
111.994.0
CALIFORNIAQ1
Q2
ARIZONAQ1
Q2
ILLNOISQ1
Q2
OTHERQ1
Q2
TOTAL CAPACITY INSTALLED Q1 2011 VS. Q2 2011 Charts Represent Total Capacity Installed (MWdc) Residential Commercial Utility Total
Q1 2011Q2 2011
Total = 268.0Total = 314.3
Please find a more detailed content and pricing matrix on the reverse side of this page.
Q1 Q2 Q3 Q4 Q4 Q3 Q2 Q1 Q1 Q2 Q3 Q4 Q1 Q2 Q3
Q4 Q3 Q2 Q1 Q1 Q2 Q3 Q4 Q4 Q3 Q2 Q1 Q4 Q3 Q2
Q4 Q3 Q2 Q1 Q1 Q2 Q3 Q4 Q4 Q3 Q2 Q1
Q1 Q2 Q3 Q4 Q4 Q3 Q2 Q1 Q1 Q2 Q3 Q4
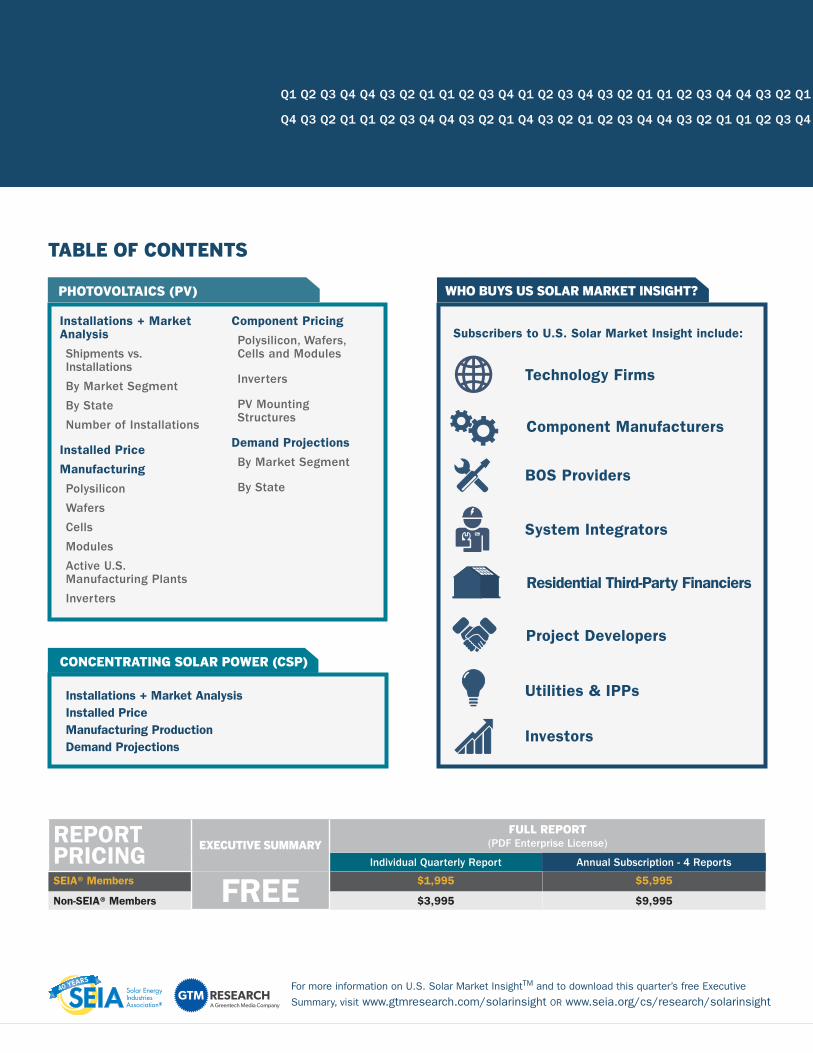
REPORT PRICING
EXECUTIVE SUMMARYFULL REPORT
(PDF Enterprise License)
Individual Quarterly Report Annual Subscription - 4 Reports
SEIA® Members FREE $1,995 $5,995
Non-SEIA® Members $3,995 $9,995
Installations + Market Analysis
Shipments vs. Installations
By Market Segment
By State
Number of Installations
Installed Price
Manufacturing
Polysilicon
Wafers
Cells
Modules
Active U.S. Manufacturing Plants
Inverters
Component Pricing
Polysilicon, Wafers, Cells and Modules
Inverters
PV Mounting Structures
Demand Projections
By Market Segment
By State
PHOTOVOLTAICS (PV)
Installations + Market Analysis Installed Price Manufacturing ProductionDemand Projections
CONCENTRATING SOLAR POWER (CSP)
TABLE OF CONTENTS
WHO BUYS US SOLAR MARKET INSIGHT?
Component Manufacturers
Project Developers
System Integrators
Investors
Technology Firms
Utilities & IPPs
Subscribers to U.S. Solar Market Insight include:
For more information on U.S. Solar Market InsightTM and to download this quarter’s free Executive
Summary, visit www.gtmresearch.com/solarinsight OR www.seia.org/cs/research/solarinsightA Greentech Media Company
BOS Providers
Residential Third-Party Financiers


