PURPA, COGENERATION, AND RESOURCE RECOVERY
GARY BRIAN LlSS and LEO LAROCHELLE Gershman, Brickner & Bratton, Inc.
Portland, Maine
ABSTRACT
Cogeneration is the simultaneous production of two or more energy forms from a single fuel source. At resource recovery facilities, steam and electricity are generated from the combustion of solid waste. The Public Utility Regulatory Policies Act of 1978 (pURP A) provides new incentives for cogeneration which have the potential to favorably impact upon resource recovery facilities. PURP A mandates that utilities purchase energy from "qualifying facili� ties" (most resource recovery facilities) at the utilities' "full avoided costs." However, recent Federal court decisions have significantly affected PURP A's ability to provide incentives in this field. The paper focuses on these impacts on cogeneration at resource recovery facilities.
The paper presents an overview of resource recovery technologies, cogeneration technologies, and typical resource recovery/cogeneration configurations. Potential energy markets linked to cogenerating resource recovery facilities are identified and the economics of representative systems are examined. Key negotiating issues for public and private sector market$ are highlighted.
BACKGROUND
The passage of the Public Utility Regulatory Policies Act (PURP A) in 1978 marked a new era in the development of resource recovery projects in the United States. Whereas in the past, utilities hesitated to purchase fuel, steam or electricity from
resource recovery facilities, PURP A required that they purchase such energy, and purchase it at the "full avoided costs" for power. In at least one location, this has more than tripled the price of electricity sold from resource recovery, and electricity production has become a prime consideration in the development of resource recovery projects.
Simultaneously, the sale of energy from resource recovery facilities has been enhanced by the dramatic increases in the price of fossil fuel experienced over the past decade. The cost increases in imported fossil fuels and the deregulation of domestic fossil fuels has had a major impact on the energy planning of both utilities and industries. Both of these groups are seeking to stabilize their future prices for energy and to assure a continued supply of fuels.
These two economic forces encourage the development of resource recovery projects that produce more than one energy product, and thus generate higher revenues. This is commonly known as "cogeneration": a primary form of energy (for example, high temperature and pressure steam) creates another energy product (electricity) and then is used again in a lower quality state (steam/ hot water) in another application. Different demands for steam, process heat, and electricity exist for different industries, but those industries which are the most energy intensive are the best prospects for developing cogeneration and resource recovery projects. Such projects can decrease the costs of energy production, increase energy effi-
373
ciencies, and can use indigenous fuel resources that are actually negatively valued fuels (municipal and industrial wastes).
THE REGULATORY IMPETUS - PURPA
PURPA has provided an important regulatory impetus for the development of cogeneration and
resource recovery facilities. PURP A mandated the Federal Energy Regulatory Commission (FERC) to require all regulated and nonregulated electric utilities to purchase available electricity from "qualifying facilities" based on full avoided costs.
FERC has defined "avoided costs" as: "The incremental cost to an electric utility of electric energy or capacity, or both which, but for the purchase from the qualifying facilities, such utility would generate itself or purchase from another source."
Full avoided costs are those which utilities do not have to bear if they can rely on an alternative source of energy for their needs. These costs apply to both the displacement of the costs of fuels as well as "capacity" requirements. A resource r�covery facility displaces fuel purchases by supplying the utility with electricity for which it would otherwise require fuels (coal, oil, etc.) to produce.
"Capacity" reflects the alternative energy source's ability to operate reliably in response to all energy needs. If an alternative energy source, such as a resource recovery facility, can reliably
provide a portion of the utility's total power re
quirements, the utility should give the facility
"capacity payments" for its contribution. A ca
pacity payment is usually determined by the cost
of producing energy from the generating system
that the utility would operate if the resource recovery facility were not available. Capacity payments generally vary according to when the energy is supplied, because energy provided during peak
demand has a higher value than energy provided to meet base load demand.
The Federal Energy Regulatory Commission (FERC) adopted a variety of rules to implement PURP A provisions for "cogeneration" and "small power production" facilities. * According to these rules, there are three criteria for defining a qualifying "small power production facility":
·1. 45 FR/12214-12237 (February 25, 1980).
2. 45 FR/17959-17976 (March 20, 1980).
3. 45 FR 33958-33964 (May 21,1980). 4. 45 F R/66787-66789 (October 8, 1980).
1. Total power production at any one site under any one ownership must not exceed 80 MW.
2. Seventy-five percent of the facility's total energy input must be from biomass, waste or re
newable resources. 3. Less than 50 percent of the equity interest in
a small-scale power producer can be held by an
electric utility or public utility holding company. Other rules which apply to "cogeneration" systems eliminate size limitations and requirements, but maintain the same ownership requirements. Effi
ciency standards are used to set output rates. The FERC rules also exempt qualifying cogen
erators and small power production facilities from
certain state and federal regulations:
1. Qualifying small power production facilities under 30 MW and qualifying cogeneration facilities are exempt from certain provisions of the Federal Power Act.
2. Qualifying cogeneration facilities, qualifying small power production facilities under 30 MW and qualifying small power production facilitie� fueled primarily by biomass are exempt from the Public Utility Holding Company Act of 1935 and state laws regulating electric utility rates and financial organization.
These exemptions are particularly important
for the development of cogeneration. In the past, many industries that are energy intensive produced
their own electricity and sold excess power to local utilities. In 1968, the U. S. Supreme Court decided that these industrial cogeneration operations were subject to federal regulation of the pub
lic utility industry under provisions of interstate commerce. As a result, many industries divested themselves of these operations, rather than become subject to the multitude of regulations restricting profits and investments in the utility industry. This inadvertently contributed to a decrease in electrical production efficiency for industry uses. PURP A sought to redress the Supreme Court's interpretation by delineating a subsequent message in the Act. By exempting industries from utility regulations, PURPA encouraged them to participate once again in increasing their own energy efficiency.
The implementation of these rules is the respon
sibility of the state regulatory agencies (e.g., Public Utility Commissions) and nonregulated utilities. FERC rules required state regulatory agencies to report to FERC by March 20, 1981 concerning
the status of their implementation of these provisions of PURP A. In Table 1, a listing of actions
374
taken by state agencies has been compiled. Of the 37 states reporting as of this date, 59 percent have adopted specific regulations and 41 percent are still working to complete those actions. In a landmark case before the Mississippi Supreme Court, the Court struck down Sections 201 and 210 of PURP A as being an unconstitutional infringement of state rights. Although some states have suspended proceedings pending the outcome of the appeal of this case to the U. S. Supreme Court by the Federal Department of Energy, most have decided to proceed. Many states felt that this legislation reflected the direction that they had already chosen to take, and merely expedited and justified this direction at the state level.
One of the most important tools that PURP A provided to developers of resource recovery projects is access to information about utility costs and structures. This knowledge will be invaluable during negotiations with utilities for purchases of energy and capacity. Most utilities are being encouraged to establish standard rates for purchasing energy and capacity as part of the process established by PURP A. However, these standard rates are only offered for small facilities generating less than 100 KW of electricity. For the larger facilities, the utilities will want to negotiate all the terms and conditions of the agreements to purchase energy and capacity, although generally they will base those negotiations on their standard agreements. As a result, a developer must underst.and as much as possible about the economic structure of a utility in order to obtain the best possible price and terms for a project.
Sections 290, 302 and 303 of PURP A are some of the key sections that provide project developers with the necessary information to improve their position in negotiations. Utilities must file information with the FERC in Washington, D. C., ranging from an analysis of a particular utility's generation and transmission costs to a calculation of avoided costs for the purchase of electricity. Some of the key tables that are available in the extensive FERC files include:
1. Marginal Energy Costs by Costing Period and Year [PURPA 290.303(g)].
2. Fossil Fuel Escalation Rates [pURPA 290.303(d)] .
3. Study of Accounting Costs of Providing Electric Service [PURPA 290.502(c)].
4. Fuel Resource Mix [PURPA 302(a)(6)]. 5. Ten Year Projection of Capacity in Mega
watts [PURPA 302(f)].
6. Plant Energy Costs, Capacity Costs, How Connected, and KW Cogeneration Capacity.
COGENERAT ION AND RESOURCE
RECOVERY
By definition, cogeneration projects produce two energy forms from one fuel source. When applied to resource recovery, this generally involves the conversion of solid waste fuel into a combination of steam and electrical energy. The steam can be used in industrial processes, district heating and cooling systems, the heating of sludge in cod isposal facilities or for mechanical drive power. Electrical energy can be used internally to operate the resource recovery facility; it can be sold to neighboring industries as part of an integrated project structure, or to investor-owned or municipal utilities, or it can be "wheeled" to neighboring utilities.
To date, resource recovery facilities implemented in the United States have been designed to generate single purpose energy products such as steam, electricity and/or fuels (RDF) from the combustible fraction of solid waste. Because markets are developing for both steam and electricity, more resource recovery facilities will add cogeneration capabilities using a turbine/generator set to generate electricity from the steam produced by combustion. Primary components of this additional equipment include:
1. Steam Turbines. These are normally designed for available steam flow conditions and back pressure or extraction.
2. Generators. These translate the turbine's rotary kinetic energy into electrical energy.
3. Switch Gears. These allow connection of the •
turbine/generator set to the existing electricity distribution system.
A turbine converts energy in two steps. First, steam entering a turbine is expanded through a stationary nozzle thereby transforming the steam's heat energy to velocity. Secondly, rotary motion is accomplished by allowing the expanded steam jet to strike blades on a turbine wheel thereby making it spin. In this way, the steam turbine produces rotary motion or useable shaft power. In cogeneration, the power turns a generator and produces electricity. Turbines may be either single stage or multi-staged, depending on specific design conditions (e.g., steam flow, temperature and pressure). Generally, multi-staged turbines are more efficient but are more expensive.
375
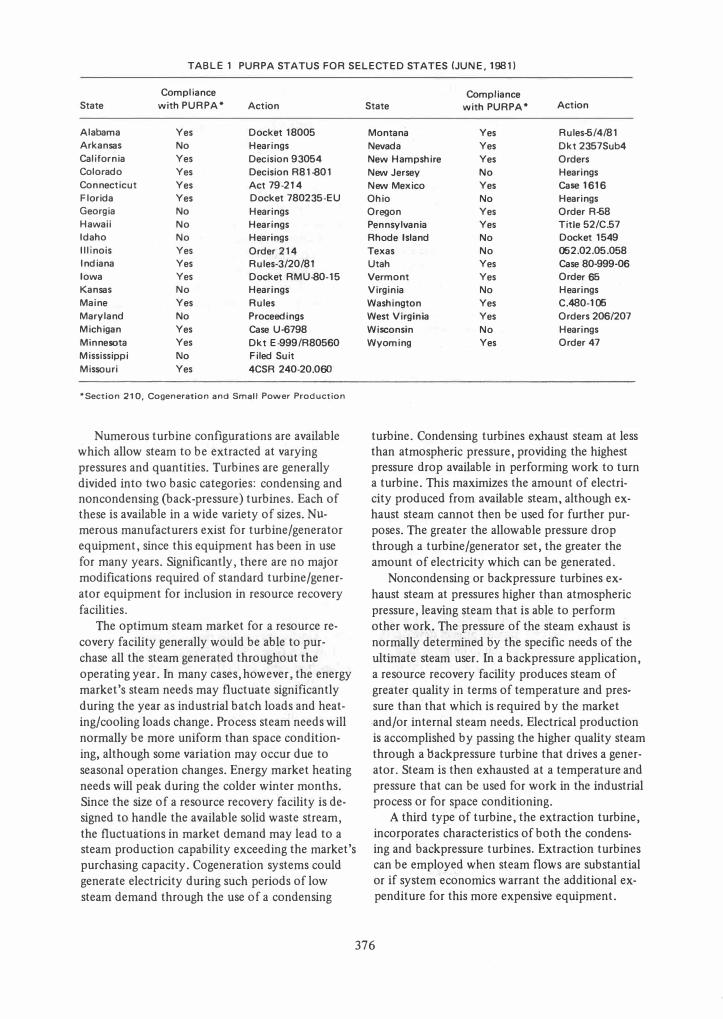
TABLE 1 PURPA STATUS FOR SELECTED STATES (JUNE, 1981)
Compliance
State with PURPA* Action
Alabama Yes Docket 18005
Arkansas No Hearings
California Yes Decision 93054
Colorado Yes Decision R81-801
Connecticut Yes Act 79-214
Florida Yes Docket 780235-EU
Georgia No Hearings
Hawaii No Hearings
Idaho No Hearings
Illinois Yes Order 214 Indiana Yes Rules-3/20/81
Iowa Yes Docket RMU-80-15
Kansas No Hearings
Maine Yes Rules
Maryland No Proceedings
Michigan Yes Case U-6798
Minnesota Yes Dkt E-999/R80560
Mississippi No Filed Suit
Missouri Yes 4CSR 240-20.060
• Section 210, Cogeneration and Small Power Production
Numerous turbine configurations are available which allow steam to be extracted at varying pressures and quantities. Turbines are generally divided into two basic categories: condensing and noncondensing (back-pressure) turbines. Each of these is available in a wide variety of sizes. Numerous manufacturers exist for turbine/generator equipment, since this equipment has been in use for many years_ Significantly, there are no major modifications required of standard turbine/gener
ator equipment for inclusion in resource recovery
facilities. The optimum steam market for a resource re
covery facility generally would be able to pur-chase all the steam generated throughout the
operating year. In many cases, however, the energy market's steam needs may fluctuate significantly
during the year as industrial batch loads and heating/cooling loads change. Process steam needs will normally be more uniform than space conditioning, although some variation may occur due to
seasonal operation changes. Energy market heating needs will peak during the colder winter months. Since the size of a resource recovery facility is designed to handle the available solid waste stream,
the fluctuations in market demand may lead to a steam production capability exceeding the market's purchasing capacity. Cogeneration systems could generate electricity during such periods of low steam demand through the use of a condensing
Compliance State with PURPA* Action
Montana Yes Rules.o/4/81
Nevada Yes Dkt 2357Sub4
New Hampshire Yes Orders
New Jersey No Hearings
New Mexico Yes Case 1616
Ohio No Hearings
Oregon Yes Order R.o8
Pennsylvania Yes Title 52/C.57
Rhode Island No Docket 1549
Texas No 002.02.05.058
Utah Yes Case 80-999-06
Vermont Yes Order 65 Virginia No Hearings
Washington Yes C.480-106
West Virginia Yes Orders 206/207
Wisconsin No Hearings
Wyoming Yes Order 47
turbine. Condensing turbines exhaust steam at less than atmospheric pressure, providing the highest pressure drop available in performing work to turn a turbine. This maximizes the amount of electricity produced from available steam, although exhaust steam cannot then be used for further purposes. The greater the allowable pressure drop through a turbine/generator set, the greater the amount of electricity which can be generated.
Noncondensing or backpressure turbines ex
haust steam at pressures higher than atmospheric pressure, leaving steam that is able to perform other work. The pressure of the steam exhaust is
normally determined by the specific needs of the ultimate steam user. In a backpressure application, a resource recovery facility produces steam of greater quality in terms of temperature and pres
sure than that which is required by the market and/or internal steam needs. Electrical production is accomplished by passing the higher quality steam
through a backpressure turbine that drives a gener· ator. Steam is then exhausted at a temperature and pressure that can be used for work in the industrial process or for space conditioning.
A third type of turbine, the extraction turbine,
incorporates characteristics of both the condens· ing and backpressure turbines. Extraction turbines can be employed when steam flows are substantial or if system economics warrant the 'additional expenditure for this more expensive equipment.
376
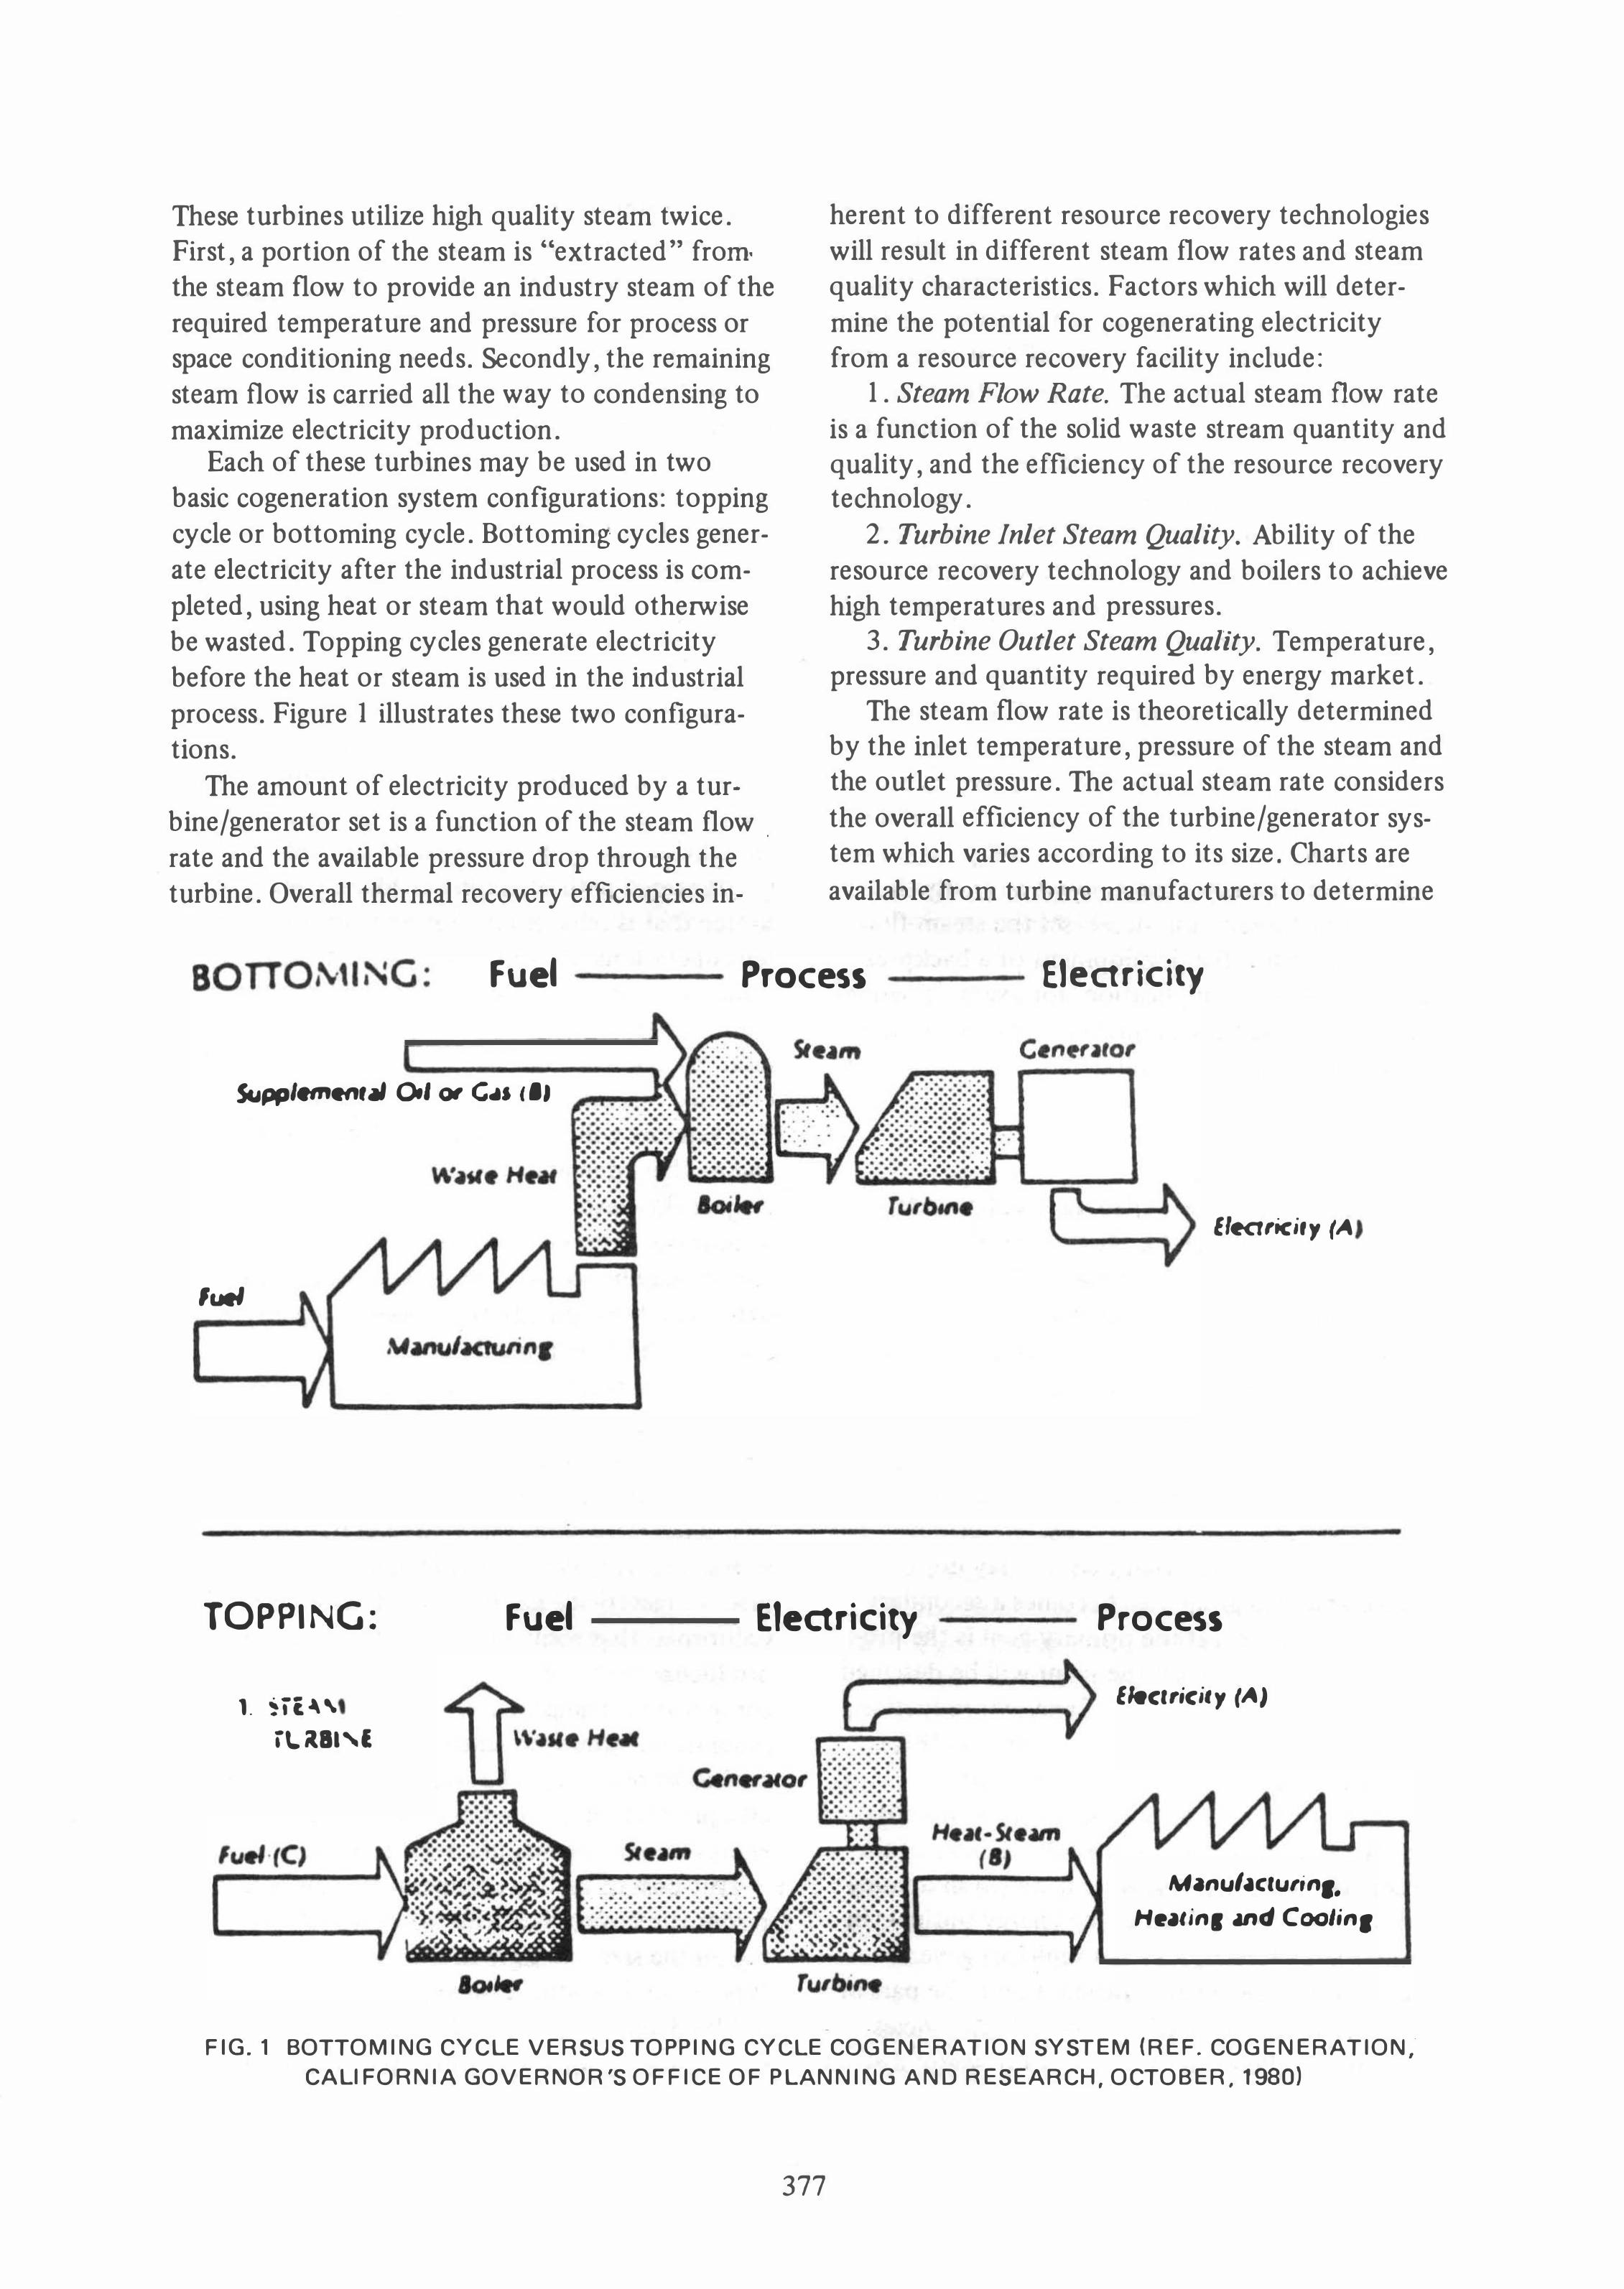
These turbines utilize high quality steam twice. First, a portion of the steam is "extracted" from the steam flow to provide an industry steam of the required temperature and pressure for process or space conditioning needs. Secondly, the remaining steam flow is carried all the way to condensing to maximize electricity production.
Each of these turbines may be used in two basic cogeneration system configurations: topping cycle or bottoming cycle. Bottoming cycles generate electricity after the industrial process is completed, using heat or steam that would otherwise be wasted. Topping cycles generate electricity before the heat or steam is used in the industrial process. Figure I illustrates these two configurations.
The amount of electricity produced by a turbine/generator set is a function of the steam flow. rate and the available pressure drop through the turbine. Overall thermal recovery efficiencies in-
herent to different resource recovery technologies will result in different steam flow rates and steam quality characteristics. Factors which will determine the potential for cogenerating electricity from a resource recovery facility include:
1. Steam Flow Rate. The actual steam flow rate is a function of the solid waste stream quantity and quality, and the efficiency of the resource recovery technology.
2. Turbine Inlet Steam Quality. Ability of the resource recovery technology and boilers to achieve high temperatures and pressures.
3. Turbine Outlet Steam Quality. Temperature, pressure and quantity required by energy market.
The steam flow rate is theoretically determined by the inlet temperature, pressure of the steam and the outlet pressure. The actual steam rate considers the overall efficiency of the turbine/generator system which varies according to its size. Charts are
available from turbine manufacturers to determine
Fuel Process Electricity
ScJpp/ .... .,,'� 0.101 C4J /.,
'uel
TOPPING:
1. 'H£�'" iLitBI'E
Fuel Electricity
. .
E'ecrrici,y ('"
Process
Electricity ("I
Mlnu/,cturin,.
H."in, md Coolin,
FIG.1 BOTTOMING CYCLE VERSUS TOPPING CYCLE COGENERATION SYSTEM (REF. COGENERATION; CALIFORNIA GOVERNOR'S OFFICE OF PLANNING AND RESEARCH, OCTOBER, 1980)
377
these efficiencies. The lower efficiencies for smaller turbine/generator sets have been responsible for
the few applications of small-scale cogeneration and resource recovery. However, as the prices for electricity increase as a result of PURP A, it is expected
that sufficient revenues will be generated at in
creasingly smaller sizes to justify the investment in turbine/generator sets in the future.
The relationship of inlet and outlet steam qualities also has a significant bearing on the approach to a cogeneration and resource recovery project. The amount of electricity which can be generated
decreases with increases in backpressure steam requirements. There is an inherent trade-off between quantities of steam produced for productive work, and the amount of electricity produced. There is also a trade-off between the steam's temperature and pressure quality and the steam flow rate. To increase the temperature and pressure at steam inlets increases the amount of energy in each unit of steam, but decreases the steam flow rate. As a result, the development of a backpressure cogeneration application, for example, would lead to increased steam quality compared to a con
densing system, but would decrease the steam flow rate.
ECONOMICS OF COGENERATION AND
RESOURCE RECOVERY
Of fundamental importance to structuring the
economics of cogeneration and resource recovery
is the original reason for developing a resource re
covery plant. If the primary goal is to dispose of solid waste, regardless of the costs of operation,
the plant will be designed to maximize the reliability and minimize the cost of waste diSposal. The production of energy that may or may not be marketable in a given area becomes a secondary consideration. But if the primary goal is the production of energy, then the plant will be designed to maximize the reliability of energy production, regardless of the costs of waste disposal. This is particularly characteristic of many European facilities. In fact, in Denmark, the Netherlands, and West Germany, more than 90 percent of the waste-to-energy systems were installed in municipalities already involved in the energy business in some way. Often European municipal governments considered energy production to be part of the overall service owed to their constituencies, generally in the form of steam or hot water district
378
heating systems. The costs of such facilities are split between waste disposal, energy costs, and
other municipal expenditures. A clear accounting of the expenditures for each aspect of the facility's
operations generally has not been required, due to the institutional arrangement that is common in
Europe, such that the electricity facility is con
structed by the municipally-owned public utility. In order to develop a resource recovery project
to serve the electrical generation and steam production needs of an area, one must identify the different interests of the parties, and negotiate a set of contracts to benefit them all. MuniCipalities
want a resource recovery project to dispose of solid waste while minimizing the costs of tipping fees. Because PURP A has required utilities to purchase electricity from such facilities at their full avoided costs, their primary concern is to guarantee reliable energy production. Industries are mainly concerned with obtaining an alternative energy source that is reliable and less expensive than current operations. Project developers and system vendors are seeking to maximize their revenues from all parts of the project (tipping fee, electric rates, steam rates) but will recognize what can be obtained realistically based on similar projects. The vendors will have the greatest interest in balancing these demands to develop a successful project. However, in some locations the need for
solid waste disposal or alternative sources of energy may be so great that those concerns will determine how quickly these competing interests
are balanced (see Table 2).
Within this framework, cogeneration and resource recovery economics are passing through an
important evolution. The economics of cogeneratjon in particular appear more favorable in many IU';utions throughout the United States as resource recovery is pursued. In some locations, the price of electricity has become so attractive (e.g., California) that some projects are contemplating producing el ctricity only, and not considering complicated arrangements with industry for cogeneration. More frequently steam sale revenues
are higher per Btu in the waste stream, and electricity production becomes a desirable adjunct to the energy market of manufacturing industries.
The cost of adding cogeneration equipment to resource recovery facilities varies widely, depending on the size, configuration, manufacturer and type of application. However, the costs shown in Tables 3 and 4 can be used as guidelines for the capital and operating an!! maintenance costs of
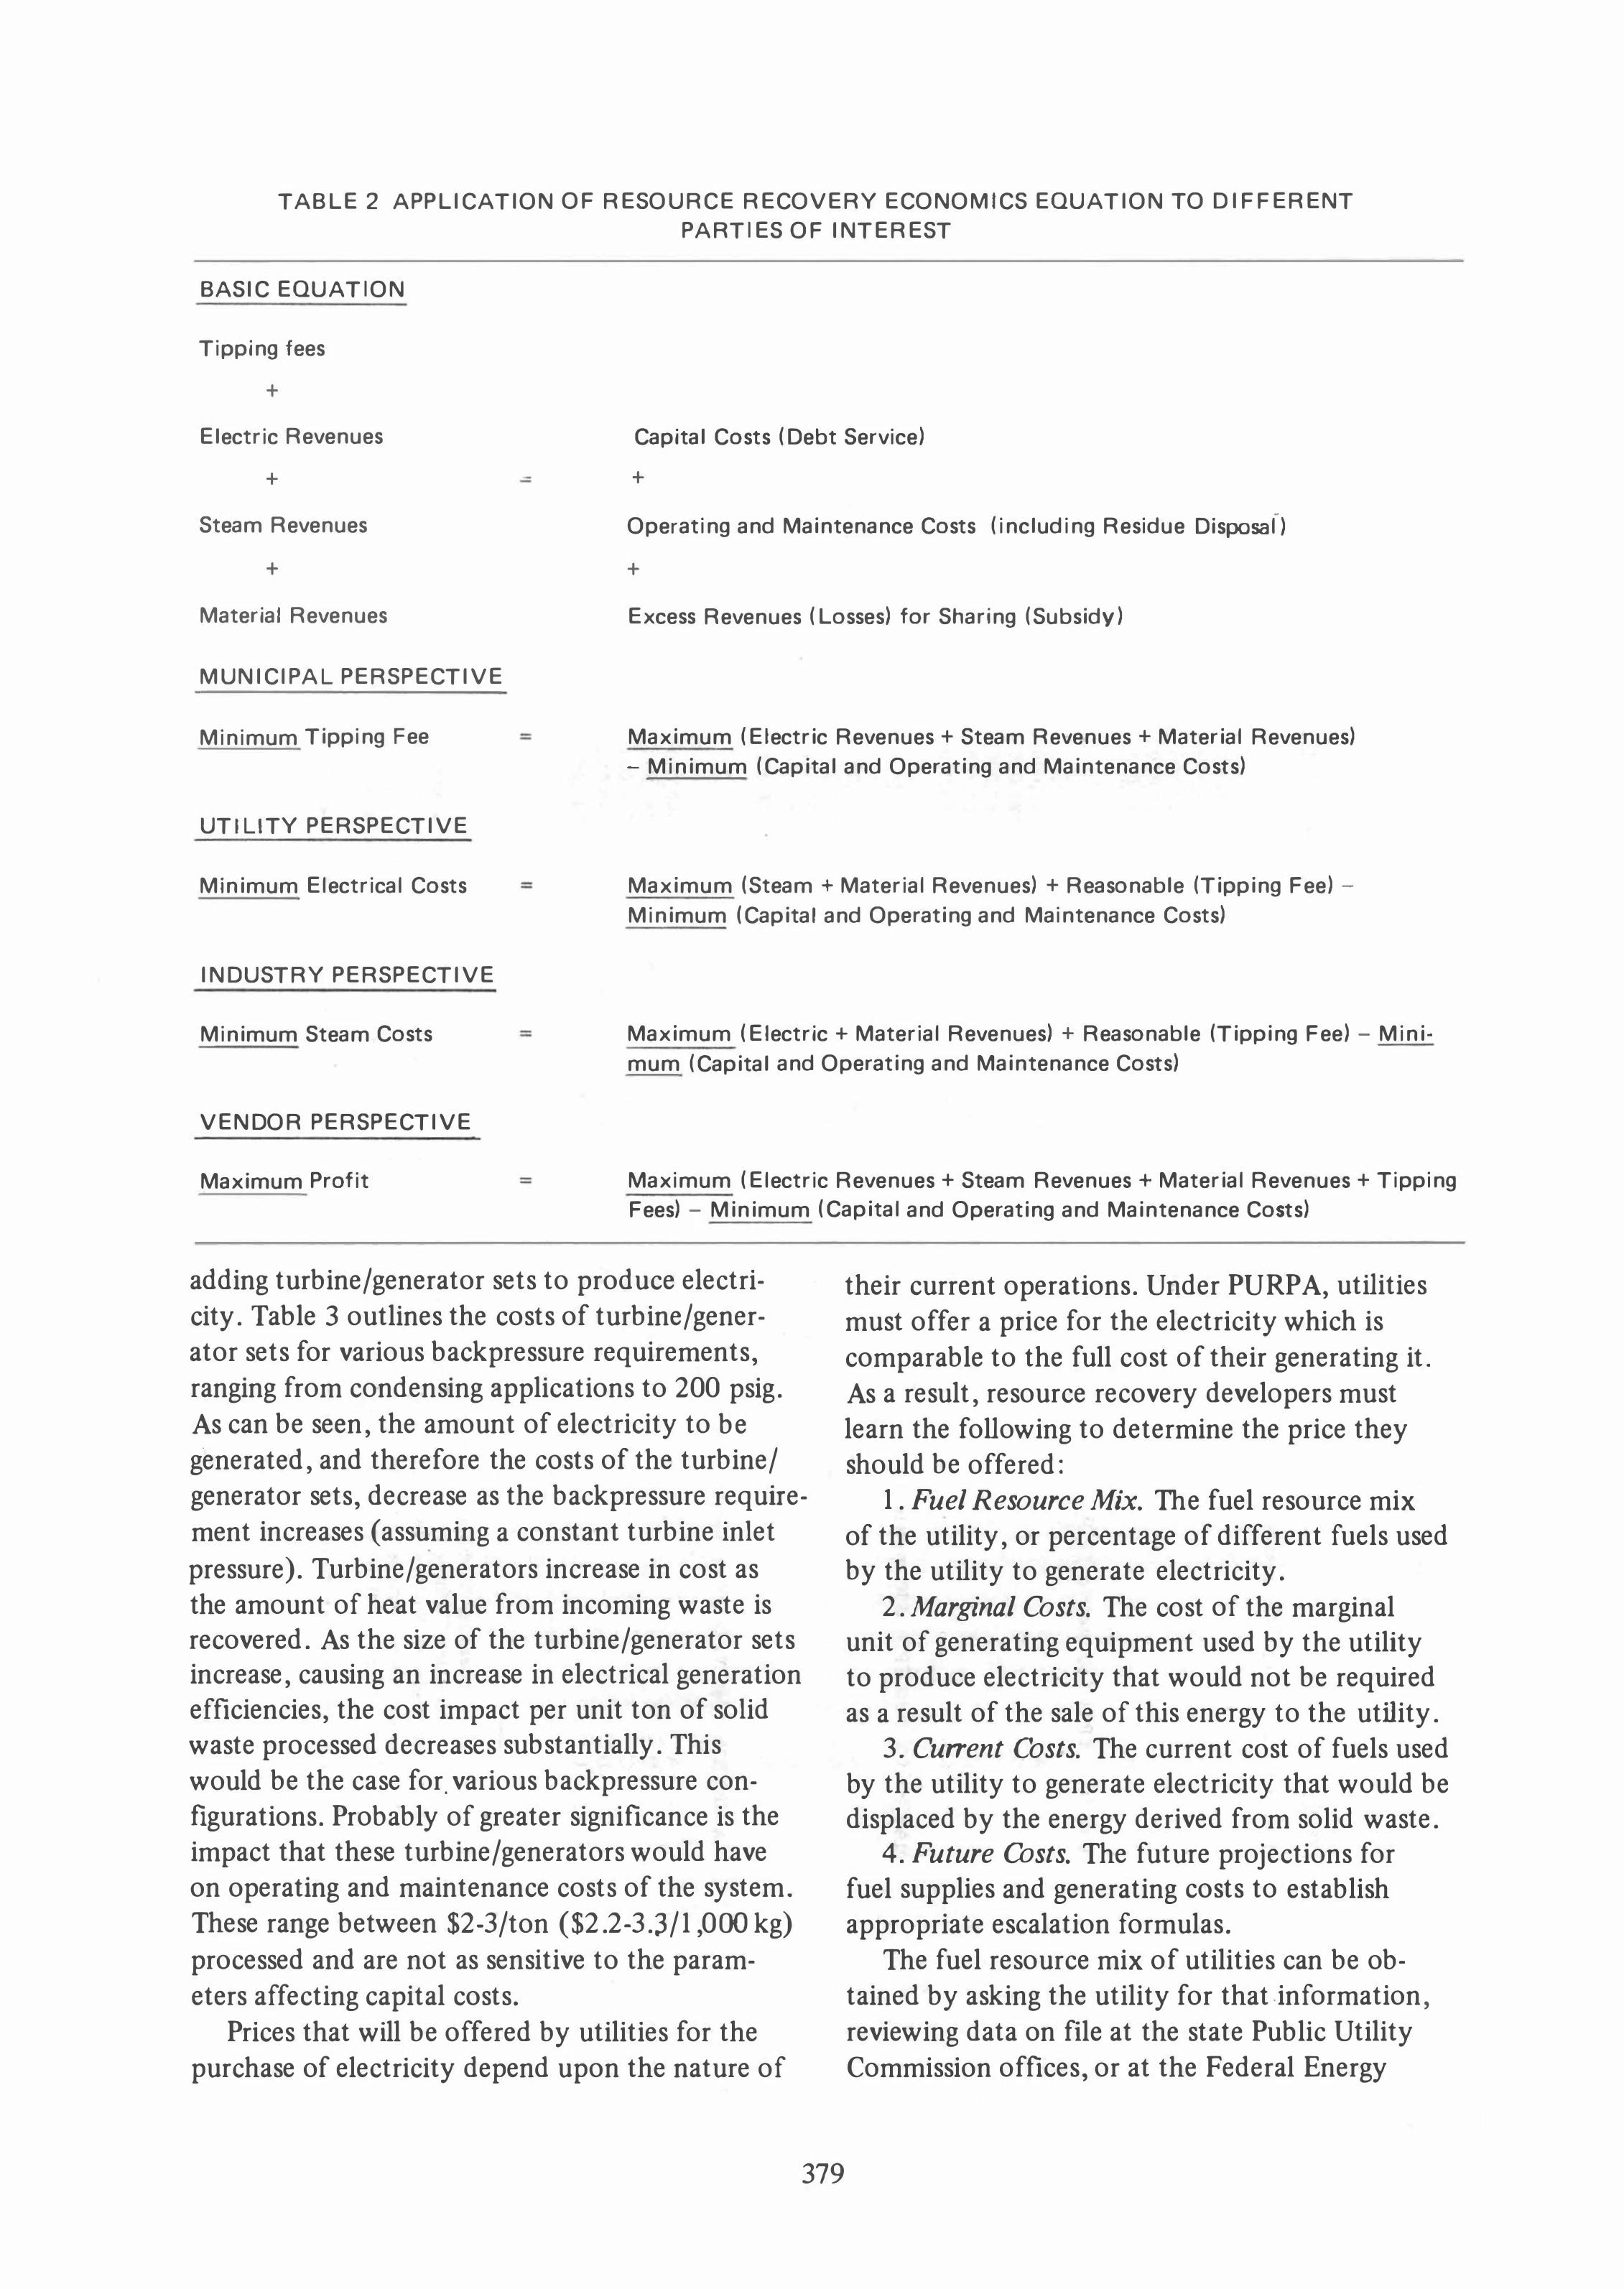
TABLE 2 APPLICATION OF RESOURCE RECOVERY ECONOMICS EQUATION TO DIFFERENT PARTIES OF INTEREST
BASIC EQUATION
Tipping fees
+
Electric Revenues Capital Costs (Debt Service)
+ +
Steam Revenues Operating and Maintenance Costs (including Residue Disposal-)
+ +
Material Revenues Excess Revenues (Losses) for Sharing (Subsidy)
MUNICIPAL PERSPECTIVE
Minimum Tipping Fee Maximum (Electric Revenues + Steam Revenues + Material Revenues) - Minimum (Capital and Operating and Maintenance Costs)
UTI LlTY PERSPECTIVE
Minimum Electrical Costs Maximum (Steam + Material Revenues) + Reasonable (Tipping Fee) -Minimum (Capital and Operating and Maintenance Costs)
INDUSTRY PERSPECTIVE
Minimum Steam Costs Maximum (Electric + Material Revenues) + Reasonable (Tipping Fee) - Minimum (Capital and Operating and Maintenance Costs)
VENDOR PERSPECTIVE
Maximum Profit Maximum (Electric Revenues + Steam Revenues + Material Revenues + Tipping Fees) - Minimum (Capital and Operating and Maintenance Costs)
adding turbine/generator sets to produce electricity. Table 3 outlines the costs of turbine/generator sets for various backpressure requirements, ranging from condensing applications to 200 psig. As can be seen, the amount of electricity to be generated, and therefore the costs of the turbine/ generator sets, decrease as the backpressure requirement increases (assuming a constant turbine inlet pressure). Turbine/generators increase in cost as the amount of heat value from incoming waste is recovered. As the size of the turbine/generator sets increase, causing an increase in electrical generation efficiencies, the cost impact per unit ton of solid waste processed decreases substantially. This would be the case for. various backpressure configurations. Probably of greater significance is the impact that these turbine/generators would have on operating and maintenance costs of the system. These range between $2-3/ton ($2.2-3.3/1,000 kg) processed and are not as sensitive to the parameters affecting capital costs.
Prices that will be offered by utilities for the purchase of electricity depend upon the nature of
379
their current operations. Under PURP A, utilities must offer a price for the electricity which is comparable to the full cost of their generating it. As a result, resource recovery developers must learn the following to determine the price they should be offered:
1. Fuel Resource Mix. The fuel resource mix of the utility, or percentage of different fuels used by the utility to generate electricity.
2. Marginal Costs. The cost of the marginal unit of generating equipment used by the utility to produce electricity that would not be required as a result of the sale of this energy to the utility.
3. Current Costs. The current cost of fuels used by the utility to generate electricity that would be displaced by the energy derived from solid waste.
4. Future Costs. The future projections for fuel supplies and generating costs to establish appropriate escalation formulas.
The fuel resource mix of utilities can be obtained by asking the utility for that .information, reviewing data on file at the state Public Utility Commission offices, or at the Federal Energy

w
00
a
TA
BL
E 3
IN
CR
EM
EN
TA
L C
OG
EN
ER
AT
ION
CA
PIT
AL
CO
ST
S (
TU
RB
INE
S,
ET
C.)
Inst
alla
tion
�
1 C
al2i t
al C
ost
Cos
t T
otal
C
ost
Ann
ual
r;os
t2
MO
DU
LA
R (
100
TPD
j 90
m
etri
c T
PD)
A
340,
000
260,
000
600,
000
74,0
00
B
130,
000
100,
000
230,
000
28,0
00
C
100,
000
75,0
00
175,
000
22,0
00
D
85,0
00
64,0
00
149,
000
18,0
00
E 70
,000
52
,000
12
2,00
0 15
,000
RD
P (
600
TPD
j 54
0 m
etri
c T
PD)
A
1,50
0,00
0 1,
000,
000
2,50
0,00
0 27
0,00
0 B
65
0,00
0 44
0,00
0 1,
090,
000
120,
000
C
490,
000
330,
000
820,
000
90,0
00
D
400,
000
270,
000
670,
000
n,O
O(}
E 36
0,00
0 24
0,00
0 60
0,00
0 66
,000
MA
SSBU
RN
(55
0 T
PDj
500
metr
ic T
PD
)
A
1,20
0,00
0 82
0,00
0 2,
020,
000
220,
000
B
650,
000
440,
000
1,09
0,00
0 12
0,00
0 C
49
0,00
0 33
0,00
0 82
0,00
0 90
,000
D
40
0,00
0 �7
0,OO
O 67
0,00
0 73
,000
E
360,
000
240,
000
600,
000
66,0
00
MA
SSBU
RN
(1
800
TP
Dj
1630
met
ric
TP
D)
A
4,00
0,00
0 2,
000,
000
6,00
0,00
0 66
0,00
0 B
1,
800,
000
890,
000
2,69
0,00
0 29
0,00
0 C
1,
300,
000
680,
000
1,98
0,00
0 22
0,00
0 D
1,
100,
000
580,
000
1,68
0,00
0 18
0,00
0 E
850,
000
420,
000
1,27
0,00
0 14
0,00
0
1.
A =
P
ull
Con
dens
ing
Tur
bine
fro
m 6
00 ps
ig/7
500P
to
3" H
g (4
000
kPA
gua
lte/7
320C
) B
=
Bac
kpr
essur
e T
urbi
ne f
rom
600
ps
ig/7
500P
to
50 p
sig
(400
0 k
Pa
guag
e/73
20C
to
300
kPa
Iroa
ge)
C =
B
ack
press
ure
Tur
bine
fro
m 6
00
psig
/750
0P t
o 10
0 ps
ig (
4000
kPa
gua
ge/7
320C
to
700
kPa
guag
e)
D =
B
ack
press
ure
Tur
bine
fro
m
600
psig
/750
Of
to
150
psi g
(40
00 k
Pa
ltUag
e/73
20C
to
100
0 k
Pa l1:
uage
\ E
=
Bac
kpr
essur
e T
ur�,
from
600
psi
g/75
00P
to
200
psig
(40
00 k
Pa
guag
e/73
2or;
to 1
400
kPa
gua
ge)
2.
Mod
ular
Sy
stem
s am
orti
zed o
ver
15 y
ears
at
9%.
All
othe
r sy
stem
s am
orti
zed
over
20
vears
at
9%.
Impa
ct
on
Tip
oinl1:
Fee
S/
ton
(S/m
etri
c to
n)
2.25
(2
.4R)
0.
85
(0.9
4)
0.67
(0.
74)
0.46
(0.
1 t)
1.61
(1.
77)
0.72
(0.
79)
0.04
(0.
60)
0.44
(0.
49)
0.39
(0.
43\
1.29
(1.
42)
0.70
(0.
77)
0.53
(0.
58)
0.43
(0.
47)
0.39
(0.
43)
1.18
0.3
0)
0.52
(0.
57)
0.39
(0.
43)
0.32
(0
.35)
0.
25 (
n.�8
)
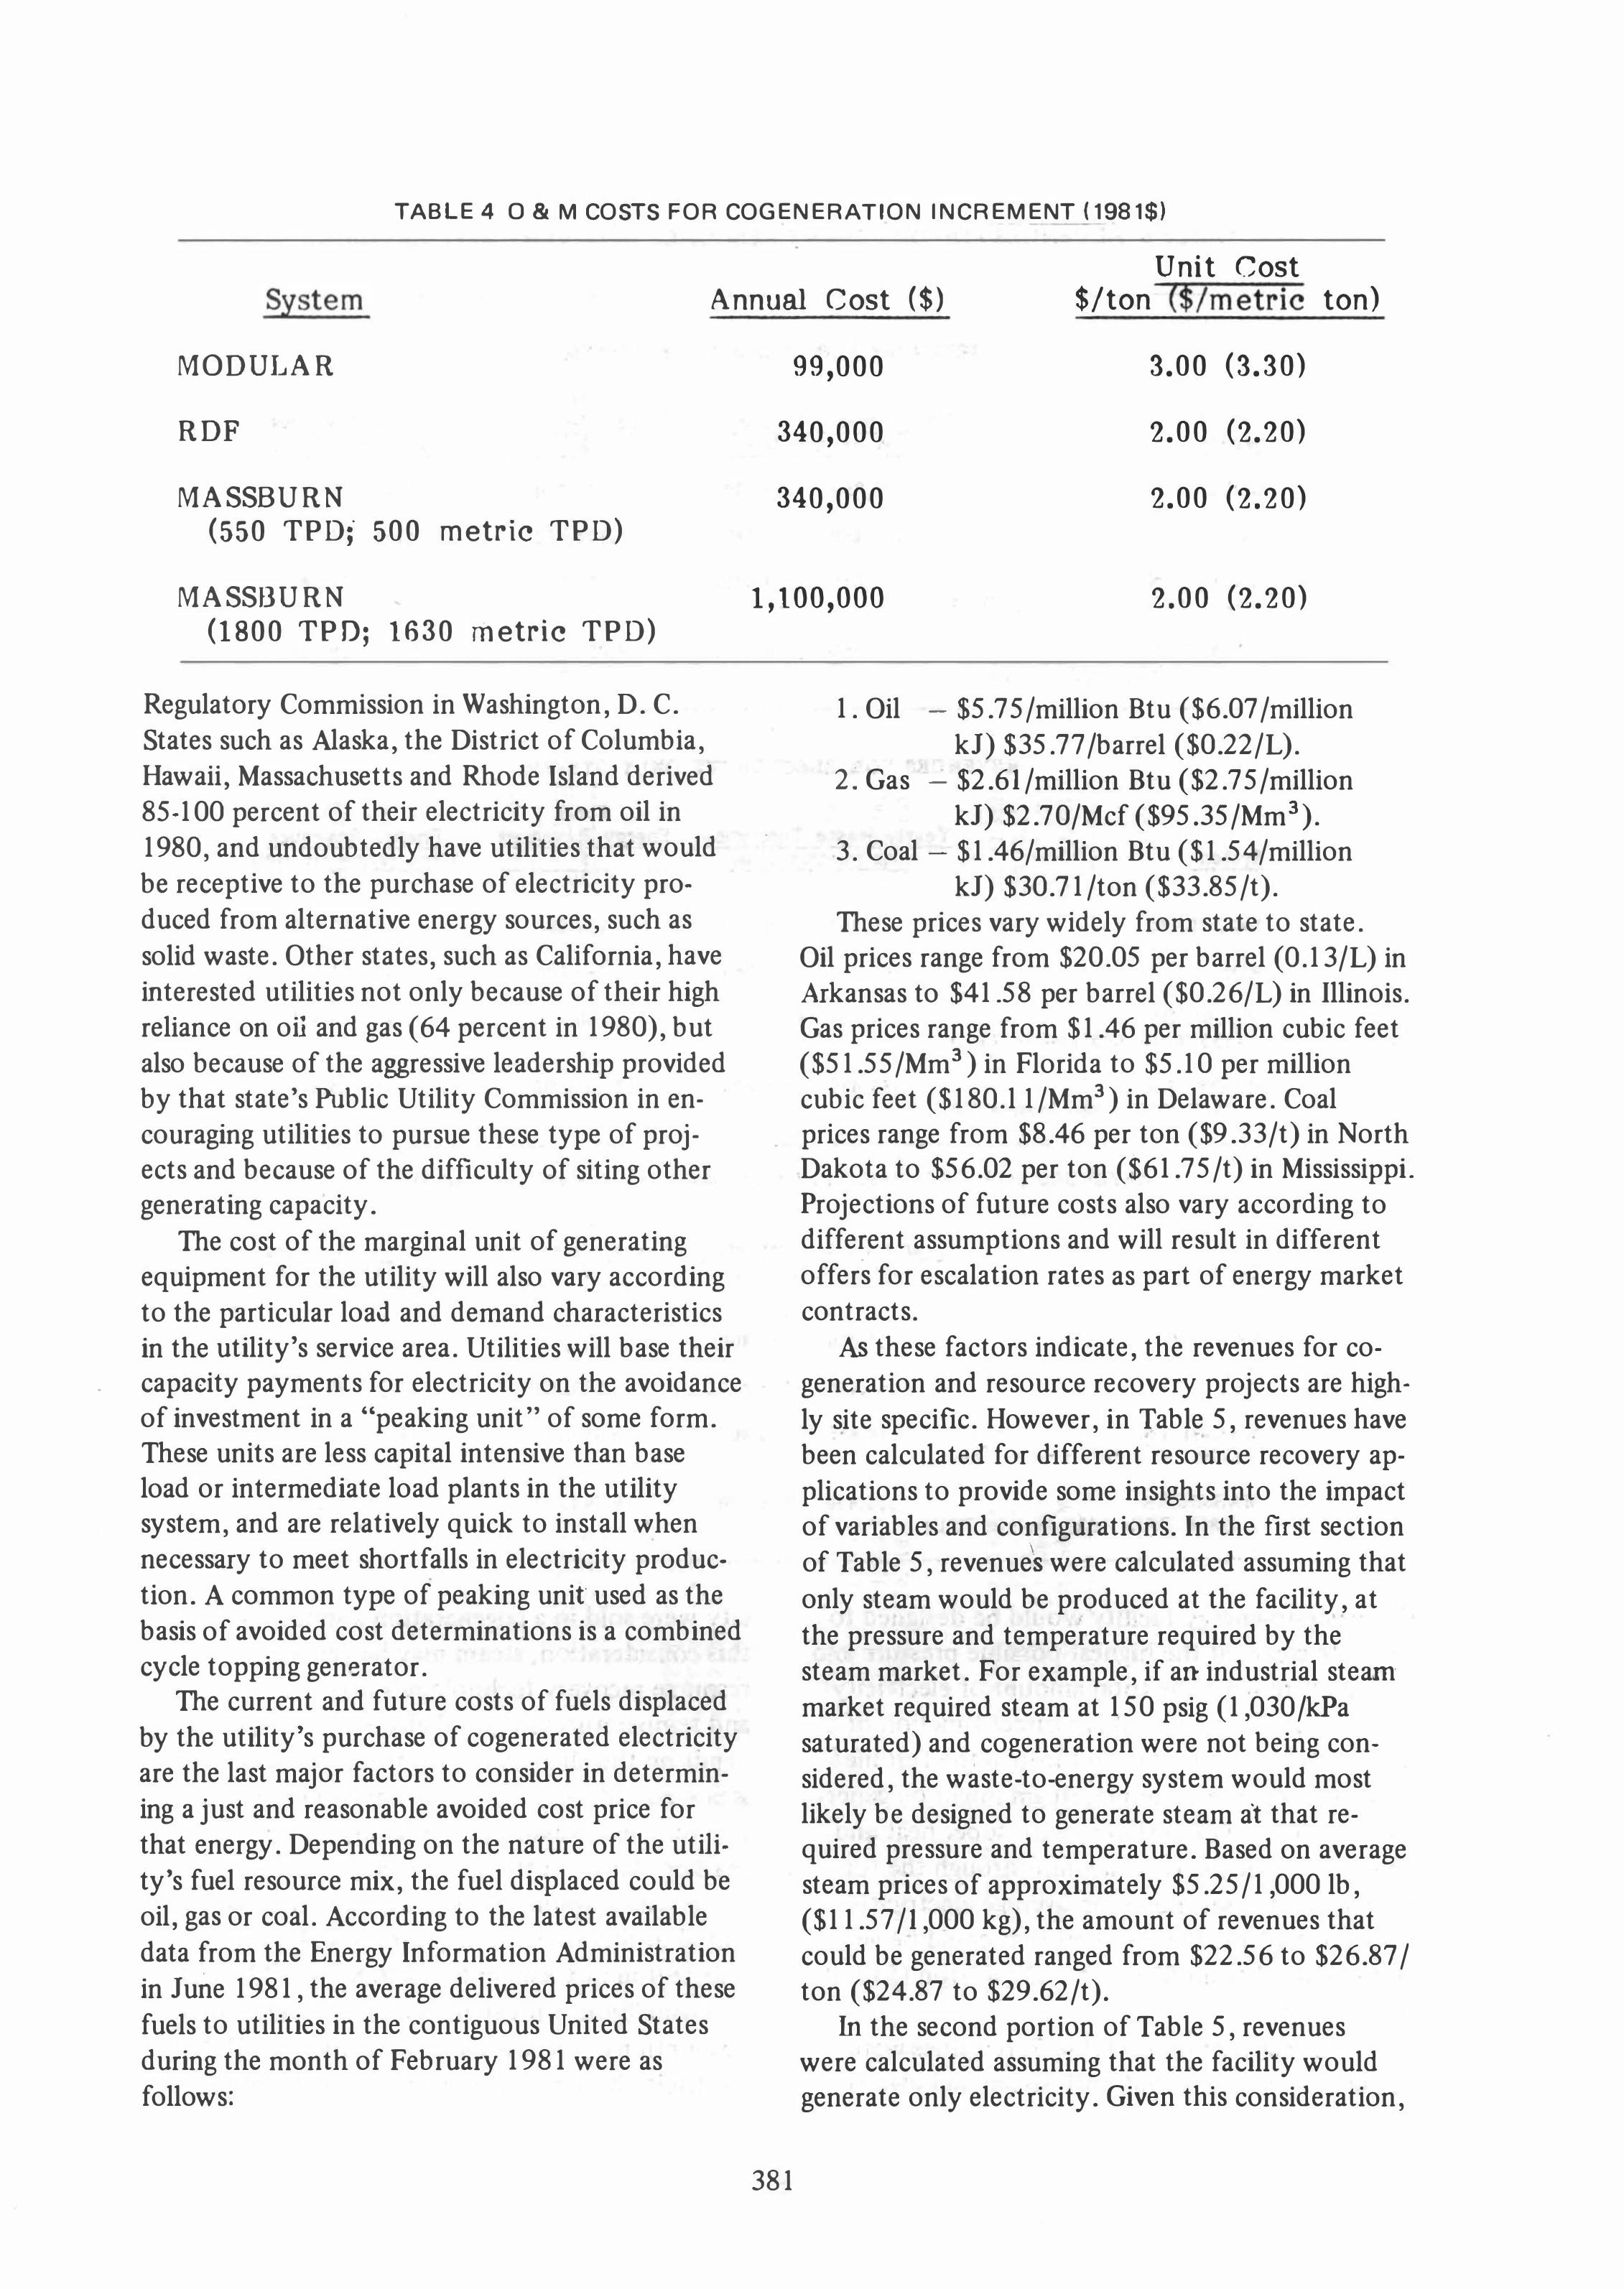
TABLE 4 0 & M COSTS FOR COGENERATION INCREMENT (1981$)
System Annual Cost ($) Unit Cost
$/ton ($/metric ton) MODULAR
RDF
MASSBURN
(550 TPD;' 500 metric TPD)
MASS/JURN
(1800 TPD; 1630 metric TPD)
Regulatory Commission in Washington, D. C. States such as Alaska, the District of Columbia, Hawaii, Massachusetts and Rhode Island derived 85-100 percent of their electricity from oil in 1980, and undoubtedly have utilities that would be receptive to the purchase of electricity produced from alternative energy sources, such as solid waste. Other states, such as California, have interested utilities not only because of their high reliance on oil and gas (64 percent in 1980), but also because of the aggressive leadership provided by that state's Public Utility Commission in encouraging utilities to pursue these type of projects and because of the difficulty of siting other generating capacity.
The cost of the marginal unit of generating equipment for the utility will also vary according to the particular load and demand characteristics in the utility's service area. Utilities will base their capacity payments for electricity on the avoidance of investment in a "peaking unit" of some form. These units are less capital intensive than base load or intermediate load plants in the utility system, and are relatively quick to install when necessary to meet shortfalls in electricity production. A common type of peaking unif used as the basis of avoided cost determinations is a combined cycle topping gen�rator.
The current and future costs of fuels displaced by the utility's purchase of cogenerated electricity are the last major factors to consider in determining a just and reasonable avoided cost price for that energy. Depending on the nature of the utility's fuel resource mix, the fuel displaced could be oil, gas or coal. According to the latest available data from the Energy Information Administration in June 1981, the average delivered prices of these fuels to utilities in the contiguous United States during the month of February 1981 were as follows:
99,000
340,000
340,000
3.00 (3.30)
2.00 (2.20)
2.00 (2.20)
1, tOO,OOO 2.00 (2.20)
•
381
1. Oil - $5.75/million Btu ($6.07/million kJ) $35.77 /barrel ($0.22/L).
2: Gas - $2.61/million Btu ($2.75/million kJ) $2.70/Mcf ($95.35/Mm3).
3. Coal - $1.46/million Btu ($1.54/million kJ) $30.71 /ton ($33.85/t).
These prices vary widely from state to state. Oil prices range from $20.05 per barrel (0.13/L) in Arkansas to $41.58 per barrel ($0.26/L) in lllinois. Gas prices range from $1.46 per million cubic feet ($51.55 /Mm3) in Florida to $5.1 0 per million cubic feet ($180. l 1/Mm3) in Delaware. Coal prices range from $8.46 per ton ($9 .33/t) in North Dakota to $56.02 per ton ($61.75 /t) in Mississippi. Projections of future costs also vary according to different assumptions and will result in different offers for escalation rates as part of energy market contracts.
As these factors indicate, the revenues for cogeneration and resource recovery projects are highly site specific. However, in Table 5, revenues have been calculated for different resource recovery applications to provide some insights into the impact of variables and configurations. In the fust section of Table 5, revenue� were calculated assuming that only steam would be produced at the facility, at
,
the pressure and temperature required by the steam market. For example, if an industrial steam market required steam at 150 psig (1,030jkPa saturated) and cogeneration were not being considered, the waste-to-energy system would most likely be designed to generate steam at that required pressure and temperature. Based on average steam prices of approximately $5.25/1 ,000 lb, ($11.57/1,000 kg), the amount of revenues that could be generated ranged from $22.56 to $26.87/ ton ($24.87 to $29.62/t).
In the second portion of Table 5, revenues were calculated assuming that the facility would generate only electricity. Given this consideration,
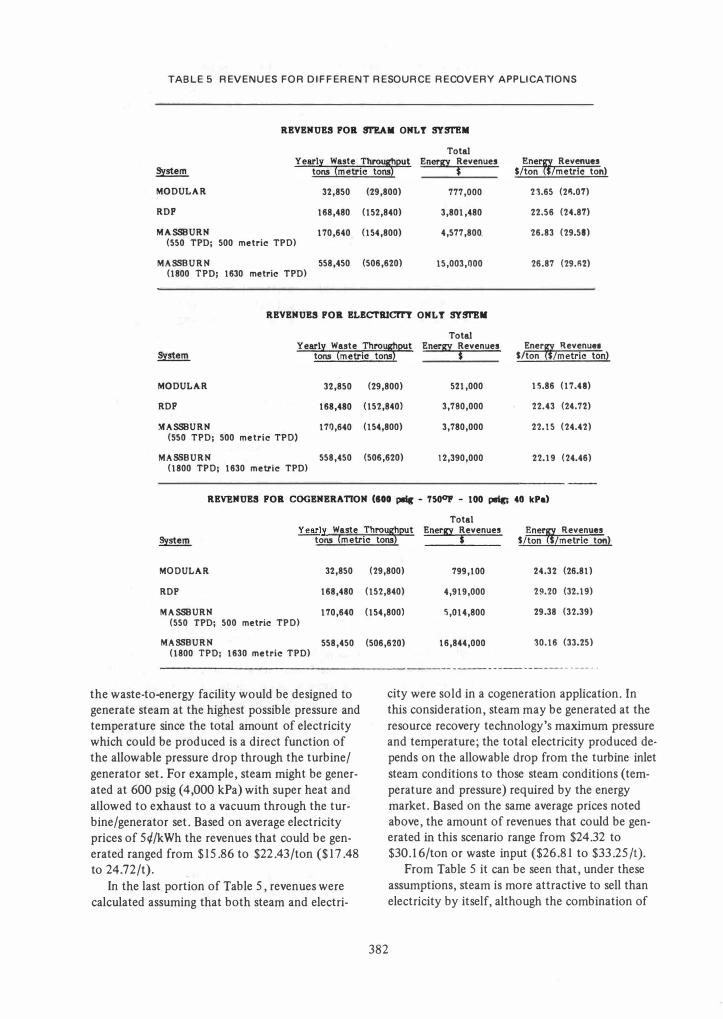
TABLE 5 REVENUES FOR DIFFERENT RESOURCE RECOVERY APPLICATIONS
REVENUES POR Sl'EA1i ONLY SY!JI'BM
System
MODULAR
RDP
Yearly Waste Throu�put tons (metric tons
Total Energy Revenues
$ Ener� Revenues
$/ton /metric ton)
32,850 (29,800) 777,000 23.65 (2fI.07)
22.56 (24.87)
26.83 (29.58) MASSBURN
168,480 (152,840)
170,640 (154,800)
3,801,480
4,577,800. (550 TPD; 500 metric TPO)
MASSBURN 558,450 (506,620) 15,003,000 26.87 (29.flZ) (1800 TPD; 1630 metric TPD)
REVENUES POR ELBCTRlcrrT ONLY SY!JI'BII
Yearly Waste Thro�PUt tons (metric tons
Total Energy Revenues
$ Ener Revenues
$/ton $/metric ton)
MODULAR 32,850 (29,800) 521,000 15.86 (17.48)
RDP 168,480 (152,840) 3,780,000 22.43 (24.7Z)
MASSBURN 170,640 (154,800) 3,780,000 22.15 (24.42) (550 TPD; 500 metric TPO)
MASSBURN 558,450 (506,620) 12,390,000 22.19 (24.46) (1800 TPO; 1630 metric TPD)
REVENUES POR COGENERATION (100 pille - 7500r - 100 psIr, 40 kPa)
Total Yearly Waste Throulthput Energy Revenues
tons (m etric tonS) $ Ener� Revenues
$/ton /metrlc ton)
MOOULAR 32,850
RDF 168,480
MASSBURN 170,640 (550 TPD; 500 metric TPO)
MASSBURN 558,450 (1800 TPO; 1630 metric TPD)
the waste-to-energy facility would be designed to generate steam at the highest possible pressure and temperature since the total amount of electricity which could be produced is a direct function of the allowable pressure drop through the turbine/ generator set. For example, steam might be generated at 600 ps!g (4,000 kPa) with super heat and allowed to exhaust to a vacuum through the turbine/generator set. Based on average electricity prices of 5¢/kWh the revenues that could be generated ranged from $15.86 to $22.43/ton ($17.48 to 24.72/t).
In the last portion of Table 5, revenues were calculated assuming that both steam and electri-
(29,800) 799,100 24.32 (26.81)
(152,840) 4,919,000 29.20 (32.19)
(154,800) 5,014,800 29.38 (32.39)
(506,620) 16,844,000 30.16 (33.25)
city were sold in a cogeneration application. In this consideration, steam may be generated at the resource recovery technology'S maximum pressure and temperature; the total electricity produced depends on the allowable drop from the turbine inlet steam conditions to those steam conditions (temperature and pressure) required by the energy market. Based on the same average prices noted above, the amount of revenues that could be generated in this scenario range from $24.32 to $30.l6/ton or waste input ($26.81 to $33.25 It).
From Table 5 it can be seen that, under these assumptions, steam is more attractive to sell than electricity by itself, although the combination of
382
w
00
w
TA
BL
E 6
O
VE
RA
LL
EC
ON
OM
IC I
MP
AC
T O
F A
LT
ER
NA
TIV
E S
YS
TE
M C
ON
FIG
UR
AT
ION
S
System
•
Stea
m on
ly
'<tOO
(1
00 T
PD;
90 m
etr
ic
TPD
) RD
P (6
00 T
PD;
540
me
tric
T
PD)
MB
(5
50 T
PD;
SOO
met
ric
TPD
) M
B
(180
0 T
PD;
1980
me
tric
TPD
)
Elec
tric
ity
Only
:\tOO
(1
00 T
PD;
90 m
etri
c T
PD)
RD
P (6
00 T
PD;
540
me
tric
TPD
) M
B
(5S0
TPD
; 50
0 m
etri
c T
PD)
MB
(1
800
TPD
; 19
80 m
etric
TPD
)
Cog
ener
ation
MOD
(1
00 T
PD;
90 m
etri
c T
PD)
RDF
(600
TPD
; 54
0 m
etric
TPD
) '<t
B
(550
TPD
: 50
0 m
etri
c T
PD)
MB
(1
800
TPD
; 19
80 m
etr
ic T
PD)
-MOD
R
DF
:\IB
-
Mod
ular
Re
fuse
Der
ived
Fue
l :\t
assbu
ming
SCEN
ARI
O A
$5.2
5/10
00 •
(1
1.S7
/100
0 k g
) an
d $0
.07/
kwh
Tipp
ing
Fe
es
Net
Cos
t as
JI,f
ore
th
an
Year
ly
Costs
Re
venu
es
TiP8 i
n g F
ee
s St
eam
Pro
ject
s Cos
ts (
$) $
/ton
($7m
etri
c to
n)
(S7ton
\ (s
7ton
l -$
/ton
\
1,65
1,40
0 SO
.2S
(S5.3
9)
23.7
2 (2
6.15
) 26
.53
(29.
24)
8,50
1,00
0 50
.46
(55.
62)
27.1
7 (2
9.9S
) 23
.27
(25.
65)
-6,
910,
000
39.9
1 (4
3.99
) 26
.83
(29.
57)
13.0
8 (1
4.42
) -
17,9
39,4
00
32.1
2 (3
S.41
) 28
.87
(31.
82)
5.25
(5.
79)
-
1,87
4,00
9 57
.05
(62.
89)
22.2
3 (2
4.50
) 34
.82
(38.
38)
8.2
9
(9.1
4)
9,28
0,85
4 56
.43
(62.
20)
31.4
1 (3
4.62
) 25
.02
(27.
58)
1.75
0.9
3)
7,64
6,64
1 44
.81
(49.
40)
31.0
1 (3
4.18
) 13
.80
(15.
21)
0.72
CO.
79)
19,7
16,4
12
35.3
1 (3
8.92
) 31
.09
(34.
27)
4.2
2 (4
.6
S)
(1.0
3) (
-1.1
4)
1,77
4,76
1 54
.03
(59.
56)
25.8
7 (2
8.52
) 28
.16
(31.
04)
l.63
(1.8
0)
9,08
3,12
3 5S
.22
(60.
87)
28.7
1 (3
1.65
) 26
.51
(29.
22)
3 .24
(3
.57)
7,
498,
603
43.9
4 (4
8.44
) 31
.88
(35.
14)
12
.06
(13.
29)
(1.0
2) (
-1.1
2)
19,2
48,0
06
34.4
7 (3
8.00
) 31
.97
(35.
24)
2.50
(2.
76)
(2.7
S) (
-3.0
3)
,
SCE
NA
RIO
B
$6.0
0/10
00 #
($
13.2
3/10
00 k
g) a
nd S
O.OS
/kw
h
Tio
pin
l("
Fe
es
Ne
t C:o
st
\10
re
tha
n
Re
ve
nu
es
TiP f(i n
g Fe
es
Stea
m P
roje
cts
(S/to
n\
It/to
n)
S/to
n\
�7. 7
3 (3
0.57
\ ?'�
.52
(24.
82)
-
28.0
5 (�
0.92
) 2
�.4
1 (2
4.70
\ 31
.88
(35.
14)
8.0
3
(8.8
5)
-
31.9
3 (3
5.20
) 0.
19 (
0.21
) -
1�.8
6 (1
7.4
8)
41
.1!I
(4
�.4
0)
18
.67
(20.
�8
\ 22
.43
(24.
72)
14.0
0 (3
7.4
8)
11.5
9 (1
2.7
8\
22.1
5 (2
4.42
) n
n6
(2
4.9
8)
14
.n3
(I
n.P
)
22
.19
(2
4.41;
) 13
.12
(14.
46)
12
.93
0
4.2
5)
24.3
2 (2
6.81
) 29
.71
(32.
75
) 7.
19 (
7.93
) 29
.20
(32.
19)
26.0
2 (2
8.6
8)
�.IH
(3.
98)
29
.38
(3
2.39
) 14
.56
(16.
0S)
6.�1
(7.
20)
10.1
6 (3
3.25
) 4
.31
(4
.75
) 4
.12
(4
.�4
)

them in a cogeneration application can surpass either alone. Significantly, the feasibility and worthiness of cogeneration is affected by both economic and technical factors. These include:
1. The relative value of each energy form (steam and electricity) at the specific location under con-
, sideration. 2. The required steam conditions of the proj
ect's steam market. 3. The maximum steam conditions (tempera
ture and pressure) which can be achieved by available resource recovery technologies.
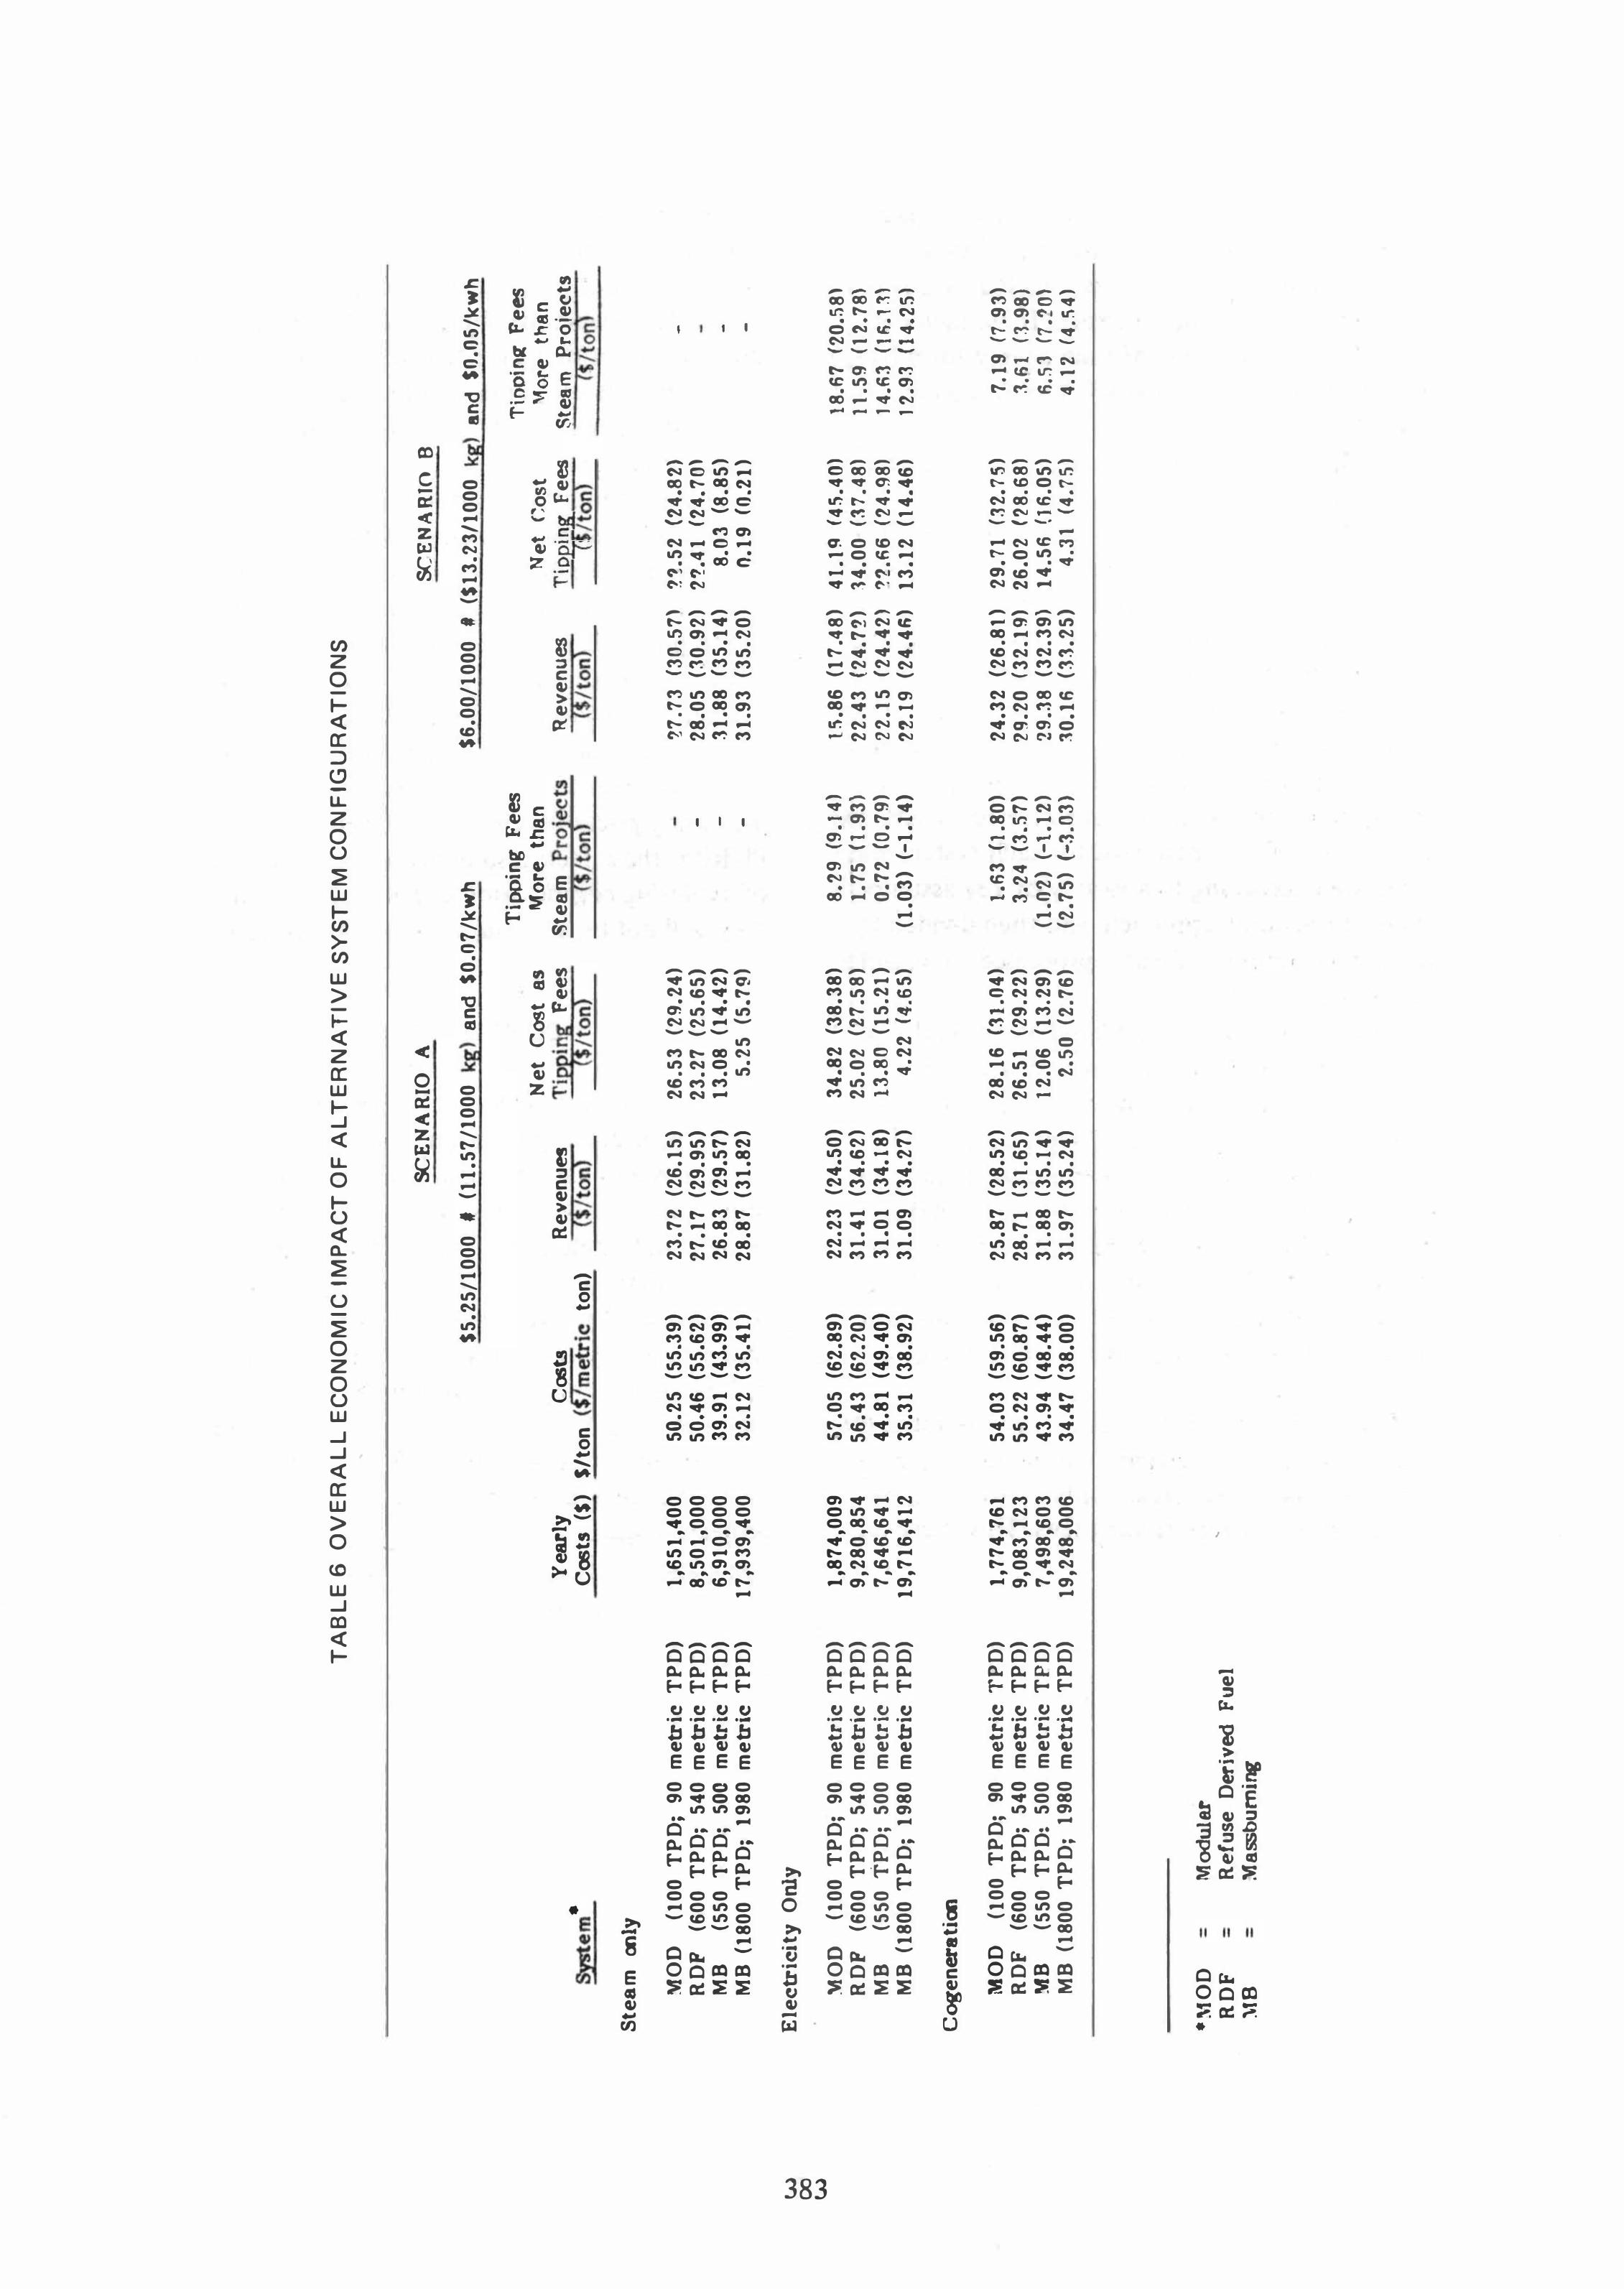
Although the costs and revenues for cogeneration systems vary widely as noted above, Table 6 presents an overview of the impact on the tipping fees for the entire resource recovery project under different price conditions, technology options, and system configurations (steam, electric and cogeneration). The annual cost for each system was calculated according to a variety of key assumptions of operating approach, and then divided by the annual amount of waste processed to obtain a unit cost.
The revenues were calculated based on different prices for both steam and electricity. In Scenario A, a relatively low steam price was used, and a relatively high electricity price, reflecting current price conditions in certain sections of the country. The net cost (or tipping fee) was then calculated by subtracting the unit revenues from the unit costs. To facilitate comparisons between the different configurations, the steam-only configuration was used as a base to which the other two were compared.
In all but three of the cases noted on Table 6, cogeneration and electricity configurations were
, more expensive than steam-only configurations for resource recovery tipping fees. This is primari-
ly a result of the particular costs selected for comparison, and does not provide a general rule. Although the three promising cogeneration cases in this Table were massburning technologies, this does not mean that the other technologies cannot have favorable economic conditions for cogeneration, but rather that they did not in these particular situations.
The most important information obtained from this Table is the relative impact of price shifts in the two different scenarios. Although there were only small changes in price conditions, the tipping fees were affected dramatically. Clear-1y the developer must negotiate a strong energy market agreement or combination of agreements in order to achieve favorable economic conditions for tipping fees for waste diSposal. Considering the increasing prices for electricity resulting from PURP A, these facts also indicate the importance of exploring cogeneration opportunities, although they will not be advantageous in every situation.
CONCLUSION
In the future development of resource recovery projects, cogeneration opportunities should 'be explored as having a significant potential for improving the economics of the project. With the passage and implementation of PURP A guidlines, state regulatory agencies are encouraging greater participation by investor-owned utilities in resource recovery than previously was possible.
384
This regulatory impetus, combined with the major increase in prices for energy, provides an increasingly attractive climate for the developn:lent of cogeneration and resource recovery projects.
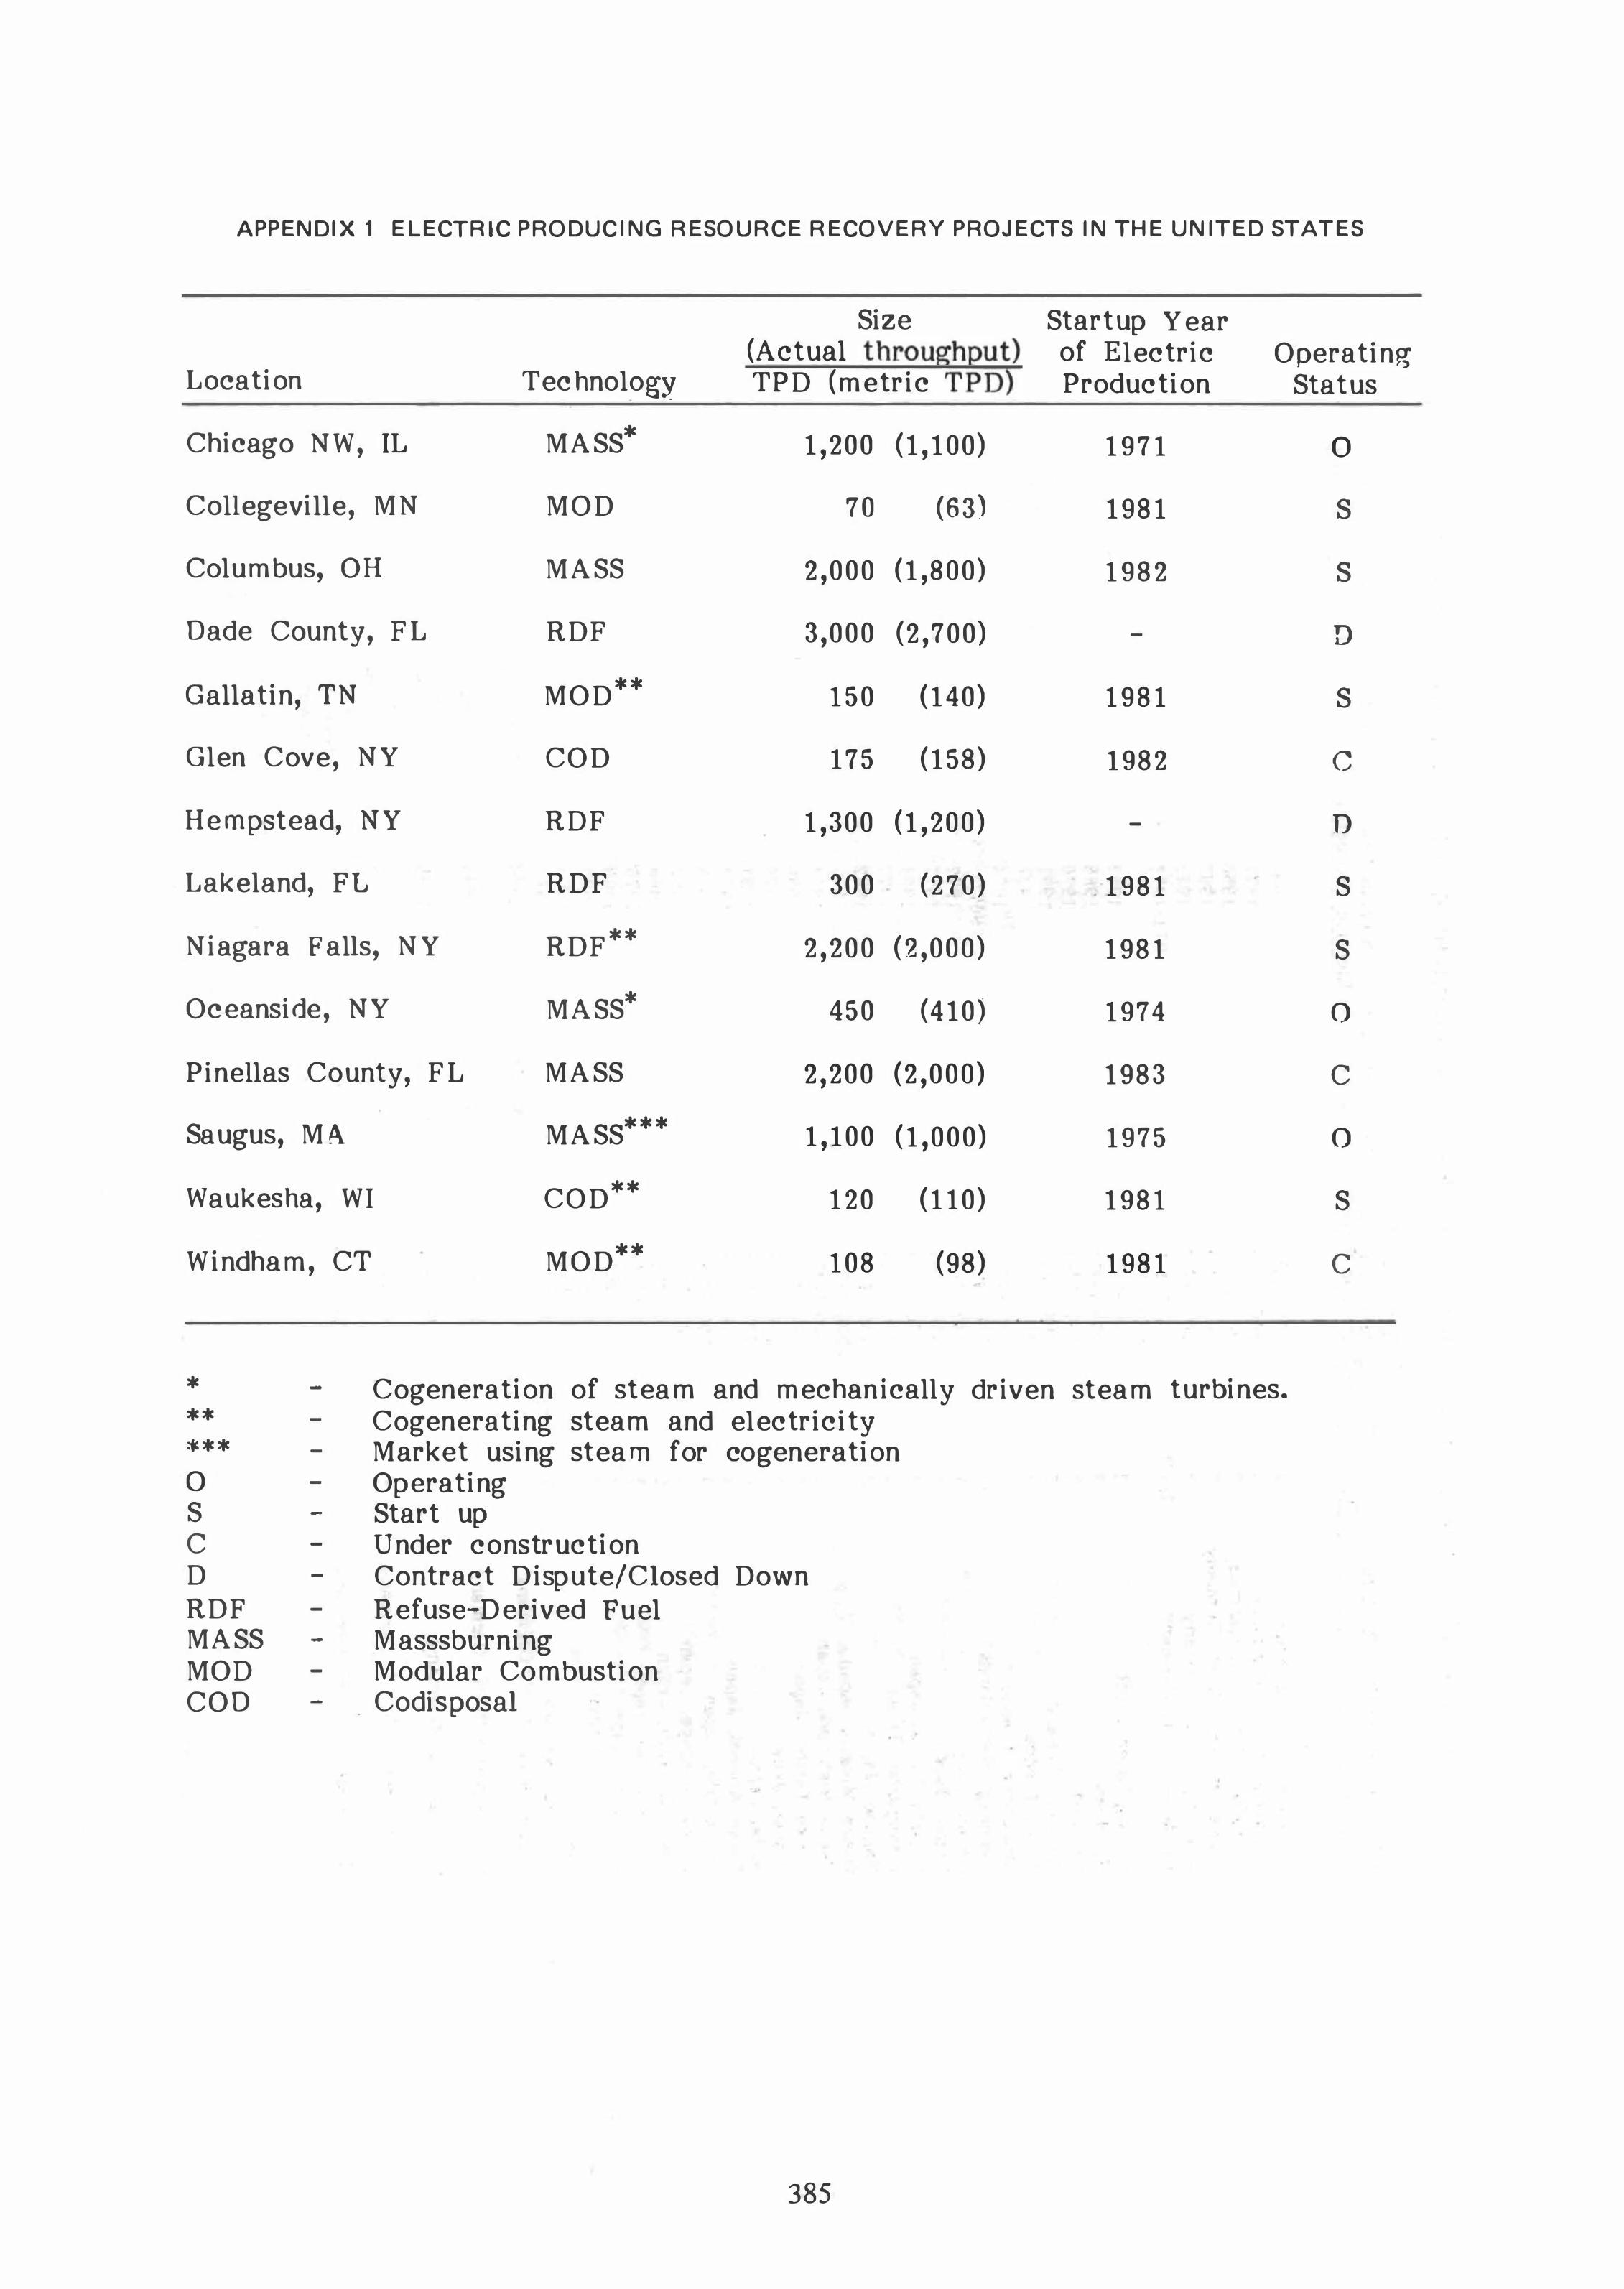
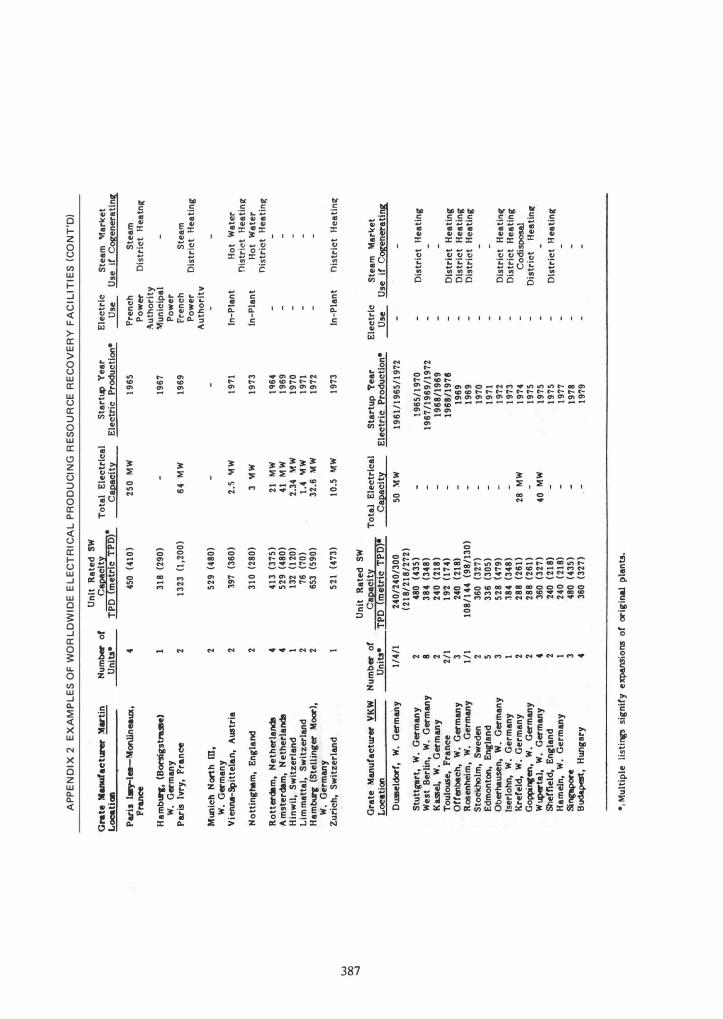
APPENDIX 1 ELECTRIC PRODUCING RESOURCE RECOVERY PROJECTS IN THE UNITED STATES
Size Startup Year (Actual throughQut) of Electric Operating-TPD (metric TPD) Location
Chicago NW, IL
Collegeville, MN
Columbus, OH
Dade County, FL
Gallatin, TN
Glen Cove, NY
Hempstead, NY
Lakeland, FL
Niagara Falls, NY
Oceanside, NY
Pinellas County, FL
Saugus, MA
Waukesha, WI
Windham, CT
Technology
MASS*
MOD
MASS
RDF
MOD**
COD
RDF
RDF
RDF**
MASS*
MASS
MASS***
COD**
MOD**
1,200 (1,100)
70 (63)
2,000 (1,800)
3,000 (2,700)
150 (140)
175 (158)
1,300 (1,200)
300 (270)
2,200 (2,000)
450 (410)
2,200 (2,000)
1,100 (1,000)
120 (110)
108 (98)
Production
1971
1981
1982
-
1981
1982
-
.1981
1981
1974
1983
1975
1981
1981
* **
-
-
Cogeneration of steam and mechanically driven steam turbines. Cogenerating steam and electricity
*** o S C D RDF MASS MOD COD
-
-
-
-
-
-
-
-
-
Market using steam for cogeneration Operating Start up Under construction Contract Dispute/Closed Down Refuse-Derived Fuel Masssburning Modular Combustion
. Codis posal
385
Status
0
S
S
D
S
c
D
S
S
o
C
o
S
C
AP
PE
ND
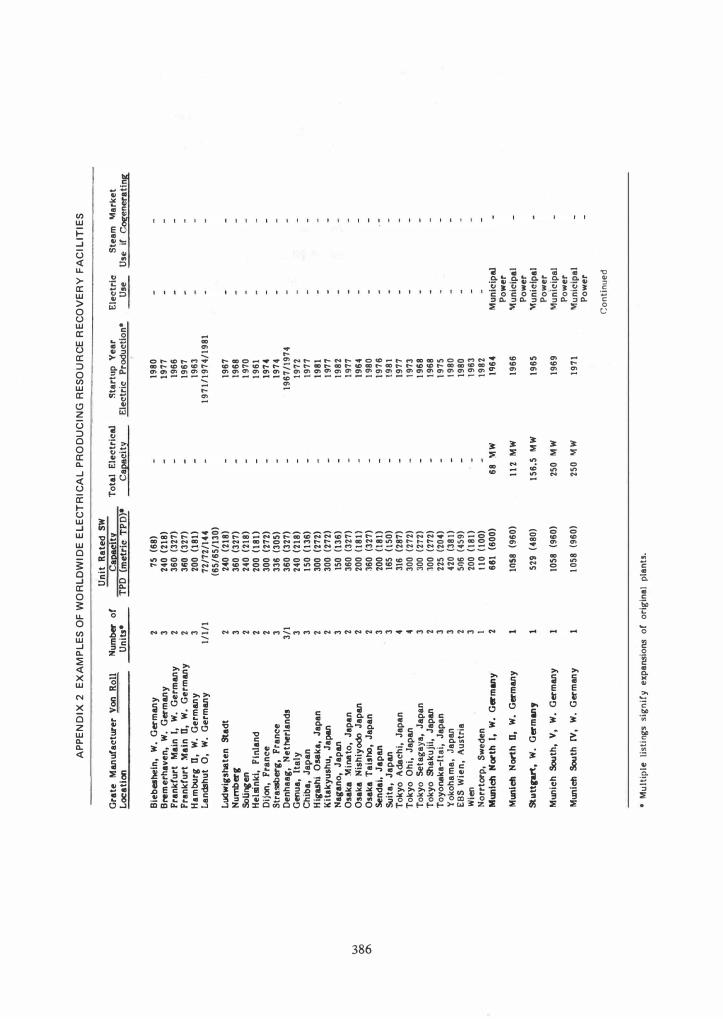
IX 2
E
XA
MP
LE
S O
F W
OR
LD
WID
E E
LE
CT
RIC
AL
PR
OD
UC
ING
RE
SO
UR
CE
RE
CO
VE
RY
FA
CIL
ITIE
S
Uni
t R
ated
SW
Gra
te M
anuf
actur
er V
on R
oll
Num
ber o
f C
al!!£itI
To
tal
Elec
tric
al
!'ltar
tup
Yea
r El
ectr
ic
Stea
m
il,far
ket
Locat
ion
Uni
ts-
TPD
(m
etri
c T
PD)
-Ca
paci
tI
Elec
tric
Pr
oduc
tion"
Us
e U
se i
f Cog
ener
atlng
Bieb
eshe
in,
W.
Ger
man
y 2
75 (
68)
1980
B�
mer
l)ave
n, W
. G
erm
any
3 24
0 (2
18)
1977
Fr
ankf
urt
Mai
n I,
W.
Ger
man
y 2
360
(327
) 19
66
Fran
kfur
t :'<f
ain
0,
W.
Ger
man
y 2
3fiO
(327
) 19
67
Ham
burg
0,
W.
Ger
man
y 3
200
(181
) 19
63
Lands
hut
0,
W.
Ger
man
y 1/
1/1
72/7
2/14
4 19
71/1
974/
1981
(6
5/65
/130
) Lud
wig
shate
n St
adt
2 24
0 (2
18)
1967
N
umber
g 3
360
(327
) 19
68
Soling
en
2 24
0 (2
18)
1970
He
lsink
i, Fi
nlan
d 2
200
(181
) 19
61
Dijan
, Fr
ance
2
300
(272
) 19
74
Stra
ssber
g, F
ranc
e 3
336
(305
) 19
74
Den
haag
, N
ethe
rlan
ds
3/1
360
(327
) 19
67/1
974
Gen
ua,
Ital
y 3
240
(218
) 19
72
Chl
ba,
Japa
n 3
150
(136
) 19
77
Hig
ashi
Osa
ka,
Japa
n 2
300
(272
) 19
81
Kit
akyu
shu,
Japan
2
300
(272
) 19
77
Nag
ano,
Jap
an
3 15
0 (1
36)
1982
O
saka
:'<f
i08to
, Ja
pan
2 36
0 (3
27)
1977
w
O
saka
Nis
hiyodo
Jap
an
2 20
0 (\
80
1964
00
0'1
O
saka
Tai
shO,
Japa
n 2
360
(327
) 19
80
Send
ai,
Japa
n 3
200
(181
) 19
76
Suit
a, J
apan
3
165
(\50
) 19
81
Toky
o A
dach
i, Ja
pan
4 31
6 (2
87)
1977
T
okyo
Ohi
, Ja
pan
4 30
0 (2
72)
1973
To
kyo
Seta
gaya
, Ja
pan
3 30
0 (2
72)
1968
To
kyo
Shak
ujii,
Jap
an
2 30
0 (2
72)
1968
To
yona
ka-[
tai,
Japa
n 3
225
(204
) 19
75
Yok
oha
ma,
Jap
an
3 42
0 (3
81)
1980
EB
S W
ien,
Aus
tria
2
506
(459
) 19
80
Wien
3
200
(181
) 19
63
Norr
torp,
Sw
eden
1
110
(100
) 19
82
Mun
leh N
orth
I,
W.
Ger
man
y 2
681
(600
) 68
MW
19
64
Mun
icip
al
Pow
er
Muni
eh N
orth
0,
W.
Ger
man
y 10
S8 (
960)
11
2 M
W
1966
l'I
Iunic
ipai
Po
wer
st
uttgart
, W
. G
erm
any
529
(480
) 15
6.5
MW
19
65
'fun
ielp
al
Pow
er
Mun
ich
South
, V
, W
. G
erm
any
1058
(96
0)
250
MW
19
69
!I.1un
icip
al
Pow
er
Mun
ich Sou
th IV
, W
. G
erm
any
1058
(96
0)
250
il,fW
19
71
!I.1un
icip
al
Pow
er
Con
tinu
ed
•
Mul
tipl
e lis
ting
s si
gni
fy e
xpans
ions
of
orig
inal
pla
nts.
AP
PE
ND
IX 2
E
XA
MP
LE
S O
F W
OR
LD
WID
E E
LE
CT
RIC
AL
PR
OD
UC
ING
RE
SO
UR
CE
RE
CO
VE
RY
FA
CIL
ITIE
S (
CO
NT
'D)
Uni
t R
ated
SW
Gra
te M
anufae
turer :'I
I.ti
n N
umber
of
C!,Q!ci
t:z:
Tot
al E
lect
rica
l St
artup
Yea
r El
ectr
ic
Stea
m \1
arl<e
t L
ocati
on
--U
nits
-T
PD {
met
ric
TPD)
· C
al!ac
it:z:
Elec
tric
Prod
ucti
on-
�
Use
if
C!!8:en
erat
inll'
Paris
I�
I_-M
onlinea
ux,
4 45
0 (4
10)
250
MW
19
65
Pren
ch
Stea
m
Prane
e Po
wer
D
istr
ict
H ea
tng
Aut
hori
ty
Ham
burg,
(Borsi
gstras
se) 31
8 (2
90)
1967
\f
unic
ipal
W
. G
erm
any
Pow
er
Par
is I
vry,
Fra
nce
2 13
23 (
1,20
0)
64 M
W
1969
Fr
ench
St
eam
Po
wer
D
istr
ict
Hea
ting
A
utho
ritv
M
unic
h N
orth
m,
2 52
9 (4
80)
W.
Ger
man
y V
ienna-Sp
itte
lan,
A
ustr
ia
2 �9
7 (3
60)
2.5
\1W
19
71
In-P
lant
H
ot W
ater
O
istr
ict
Hea
ting
N
otti
ngha
m,
Engl
and
2 31
0 (2
80)
3 \1
W
1973
In
-Pla
nt
Hot
Wat
er
Ois
tric
t H
eati
ng
Rot
terdam
, N
ether
lands
4
413
(375
) 21
MW
19
64
Am
ster
dam
, N
ethe
rlands
4
529
(480
) 41
MW
19
69
Hin
wil,
Sw
itze
rian
d 1
132
(120
) 2.
34
MW
19
70
Lim
mat
tal,
Swit
zerl
and
2 76
(70
) 1.
4 \1
W
1971
H
amburg
(St
elli
nger
Moor
),
2 65
3 (5
90)
32.6
MW
19
72
W.
Ger
man
y Zu
ricll
, Sw
itze
rlan
d 52
1 (4
73)
10.5
I\f
W
1973
In
-Pla
nt
Ois
tric
t H
eati
nll'
w
00
-.l
Uni
t R
ated
SW
G
rate
Man
ufac
turer V
KW
N
umber
of
CaJ2!
cit:z:
T
otal
Ele
ctri
cal
Star
tup
Yea
r El
ectr
ic
Stea
m
l\1ar
l<et
Locat
ion
Uni
ts-
TPD
(m
etri
c T
PD�I
C
aJ2!ci
t:z:
Elec
tr'ic
Pro
duct
ion-
�
Use
if
C!!8:en
euti
ng
Dus
seldor
f,
W.
Ger
man
y 1/
4/1
240/
240/
300
50
MW
19
61/1
965/
1972
(2
18/2
18/2
72)
Stut
tgart
, W
. G
erm
any
2 48
0 (4
35)
1965
/197
0 D
istr
ict
Hea
ting
W
est
Berl
in,
W.
Ger
man
y 8
384
(348
) 19
67/1
969/
1972
K
assel
, W
. G
erm
any
2 24
0 (2
18)
1968
/196
9 T
oulo
use,
Fra
nce
2/1
192
(174
) 19
68/1
978
Dis
tric
t H
eati
ng
Off
enba
ch,
W.
Ger
man
y 3
240
(218
) 19
69
Dis
tric
t H
eati
ng
Ros
enhe
im,
W.
Ger
man
y 1/
1 10
8/14
4 (9
8/13
0)
1969
D
istr
ict
Hea
ting
St
oekho
lm,
Swed
en
2 36
0 (3
27)
1970
£d
mon
ton,
Engl
and
5 33
6 (3
05)
1971
O
berha
usen,
W.
Ger
man
y 3
528
1479
) 19
72
Dis
tric
t H
eati
nlt
Iser
lohn
, W
. G
erm
any
1 38
4 (3
48)
1973
D
istr
ict
Hea
ting
K
refe
ld,
W.
Ger
man
y 2
288
(261
) 28
MW
19
74
Cod
isDOSl
li G
oppincen
, W
. G
erm
any
2 28
8 (2
61)
1975
D
istr
ict
Hes
tinll'
W
up4!I'ta
l,
W.
Ger
man
y -4
360
(327
) 40
MW
19
75
Shef
fiel
d, E
ngla
nd
2 24
0 (2
18�
1975
D
istr
ict
Hea
ting
H
amei
n, W
. G
erm
any
1 24
0 (2
18)
1977
Si
ngapore
3 48
11 (4
35)
1978
"B
udapest,
Hun
gary
4
360
(327
) 19
79
., M
ulti
ple
listi
ngs s
igni
fy e
xpansions
of
orig
inal [t
lants
.
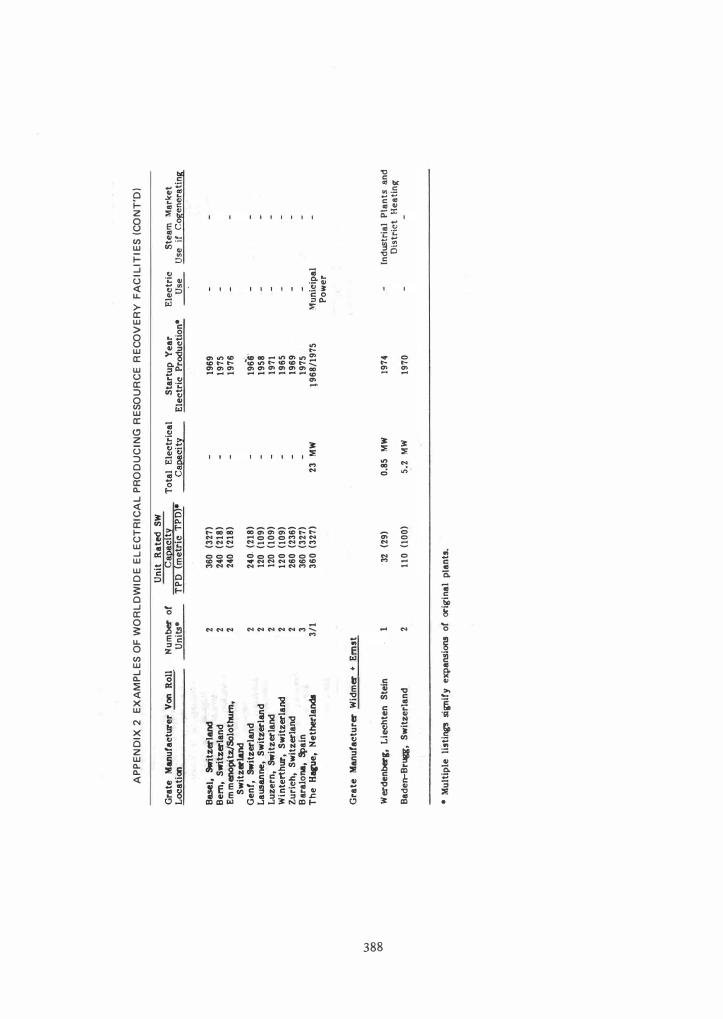
AP
PE
ND
IX 2
E
XA
MP
LE
S O
F W
OR
LD
WID
E E
LE
CT
RIC
AL
PR
OD
UC
ING
RE
SO
UR
CE
RE
CO
VE
RY
F
AC
ILIT
IES
(C
ON
T'D
)
Uni
t R
ated
SW
G
rate
Mll
llufac
turer
Von
Rol
l N
umber
of
Ca�
cit:t
To
tal
Elec
tric
al
Star
tup
Year
El
ectr
ic
Ste
am
M
ark
et
Locat
ion
Uni
ts-
TPD
(m
etri
c TP
D)-
Capa
city
El
ectr
ic P
roduc
tion-
�
Use
it
Cog
en
era
ting
Basel,
Switz
erland
2
360
(327
) 19
69
Bern
, Swi
tzer
land
2
240
(218
) 19
75
Em m
enopi tz/
Solo
thurn,
2 24
0 (2
18)
1976
Sw
itzer
land
1961l
' G
enf,
Swit
zerlan
d 2
240.
(21
8)
Laus
anne
, Sw
itzer
land
2 12
0 (1
09)
1958
Lu
zern
, Sw
itzer
land
2
120
(l09
) 19
71
Win
tert
hur,
Switz
erla
nd
2 12
0 (l
09)
1965
Zu
rich
, Sw
itzer
land
2
260
(236
) 19
69
Bar
alona
, Sp
ain
3 36
0 (3
27)
1975
T
he H
ague,
Net
herla
nds
3/1
360
(327
) 23
MW
19
68/1
975
Mun
icip
al
Pow
er
Gra
te M
anuf
actu
rer W
idm
er +
Ern
st
w
00
00
Wer
denber
g, L
iecht
en S
tein
32
(2
9)
0.85
M
W
1974
In
dus
tria
l P
lan
ts a
nd
D
istr
ict
He
ati
ng
Ba
den-
Brug
g, Sw
itzer
land
2
110
(100
) 5.
2 M
W
1970
-M
ulti
ple
listi
ngs si
gnif
y exp
ans
ions
ot or
igin
al p
lant
s.


