Pub
lic D
iscl
osur
e A
utho
rized
Pub
lic D
iscl
osur
e A
utho
rized
Pub
lic D
iscl
osur
e A
utho
rized
Pub
lic D
iscl
osur
e A
utho
rized
Pub
lic D
iscl
osur
e A
utho
rized
Pub
lic D
iscl
osur
e A
utho
rized
Pub
lic D
iscl
osur
e A
utho
rized
Pub
lic D
iscl
osur
e A
utho
rized

THE WORLD BANK OFFICE PHNOM PENH
No. 113 Norodom Boulevard
Phnom Penh, Cambodia
Tel: (855 23) 861 300
Fax: (855 23) 861 301
Printed in August 2014
Improving Trade Competitiveness in Cambodia: An Analysis Using a Trade and Transport Facilitation Assessment
(TTFA) is a product of staff of the World Bank. The fi ndings, interpretation and conclusions expressed
herein do not necessarily refl ect the views of the Board of Executive Directors of the World Bank
the governments and donors they represent.
The World Bank does not guarantee the accuracy of the data included in this work. The boundaries, colors,
denominations, and other information shown on any map in this work do not imply any judgment on the part
of the World Bank concerning the legal status of any territory or the endorsement or acceptance of such
boundaries.
Cover photographs are Copyright World Bank.

A Trade Development Report
IMPROVING TRADE COMPETITIVENESS IN CAMBODIA: AN ANALYSIS USING A TRADE AND TRANSPORT FACILITATION ASSESSMENT (TTFA)
Table of Contents
ACKNOWLEDGEMENT - - - - - - - - - - - - - - - - - - - - - - - - - - - - - - - - - - - - - - - - - - - - - - - - - - - - - - - - - - - - - - - - - - - - - - - - X
ACRONYMS AND ABBREVIATIONS - - - - - - - - - - - - - - - - - - - - - - - - - - - - - - - - - - - - - - - - - - - - - - - - - - - - - - - - - - - - - XI
EXECUTIVE SUMMARY - - - - - - - - - - - - - - - - - - - - - - - - - - - - - - - - - - - - - - - - - - - - - - - - - - - - - - - - - - - - - - - - - - - - - - - 1
1. METHODOLOGY AND ORGANIZATION OF PHASE II TTFA - - - - - - - - - - - - - - - - - - - - - - - - - - - - - - - - - - - - - - - 5
1.1 Methodology - - - - - - - - - - - - - - - - - - - - - - - - - - - - - - - - - - - - - - - - - - - - - - - - - - - - - - - - - - - - - - - - - - - - - - - - - 6
1.2 Organization of the Survey - - - - - - - - - - - - - - - - - - - - - - - - - - - - - - - - - - - - - - - - - - - - - - - - - - - - - - - - - - - - - - 7
1.3 Key Concepts - - - - - - - - - - - - - - - - - - - - - - - - - - - - - - - - - - - - - - - - - - - - - - - - - - - - - - - - - - - - - - - - - - - - - - - - 8
2. RICE - - - - - - - - - - - - - - - - - - - - - - - - - - - - - - - - - - - - - - - - - - - - - - - - - - - - - - - - - - - - - - - - - - - - - - - - - - - - - - - - - - - - - 11
2.1 Trade and markets - - - - - - - - - - - - - - - - - - - - - - - - - - - - - - - - - - - - - - - - - - - - - - - - - - - - - - - - - - - - - - - - - - - - 12
2.2 Industrial organization - - - - - - - - - - - - - - - - - - - - - - - - - - - - - - - - - - - - - - - - - - - - - - - - - - - - - - - - - - - - - - - - 12
2.3 Business models - - - - - - - - - - - - - - - - - - - - - - - - - - - - - - - - - - - - - - - - - - - - - - - - - - - - - - - - - - - - - - - - - - - - - 13
2.4 Supply chain structure - - - - - - - - - - - - - - - - - - - - - - - - - - - - - - - - - - - - - - - - - - - - - - - - - - - - - - - - - - - - - - - - 13
2.5 Supply Chain Performance - - - - - - - - - - - - - - - - - - - - - - - - - - - - - - - - - - - - - - - - - - - - - - - - - - - - - - - - - - - - 15
2.6 Objectives and Strategies - - - - - - - - - - - - - - - - - - - - - - - - - - - - - - - - - - - - - - - - - - - - - - - - - - - - - - - - - - - - - 16
2.7 Implementation - - - - - - - - - - - - - - - - - - - - - - - - - - - - - - - - - - - - - - - - - - - - - - - - - - - - - - - - - - - - - - - - - - - - - - 17
3. GARMENTS - - - - - - - - - - - - - - - - - - - - - - - - - - - - - - - - - - - - - - - - - - - - - - - - - - - - - - - - - - - - - - - - - - - - - - - - - - - - - - 19
3.1 Trade - - - - - - - - - - - - - - - - - - - - - - - - - - - - - - - - - - - - - - - - - - - - - - - - - - - - - - - - - - - - - - - - - - - - - - - - - - - - - - - 20
3.2 Business Models - - - - - - - - - - - - - - - - - - - - - - - - - - - - - - - - - - - - - - - - - - - - - - - - - - - - - - - - - - - - - - - - - - - - - 22
3.3 Supply Chain Performance - - - - - - - - - - - - - - - - - - - - - - - - - - - - - - - - - - - - - - - - - - - - - - - - - - - - - - - - - - - 23
3.4 International Competitiveness of Cambodia’s Garment Industry - - - - - - - - - - - - - - - - - - - - - - - - - - - - - 26
3.5 General Objective and Strategies - - - - - - - - - - - - - - - - - - - - - - - - - - - - - - - - - - - - - - - - - - - - - - - - - - - - - - 26
3.6 Implementation - - - - - - - - - - - - - - - - - - - - - - - - - - - - - - - - - - - - - - - - - - - - - - - - - - - - - - - - - - - - - - - - - - - - - 26
4. FOOTWEAR - - - - - - - - - - - - - - - - - - - - - - - - - - - - - - - - - - - - - - - - - - - - - - - - - - - - - - - - - - - - - - - - - - - - - - - - - - - - - 30
4.1 Description of Trade - - - - - - - - - - - - - - - - - - - - - - - - - - - - - - - - - - - - - - - - - - - - - - - - - - - - - - - - - - - - - - - - - - 31
4.2 Business Model - - - - - - - - - - - - - - - - - - - - - - - - - - - - - - - - - - - - - - - - - - - - - - - - - - - - - - - - - - - - - - - - - - - - - 32
4.3 Supply Chain Performance - - - - - - - - - - - - - - - - - - - - - - - - - - - - - - - - - - - - - - - - - - - - - - - - - - - - - - - - - - - 33
4.4 Opportunities and Constraints - - - - - - - - - - - - - - - - - - - - - - - - - - - - - - - - - - - - - - - - - - - - - - - - - - - - - - - - - 34
4.5 Objectives and Strategies - - - - - - - - - - - - - - - - - - - - - - - - - - - - - - - - - - - - - - - - - - - - - - - - - - - - - - - - - - - - 34
4.6 Implementation - - - - - - - - - - - - - - - - - - - - - - - - - - - - - - - - - - - - - - - - - - - - - - - - - - - - - - - - - - - - - - - - - - - - - 35
5.SILK TRADE - - - - - - - - - - - - - - - - - - - - - - - - - - - - - - - - - - - - - - - - - - - - - - - - - - - - - - - - - - - - - - - - - - - - - - - - - - - - - - - 37
5.1 Trade and Production - - - - - - - - - - - - - - - - - - - - - - - - - - - - - - - - - - - - - - - - - - - - - - - - - - - - - - - - - - - - - - - - 38
5.2 Potential Growth in Production - - - - - - - - - - - - - - - - - - - - - - - - - - - - - - - - - - - - - - - - - - - - - - - - - - - - - - - - 39
5.3 Supply Chains - - - - - - - - - - - - - - - - - - - - - - - - - - - - - - - - - - - - - - - - - - - - - - - - - - - - - - - - - - - - - - - - - - - - - - 39
5.4 Business Models - - - - - - - - - - - - - - - - - - - - - - - - - - - - - - - - - - - - - - - - - - - - - - - - - - - - - - - - - - - - - - - - - - - - - 41

5.5 Supply Chain Performance - - - - - - - - - - - - - - - - - - - - - - - - - - - - - - - - - - - - - - - - - - - - - - - - - - - - - - - - - - - - 42
5.6 Objectives and Strategies - - - - - - - - - - - - - - - - - - - - - - - - - - - - - - - - - - - - - - - - - - - - - - - - - - - - - - - - - - - - - 42
5.7 Implementation - - - - - - - - - - - - - - - - - - - - - - - - - - - - - - - - - - - - - - - - - - - - - - - - - - - - - - - - - - - - - - - - - - - - - 43
6.LOGISTICS - - - - - - - - - - - - - - - - - - - - - - - - - - - - - - - - - - - - - - - - - - - - - - - - - - - - - - - - - - - - - - - - - - - - - - - - - - - - - - - 45
6.1 Trade Finance - - - - - - - - - - - - - - - - - - - - - - - - - - - - - - - - - - - - - - - - - - - - - - - - - - - - - - - - - - - - - - - - - - - - - - 46
6.2 Road Transport - - - - - - - - - - - - - - - - - - - - - - - - - - - - - - - - - - - - - - - - - - - - - - - - - - - - - - - - - - - - - - - - - - - - - 49
6.3 Clusters and Corridors - - - - - - - - - - - - - - - - - - - - - - - - - - - - - - - - - - - - - - - - - - - - - - - - - - - - - - - - - - - - - - - 50
ANNEX I: RICE - - - - - - - - - - - - - - - - - - - - - - - - - - - - - - - - - - - - - - - - - - - - - - - - - - - - - - - - - - - - - - - - - - - - - - - - - - - - - 55
Global Trade - - - - - - - - - - - - - - - - - - - - - - - - - - - - - - - - - - - - - - - - - - - - - - - - - - - - - - - - - - - - - - - - - - - - - - - - - - 56
Prices - - - - - - - - - - - - - - - - - - - - - - - - - - - - - - - - - - - - - - - - - - - - - - - - - - - - - - - - - - - - - - - - - - - - - - - - - - - - - - - - - - 57
Cambodia Production and Trade - - - - - - - - - - - - - - - - - - - - - - - - - - - - - - - - - - - - - - - - - - - - - - - - - - - - - - - - - - 58
Rice Processing - - - - - - - - - - - - - - - - - - - - - - - - - - - - - - - - - - - - - - - - - - - - - - - - - - - - - - - - - - - - - - - - - - - - - - - - 60
Rice Transport - - - - - - - - - - - - - - - - - - - - - - - - - - - - - - - - - - - - - - - - - - - - - - - - - - - - - - - - - - - - - - - - - - - - - - - - - 62
Characteristics of Firms Surveyed - - - - - - - - - - - - - - - - - - - - - - - - - - - - - - - - - - - - - - - - - - - - - - - - - - - - - - - - 63
Supply Chains and Cash Flow - - - - - - - - - - - - - - - - - - - - - - - - - - - - - - - - - - - - - - - - - - - - - - - - - - - - - - - - - - - - 64
ANNEX II: GARMENTS - - - - - - - - - - - - - - - - - - - - - - - - - - - - - - - - - - - - - - - - - - - - - - - - - - - - - - - - - - - - - - - - - - - - - - - - 71
Global Production and Trade - - - - - - - - - - - - - - - - - - - - - - - - - - - - - - - - - - - - - - - - - - - - - - - - - - - - - - - - - - - - - - 72
Market Segments - - - - - - - - - - - - - - - - - - - - - - - - - - - - - - - - - - - - - - - - - - - - - - - - - - - - - - - - - - - - - - - - - - - - - - - 73
Value Proposition - - - - - - - - - - - - - - - - - - - - - - - - - - - - - - - - - - - - - - - - - - - - - - - - - - - - - - - - - - - - - - - - - - - - - - - 76
Production of garments and textiles - - - - - - - - - - - - - - - - - - - - - - - - - - - - - - - - - - - - - - - - - - - - - - - - - - - - - - - 76
Alternative business models - - - - - - - - - - - - - - - - - - - - - - - - - - - - - - - - - - - - - - - - - - - - - - - - - - - - - - - - - - - - - 78
Supply Chain Performance - - - - - - - - - - - - - - - - - - - - - - - - - - - - - - - - - - - - - - - - - - - - - - - - - - - - - - - - - - - - - - 78
Cambodia’s garment industry- - - - - - - - - - - - - - - - - - - - - - - - - - - - - - - - - - - - - - - - - - - - - - - - - - - - - - - - - - - - - - 79
Summary of fi rms surveyed - - - - - - - - - - - - - - - - - - - - - - - - - - - - - - - - - - - - - - - - - - - - - - - - - - - - - - - - - - - - - 86
Flow Charts - - - - - - - - - - - - - - - - - - - - - - - - - - - - - - - - - - - - - - - - - - - - - - - - - - - - - - - - - - - - - - - - - - - - - - - - - - - - 87
ANNEX III: FOOTWEAR - - - - - - - - - - - - - - - - - - - - - - - - - - - - - - - - - - - - - - - - - - - - - - - - - - - - - - - - - - - - - - - - - - - - - - 90
Global trade - - - - - - - - - - - - - - - - - - - - - - - - - - - - - - - - - - - - - - - - - - - - - - - - - - - - - - - - - - - - - - - - - - - - - - - - - - - - 91
Market Segments - - - - - - - - - - - - - - - - - - - - - - - - - - - - - - - - - - - - - - - - - - - - - - - - - - - - - - - - - - - - - - - - - - - - - - 93
Value Proposition - - - - - - - - - - - - - - - - - - - - - - - - - - - - - - - - - - - - - - - - - - - - - - - - - - - - - - - - - - - - - - - - - - - - - - - 94
Global Production and Employment - - - - - - - - - - - - - - - - - - - - - - - - - - - - - - - - - - - - - - - - - - - - - - - - - - - - - - - 95
Footwear Supply Chain - - - - - - - - - - - - - - - - - - - - - - - - - - - - - - - - - - - - - - - - - - - - - - - - - - - - - - - - - - - - - - - - - - 95
Footwear production - - - - - - - - - - - - - - - - - - - - - - - - - - - - - - - - - - - - - - - - - - - - - - - - - - - - - - - - - - - - - - - - - - - 95
Cambodia’s footwear industry - - - - - - - - - - - - - - - - - - - - - - - - - - - - - - - - - - - - - - - - - - - - - - - - - - - - - - - - - - - - - 97
Characteristics of Firms Surveyed - - - - - - - - - - - - - - - - - - - - - - - - - - - - - - - - - - - - - - - - - - - - - - - - - - - - - - - - 98
Supply Chain - - - - - - - - - - - - - - - - - - - - - - - - - - - - - - - - - - - - - - - - - - - - - - - - - - - - - - - - - - - - - - - - - - - - - - - - - - 100

ANNEX IV: SILK - - - - - - - - - - - - - - - - - - - - - - - - - - - - - - - - - - - - - - - - - - - - - - - - - - - - - - - - - - - - - - - - - - - - - - - - - - - 103
Global Production and Trade - - - - - - - - - - - - - - - - - - - - - - - - - - - - - - - - - - - - - - - - - - - - - - - - - - - - - - - - - - - - 104
Production Process - - - - - - - - - - - - - - - - - - - - - - - - - - - - - - - - - - - - - - - - - - - - - - - - - - - - - - - - - - - - - - - - - - - - 106
Cambodia’s Silk Industry - - - - - - - - - - - - - - - - - - - - - - - - - - - - - - - - - - - - - - - - - - - - - - - - - - - - - - - - - - - - - - - 108
Thai Silk Industry - - - - - - - - - - - - - - - - - - - - - - - - - - - - - - - - - - - - - - - - - - - - - - - - - - - - - - - - - - - - - - - - - - - - - - 112
Characteristics of Firms Surveyed - - - - - - - - - - - - - - - - - - - - - - - - - - - - - - - - - - - - - - - - - - - - - - - - - - - - - - - - 114
Supply Chains and Cash Flows Models - - - - - - - - - - - - - - - - - - - - - - - - - - - - - - - - - - - - - - - - - - - - - - - - - - - - - 115
BIBLIOGRAPHY - - - - - - - - - - - - - - - - - - - - - - - - - - - - - - - - - - - - - - - - - - - - - - - - - - - - - - - - - - - - - - - - - - - - - - - - - - - 124
Garments - - - - - - - - - - - - - - - - - - - - - - - - - - - - - - - - - - - - - - - - - - - - - - - - - - - - - - - - - - - - - - - - - - - - - - - - - - - - - 125
Rice - - - - - - - - - - - - - - - - - - - - - - - - - - - - - - - - - - - - - - - - - - - - - - - - - - - - - - - - - - - - - - - - - - - - - - - - - - - - - - - - 126
Silk - - - - - - - - - - - - - - - - - - - - - - - - - - - - - - - - - - - - - - - - - - - - - - - - - - - - - - - - - - - - - - - - - - - - - - - - - - - - - - - - - 127
Other - - - - - - - - - - - - - - - - - - - - - - - - - - - - - - - - - - - - - - - - - - - - - - - - - - - - - - - - - - - - - - - - - - - - - - - - - - - - - - - 128

List of Figures
Figure 1 : Cambodia is improving its logistics - - - - - - - - - - - - - - - - - - - - - - - - - - - - - - - - - - - - - - - - - - - - - - - - - - - 2
Figure 2 : Cambodia rice production, 2000-10 - - - - - - - - - - - - - - - - - - - - - - - - - - - - - - - - - - - - - - - - - - - - - - - - - - 1 2
Figure 3 : Rice flow - - - - - - - - - - - - - - - - - - - - - - - - - - - - - - - - - - - - - - - - - - - - - - - - - - - - - - - - - - - - - - - - - - - - - - - - 1 4
Figure 4 : Restructure rice supply chain - - - - - - - - - - - - - - - - - - - - - - - - - - - - - - - - - - - - - - - - - - - - - - - - - - - - - - - 1 7
Figure 5 : Cambodian garment exports - - - - - - - - - - - - - - - - - - - - - - - - - - - - - - - - - - - - - - - - - - - - - - - - - - - - - - - 2 0
Figure 6 : Number of Cambodian garment factories and direct employment - - - - - - - - - - - - - - - - - - - - - - - - 2 1
Figure 7 : Cambodian garment export destinations, 2010 - - - - - - - - - - - - - - - - - - - - - - - - - - - - - - - - - - - - - - - - 2 1
Figure 8 : Allocation of responsibility for supply chain activities - - - - - - - - - - - - - - - - - - - - - - - - - - - - - - - - - - - 2 4
Figure 9 : Cambodia’s leather footwear exports - - - - - - - - - - - - - - - - - - - - - - - - - - - - - - - - - - - - - - - - - - - - - - - - 3 1
Figure 10 : Share of leather footwear exports - - - - - - - - - - - - - - - - - - - - - - - - - - - - - - - - - - - - - - - - - - - - - - - - - - - 3 1
Figure 11 : Cambodian footwear export destinations by % of value - - - - - - - - - - - - - - - - - - - - - - - - - - - - - - - - - 3 1
Figure 12 : Footwear projects approved in Cambodia 1997-2008 - - - - - - - - - - - - - - - - - - - - - - - - - - - - - - - - - - - 3 2
Figure 13 : Footwear exports by type - - - - - - - - - - - - - - - - - - - - - - - - - - - - - - - - - - - - - - - - - - - - - - - - - - - - - - - - - - 3 2
Figure 14 : FOB value of footwear exports - - - - - - - - - - - - - - - - - - - - - - - - - - - - - - - - - - - - - - - - - - - - - - - - - - - - - 3 2
Figure 15 : Footwear supply chain - - - - - - - - - - - - - - - - - - - - - - - - - - - - - - - - - - - - - - - - - - - - - - - - - - - - - - - - - - - 3 4
Figure 16 : Material flow for silk trade - - - - - - - - - - - - - - - - - - - - - - - - - - - - - - - - - - - - - - - - - - - - - - - - - - - - - - - - - 3 6
Figure 17 : Cambodia silk exports - - - - - - - - - - - - - - - - - - - - - - - - - - - - - - - - - - - - - - - - - - - - - - - - - - - - - - - - - - - - 3 6
Figure 18 : Silk supply chain - - - - - - - - - - - - - - - - - - - - - - - - - - - - - - - - - - - - - - - - - - - - - - - - - - - - - - - - - - - - - - - - 4 0
Figure 19 : Cambodia’s containerized trade - - - - - - - - - - - - - - - - - - - - - - - - - - - - - - - - - - - - - - - - - - - - - - - - - - - - 4 9
Figure 20 : Corridors for Poipet and Bavet - - - - - - - - - - - - - - - - - - - - - - - - - - - - - - - - - - - - - - - - - - - - - - - - - - - - - 5 1
Figure 21 : Delta route to Ho Chi Minh - - - - - - - - - - - - - - - - - - - - - - - - - - - - - - - - - - - - - - - - - - - - - - - - - - - - - - - - - 5 2
Figure 22 : Delta container barge - - - - - - - - - - - - - - - - - - - - - - - - - - - - - - - - - - - - - - - - - - - - - - - - - - - - - - - - - - - - - 5 2
Figure 23 : Developed SEZs in Cambodia - - - - - - - - - - - - - - - - - - - - - - - - - - - - - - - - - - - - - - - - - - - - - - - - - - - - - - 5 4

List of Tables
Table 1 : Activities to support development of trade - - - - - - - - - - - - - - - - - - - - - - - - - - - - - - - - - - - - - - - - - - - - - 4
Table 2 : Business models for the manufacturing sector - - - - - - - - - - - - - - - - - - - - - - - - - - - - - - - - - - - - - - - - - 8
Table 3 : Business models for the agricultural sector - - - - - - - - - - - - - - - - - - - - - - - - - - - - - - - - - - - - - - - - - - - - 9
Table 4 : Customs inspection requirements for imports - - - - - - - - - - - - - - - - - - - - - - - - - - - - - - - - - - - - - - - - - 25
Table 5 : Selected markets for higher value garments - - - - - - - - - - - - - - - - - - - - - - - - - - - - - - - - - - - - - - - - - - 27
Table 6 : Activities in the silk industry - - - - - - - - - - - - - - - - - - - - - - - - - - - - - - - - - - - - - - - - - - - - - - - - - - - - - - - - 39
Table 7 : Markets for fi nished products - - - - - - - - - - - - - - - - - - - - - - - - - - - - - - - - - - - - - - - - - - - - - - - - - - - - - - - 41
Table 8 : Typical sea and air freight rates from Cambodia - - - - - - - - - - - - - - - - - - - - - - - - - - - - - - - - - - - - - - - 48
Table 9 : Routes to the South China Sea - - - - - - - - - - - - - - - - - - - - - - - - - - - - - - - - - - - - - - - - - - - - - - - - - - - - - - 51
Table 10 : Enterprises in three successful SEZs - - - - - - - - - - - - - - - - - - - - - - - - - - - - - - - - - - - - - - - - - - - - - - - - 53
ANNEX FIGURESAnnex Figure 1 : Global rice trade 1989-2011 (million tons) - - - - - - - - - - - - - - - - - - - - - - - - - - - - - - - - - - - - - - 56
Annex Figure 2 : Price of Thai white rice 5 percent broken (US$ per metric tonne) - - - - - - - - - - - - - - - - - - - - 57
Annex Figure 3 : Rice growing areas in Cambodia - - - - - - - - - - - - - - - - - - - - - - - - - - - - - - - - - - - - - - - - - - - - - - - 58
Annex Figure 4 : Cambodia rice production, 2000-10 (million hectare and tons/hectare) - - - - - - - - - - - - - - 59
Annex Figure 5 : Market share of major rice traders in Cambodia, 2009-11 - - - - - - - - - - - - - - - - - - - - - - - - - - 60
Annex Figure 6 : Trade fl ows of padi in Cambodia - - - - - - - - - - - - - - - - - - - - - - - - - - - - - - - - - - - - - - - - - - - - - - - 62
Annex Figure 7 : Rice model A - - - - - - - - - - - - - - - - - - - - - - - - - - - - - - - - - - - - - - - - - - - - - - - - - - - - - - - - - - - - - - 63
Annex Figure 8 : Cash fl ow - - - - - - - - - - - - - - - - - - - - - - - - - - - - - - - - - - - - - - - - - - - - - - - - - - - - - - - - - - - - - - - - - - 64
Annex Figure 9 : Rice model B - - - - - - - - - - - - - - - - - - - - - - - - - - - - - - - - - - - - - - - - - - - - - - - - - - - - - - - - - - - - - - - 68
Annex Figure 10 : Cash fl ow - - - - - - - - - - - - - - - - - - - - - - - - - - - - - - - - - - - - - - - - - - - - - - - - - - - - - - - - - - - - - - - - - - 69
Annex Figure 11 : Global trade in garments, 2001-10 (US$ billion and growth) - - - - - - - - - - - - - - - - - - - - - - - - 72
Annex Figure 12 : Largest apparel exporters, 2010 (%)- - - - - - - - - - - - - - - - - - - - - - - - - - - - - - - - - - - - - - - - - - - - 72
Annex Figure 13 : Largest apparel importers, 2010 (%) - - - - - - - - - - - - - - - - - - - - - - - - - - - - - - - - - - - - - - - - - - - 73
Annex Figure 14 : Garment trade by product category, 2010 (%) - - - - - - - - - - - - - - - - - - - - - - - - - - - - - - - - - - - - 74
Annex Figure 15 : Fashion pyramid - - - - - - - - - - - - - - - - - - - - - - - - - - - - - - - - - - - - - - - - - - - - - - - - - - - - - - - - - - - - 74
Annex Figure 16 : Supply chain from fi bers to apparel - - - - - - - - - - - - - - - - - - - - - - - - - - - - - - - - - - - - - - - - - - - - 75
Annex Figure 17 : Input points for the garment production activity - - - - - - - - - - - - - - - - - - - - - - - - - - - - - - - - - - 75
Annex Figure 18 : Enhancements to supply chain performance with higher-value products - - - - - - - - - - - - - 79
Annex Figure 19 : Cambodian garment exports 1995-2011 (US$ billion) - - - - - - - - - - - - - - - - - - - - - - - - - - - - - 79
Annex Figure 20 : Apparel and footwear as share of the industry, 1998-2009 - - - - - - - - - - - - - - - - - - - - - - - - - 80
Annex Figure 21 : Approved garment investments, 2001-09 (in fi xed assets and # of projects) - - - - - - - - - - 80
Annex Figure 22 : Garment factories and employment, 1995-2010 (# of factories and ‘000 employees) - - 81
Annex Figure 23 : Ownership of garment factories - - - - - - - - - - - - - - - - - - - - - - - - - - - - - - - - - - - - - - - - - - - - - - - 81
Annex Figure 24 : Cambodian garment export destinations, 2010 - - - - - - - - - - - - - - - - - - - - - - - - - - - - - - - - - - - 83
Annex Figure 25 : Destination of Cambodian garment exports, 2001-11 - - - - - - - - - - - - - - - - - - - - - - - - - - - - - 83
Annex Figure 26 : Imports of fabric and yarn, 2002-10 - - - - - - - - - - - - - - - - - - - - - - - - - - - - - - - - - - - - - - - - - - - - 84
Annex Figure 27 : Share of woven garment exports on total exports, 2001-10 - - - - - - - - - - - - - - - - - - - - - - - - 84
Annex Figure 28 : Decline in value of export prices - - - - - - - - - - - - - - - - - - - - - - - - - - - - - - - - - - - - - - - - - - - - - - - 85
Annex Figure 29 : Vendor factory fl owchart - - - - - - - - - - - - - - - - - - - - - - - - - - - - - - - - - - - - - - - - - - - - - - - - - - - - - 88
Annex Figure 30 : Average import price of pair of shoes into the US market (US$ value per pair) - - - - - - - - 92
Annex Figure 31 : Average import price of pair of shoes into the EU market (US$ value per pair) - - - - - - - - - 93
Annex Figure 32 : The global value chain - - - - - - - - - - - - - - - - - - - - - - - - - - - - - - - - - - - - - - - - - - - - - - - - - - - - - - - 96

Annex Figure 33 : Cambodian footwear exports by product group 2001-10 (mirror data in US$ million) - - - 97
Annex Figure 34 : Cambodian footwear exports, 2001-10 (mirror data and Cambodian Customs data
in US$ million) - - - - - - - - - - - - - - - - - - - - - - - - - - - - - - - - - - - - - - - - - - - - - - - - - - - - - - - - - - - - - - 98
Annex Figure 35 : Supply chain fl owchart - - - - - - - - - - - - - - - - - - - - - - - - - - - - - - - - - - - - - - - - - - - - - - - - - - - - - - 101
Annex Figure 36 : World raw silk producing countries, 2005-09 - - - - - - - - - - - - - - - - - - - - - - - - - - - - - - - - - - - 104
Annex Figure 37 : Value of global raw silk and cocoon trade - - - - - - - - - - - - - - - - - - - - - - - - - - - - - - - - - - - - - - 105
Annex Figure 38 : Weight of global raw silk and cocoon trade - - - - - - - - - - - - - - - - - - - - - - - - - - - - - - - - - - - - - 105
Annex Figure 39 : World trade in silk fabrics - - - - - - - - - - - - - - - - - - - - - - - - - - - - - - - - - - - - - - - - - - - - - - - - - - - - 106
Annex Figure 40 : Cambodian silk exports - - - - - - - - - - - - - - - - - - - - - - - - - - - - - - - - - - - - - - - - - - - - - - - - - - - - - 106
Annex Figure 41 : Production process of silk - - - - - - - - - - - - - - - - - - - - - - - - - - - - - - - - - - - - - - - - - - - - - - - - - - - 107
Annex Figure 42 : Domestic silk yarn production (kg) - - - - - - - - - - - - - - - - - - - - - - - - - - - - - - - - - - - - - - - - - - - - 108
Annex Figure 43 : Number of weavers and their specialization in Cambodia - - - - - - - - - - - - - - - - - - - - - - - - - 111
Annex Figure 44 : Silk model A - - - - - - - - - - - - - - - - - - - - - - - - - - - - - - - - - - - - - - - - - - - - - - - - - - - - - - - - - - - - - - 116
Annex Figure 45 : Cash fl ows for silk model A - - - - - - - - - - - - - - - - - - - - - - - - - - - - - - - - - - - - - - - - - - - - - - - - - - 117
Annex Figure 46 : Silk model B- - - - - - - - - - - - - - - - - - - - - - - - - - - - - - - - - - - - - - - - - - - - - - - - - - - - - - - - - - - - - - - 119
Annex Figure 47 : Cash fl ow for silk model B - - - - - - - - - - - - - - - - - - - - - - - - - - - - - - - - - - - - - - - - - - - - - - - - - - - 120
Annex Figure 48 : Silk model C - - - - - - - - - - - - - - - - - - - - - - - - - - - - - - - - - - - - - - - - - - - - - - - - - - - - - - - - - - - - - - 121
Annex Figure 49 : Cash fl ow for model C - - - - - - - - - - - - - - - - - - - - - - - - - - - - - - - - - - - - - - - - - - - - - - - - - - - - - - 122
ANNEX TABLESAnnex Table 1 : Leading rice exporters (by volume, value and market share) - - - - - - - - - - - - - - - - - - - - - - - 56
Annex Table 2 : Type of padi rice production - - - - - - - - - - - - - - - - - - - - - - - - - - - - - - - - - - - - - - - - - - - - - - - - - - - 60
Annex Table 3 : Large rice mills in Cambodia (tons padi/hr) - - - - - - - - - - - - - - - - - - - - - - - - - - - - - - - - - - - - - - 61
Annex Table 4 : Major destinations for garment exports, 2010 (US$ billion) - - - - - - - - - - - - - - - - - - - - - - - - - 74
Annex Table 5 : Countries applying different business models - - - - - - - - - - - - - - - - - - - - - - - - - - - - - - - - - - - - 78
Annex Table 6 : Top seven products in US and EU - - - - - - - - - - - - - - - - - - - - - - - - - - - - - - - - - - - - - - - - - - - - - - 85
Annex Table 7 : Product segment in footwear industry - - - - - - - - - - - - - - - - - - - - - - - - - - - - - - - - - - - - - - - - - - 93
Annex Table 8 : Models for silk production - - - - - - - - - - - - - - - - - - - - - - - - - - - - - - - - - - - - - - - - - - - - - - - - - - - 109
Annex Table 9 : Number and location of Cambodian silk weavers, 2010 - - - - - - - - - - - - - - - - - - - - - - - - - - - 112
Annex Table 10 : Markets for different business models - - - - - - - - - - - - - - - - - - - - - - - - - - - - - - - - - - - - - - - - - 113
Annex Table 11 : Cash fl ow for model A - - - - - - - - - - - - - - - - - - - - - - - - - - - - - - - - - - - - - - - - - - - - - - - - - - - - - - 117
Annex Table 12 : Cash fl ow for silk model B - - - - - - - - - - - - - - - - - - - - - - - - - - - - - - - - - - - - - - - - - - - - - - - - - - - 120
Annex Table 13 : Cash fl ow for model C - - - - - - - - - - - - - - - - - - - - - - - - - - - - - - - - - - - - - - - - - - - - - - - - - - - - - - 122
ANNEX BOXESAnnex Box 1 : Cambodia OEM factory - - - - - - - - - - - - - - - - - - - - - - - - - - - - - - - - - - - - - - - - - - - - - - - - - - - - - - 82

Acknowledgements
This report is a piece of Economic Sector Work (ESW) of the EASPR Department. A team led by Julian Latimer
Clarke, and composed of John Arnold and Christian Ksoll, prepared the report.
The report was prepared under the overall guidance of Sudhir Shetty, Sector Director of EASPR, and Mathew
A. Verghis, Sector Manager for the World Bank Cambodia.
The report benefi ted from discussions with government offi cials from the Ministry of Commerce, the Ministry
of Economy and Finance, and the Supreme National Economic Council. The report also benefi tted from the
valuable comments of Mona Haddad, Enrique Aldaz-Carroll, and Kirida Bhaopichitr.
The authors would like to acknowledge editorial support and review from Brendan O’Driscoll, Barbara Karni,
Amir Fouad and Peter Milne. Lyden Kong provided useful logistic and administrative support.
Funding from the donors of the Multi-donor Trust Fund for Trade Development Support Program (TDSP),
comprising DANIDA, the European Union (EU) and UNIDO, is gratefully acknowledged.
X Improving Trade Competitiveness in Cambodia:
An Analysis Using a Trade and Transport Facilitation Assessment (TTFA)

AFD Agence Française de Développement
AKR Angkor Kasekam Roonrooueng
ASEAN Association of South East Asian Nations
B2C Business to Customer
CFR Cost and Freight
CAMFFA Cambodian Freight Forwarding Association
CAMTA Cambodian Trucking Association
CASDEC Cambodia Skills Development Center
C&F Clearing and Forwarding
CGTC Cambodia Garment Training Center
CMT Cut, Make, Trim
CO Certifi cate of Origin
DWT Deadweight tons
EBA Initiative Everything-But-Arms Initiative
EDI Electronic Data Interchange
EU European Union
FCA Free Carrier
FDI Foreign direct investment
FEU Forty Foot Equivalent Unit
FIATAFédération Internationale des Associations de Transitaires et Assimilés,
(International Federation of Freight Forwarders Associations)
FOB Free on Board/Freight on Board
FOCC Footwear Order Center Cambodia
GDP Gross Domestic Product
GMAC Garment Manufacturers Association in Cambodia
GMO test Genetically Modifi ed Organism test
HQ Headquarters
ICD Inland Container Depot
IT Information technology
kg kilogram
L/C Letter of Credit
Acronyms and Abbreviations
XIImproving Trade Competitiveness in Cambodia:
An Analysis Using a Trade and Transport Facilitation Assessment (TTFA)

LCL Less than Container Load
MOC Ministry of Commerce
NBC National Bank of Cambodia
NGO Non-Governmental Organization
NVOCC Non-vessel operating common carriers
ODM Original Design Manufacturers
OEM Original Equipment Manufacturers
PASS Projet d’Appui au Secteur de la Soie
SEZ Special Economic Zone
SMTQ Standards, Metrology, Testing, and Quality
TEU Twenty Foot Equivalent Unit
TT Telegraphic transfer
TTFA Trade and Transport Facilitation Assessment
US United States
WTO World Trade Organization
XII Improving Trade Competitiveness in Cambodia:
An Analysis Using a Trade and Transport Facilitation Assessment (TTFA)

Executive Summary
A Transport and Trade Facilitation Assessment (TTFA) is designed as a snapshot of a country’s trading
environment, viewed from the perspective of four key industries. In Cambodia’s case, the industries selected
were rice, garments, footwear and silk. This report dissects the inputs and outputs of each of these sectors
by analyzing how the inputs to each industry arrive at the processing plant and are then exported. Each
step of the value chain is examined for logistics issues and recommendations are made at the conclusion
of each chapter. The analysis and recommendations are designed to provide an overview of logistics issues
that affect the private sector in general in Cambodia.
This report is designed to be read as an adjunct to the Trade Corridor Performance Assessment that
accompanies this report. The TTFA is not a tool by which to measure performance, but rather a tool to assist
policymakers to understand the current trading environment. The TTFA includes recommendations based
on the fi ndings of each industry surveyed. These recommendations could become the basis of trade- related
technical assistance projects to be carried out by the Royal Government of Cambodia (RGC), perhaps in
conjunction with development partners. In Cambodia, the funding of such projects could include the major
sources of funding to the Cambodian trade sector wide-approach (SWAp), namely the Trade Development
Support Program and the Enhanced Integrated Framework CEDEP Program.
Cambodia’s exports have grown strongly over the past ten years, in part boosted by its accession to
the World Trade Organization (WTO) in 2004. Despite this strong performance, Cambodia’s weak logistics
performance, coupled with bottlenecks caused by gaps in infrastructure and services, together with limited
storage facilities and ineffi cient border clearance procedures, continue to hamper exports. Trade facilitation
and logistics are therefore key issues in realizing Cambodia’s full export potential. The Government is fully
aware of the importance of addressing the constraints. To this end, it has introduced signifi cant reforms in
Customs and is currently implementing a national single window as part of its Association of South East Asian
Nations (ASEAN) commitments.
However, in addition to the broad improvements taking place, the main export sectors of Cambodia—in terms
of actual performance and potential—have specifi c needs that need to be identifi ed in turn. Garment
exports are part of a supply chain that requires speed and reliability in delivery. Rice needs good internal
freight connections from fi elds to border and adapted storage facilities. Cambodia’s supply chain
performance also faces the curse of size—not enough scale to justify large investments or improve effi ciency—
while its main competitors (Vietnam, China and Bangladesh) all enjoy the advantage of economies of scale.
Cambodia’s Logistics Performance Index (LPI) ranking improved signifi cantly in 2012, jumping 29 places.
Nonetheless, Cambodia’s logistics performance is still well below major competitors such as Thailand and
Vietnam. Several of the supply chains are also controlled by external buyers rather than local producers. Not
only it is important to improve trade facilitation at a national level, it is also critical to address the specifi c
requirements of its key export sectors.
1Improving Trade Competitiveness in Cambodia:
An Analysis Using a Trade and Transport Facilitation Assessment (TTFA)

Sectoral fi ndings
Rice has recently gained much attention, especially with the food security agenda gaining regional and
global prominence. The TTFA report analyzes the rice sector from a domestic market perspective with a
view to its potential as an export industry. The rice sector suffers from a lack of large milling facilities, a
method to aggregate the supply of raw padi, and a dependence on road transport, with its higher attendant
costs. Lack of access to domestic credit creates a market advantage for Thai and Vietnamese traders by
allowing them to purchase a large amount of Cambodia’s crop at harvest time. Millers are only beginning
to offer drying and storage facilities, but in general the farmers and millers require fast cash payment to
clear the harvest. Rice is bagged at the mills away from major trade corridors. It is transported to
Phnom Penh by road and shipped through Sihanoukville or Ho Chi Minh City. The effi ciency constraints of
the current logistics methods are dealt with in detail in the rice chapter found below.
To improve the export performance of the rice sector from a logistics perspective, the government can
encourage public private partnerships in establishing new facilities for storing and drying padi near the growing
areas and operated by mills or third parties. The government also needs to upgrade trade corridors connecting
rice growing areas to loading points for international shipments, which is likely to include development of the
river transport corridor to Vietnam and simplifi ed procedures at the border or provisions for movement of
trucks across the border with Thailand.
The garments value chain is unique in the sense that this industry constitutes the bulk of Cambodia’s
export value. Cambodia’s garment sector consists of two types of manufacturers: vendor factories and
contract manufacturers. The size and type of each order is largely determined overseas by head offi ce or
by a foreign buyer, with very little design input from the local factory. The dependence of local factories on
decisions made overseas extends into sourcing of inputs, shipping arrangements and even access to fi nance.
Factories are provided the inputs, instructed about the shipping preference of the buyer and, in some cases,
Figure 1: Cambodia’s logistics is showing recent improvement
International LPI scores as a percentage of the top performer Changes in international LPI rank
Source: Logistics Performance Index, World Bank.
Note: A positive change implies improvement
Vietnam
Thailand
Philippines
Papua New Guinea
Myanmar
Mongolia
Malaysia
Lao PDR
Indonesia
Fiji
China
Cambodia
Solomon Islands
0 20 40 60 80 100
2012
2017
2010
-60 -40 -20 0 20
2010 - 2012
2007 - 2010
Vietnam
Thailand
Philippines
Papua New Guinea
Myanmar
Mongolia
Malaysia
Lao PDR
Indonesia
Fiji
China
Cambodia
Solomon Islands
40
2 Improving Trade Competitiveness in Cambodia:
An Analysis Using a Trade and Transport Facilitation Assessment (TTFA)

provided credit from the buyer to meet the specifi cation and delivery of the order. The logistics of the garment
industry are complicated by the need to import inputs into the industry and to match these against exports. The
manufacturers continue to report diffi culties in processing duty-free inputs and report delays in exports related
to licensing requirements and inspections.
To improve logistics specifi c to the garment sector, resolving ineffi ciencies in trade facilitation and border
procedures are critical. This is because profi t margins are low in the garment sector and any improvement in
logistics that reduces costs and increases the reliability of delivery will lead to higher profi ts across the industry.
The garment sector will benefi t from consolidation of services amongst manufacturers, particularly contract
factories, in order to derive faster turn-around of inputs into the manufacturing process. These could take the
form of clusters. The skills of the workers need to be upgraded; to this end, the RGC may wish to consider
linking with the industry advocacy group—the Garment Manufacturers Association of Cambodia (GMAC)—to
create an institute that could address the needs of worker skill upgrading.
The footwear sector exhibits robust growth. In footwear, as in garments, the differentiation between vendor
and contract factories is crucial in understanding the value-chain. The growth of the footwear industry
demonstrates one important difference from rice and garments, however, in that the value of each unit of output
has been growing at the same time that the volume of the exports have increased. This growth in unit value
seems to imply that the footwear industry is climbing the value chain in sophistication and quality.
Improving the logistics supply chain in footwear requires concerted initiatives to upgrade worker skills
and initiatives to further develop a cluster approach for supply industries that could support the footwear
manufacturing process and reduce order cycles. These initiatives may be usefully housed within an enclave
that fosters the development of footwear factories—an approach that is currently only somewhat possible
within Special Economic Zones (SEZs). An enclave approach would allow the various factors of production to
be integrated and closely sourced thus shortening the order cycle and production cycle. Financing is also a
constraint to further strengthening of this value chain, which may be remedied by public-private approaches
to fi ll the credit intermediation gap.
The silk sector in Cambodia is largely informal, small-scale and is diffi cult to defi ne as a stand-alone industry
in its current form. The sector is characterized by small-scale orders for tourist or domestic consumption. The
orders tend to be of low volume, irregular supply and are dependent on low-quantity inputs from Vietnam and
China. As such, the current structure of the industry does not lend itself to further consolidation or even to
‘moving up’ the value chain. The transport logistics are relatively simple—the low quantities sold are generally
transported by air or sea to fulfi ll small order of less than 6kg in weight.
The fate of the silk sector depends on whether the Government wishes to promote this sector as a major export
product or keep it as a cottage industry. For Cambodia to become a major exporter of silk, the industry would
need to undergo signifi cant consolidation and mechanization. For Cambodia to differentiate itself from major
silk exporters such as Thailand or China, the quality and design and color of the silks produced in Cambodia
would need to be more innovative than at present. Finally, industry standards would need to be agreed and
enforced.
3Improving Trade Competitiveness in Cambodia:
An Analysis Using a Trade and Transport Facilitation Assessment (TTFA)

Table 1: Activities to support development of trade
Cambodia Rice Garments Footwear Silk
Supply chain strategies
Change in business model X X
Restructure inbound supply chains X X X X
Modify distribution channels X X X
Logistics services strategies
Increase scale of logistics services X
Supply chain initiatives
Prepare sector vision ++
Introduce backward integration ++ + ++
Introduce forward integration ++ +
Modify contractual relationships ++ ++
Redistribute processing +
Shorten cycles ++
Establish zones, clusters ++ ++
Create trade fi nance instruments + ++ ++
Logistics services initiatives
Improve trade corridors ++ ++ + +
Develop collection/distribution hubs ++
Modernize customs procedures + ++
Integrate and improve quality control +
Modify trade and transit agreements ++ +
Provide training and technical assistance ++ +
++ fi rst priority, + second priority
The fi ndings from the survey were used to identify a number of improvements that could be introduced to
heighten trade competitiveness in the key sectors mentioned above. These are summarized in Table 1. While
there is a need to modify the supply chain management strategies in order to improve trade competitiveness, the
most important involves restructuring the inbound supply chains to improve the reliability of supply of inputs.
However, specifi c initiatives vary by trade. For rice and silk, the principal initiatives are to increase integration
in the inbound supply chains and increase the contracting of supplies as a means to improve the reliability and
quality of supply. In the case of garments and footwear, the principal initiatives focus on the development of
clusters and complementary zones to increase the effi ciency of production and attract additional investment.
As for improvements in logistics services, the principal initiative would be to improve the performance along
the trade corridor linking the production sites with the port terminals.
Improving Trade Competitiveness in Cambodia:
An Analysis Using a Trade and Transport Facilitation Assessment (TTFA)


1. Methodology and Organization of Phase II TTFA
1.1 Methodology
The Transport and Trade Facilitation Assessment (TTFA) is a tool developed by the World Bank to evaluate
the competitiveness of a country’s trade and the quality of logistics services used for this trade. The tool
has two components. The fi rst focuses on public policy that affects trade and logistics. The second
examines the performance of supply chains used by importers and exporters. Both components utilize
background research and interviews to identify current constraints and opportunities related to improving
competitiveness and quality of service. Phase I utilizes a series of interviews with key decision makers
and associations involved in trade. Phase II, a survey of participants in supply chains for selected trades,
includes logistics service providers. This report presents the results of the TTFA performed in 2011.
The primary objective of performing this assessment is to identify and prioritize initiatives to sustain the
growth of the country’s rapidly expanding trade and to increase the amount of value added provided within the
country. In order to accomplish this, four trades were selected and the structure of their supply chains was
determined. The activities in the product-specifi c supply chains were analyzed to determine their impact on the
competitiveness of the traded goods. This analysis examined four key areas:
The performance of the supply chains as measured in terms of time, cost and reliability of end-to-end
movements;
The uncertainties associated with individual activities in the supply chain;
The fl exibility and transparency of these supply chains; and
The transactions generated by these activities and the transfer of risk as a result of these transactions.
Some of the opportunities for enhancing trade competitiveness were examined as part of the assessment, for
example:
1. Improvements in the organization and control of both inbound and outbound supply chains
2. Increased coordination among supply chain participants
3. Improvements in performance of logistics services
4. Introduction of value-addition logistics in the supply chains
5. Increased use of ITC to enhance supply chain performance
6. Improvement in the utilization and performance of trade corridors and production clusters
7. Increased scale of production and diversifi cation of products
The types of initiatives that support these opportunities include:
1. Technical assistance
2. Standards and contractual relationships
3. Financial instruments tailored to specifi c requirements
4. Regulatory reform
5. IT platforms
6. Investments in infrastructure
6 Improving Trade Competitiveness in Cambodia:
An Analysis Using a Trade and Transport Facilitation Assessment (TTFA)

1.2 Organization of the surveyThe Phase II TTFA was conducted in four steps over a six-month period. The fi rst step was a review of the issues
facing the logistics industry and identifi cation of commodity-specifi c trades to be surveyed. Four trades were
selected based on their size and contribution to the country’s trade, both now and in the future. These were:
Rice –it is the largest agricultural export but remains a low value product
Garments –it is the largest export and major source of employment but faces rising costs
Footwear –it is a major export and source of employment but also faces rising costs
Silk –it is a rural handicraft product with potential for development as a commercial export
Subsequently, fi rms interviewed were selected based on size,1 market, supply chain structure, track record
and accessibility.2 For each commodity, fi rms were selected to include different categories of products and
different levels of integration of their supply chains.
The second step involved preparation of survey instruments, selection and mobilization of the survey team,
pre-testing the instruments and arranging the fi eld logistics. The instruments were prepared using the
formats provided in the TTFA manual. These were substantially modifi ed to refl ect the situation in the
country as well as the specifi c objectives. The largest adjustment was to give greater emphasis to interviews
with the fi rms that organize the supply chains and less to the fi rms that provide the logistics services used
in the supply chains.
The team was organized by Emerging Markets Consultants (EMC). Team members were selected according
to their familiarity with the commodity-specifi c trades as well as with trade logistics. A separate team was
selected to conduct expert interviews for trade fi nance, transport and freight forwarding/customs clearance.
The teams participated in a three-day training course that covered the analysis of different aspects to trade
logistics and the structure of the survey instruments. The instruments and interview techniques were
pre-tested with a fi rm not included in the sample. Although the members of the team were fl uent in English,
the questionnaires were translated to ensure consistency in the interviews. Finally the survey team was
organized into pairs with each assigned two trades.
The third step was the fi eldwork, which was conducted in two stages. Two trades were surveyed in each
phase. The interviewers were sent out in pairs in order to ensure a broad understanding of the fi rm’s activities
and to improve the interview dynamics. Four interviews were conducted with each fi rm responsible for
organizing the supply chains. The fi rst meeting was an introductory session with the general manager to
introduce the study team, review the approach and discuss the fi rm’s business model. The second meeting
was with the company’s logistics manager to discuss the organization of his supply chains. The third meeting
was with the head of fi nance to learn about the cash fl ows and fi nance associated with the fi rm’s trade
activities. The fi nal meeting was a recap with the general manager to discuss strategies for enhancing the
effi ciency of operations and improving trade competitiveness. Where required, additional interviews were
held with the fi rm’s principal suppliers and buyers. Between the two phases, meetings were held to discuss
preliminary fi ndings and the survey team fi nalized their fi eld notes and prepared some preliminary essays to
document their fi ndings.
The expert interviews were conducted in parallel with fi rms providing clearing and forwarding services,
transport companies and banks involved in trade fi nance. Most of the interviews were conducted in English
or alternatively, in Khmer.
1 Larger firms were chosen since smaller firms usually face additional hurdles because of their size rather than external factors2 The firms selected had to be willing to participate in multiple interviews
7Improving Trade Competitiveness in Cambodia:
An Analysis Using a Trade and Transport Facilitation Assessment (TTFA)

For the fi nal step, the survey results were analyzed. This included preparing for each trade
a consolidated form listing the responses of the fi rms,
essays describing problems and possible initiatives for improving performance,
fl owcharts for the supply chains for some of the fi rms, and
cash fl ows for some of the fi rms.
The survey fi ndings were combined with earlier efforts to map out the characteristics of each trade, the
different business models applied, the various confi gurations of inbound and outbound supply chain, the level
of control over the operation of the supply chains exercised by individual fi rms, the cash-to-cash cycle and
fi nancing requirements for different business models, and the availability and performance characteristics
of the logistics services used in these supply chains. Based on the results, policy recommendations were
developed for both the private and public sector or joint initiatives proposed. Preliminary fi ndings were
presented at industry-workshops followed by a more detailed discussion with the associations representing
each of the trades.
1.3 Key conceptsThe analysis of the trades is organized around two key concepts. The trade itself is defi ned as an inbound
supply chain linking production of raw materials with the processing of these materials and an outbound supply
chain linking processing with the delivery of fi nished products to foreign markets. The activities in these chains
were limited to those controlled by actors in the country. For this purpose, the entities involved in organizing
the supply chains (the organizing principals) were identifi ed. These enterprises connect the inbound supply
chain delivering inputs and the outbound supply chain for international shipment of the fi nished products. In
most cases these entities were involved in some form of transformation of the inputs. The activities of the
organizing principal were categorized according to their business model and span of control over both inbound
and outbound logistics.
The business model refers to both the transformation performed on the inputs and the characteristics of
the outputs produced. The span of control refers to their involvement in the activities of the inbound and
outbound supply chains. Separate business models were used for manufactured goods and agricultural
products. For the manufactured goods, the standard delineation is based on value addition, as shown in
Table 2. This includes not only value addition in physical terms but also in terms of design and marketing of
the product. For agricultural products, a similar method is applied where value-added includes the extent of
processing. Hence, it distinguishes between traders, suppliers, and distributors, as shown in Table 3.
* Parent company manages the sale of the goods.1 Also referred to as FOB1 when the contract manufacturer procures some of the inputs.2 Defined as a manufacturer of products or components that are purchased by another company and retailed under that purchasing company’s brand name,
also referred to as FOB2.3 Also referred to as FOB3
8 Improving Trade Competitiveness in Cambodia:
An Analysis Using a Trade and Transport Facilitation Assessment (TTFA)

Table 2: Business models for the manufacturing sector
Title Assemble ProduceComponents
ProcureInputs
DesignOutputs
DistributeOutputs
BrandedProducts
Buyer
VFVendor
Factoryü ü Parent
Company*
CM1
Contact
Manufacturer ü ü
Buying
Agent,
Manufacturer
Wholesaler,
OEA
Original
Equipment
Assembler
ü ü Brand
Manufacturer,
Retailer,
DistributorOEM2
Original
Equipment
Manufacturer
ü ü ü ü
ODM3
Own Design
Manufacturer ü ü ü ü üDistributor,
Brand
Manufacturer
OBMBrand
Manufacturerü ü ü ü ü ü Distributor,
Retailer
Table 3: Business models for the agricultural sector
Category Trader Supplier Distributor
Input Crops, minimal post
harvest processing
Crops, some post
harvest processing
Crops, some post
harvest processing
Output Agricultural
commodities
Commodities and
unbranded food
products
Branded and unbranded
food products
Processing Sorting, basic
processing, packing
Additional processing
and quality control
Industrial processing and
packaging
Contracts Spot Time, Standing orders P.O.
Shipments Single Multiple Continuous
Activity Seasonal At least half the year Year round*
Inventory Minimum storage
for inputs
Storage of input for
continuous processing
Storage of input for
continuous processing
and of output for
uninterrupted supply
Backward
Integration
Contracting of inputs.
Collection facilities
Production of inputs
Forward Integration Distribution and storage Retail products and food
services
Transport Charter Charter and scheduled Scheduled
Shipping Terms FOB FOB/CFR CFR
9Improving Trade Competitiveness in Cambodia:
An Analysis Using a Trade and Transport Facilitation Assessment (TTFA)

For each of the trades studied, there is a mix of business models being applied and, in most cases, a gradual
evolution is occurring towards those providing more value-added. The analysis therefore examines the
initiatives required to encourage this evolution. By focusing on the span of control, this study addresses the
organization of both the inbound and outbound supply chains. Specifi cally it considers the extent of control of
the organizing principal over the activities within the supply chains. This will usually increase as the business
model evolves in order to:
ensure a more regular reliable fl ow of goods through the supply chain,
improve the quality of the inputs, and
provide distribution channels for specifi c markets.
The span of control has two dimensions: (1) how far the involvement extends upstream in the activities of
inbound supply chains and downstream in the activities of the outbound supply chains, and (2) the mechanism
used to control these activities. Generally, there are a variety of mechanisms ranging from direct involvement
through investment and operational control to restructuring the transactions with the providers of these
activities. The latter includes among others:
simplifying the transactions,
improving enforcement of contracts, and
providing more fl exible fi nancial terms to ensure reasonable distribution of the benefi ts among the
participants in the supply chains.
10 Improving Trade Competitiveness in Cambodia:
An Analysis Using a Trade and Transport Facilitation Assessment (TTFA)


2. Rice2.1 Trade and markets
The rice sector in Cambodia consists of about 2.9 million rice farms with an average area of less than
2 hectares and producing about 3.0-3.5 tons of padi per year.3 Total production of padi grew at about
8 percent per year from 2000 to 2010 due both to an increase in the average yield and harvested area
(Figure 2). The increase in yield was achieved through various means including expansion of irrigation
infrastructure; increased use of high yielding varieties; and an intensifi cation of the crop cycle allowing
double cropping. Although the average productivity is considerably below the global average, it is comparable
with Thailand, the largest rice exporting country, which has an average yield of 2.88 tons/ha.4
Figure 2: Cambodia rice production, 2000-10
Source: Ministry of Agriculture, Forestry and Fisheries
3
2.75
2.5
2.25
2
1.75
1.5
3.25
3
2.75
2.5
2.25
2
1.75
2000 2001 2002 2003 2004 2005 2006 2007 2008 2009 2010
Area Harvested YieId
To
ns
/He
cto
are
MiI
Iio
n H
ec
tare
The volume of rice that is formally exported has
increased rapidly in the last few years from 10,000
tons in 2008 to 51,000 tons in 2010 and 175,000
tons in 2011. However, this represents only about 3
percent of total production.5
A large number of countries import Cambodian rice.
However, in 2010, over 90 percent was shipped to the
EU and Russia. The principal destination was France
with a share of 55 percent, followed by Poland and
Lithuania, which together received 15 percent. Asian
imports amounted to less than 4 percent and North
America less than 2 percent.
3 Based on ABiC survey data, average landing holding of farmer is 1.2 hectares (minimum landholding is less than 0.5 hectares and maximum landholding
is 200 hectares). Ministry of Agriculture, Forestry and Fishery records that average paddy yield is 2.97 tons per hectares4 DUSDA, FAO and Reuters5 Assuming an average yield of 64 percent on the total padi production of 8.25 million tons.6 These are distinct from the custom mills which serve the village requirements.7 These yields are for good quality padi, lower outputs result with higher moisture content and immature rice
2.2 Industrial organizationThe export of rice involves three participants
with increasing levels of concentration. The rice
is produced by about 2.9 million farmers most
of whom have plots of less than 2 hectares. The
larger farms (about 40 percent of all rice farms)
produce a surplus that is sold directly or indirectly
to commercial mills6 (as distinct from the custom
mills).
The commercial mills are divided into two groups
based on size as follows:
Small mills with a productive capacity of
less than 10 tons of padi per day. These use
older technology and have milling yields of
less than 65 percent. They produce a high
proportion of broken rice, up to 50 percent
and more. The operating costs are relatively
high, up to US$50 per ton. The mills have
limited storage, typically just enough for 3-4
months of production.
Medium size mills with a capacity of 8 to 30
tons of padi per hour. These use newer
technology with milling yields of up to 70
percent and a much lower ratio of broken
rice, 10-20 percent.7 Their operating costs
are also lower, close to US$30 per ton.
12 Improving Trade Competitiveness in Cambodia:
An Analysis Using a Trade and Transport Facilitation Assessment (TTFA)

Cambodia has doubled its modern milling capacity in
the past three years, primarily through the addition
of medium-size mills. As of mid-2011, there were
14 of these, which process about one-third of the
exported rice in the country, and several hundred
small mills that process the remainder. There are
on- going plans to build large mills to accommodate
the expected growth in exports. Those will be in the
50-100 tons per hour range and involve substantial
Foreign Direct Investment (FDI).8
The mills sell the rice either rice polishers, to
exporters or export directly themselves. While there
are a large number of exporters, the market is very
concentrated. The fi ve largest exporters account for
about two-thirds of total exports and the next fi ve
about 14 percent. Of the fi ve largest in 2011, only
one had a mill and two have polishing factories.
2.3 Business models
Organizing principalTo date, rice exports are organized almost exclusively
by local millers, polishers and traders who buy rice
from the mills and sell to the international brokers
and foreign importers. In the future, it is anticipated
that the exporters will mill and/or polish a substantial
portion of the rice they sell overseas.
Span of controlThe span of control of the exporters extends back
to the mills but primarily through spot market
transactions. Most do not have control over the
operations or output quality of the farms or even
the mills. Similarly, their control over the outbound
supply chain is limited.
They organize the domestic movement but the rice
is primarily is sold FOB and the buyer controls the
international movement. There are some exceptions
to this arrangement especially for higher value rice.
In this case, the trader takes responsibility for the
quality of the padi and it’s processing as discussed in
the box to the right.
2.4 Supply chain structure
InboundThe fl ow of padi and milled rice from farm to export
is shown in Figure 3. The inbound supply chain
begins at the farm gate where padi is sold for cash
to either collectors or directly to commercial mills.
Most of the padi is purchased during the harvest
season from December to May in the Southeast and
July to November in the Northwest. The collectors
consolidate the padi from several farms and either
sell it to larger local traders or deliver it to the
commercial mills. Sometimes they sell the rice to
the highest bidder but often they act as agents for
specifi c mills.9 They sell the padi to the mills on a
Angkor Kasekam Roonrooueng (AKR) is a
producer and exporter of aromatic rice.
It has a 30-ton per hour mill and uses
contractual arrangements with commune-
level farm associations to produce a single
variety. The farmers are provided with free
seed and receive a premium price for their
padi. Its involvement in the supply chain
from farm to point of export is extensive
and includes:
• identifying areas suitable for growing
fragrant paddy;
• establishing farmer associations
based on existing commune
structures and bringing these under
its management;
• using these associations to recruit
farmers;
• delivering improved seeds and
technical advice to contract farmers;
• monitoring and solving production
problems;
• collecting and purchasing rice output
at AKR’s gate;
• sorting milled and packaged paddy
into different types; and
• exporting rice to international
markets, including Europe, Australia
and Hong Kong
8 These include the proposed US$100 million investment by Asia Golden Rice, Thailand’s largest exporter9 They also sell padi to traders from Vietnam and Thailand.
13Improving Trade Competitiveness in Cambodia:
An Analysis Using a Trade and Transport Facilitation Assessment (TTFA)

cash basis. The price is set at the spot market and the quality of the rice measured in terms of moisture content
and immature rice. The size of their purchases is limited by the working capital and they normally purchase only
a few hundred tons a year.
Figure 3: Rice fl ow
PadiPadi
Semi-Milled Rice
Semi-Milled Rice
FarmsFarmersGroup
Collector
Small Commercial
Mill
Large Commercial
Mill
PolishingFactory
TraderInternational
Trader or Broker
The current market structure provides few incentives for higher quality varieties of rice because the output of
many smallholders is collated for sale. Since the transactions include padi collected from a number of farms
that grow different varieties, for non-aromatic padi there is little differentiation in price based on variety. As a
result there are few incentives for farmers to worry about varieties and moisture content. Similarly, the local
market does not pay a premium for well-milled rice or rice with a limited number of brokens, so most millers
do not attempt to optimize the quality of the milled rice. The tests for Genetically Modifi ed Organism (GMO)
are performed in laboratories in Vietnam or Thailand. Targeted initiatives to reward farmers and traders by
differentiating between different qualities of rice may improve the value of the fi nal sale.
The exporters who operate mills sometimes purchase semi-milled rice from smaller mills paying cash at the
time of delivery and provide an advance to assist the small mills in purchasing padi. The semi-milled rice
receives additional processing, including polishing and sorting, at the exporters’ facilities. Transport for these
larger shipments is organized using local transport companies.
Some of the larger mills sometimes purchase padi directly from growers’ associations or through contract
farming arrangements. In this situation, they are concerned with quality and will provide funding for inputs and
advise farmers on seed selection. This is a relatively new initiative and provides a good model for the future
direction of the industry.
The inbound supply chain is characterized by limited storage facilities. The mills store enough padi to fi ll orders
for 3-4 months after the harvest season. Their storage facilities are also used to dry the padi prior to milling,
though this drying is generally inexpert and therefore long-term storage is restricted. Some mills use silos for
drying and a few have recently acquired mechanical dryers but the majority of mills store the padi in bags in
warehouses, thereby limiting its shelf-life.
14 Improving Trade Competitiveness in Cambodia:
An Analysis Using a Trade and Transport Facilitation Assessment (TTFA)

OutboundRice leaves Cambodia in relatively small consignments, with overseas shipments via containers generally
departing through Sihanoukville or Phnom Penh, but beginning in 2011 uncontainerized rice was barged down
the Mekong River to Ho Chi Minh City in Vietnam. Milled rice is exported in 50kg bags except for high-valued
fragrant rice, which is sometimes shipped in 2kg bags or smaller packages. Due to the limited size of orders and
draft limitations in Sihanoukville, most of the bagged rice is shipped in containers, including lower-value rice
that would normally be shipped as general cargo. The exception is rice produced from padi that is transported
from Cambodia to Vietnam, milled, mixed with Vietnamese rice, bagged and then loaded on general cargo
vessels in the terminals in Ho Chi Minh City.10
Most of the mills are located away from the river at the intersection of a major trade corridor and the rural road
network serving the growing area. The rice is bagged at the mill and transported by road to Phnom Penh where
it is stuffed in containers for shipment by road to Sihanoukville or transported by barge to loading points near
Saigon port. The domestic movement accounts for a relatively high proportion of the costs—trucking costs are
reasonable by international standards but the expenses related to informal tolls on truck transport and freight
forwarding are high. These were studied in greater detail in the World Bank’s Transport Corridor Assessment.
The formal movement of rice is costly by international standards and is constrained by the limited supply of
appropriate 20-foot food containers. As a result of the high freight forwarding costs discussed above, container
transport is relatively expensive per ton kilometer and is constrained by limited availability of empty 20-foot
containers suitable for transport of food. Most of the containers unloaded in Sihanoukville are 40-foot boxes
carrying inputs for the garment industry or 20-foot boxes carrying equipment and other goods not compatible
with food shipments. Therefore, it is necessary to reposition empty 20-foot boxes from Singapore to Phnom
Penh or Sihanoukville for loading rice destined to Europe.
FinancialThe availability of working capital also limits activity throughout the supply chain from the amount of padi a
collector can buy to the order size that a trader or mill can accept. The lack of access to suffi cient working
capital has allowed Thai and Vietnamese traders to dominate the market for Cambodian rice. The farmers
need cash quickly at the time of harvest, which local millers cannot provide due to poor access to credit, so
buyers from across the border are able to purchase the majority of the harvest. Financial transactions on the
inbound supply chain are mostly made in cash. The principal commercial problem is lack of working capital. The
traders rely on their own cash fl ow and a line of credit from a commercial bank. The terms are about 9 percent
fi xed-interest for a one-year loan (foreign exchange).
Working capital remains a serious constraint on the outbound supply chain. An advance is frequently provided
to the trader for purchase of the padi or semi-milled rice. However, nearly all of the shipments are FOB with
payment made a fi xed period after loading the cargo.
2.5 Supply chain performanceThe fi rms interviewed were both rice exporters that purchased milled rice from local mills and miller- exporters
who purchased padi from collectors. They export both white and fragrant rice, primarily to Europe. Two were
large, handling 20,000-25,000 tons per year while two were niche players handling 3,000-6 ,000 tons per year.
10 Sihanoukville Port has a maximum draft of only 8 meters for general cargo vessels. Also it lacks continuous cargo handling operations and sufficient
bonded storage for efficient transfer of bagged rice.
15Improving Trade Competitiveness in Cambodia:
An Analysis Using a Trade and Transport Facilitation Assessment (TTFA)

Segregating the types of non-aromatic padi allows traders to extract additional value from the crop. The average
unit cost for semi-milled rice is US$300-US$500 per ton for white rice and US$650-US$750 for jasmine rice.
The semi-milled rice and padi is delivered to their facility by the supplier usually within a day. The size of the
orders varies with the smaller traders ordering less than 100 tons at a time. The milled and polished rice is
sold primarily to foreign importers on FOB terms. Some of the fragrant rice is sold on CFR terms to foreign
retailers and distributors.
The typical size of export shipments varies from 3 to 15 TEU. However, smaller traders will ship a single TEU,
especially for fragrant rice. The minimum shipment size for larger traders is usually 5 TEU and they accept
orders with multiple shipments. The time from confi rmation of the order to loading on the ship is 5-14 days.
The order cycle from order confi rmation to delivery to the buyer’s warehouse is 35-42 days for Europe but can
be as little as 14 days for East Asia and less for Southeast Asia. The percentage of delayed shipments varies
by trader but is generally 10 percent or less. Most delays are a result of problems in the outbound supply chain
including
lack of reliability in terms of domestic transport,
availability of 20’ containers suitable for carrying food,
ineffi cient handling at the loading port, and
lack of availability of customs offi cials.
There are no signifi cant problems with documentation for the exports but the tests can be an impediment.
The times for acquiring the necessary export documentation are:
Certifi cate of Origin about - 3 days,
Phytosanitary certifi cate - 7 days
Fumigation certifi cate – 1 day,
Quantity certifi cate – 4 days, and
Chemical tests - 7-12 days.
2.6 Objectives and strategies
General objective and strategySince most of Cambodia’s exportable surplus is informally shipped to Thailand and Vietnam as padi,
the current objective of the government is to increase the formal exports of milled rice. The country
generates suffi cient surplus to reach the government’s target of one million tons per year, but there are a
number of logistics problems, only one of which is lack of modern milling capacity - especially that of
suffi cient size to accept larger orders. Meeting this target will signifi cantly increase the value of the
exports but equally signifi cant gains can be achieved by increasing the quality of rice exports. Both efforts
require a restructuring of the inbound supply chains which are currently based on small-scale operations.
While the increase in exports of milled rice can be achieved through a short-term strategy, the improvement in
quality of the rice requires a longer term strategy.
Given the current concentration in rice export trading business, the most expedient strategy for increasing
the share of local padi production that is processed in and exported from Cambodia, would be to encourage
larger traders to invest in modern rice-polishing factories and rice mills. This would take advantage of the
existing collection system but expand it to include the purchase of padi that otherwise will be smuggled to
neighboring countries. This requires private investment in facilities to improve the outbound supply chains and
public initiatives to simplify trade regulations and encourage competition. Complementing this strategy, there
should be a shift in the outbound supply chain from a system based on spot market sales to one based on
supplying rice under an extended shipping period.
16 Improving Trade Competitiveness in Cambodia:
An Analysis Using a Trade and Transport Facilitation Assessment (TTFA)

In the medium term, the strategy would shift to increasing the yield and improving the quality of both padi
and processing. This requires a more integrated inbound supply chain that provides incentives to improve
agricultural practices. It also requires a change in the organizing principal from exporters who do not own
factories to miller-exporters and polisher-exporters that sell directly to international traders and distributors.
2.7 ImplementationInbound supply chains will be strengthened by the current trend of increasing the size and effi ciency of
rice mills. The larger capacity of these mills implies a more effi cient system for collecting padi to achieve
economies of scale. This begins with a more effi cient mechanism for aggregation of padi in order to reduce
the cost of delivery to the larger mills. New facilities for storing and drying padi need to be established near the
growing areas and operated by mills or third parties. The mills would purchase the padi either from the farm
or from these facilities and would maintain their inventory at this facility removing it just before for milling.
These facilities would allow greater fl exibility in locating new mills, especially at locations that provide direct
access to the inland waterways. Existing mills located close to the areas of production would use these facilities
to supplement their own storage. The resulting restructuring of the inbound supply chain is shown in Figure 4.
A sustainable mechanism for improving the quality of export rice requires coordination between the public
and private sectors. This could begin with encouraging traders to operate their own mills either through tax
incentives or with certifi cation/licensing requirements. The growth in volume of trade will increase the overall
demand for working capital. The increase in the size of mills and export orders will increase the amount of
working capital required by individual mills. The increase period of storage in order to reduce moisture content
and extend the period of milling will lengthen the cash-to-cash cycles. As a result of these changes, the fi nancial
instruments used to provide working capital need to be modifi ed to reduce the cost and collateral requirements
while increasing the borrowing limit and tenor.
Figure 4: Restructure rice supply chain
Collection
Storing
Drying
FarmsFarmers
Group
Collector
Large Commercial
Mill/Trader
International
Trader or Broker
17Improving Trade Competitiveness in Cambodia:
An Analysis Using a Trade and Transport Facilitation Assessment (TTFA)

Improvements in performance on the outbound supply chains require upgrading the trade corridors connecting
the rice growing areas to the loading points for international shipments. These corridors include those used by:
Aromatic rice transport by road from the Northwest through Poipet to Laem Chabang for container
shipments and through Khlong Toey for general cargo shipments;
Aromatic, traditional and high yield varieties transported by barge to Ho Chi Minh Port port for loading
general cargo ships;
Aromatic, traditional and high yield varieties transported by truck to Sihanoukville for loading on general
cargo vessels; and
Aromatic, traditional and high-yield varieties transported by road to Phnom Penh for stuffi ng in containers
and either loaded in Phnom Penh Port or trucked to Sihanoukville Port for loading on container vessels.
The fi rst two corridors require simplifi ed procedures at the borders and the provision for movement of
trucks across the border. The second requires simplifi ed transit procedures based on the 2009 agreement
between Vietnam and Cambodia on Waterway Transportation.11 All four would provide economies of
scale for the general cargo shipments and improve connectivity for container shipments. They would
also provide shorter transit times, more competitive services and lower freight rates for both container
and general cargo shipments.
Although there have been considerable improvement in documentation and transport services in recent
years, further improvements will be required to support a signifi cant increase in export volumes. The
problems associated with obtaining a Certificate of Origin (CO) have been reduced and international
certifi cation and inspection fi rms now operate in Cambodia. However, the procedures for preparation
and approval of trade documentation need to be simplifi ed and clearance times for exports of large
shipments of rice need to be shortened. Currently, the Government is working on a one-window strategy but
there is also a need for:
Allowing non-governmental agencies such as Chamber of Commerce to CO prior to shipment,
Licensing of private, certifi ed testing facilities to perform phytosanitary, fumigation and GMO tests, and
Automating the submission and processing of the additional documents introduced as part of bilateral
trade agreements.
Recommendations Facilitate greater investment in padi storage and drying facilities, perhaps by underwriting risk from
commercial banks to encourage lending into the rice sector and reduce the cost of working capital
sought by millers to buy rice at the end of each season.
The RGC may wish to engage short-term agricultural experts to advise on the optimal location of these
storing and drying facilities.
Facilitate the creation of agricultural cooperatives in order to aggregate supply and tighten the supply
chain in terms of quality and regularity of rice.
Ensure that Cambodia and Vietnam jointly implement simplifi ed transit agreements according to the
Waterways Transportation Agreement of 2009.
The preparation and issuance of Certifi cates of Origin will need to be expedited through more effi cient
procedures, perhaps by implementing an automated web-based approach, or allowing issuance of
these certifi cates by industry groups such as the Chamber of Commerce of Cambodia.
11 The purpose of the present Agreement is to establish a legal framework for the effective implementation of freedom of navigation in the
Mekong river system, and to create favorable conditions for transit and cross-border
18 Improving Trade Competitiveness in Cambodia:
An Analysis Using a Trade and Transport Facilitation Assessment (TTFA)


3. Garments
3.1 TradeGarments have provided the solid backbone to Cambodia’s export-led growth story over the past decade. The
industry has tripled its share in the global market place over that period, yet it still faces constraints in its
ability to lead the growth of Cambodia’s economy up the value chain or in leading towards greater and more
sophisticated export product diversity. The benefi ts and limitations of the current industry structure shall be
examined below.
The value of Cambodia’s garment exports grew at a relatively uniform rate until the global fi nancial crisis,
which caused a temporary contraction (Figure 5). Similarly, the contribution of the apparel industry to GDP has
risen from around 1 percent in the early 1990s to about 10 percent in 2009. Cambodia’s contribution to global
garment trade, however, remains small, growing to about 0.95 percent in 2011 from a very low base.
The growth in exports has been achieved through an increase in foreign investment, which led in turn to
rapid growth in the number of factories and associated employment. The majority of garment factories in
Cambodia are owned by investors from Taiwan, China, and, Hong Kong. Only about 6 percent are owned by
local investors. The average level of employment per factory is about 1,100 employees. About one quarter
of the fi rms employs less than 500 workers while the larger fi rms employ between 6,000 and 9,000.
Locally-owned factories average less than 600 workers and Chinese fi rms about 650.12 The balance of social
welfare benefi ts accruing from the garment sector, the most direct of which is employment, thus rests in
the hands of foreign investors.
If the benefi ts of foreign investment are clear, the potential instability of Cambodia’s reliance on foreign
investment in the garment industry was also illustrated in the fi nancial crisis of 2008. The contraction
in garment exports beginning in 2008 brought a halt to new investments and a number of factories closed
12 Table 1.3, “Factory-Level Value Chain Analysis of Cambodia’s Apparel Industry”.
Figure 5: Cambodian garment exports
80%
75%
70%
65%
60%
55%
50%
45%
Sh
are
of
Ex
po
rts
Va
lue
U$
$ b
illi
on
s
2001 2003 2004 2005 2006 2007 2008 2009 2010
3.5
3.0
2.5
2.0
1.5
1.0
0.5
0.02002
Source: GMAC, 2011
20 Improving Trade Competitiveness in Cambodia:
An Analysis Using a Trade and Transport Facilitation Assessment (TTFA)

while others merged. The fast pace of recovery since 2010, however, has allowed exports to return to
pre-crisis levels, though employment and the number of factories and the management structure have
remained relatively unchanged (Figure 6). Recently, there has been renewed interest from foreign investors in
relocating garment factories to Cambodia and a number of proposals for investment are awaiting government
approval.
Cambodia serves a relatively small number of markets with a limited number of products. The principal export
destination is North America followed by the EU, as shown in Figure 7. ASEAN accounts for less than 1 percent
of garment exports, most of which is rag trade sent to Singapore, presumably for re-export. The concentration
on markets in the US and EU has been encouraged by the various trade agreements that provide preferential
access.
Fa
cto
rie
s;
00
0 E
mp
loye
es
Employment
400
1995 1997 1999
350
250
150
100
50
0
300
200
2001 2003 2005 2007 2009
Factories
Figure 6: Number of Cambodian garmentfactories and direct employment
Figure 7: Cambodian garment export destinations, 2010
2%7%
55%
8%
28%
US
Canada
EU-27
Japan
Other
Source: International Labor Organization, GMAC, 2011
Source: GMAC, 2011
21Improving Trade Competitiveness in Cambodia:
An Analysis Using a Trade and Transport Facilitation Assessment (TTFA)
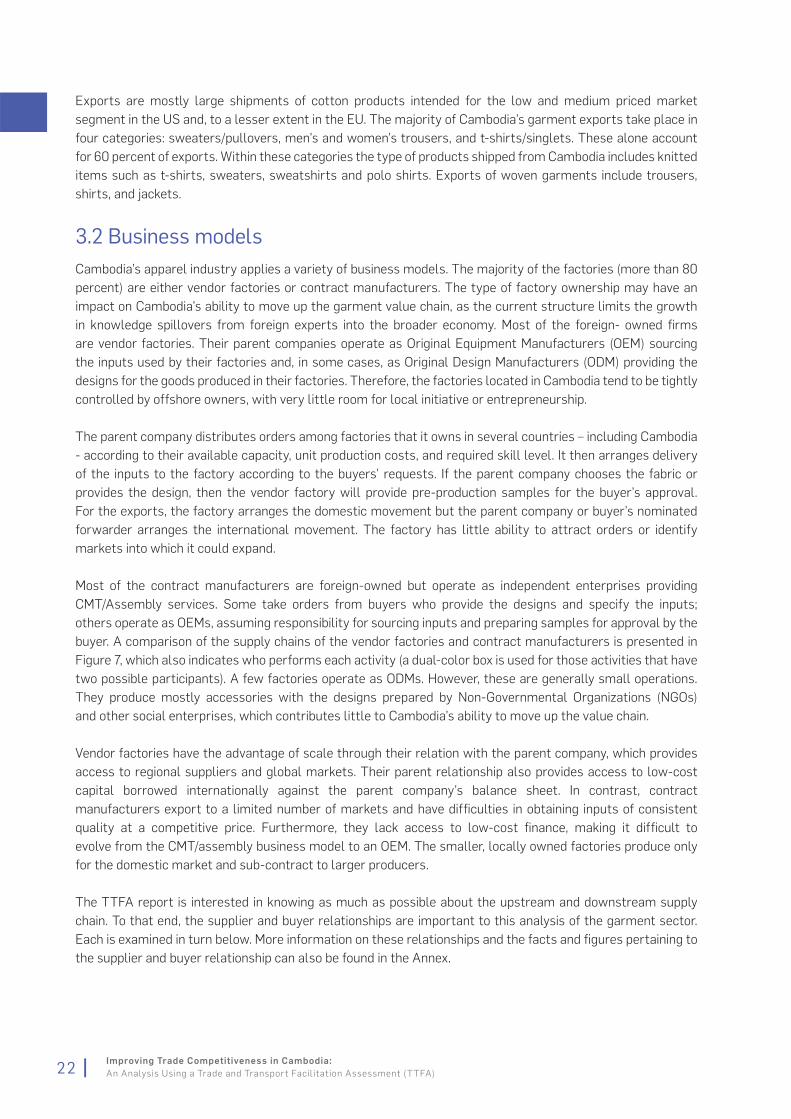
Exports are mostly large shipments of cotton products intended for the low and medium priced market
segment in the US and, to a lesser extent in the EU. The majority of Cambodia’s garment exports take place in
four categories: sweaters/pullovers, men’s and women’s trousers, and t-shirts/singlets. These alone account
for 60 percent of exports. Within these categories the type of products shipped from Cambodia includes knitted
items such as t-shirts, sweaters, sweatshirts and polo shirts. Exports of woven garments include trousers,
shirts, and jackets.
3.2 Business modelsCambodia’s apparel industry applies a variety of business models. The majority of the factories (more than 80
percent) are either vendor factories or contract manufacturers. The type of factory ownership may have an
impact on Cambodia’s ability to move up the garment value chain, as the current structure limits the growth
in knowledge spillovers from foreign experts into the broader economy. Most of the foreign- owned fi rms
are vendor factories. Their parent companies operate as Original Equipment Manufacturers (OEM) sourcing
the inputs used by their factories and, in some cases, as Original Design Manufacturers (ODM) providing the
designs for the goods produced in their factories. Therefore, the factories located in Cambodia tend to be tightly
controlled by offshore owners, with very little room for local initiative or entrepreneurship.
The parent company distributes orders among factories that it owns in several countries – including Cambodia
- according to their available capacity, unit production costs, and required skill level. It then arranges delivery
of the inputs to the factory according to the buyers’ requests. If the parent company chooses the fabric or
provides the design, then the vendor factory will provide pre-production samples for the buyer’s approval.
For the exports, the factory arranges the domestic movement but the parent company or buyer’s nominated
forwarder arranges the international movement. The factory has little ability to attract orders or identify
markets into which it could expand.
Most of the contract manufacturers are foreign-owned but operate as independent enterprises providing
CMT/Assembly services. Some take orders from buyers who provide the designs and specify the inputs;
others operate as OEMs, assuming responsibility for sourcing inputs and preparing samples for approval by the
buyer. A comparison of the supply chains of the vendor factories and contract manufacturers is presented in
Figure 7, which also indicates who performs each activity (a dual-color box is used for those activities that have
two possible participants). A few factories operate as ODMs. However, these are generally small operations.
They produce mostly accessories with the designs prepared by Non-Governmental Organizations (NGOs)
and other social enterprises, which contributes little to Cambodia’s ability to move up the value chain.
Vendor factories have the advantage of scale through their relation with the parent company, which provides
access to regional suppliers and global markets. Their parent relationship also provides access to low-cost
capital borrowed internationally against the parent company’s balance sheet. In contrast, contract
manufacturers export to a limited number of markets and have diffi culties in obtaining inputs of consistent
quality at a competitive price. Furthermore, they lack access to low-cost fi nance, making it diffi cult to
evolve from the CMT/assembly business model to an OEM. The smaller, locally owned factories produce only
for the domestic market and sub-contract to larger producers.
The TTFA report is interested in knowing as much as possible about the upstream and downstream supply
chain. To that end, the supplier and buyer relationships are important to this analysis of the garment sector.
Each is examined in turn below. More information on these relationships and the facts and fi gures pertaining to
the supplier and buyer relationship can also be found in the Annex.
22 Improving Trade Competitiveness in Cambodia:
An Analysis Using a Trade and Transport Facilitation Assessment (TTFA)

SuppliersAll the fabrics, threads, accessories and trim used in production of apparel exports must be imported. Only
packaging is produced locally. About 70 percent of the fabric is imported from China, Taiwan and Hong Kong
and another 16 percent from Southeast Asia. The textiles are purchased from the original manufacturer or
their overseas distributors. For the vendor factories, the parent companies have long- standing relations with
these suppliers, a large proportion of which are located in the same country as the parent company.
The contract manufacturers that procure their own inputs do so in accordance with the buyer’s specifi cations
and, in many cases, receive a list of authorized suppliers from their buyers.
BuyersThe principal customers for Cambodia’s apparel exports are brand marketers and retail chains. The largest
customers, a selection of which includes famous brand names such as H&M, Levi Strauss, Nike, Adidas, C&A
and Target, account for the majority of Cambodia’s garment exports. GAP alone is estimated to account for 30
percent of total apparel exports. The vendor factories produce garments for larger buyers while most of the
contract manufacturers to sell their garments to buying agents and smaller retailers.
Span of controlAs indicated above, the managers of vendor factories in Cambodia have limited participation in their inbound
and outbound supply chains. Aside from production, their only role is to manage the domestic movement,
including clearance and transport. In contrast, the contract manufacturers participate in purchasing inputs
that are imported on a CFR basis and selling their fi nished goods on an FOB basis.
3.3 Supply chain performanceDespite continued growth, the apparel industry in Cambodia faces a number of challenges. The immediate
concerns are the rising cost of production due to increasing wages and the high cost of energy. While the value
of exports is expected to grow in the short term as more factories are established, this industry may become
increasingly vulnerable unless changes in the structure and management of factories take place. At the present
time, most factories have minimal investments in fi xed assets and can easily relocate if operating costs are no
longer competitive. The main challenge is to solidify the foreign investment in this sector, perhaps by fostering
the span of control of local factories.
In the medium term, the industry needs to move away from basic apparel because of strong competition
from larger exporters such Vietnam, Bangladesh, and China and India that can offer economies of scale. If
it is to compete for the production of higher value goods, then the industry needs to become more effi cient
primarily by improving the performance of its inbound and outbound supply chains. Details of the structure
and performance of the supply chain are contained in the following paragraphs. The information contained in
this section is evaluated in following sections and informs the recommendations contained at the end of the
chapter.
As stated earlier, the majority of garment factories produce against confi rmed orders that are negotiated
abroad by the parent company. The only inventory is imported inputs awaiting testing, and inputs that are
being consolidated prior to the start of production. The volume of orders varies by season but peak demand is
relatively small, about 20-30 percent above average, because most products have a relatively long shelf live. To
accommodate these peaks, the factories extend their working hours, add production lines and/or subcontract
part of the order.
23Improving Trade Competitiveness in Cambodia:
An Analysis Using a Trade and Transport Facilitation Assessment (TTFA)

Design
Source
Fabric
Source
Fabric
GMT GMT
EJ
Design
Produce
Fabric
Produce
Fabric
Ship
Fabric
Prepare
Samples
Approve
Samples
Deliver to
Gateway
Clearance
International
Shipment
Market and
Distribute
Parent Company OEMIODM
ContractManufacturer
OEM
Vendor Factory
Market and
Distribute
International
Shipment
Clearance
Deliver to
Gateway
Approve
Samples
Clear and Deliver to Factory
Ship
Fabric
Clear and Deliver to Factory
Prepare
Samples
Figure 8: Allocation of responsibility forsupply chain activities
24 Improving Trade Competitiveness in Cambodia:
An Analysis Using a Trade and Transport Facilitation Assessment (TTFA)

The order cycle from confi rmation of order to delivery to the export gateway averages about 90 days. For
smaller orders of simple products, the average is closer to 45 days while for larger orders that require special
fabrics and/or various samples to be approved prior to production the average is closer to 120 days. The
delivery time for imported fabrics is 3-8 weeks and the value of shipments is in the range of US$50,000 to
US$75,000 per TEU. Factories receive consignments on a weekly basis with most shipments organized by the
supplier on a CFR basis. Payments for the imports are made a specifi ed time after receipt of goods, typically a
week or two, using a telegraphic transfer (TT). For vendor factories, the parent company manages the fi nances
and transactions. For local fi rms, the transactions often require a Letter of Credit (L/C) and are fi nanced by
discounting the buyer’s L/C.
Finished garments are packed and labeled for delivery to retail outlets. The garments are then shipped in ocean
containers to the retailer’s distribution center. Ocean transport is arranged by the buyer’s nominated forwarder.
The containers are loaded at the factory for transport to Sihanoukville Port. The time for overseas shipment
adds 15-35 days to the total order cycle depending on the distance to the overseas destination. Larger orders
are sent in multiple consignments, usually on a weekly basis. Airfreight is used only for time-sensitive or delayed
shipments, which account for 1 percent and 5 percent of the shipments, respectively.
The cost for moving the container from Sihanoukville port to the factory’s warehouse is $700-$900 per
Forty Foot Equivalent Unit (FEU), which includes the terminal handling charge. For transport from the
factory to the port, the range is from US$450-US$1000. Most fi rms give 5-7 days advance notice when arranging
truck transport to the port.
The garments produced have an average value of US$3-US$4 per unit. The higher cost items have more trim
and embroidery. The value per FEU varies from US$100,000 to over US$200,000. The garments are shipped
FOB or Free Carrier (FCA) with payment by TT, usually 7-30 days after loading on the vessel. International
freight rates vary by destination but are currently about US$800 per FEU for East Asia, US$1,800 for North
Europe and US$3,600 for the US east coast.
The major challenge for the factories is to retain skilled labor and securing adequate energy supplies. Logistics
is not considered a major problem; although the high cost for land transport and diffi culties with submission
of various shipping documents and with clearing the cargoes are among the concerns mentioned by factory
managers.
Although Customs has improved its performance considerably, it is still seen as ineffi cient in processing
imported inputs. Customs declarations can be submitted electronically for imports but hardcopies must be
submitted together with supporting documents. A Report of Finding from the PSI is required for imports worth
more than US$4,000. Clearance is often delayed because customs offi cials are unavailable for processing. An
import license may be required for specifi c commodities. The application for import permits should take only
one day but, in practice, can require three to four days. Finally, the level of inspection remains high (Table 4).
Table 4: Customs inspection requirements for imports
a The Customs Examination Team inspects the goods simultaneously with CamControl
b Sealed containers are subject to PSI are not examined unless there is reason to suspect irregularities.
c All other containers are subject to detailed inspection
d 80 percent of investment company goods are
Source: General Department of Customs and Excise, 2011
For exports, the major source of delay is associated with the issue of the certifi cate of origin (CO), which can
only be issued after shipment and can require 5-10 days. This delays the transfer of documents to the buyer and
payments to the exporter. The cost for reapplying for a CO is also high, about US$280.
25Improving Trade Competitiveness in Cambodia:
An Analysis Using a Trade and Transport Facilitation Assessment (TTFA)

3.4 International competitiveness of Cambodia’s garment industryThe contraction of the global trade in apparel during the fi nancial crisis produced downward pressure on the
prices paid to the manufacturers. The buyers not only reduced their orders but also placed greater emphasis
on reducing order cycles and increasing fl exibility in production and delivery. They also changed the terms
of payment, thereby extending the manufacturers’ cash-to-cash cycle. It is unclear to what extent the
manufacturers will be able to reverse these developments even when the global economy recovers. The impact
on Cambodia has been limited because it produces basic apparel, with little fashion content and a long shelf
life. However, these developments create an obstacle for manufacturers to move into higher-value products.
The recent upward pressure on wages for Cambodian workers is creating a problem for Cambodia’s garment
manufacturers, who compete primarily on price.13 There is greater competition from China, which has reasserted
itself in the low end of the market. Also, opportunities for reducing the order cycle are limited since about 70
percent of the order cycle is taken up by delivery of inputs and international shipping of exports (see details
on supply chain competitiveness in the section above and in the conclusions and recommendations presented
at the end of the chapter). Another diffi culty facing the manufacturers is the trend among larger buyers to
limit the number of suppliers and contract with OEMs that can manage the inbound supply chains. In terms of
markets, there is an on-going redistribution of demand with much of the growth coming not from the EU and
US but from the larger emerging economies.
The need for more working capital to accommodate these changes has not been a signifi cant problem because
most of the factories rely on their foreign owners to provide the funds. For Cambodian manufacturers to provide
more value-addition, however, access to credit for garment factories that have been incorporated locally or that
wish to evolve to become ODMs may need to be facilitated. For the same reason there is less concern about
foreign exchange risk (in addition to the fact that there are few restrictions on foreign currency transactions
in Cambodia), but the process of de-dollarization of Cambodia’s economy may pose risks in the medium-to-
long term.
3.5 General objective and strategiesThe export of garments has grown steadily with the exception of the recent downturn due to the global fi nancial
crisis and it remains the principal export of Cambodia. However its share of total exports has declined as shown
in Figure 4 and now amounts to about 55 percent. The objective for the industry is to sustain growth in the value
of exports and thereby its contribution to economic growth.
The strategy for accomplishing this objective must have separate components for vendor factories and contract
manufacturers. For vendor factories, logistics need to be improved to reduce time and cost for the inbound and
outbound supply chains and to address shortages of labor and power. It is also important to facilitate approval
for foreign investments that will produce higher value garments and open new markets while also providing
access to credit for local manufacturers. For contract manufactures, the improvements in logistics should be
complemented with improvements in the supply chains. There is also need for technical and fi nancial support
for the transition from CMT/Assembly operations to OEMs and compete effectively with vendor factories.
3.6 ImplementationWhile the private sector has been effective in organizing production of garments and expanding the volume of
exports, there is a lack of strategic vision. Most of the management decisions are made outside of the country
with the result that the industry lacks a consensus on the need for diversifying its products and markets,
13 Given the large portion of the non-farm, non-government labor that is employed in the sector, the difficulty in recruiting and retaining workers, and the growing
assertiveness of labor unions, it is expected that this will continue.
26 Improving Trade Competitiveness in Cambodia:
An Analysis Using a Trade and Transport Facilitation Assessment (TTFA)

increasing the quality of its products and/or adding value within Cambodia. First priority should be given to
developing a vision on how to achieve the growth objectives mentioned above. This requires a coordinated effort
involving the government and private sector. It also requires an assessment of the market opportunities
There are a variety of markets for higher value garments that Cambodia might consider, some of which are
shown in Table 5. Each has slightly different requirement in terms of supply chain performance. While individual
fi rms will continue to choose their markets, there is an advantage to selecting a target market for the garment
industry, especially for the contract manufacturers. This would allow for a coordinated effort in developing the
logistics and other capabilities that will provide a competitive advantage for that target market.
Table 5: Selected markets for higher value garments
Product Market characteristics Cycle time Capabilities
Higher qualityQuality of inputs
Skill intensiveModerate
Procurement, Quality control throughout
chain, Pool of skilled labor, Specialized
logistics and equipment
Fashion basicsShort order cycle
Short shelf lifeShort
Quick setup, Quality control for inputs and
outputs Flexible production, Tight logistics
Specialty
garments
Small order
Special fabric and trim
complex inputs
FlexibleProcurement and supply chain management
Flexible production Client management
Small brand
manufacturers
Small order
Flexible production runs
Short to
Moderate
Procurement, Quality control for inputs and
outputs
Most of the markets will require a reduction in the order cycle times. Current cycle times vary. The time for
ordering fabric varies between 3 and 8 weeks depending on availability. The production runs are typically 4
weeks but depends on the size of the order. The time for delivery ranges from 2 to 5 weeks depending on the
destination. The result is a total order cycle of 2 ½ to 4 months. A movement into high value products implies
an increase in the order time for higher quality fabric. Any reduction in order sizes would have relatively little
impact on production time because of the fi xed time for setting up a new production line. The delivery time is
determined by destination, which may change with the diversifi cation into new markets.
Efforts to reduce the order cycle to 2 to 3 months would require a tightening of the inbound supply chain,
primarily though improvements in the trade corridor linking Phnom Penh with the international container
terminals near Ho Chi Minh. This would include both the road linkage via Bavet and container barge connection
from Phnom Penh port. Current efforts to fi nalize the transit agreement with Vietnam and to introduce
simplifi ed procedures for the movement of goods in transit should ensure reliable connections to scheduled
container shipping services.
This trade corridor provides a shorter transit time than the current route through Sihanoukville due to the
combination of a larger number of scheduled services and more direct connections. Initially the savings will be
relatively small because the new container terminals have yet to attract the anticipated traffi c. The shipping
lines have been cautious about expanding services following the global fi nancial crisis. While these ports
already offer better connectivity, it is anticipated that the time savings will increase over the next fi ve years. For
Asian trade the savings in the transit time to Asian sources of fabric and to customers in Japan, South Korea
and Taiwan should be 1 to 2 weeks while for the European trade it would be 2 to 3 weeks.
Additional savings in transit time can be achieved through improvements in trade facilitation are needed to
reduce the clearance ties for both the imported fabrics and the exported garments. These would build on the
current Customs Reform and Modernization program but target the border crossing at Bavet and the Phnom
27Improving Trade Competitiveness in Cambodia:
An Analysis Using a Trade and Transport Facilitation Assessment (TTFA)

Penh port and focus on the other border agencies especially CamControl. In addition to developing a single
window for processing documents, there needs to be greater use of risk management to reduce the amount of
physical inspections, expedited testing procedures, less direct interaction between shippers and regulators and
better control on hours of operations.
Another opportunity for reducing the order cycle is improving the management of the inbound supply chains.
This applies primarily to contract manufacturers since the vendor factories already have tight control over their
supply of inputs. A reduction in the time for procurement of textiles can be achieved through various initiatives
which can provide savings of 1 to 2 weeks in delivery times for fabrics:
participation in the selection of fabrics,
collective ordering in order to negotiate a higher priority in the production schedule,
domestic facilities for dyeing and fi nishing fabric, 14
sourcing arrangements with smaller factories, and
rapid delivery for the initial delivery
There have been proposals for development of upstream production of fabrics, but this is not feasible in the
short-to-medium term because these activities require greater skills and are more capital and energy intensive
than garment manufacturing. Equally important, Cambodia does not produce the raw materials required
unlike many of its competitors.
In order to create an environment that is attractive to foreign investors, Cambodia needs to develop garment
clusters that can accommodate bonded factories, offer reliable utilities and logistics services, provide access
to a large labor pool and attract supporting industries. An extensive network of special economic zones exists,
but only three have had any success and these have a random collection of enterprises. Currently, most
garment manufacturers prefer to operate outside of the zone near Phnom Penh or in Kandal Province
because they have the same ability to import fabric under temporary admission and set up bonded storage
but without restrictions on location or the activities they can pursue. To be successful, any new clusters
should be designed jointly by the government and GMAC and offer the same advantage.
The relatively high borrowing costs in Cambodia do not affect vendor factories which have access to fi nance
raised on international markets by their parent company. However, they prevent the transformation of local
contract manufacturers from CMT/Assembly to OEMs and ODMs. These manufacturers rely on retained
earnings for working capital and limit their investments in new equipment. However, if they are to improve
their control over the supply chains and produce higher value goods with more costly inputs, then it is
necessary to create fi nancial instruments specifi cally for this sector.
Even with development of clusters and better access to capital, the contract manufacturers need to develop
knowledge-based competencies in the areas of sourcing fabrics, supply chain management, lean retailing,
managing fi nancial risk and human resource development. It is diffi cult for individual fi rms to fi nance training
in these areas but it would be possible with support from the government and the GMAC. The same applies
to the training skilled operators where the risk for individual fi rms is that the trained operators will be poached
by other companies. Currently, there are two major training institutes serving the apparel industry.15 However,
the training activity needs to be expanded in both scope and scale, which will require support from the RGC.
14 Equipment for dyeing and finishing would enable firms to maintain stocks of the more commonly used grades of fabric in greige form. This would reduce lead
times and increase flexibility but primarily benefit ODM manufacturers. OEM manufacturers would have to convince buyers that they could meet their
specifications and create an additional round of sample approvals.
15 Cambodia Garment Training Center (CGTC) is funded by Agence Française de Développement (AFD) and run by GMAC and offers training in basic sewing skills;
Cambodia Skills Development Center (CASDEC)), which is largely financially self-sufficient; offers training in technical and industrial engineering, especially
targeting middle management offering assistance for production management, including workflow, planning, controls, and supervision.
28 Improving Trade Competitiveness in Cambodia:
An Analysis Using a Trade and Transport Facilitation Assessment (TTFA)

Recommendations
RGC should encourage contract manufacturers in particular to engage in collective ordering of inputs
in order to benefi t from economies of scale and reduce costs;
Garment manufacturers should be incentivized to move up the value chain from production of basic
apparel which is increasingly crowded to producing niche higher-value items;
Improve the performance of the trade corridors to ports in Vietnam. The Vietnamese ports
(Ho Chi Minh, Cai Mep) have more frequent vessels calls with direct shipping which would signifi cantly
reduce sailing times and therefore order cycle times;
The government and private sector should develop garment clusters in order to attract more FDI.
The clusters should offer reliable utilities and logistics services and help also to provided access to a
large pool of labor, credit and attract support services; and
RGC should streamline and expedite the issuance of certifi cates of origin. Current practices take too
much time while the cost for renewals is high.
29Improving Trade Competitiveness in Cambodia:
An Analysis Using a Trade and Transport Facilitation Assessment (TTFA)


4. Footwear
4.1 TradeOver the past decade, global exports of footwear were increasing steadily until 2009, when there was
a contraction due to the fi nancial. Overall, the value doubled in the eight year period ending in 2010 and this
trend is expected to continue. During the same period, the value of Cambodian footwear exports tripled
(Figure 9). However, its share of global markets remains well below 1 percent (Figure 10). The increase in
value was due to an increase in volume but more importantly to an increase in the unit value, which doubled
during this period. While footwear remains the second largest exporter product, its value is only about
6 percent that of garment exports.
Source: UN-Comtrade, 2012.
0.20%
0.25%
20102006 2007 2008 2009
0.15%
0.05%
0.00%
0.10%
2001 2002 2003 2004 2005
Almost 60 percent of the Cambodian footwear is sold to the EU, primarily to the United Kingdom and Germany.
Other signifi cant markets are Asia with around 20 percent, most of which is destined for Japan, and North
America with around 10 percent, most of which goes to the United States (Figure 11).
Cambodia’s capacity for footwear production has
expanded signifi cantly in the past four years with
20 new factories opening. This was after a period of
fi ve years of no investment (Figure 12). Some of the
new factories are derivatives of earlier investments,
but there are also new, large factories specializing
in the production of shoes with textile uppers. The
growth of the industry refl ects a shift in production
from neighboring countries to take advantage of low
production costs and Cambodia’s duty-free access
to the EU under the Everything-But-Arms (EBA)
initiative. All 37 factories producing footwear have
some level of FDI.
Source: UN-Comtrade, 2012.
Th
ou
sa
nd
to
ns
US
$ m
illi
on
Value
16
18
20
14
10
6
4
2
0
12
8
2001 2002 2003 2004 2005 2006 2007 2008 2009 2010
Quantity
120
100
60
20
0
80
40
Figure 9: Cambodia’s leather footwear exports Figure 10: Share of leather footwear exports
1.14
20.27 0.77
0.60
10.95
2.56
3.740.56
59.41
Asia
Africa
Oceania
North America
South America
Central America
Middle East
EU.27
Rest EU
Figure 11: Cambodian footwear export destinations by % of value
Source: General Department of Customs and Excise, 2011.
31Improving Trade Competitiveness in Cambodia:
An Analysis Using a Trade and Transport Facilitation Assessment (TTFA)

Although most of the footwear exports are shoes with
leather uppers, the proportion of shoes with textile
uppers has increased rapidly in recent years (Figure
13). The latter have an FOB value about 50 percent
higher (Figure 14). While many factories produce
whole shoes a signifi cant portion import pre-made
outer soles because the machines for the outer soles
are relatively expensive. In contract manufacturing
the production of uppers and inner soles are relatively
labor intensive.
Fixed Assets Projects
No
. o
f P
roje
cts
Mil
lio
n U
S$
10 45
40
35
30
25
20
15
10
5
0
8
4
6
2
0
19971998
19992000
20012002
20032004
20052006
20072008
Figure 12: Footwear projects approved in Cambodia
1997-2008
Source: UNCOMTRADE
US
$ M
illi
on
s
100
120
80
40
60
20
0
2001 2002 2003 2004 2005 2006 2007 2008 2009 2010
Leather Uppers Textile Uppers
Figure 13: Footwear exports by type
Source: GMAC, 2011
US
$ M
illi
on
s
Leather Uppers Textile Uppers
20
10
15
5
0
2001 2002 2003 2004 2005 2006 2007 2008 2009 2010
Figure 14: FOB value of footwear exports
Source: UNCOMTRADE; assumes 0.75 kg per pair
4.2 Business models
Organizing principalThe responsibility for managing the footwear supply
chains rests with the shoe factories; however, their
roles in structuring the inbound and outbound supply
chains vary. The two prevailing business models are
vendor factories and contract manufacturers. Vendor
factories are locally incorporated production units of
foreign corporations. They are directly managed by
their overseas headquarters, which allocate orders to
factories according to capability, cost structure, and
capacity.
The contract manufacturers have stand-alone
factories that produce fi nished goods according to
specifi cations provided by the buyers.
They compete for production contracts and procure
most of the inputs. In addition to these factories,
there are domestic fi rms that provide complementary
services including dying, trimming and supplying
locally produced packaging material.
SuppliersMost of the leather and other raw materials used
to produce footwear are sourced from within the
region but very little is produced in Cambodia. For
vendor factories, sourcing of inputs is arranged by the
parent company, which takes advantage of its size to
obtain favorable treatment. In most cases, the parent
company has long-standing relationships with their
suppliers and many are from the same country as
the parent company, e.g. China, Thailand, Taiwan, and
Vietnam. The parent company often purchases the
inputs on FOB terms and arrange for their delivery to
the factory.
The contract manufacturers are at a disadvantage in
sourcing inputs because of their size. Their suppliers
are usually smaller and the prices are higher. Most
inputs are purchased CFR with the shipment
arranged by the supplier.
32 Improving Trade Competitiveness in Cambodia:
An Analysis Using a Trade and Transport Facilitation Assessment (TTFA)

Buyers and distributorsVendor factories sell their products to brand manufacturers, wholesalers and retail chains. The contract
manufacturers sell primarily to wholesalers and buying agents. The larger factories market their services
directly, while smaller manufactures often rely on the Footwear Order Center Cambodia (FOCC)16 to identifying
buyers and, in some cases, to manage product quality. Footwear exports are usually shipped on FOB/FCA
terms with the factory responsible for delivering the goods to the loading port or the warehouse of the buyer’s
nominated forwarder.
Span of controlThe vendor factory has minimal control over its inbound and outbound supply chains. The headquarters
manages everything from sourcing of inputs and managing contacts with buyers to product design, marketing,
and fi nance. The factory arranges the logistics for movement between the factory gate and the forwarder’s
warehouse or loading port. Interactions between factory and buyers are normally limited to an exchange of
samples. As a result, the factory has limited opportunities to increase the value of its fi nished goods. It will be
allocated the production of higher value goods once it has demonstrated its capability in terms of productivity
and quality control.
Contract manufacturers have a greater control over their supply chains. They are involved in not only sourcing
inputs but also developing basic designs, obtaining trade fi nance, and arranging the local logistics. However, the
marketing and branding of the products is done by the buyers so the manufacturers have no direct interaction
with the fi nal market or consumers.
ConcentrationAbout six of the shoe factories in Cambodia are large vendor factories that employ on average about 6,000
workers. They have a relatively high productivity, about 750 pairs per worker, due to investment in modern
equipment and are estimated to account for about half of the total domestic production of 50 million pairs per
year. The remaining factories are smaller, employing an average of 1,500 employees. These are estimated to
produce between 2,000 and 3,000 pairs per day or about 500 pairs per employee per year.
4.3 Supply chain performanceAll of the factories surveyed were vendor factories. Their supply chains are relatively simple. There are few
intermediaries other than the foreign owners and forwarders nominated by the buyers, as shown in Figure
15. The leather and fabric used for production is imported primarily from China, Taiwan and South Korea.
The factories purchase leather direct from tanneries though they frequently have problems with the quality.
Fabric is ordered from suppliers nominated by the buyers. The suppliers usually arrange the shipments.
These are on an FOB basis with weekly shipments in containers. The average time for delivery of the inputs is
30-45 days.
Payment is made at the time of delivery or 15-40 days thereafter. The cost of delivering the container from
the port to the factory is US$400-US$700 for a 20-foot container and US$600-$1,000 for a 40-foot container.
A similar cost is incurred for the movement of the footwear from the factory to the loading ports/airport.
Most inputs are imported duty-free with a value per container ranging from US$15,000 to US$55,000. The
trade documents that present the greatest problem are import permits and technical certifi cates which
normally require 3-5 days to obtain instead of one day.
The headquarters arranges the shipment of exports, which are shipped on a weekly basis. The principal
destinations are Japan and the EU. Nearly all the exports are shipped by sea in containers that are loaded at the
16 FOCC was established to provide support to all international footwear buyers and factories in Cambodia. It promotes
new orders from US, UK, EU and Japan.
33Improving Trade Competitiveness in Cambodia:
An Analysis Using a Trade and Transport Facilitation Assessment (TTFA)

factory. The movements are arranged by forwarders
or shipping lines. The smallest shipments are 1-2 TEU
per week with 3,000-5,000 pairs per TEU. A typical
shipment however is 3-15 TEU with a value between
US$110,000 and US$550,000. Airfreight is used for
less than 10 percent of the shipments.
The order cycle from when the initial order is
confi rmed to when the fi rst shipment is loaded onto
the vessel is 60-90 days for new orders, and 30 days
for repeat orders. Another 12 to 20 days is required
for the transport by sea to the importers warehouse.
The principal document required for the exports is
the certifi cate of origin, which requires 3-5 days to
obtain and is usually issued post shipment.17 Payment
is received within 7-30 days of shipment, either
ex-factory or when loaded on the vessel. Financing for
investment and working capital is the responsibility
of the headquarters. The principal fi nancial risks are
ForeignSuppliers
VendorFactory
ForeignHQ
ForeignHQ
NominatedForwarder
ForeignBuyers
ContractManufacturer
DomesticSuppliers
Figure 15: Footwear supply chain those associated with fl uctuations in demand, prices
and exchange rates.
The principal trade corridors used for exporting the
footwear link the factories with the loading ports. The
fi rms located in Manhattan SEZ near the Vietnamese
border use Cai Mep while those located in or around
Phnom Penh usually use Sihanoukville.
4.4 Opportunities and constraintsGrowth of the Cambodian footwear sector has been
dependent on foreign investments. Opportunities to
increase the average value per pair are limited because
larger vendor factories are managed overseas and
contract manufacturers lack the scale to develop
and promote their own designs. Cambodia’s duty-
free access to the EU has attracted foreign investors
from South Korea, Vietnam and other countries that
do not enjoy preferential treatment. However, this
advantage is fading as Cambodia’s competitors have
joined the WTO (China in 2001 and Vietnam in 2007)
and the EU has reduced its tariffs on footwear.
Cambodia, like its competitors, faces wage pressures
as the footwear sector is having diffi culties in recruiting
skilled craftsmen and qualified supervisors.
4.5 Objectives and strategiesFootwear exports account for less than 2 percent of
Gross Domestic Product (GDP) and this share has
changed little over the past decade. Nevertheless,
it generates signifi cant employment and has the
potential to grow rapidly in the future. The principal
benefi t to the economy from this expansion is the
generation of employment for the urban population.
At the same time, its growth will be challenged by
rising wages and competition from its neighbors. In
order to sustain its growth, it will have to increase
both the average value and value addition of its
footwear. This can be accomplished by improving
the quality of production and the proportion of local
inputs. Unlike garments, competition is less affected
by order cycle. At the same time, there are greater
opportunities for local design and procurement since
there is less diversity in fashion and in materials.
17 There is a problem with correcting mistake on a CO Application when joint inspection takes place. Informal fees are exorbitant. In order to accept a correction,
the CO can be applied post shipment.
34 Improving Trade Competitiveness in Cambodia:
An Analysis Using a Trade and Transport Facilitation Assessment (TTFA)
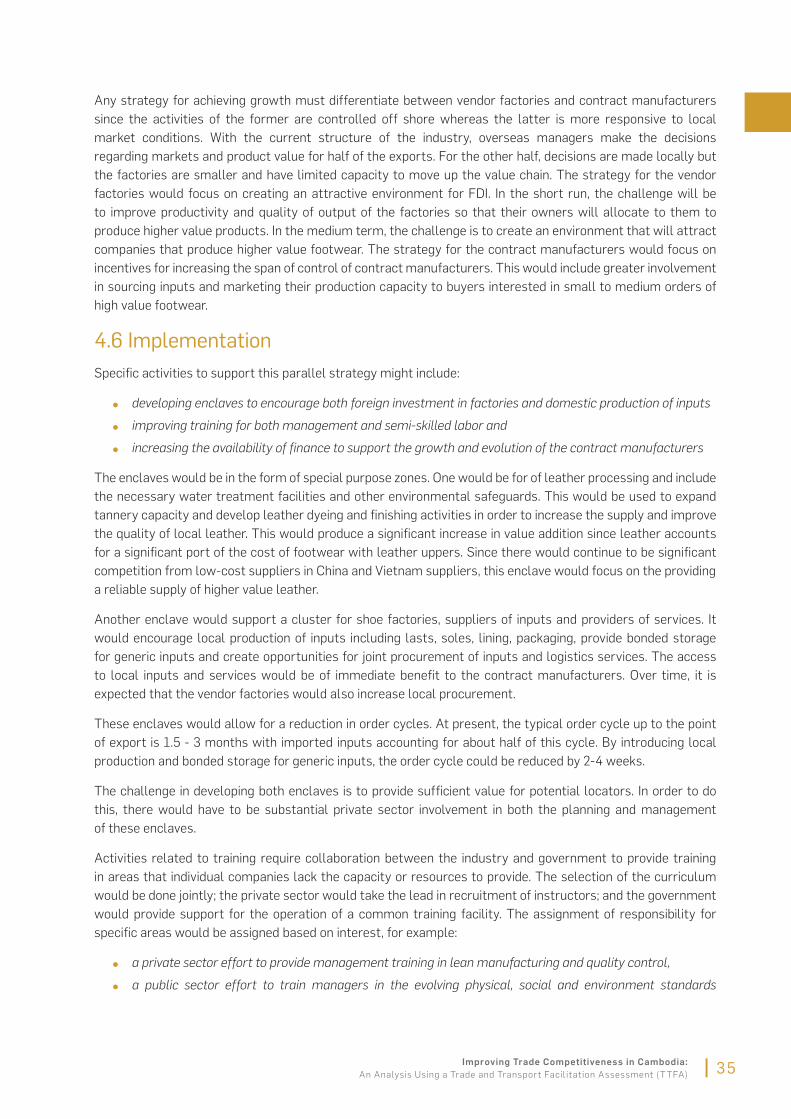
Any strategy for achieving growth must differentiate between vendor factories and contract manufacturers
since the activities of the former are controlled off shore whereas the latter is more responsive to local
market conditions. With the current structure of the industry, overseas managers make the decisions
regarding markets and product value for half of the exports. For the other half, decisions are made locally but
the factories are smaller and have limited capacity to move up the value chain. The strategy for the vendor
factories would focus on creating an attractive environment for FDI. In the short run, the challenge will be
to improve productivity and quality of output of the factories so that their owners will allocate to them to
produce higher value products. In the medium term, the challenge is to create an environment that will attract
companies that produce higher value footwear. The strategy for the contract manufacturers would focus on
incentives for increasing the span of control of contract manufacturers. This would include greater involvement
in sourcing inputs and marketing their production capacity to buyers interested in small to medium orders of
high value footwear.
4.6 ImplementationSpecifi c activities to support this parallel strategy might include:
developing enclaves to encourage both foreign investment in factories and domestic production of inputs
improving training for both management and semi-skilled labor and
increasing the availability of fi nance to support the growth and evolution of the contract manufacturers
The enclaves would be in the form of special purpose zones. One would be for of leather processing and include
the necessary water treatment facilities and other environmental safeguards. This would be used to expand
tannery capacity and develop leather dyeing and fi nishing activities in order to increase the supply and improve
the quality of local leather. This would produce a signifi cant increase in value addition since leather accounts
for a signifi cant port of the cost of footwear with leather uppers. Since there would continue to be signifi cant
competition from low-cost suppliers in China and Vietnam suppliers, this enclave would focus on the providing
a reliable supply of higher value leather.
Another enclave would support a cluster for shoe factories, suppliers of inputs and providers of services. It
would encourage local production of inputs including lasts, soles, lining, packaging, provide bonded storage
for generic inputs and create opportunities for joint procurement of inputs and logistics services. The access
to local inputs and services would be of immediate benefi t to the contract manufacturers. Over time, it is
expected that the vendor factories would also increase local procurement.
These enclaves would allow for a reduction in order cycles. At present, the typical order cycle up to the point
of export is 1.5 - 3 months with imported inputs accounting for about half of this cycle. By introducing local
production and bonded storage for generic inputs, the order cycle could be reduced by 2-4 weeks.
The challenge in developing both enclaves is to provide suffi cient value for potential locators. In order to do
this, there would have to be substantial private sector involvement in both the planning and management
of these enclaves.
Activities related to training require collaboration between the industry and government to provide training
in areas that individual companies lack the capacity or resources to provide. The selection of the curriculum
would be done jointly; the private sector would take the lead in recruitment of instructors; and the government
would provide support for the operation of a common training facility. The assignment of responsibility for
specifi c areas would be assigned based on interest, for example:
a private sector effort to provide management training in lean manufacturing and quality control,
a public sector effort to train managers in the evolving physical, social and environment standards
35Improving Trade Competitiveness in Cambodia:
An Analysis Using a Trade and Transport Facilitation Assessment (TTFA)

of importing countries, and
a public-private effort to teach new workers the skills of shoe making.
The target audience for the training would be the contract manufacturers since the vendor factories already
have their own training programs. However, if the training is successful it is expected that the vendor factories
would also make use of it in training their employees.
Improvements in trade fi nance are required so that the contract manufacturers can expand their activity
and extend the involvement in the inbound supply chain to include procurement of inputs and participation
in the design process. These changes require an increase the working capital requirements and extend
the cash-to-cash cycle. The goal is to provide fi nancing on terms comparable to that available to competing
fi rms, in this case the vendor factories. This would require a joint effort by government and the commercial
banks to reduce the risk premiums associated with lending to this sector. The expected increase in cash-to-
cash cycle would still be within tenor currently on offer.
In addition to these activities, the development of an effi cient corridor connecting to the new container terminals
downriver from Ho Chi Minh Port would reduce the order cycle and lower freight rates for both imported inputs
and exported products.
Recommendations
The foot wear sector in Cambodia has great potential for growth but RGC should encourage
the increased use of locally sourced inputs as well as greater value addition in Cambodia;
Government and the private sector should cooperate to develop footwear industry clusters to increase
volume, have access to a larger pool of labor and obtain the benefi ts from economies of scale from
co-location;
Develop the trade and transport corridor to Cai Mep in Vietnam, which has higher frequency of vessel
calls to key source markets for inputs and markets for exports.
Increase the availability of fi nance for contract manufacturers in particular, so they can increase quality
and capacity.
36 Improving Trade Competitiveness in Cambodia:
An Analysis Using a Trade and Transport Facilitation Assessment (TTFA)


5. Silk Trade
5.1 Trade and productionCambodia is located between the largest exporter of silk yarn, China, and one of the largest exporters of
traditional silk, Thailand. Its role in the global silk trade is therefore overshadowed by the larger suppliers in
the region. The Khmer silk sector generates signifi cant employment for households in rural areas, however.
At present there are about 20,000 weavers in Cambodia,
where the industry is structured around village-
level production using handlooms.
This silk industry has not developed a uniform supply
structure due to its diffuse, cottage-industry level
of development. The variety of product fl ows is
shown in Figure 16. Yarn is obtained from Vietnam for
production of silk fabric for export and domestic
market. Silk fabric is imported from China for domestic
consumption. Domestically produced yarn is used for
production of fabrics for export but accounts for only
about 2 percent of total yarn consumed.
The reliance on imported yarn is due to two factors.
First, the returns to farmers are too low to encourage
large-scale production of cocoons because the land
for growing the mulberry bush can also be used for
other crops that produce higher yields per hectare.
As a result, the farmers treat this as a marginal
enterprise even though it could provide non-seasonal
work. Second, Vietnam and China can produce yarn
at a lower cost.
Silk yarn from Vietnam is usually purchased through
informal channels because of the relatively small
volumes, the proximity of suppliers and its low cost.
The yarn is variable in quality and consistency,
affecting both its appearance and its ability to absorb
dyes. Because of this diffi culty, formal imports of
yarn through China are being considered by some
of the larger manufacturers.
Only a small portion of the domestic production of
silk products goods is exported. Gross revenues are
estimated to be around US$3.5 million based on the
data from Cambodia’s trading partners, as shown in
Figure 17.18 This amount is less than the cost of the
yarn imported from Vietnam or silk fabric imported
from China, which shows that most silk is absorbed
in the domestic market or sold in low volumes to
tourists.
The informality of the current arrangements for
importing yarn can lead to diffi culties in obtaining a
certifi cate of origin from the Ministry of Commerce
(MOC). This is not a major impediment at present since
these certifi cates are only required for shipments to
the EU or the US over €6,000.
DomesticMarket
TouristMarket
ForeignRetail
InternetSales
VillageWeaving
Vietnam Yarn
China Fabric
Village Yarn
FactoryWeaving
Figure 16: Material fl ow for silk trade
4.0
3.5
2.5
1.5
1.0
0.5
0.0
3.0
2.0
Mil
lio
n U
S$
2001 2002 2003 2004 2005 2006 2007 2009 20102008
Figure 17: Cambodia silk exports
Source: UNCOMTRADE mirror data
18 Accurate information is not available on these flows because much of the yarn is smuggled in from Vietnam, exports of silk fabric and garments move through
a variety of outlets including local retail and small shipments, and the production of silk fabric for domestic consumption is not reported.
38 Improving Trade Competitiveness in Cambodia:
An Analysis Using a Trade and Transport Facilitation Assessment (TTFA)

However, it could become a problem if there were growth in sales to foreign retailers. Formality of production
will, therefore, be necessary if silk is to be sold to foreign retailers in signifi cant quantities.
5.2 Potential growth in productionThe outlook for growth in production differs for the production of yarn and fi nished goods. In the last few years,
there has been a marginal increase in the number of breeders. The competition from other crops that produce
higher yields however, and the time and effort required to manage the larvae are expected to discourage
signifi cant increases over the current level of production. More importantly, the farmers cannot compete in
terms of cost with the Chinese producers of cocoons from bivoltine silkworms.19 The only area where the
farmers are competitive is the production of cocoons from polyvoltine hybrids of the traditional Golden silk
(Bombyx mori). This must be done locally primarily at the village level production since the yarn must be
hand-reeled.
There is more potential for growth in the production of silk fabrics using imported yarn since weaving does not
compete directly with other agricultural activities and yields higher returns than the production of cocoons.
Domestic demand for fabric is expected to increase as the population increases and disposable incomes
rise.20 Assuming a continued preference for locally woven fabric, domestic producers will be able to compete
with Chinese manufacturers even without access to large-scale silk production using power looms such as
exists in Chinese factories. Cambodia will also be able to compete in the export market since Cambodia’s silk
exports are marketed as handicrafts and thus require the use of handlooms.
The growth in exports depends on the ability to identify new markets and improve both the quality and availability
of fi nished products. Currently, the larger silk producers are constrained by demand while the smaller ones are
constrained in terms of cost and availability of high quality yarn. Until these constraints are overcome, the
sector will fail to attract the attention of business and commercial banks. The decentralized nature and size of
the industry also represents a constraint on higher investment.
5.3 Supply chainsThe silk supply chain includes a number of productive activities such as sericulture, processing, external sourcing
and marketing (Table 6). The fi rst three are conducted at the village level either by individuals or cooperatives.
These are concentrated in the northwest of Cambodia, where local yarn is weaved and incorporated in the fi nal
product. In the southeast, imported yarn predominates the weaving process.
Table 6: Activities in the silk industry
Activity Tasks Actor
Sericulture Mulberry cultivation, raising silkworms, cocoon production Farmer/breeder
Processing yarn Sorting, cooking, reeling, skeins/warping Artisan
Processing (wet) De-gumming, bleaching, dyeing, Warping Artisan
External Sourcing Import raw silk* Importer
Fabric Production Weaving Artisan
Finished Goods Cut, make, trim (CMT) Semi-skilled labor
MarketingDesigns Designer
Markets Entrepreneur
* Raw silk refers to untwisted and un-degummed silk thread that has been reeled to produce a continuous silk fi lament of great length
19 The rising labor costs in China and Vietnam are raising the price of imported yarn and fabric but both countries benefit from economies of scale in reeling, which
is the major labor cost in production of yarn from poly-voltine cocoons.20 By one estimate, 70 percent of fabric is used domestically for satisfying local demand, while the other 30 percent of fabric is used to meet demant by tourists
( Silk fabric being a typical khmer souvenir that tourists like to buy) and by cambodian expatriaste.
39Improving Trade Competitiveness in Cambodia:
An Analysis Using a Trade and Transport Facilitation Assessment (TTFA)

The principal participants in the silk supply chain
are importers and suppliers of silk yarn, weavers,
intermediaries (both pre- and post-weaving),
organizations that coordinate the production, fi rms
that produce fi nished goods, local retailers and local
buyers for export markets.
The production of fi nished goods, other than simple
products, is done at factories located around Phnom
Penh. The factories are owned by exporters, who
also take responsibility for design and marketing.
The challenge for these manufacturers is to produce
designs that highlight the uniqueness of the Golden
Khmer silk yarn while at the same time offering
styles that appeal to foreign buyers. Marketing
is also challenging because Cambodia produces
insuffi cient volume to be of interest to large foreign
retailers and distributor, nor does it have brand or
market recognition to compete as a boutique product
internationally. The cost of supplying individual
retail outlets and the lack of large distributors for silk
products poses an additional challenge.
The process for importing yarn to Cambodian
wholesalers is as follows: a collector based in
Vietnam aggregates the yarn. A trader receives an
order from a Cambodian wholesaler, purchases the
yarn and ships it informally across the border to the
wholesaler in Cambodia who stores the yarn and sells
it to the weaving factory. The Cambodian domestic
market is dominated by four wholesalers located in
Phnom Penh.
Once in Cambodia, the weaving of the yarn creates
added value to the fi nal product. Weaving operations
vary in size. Individual households sell their output
through the traditional village marketing system.
The supply chain is highly fragmented with different
participants performing individual activities, as shown
in Figure 18. The exchange of intermediate goods
between the participants is managed by traders or
middlemen. In many villages, cooperatives or NGOs
have integrated these activities and eliminated
intermediaries. However, a provincial trader is often
involved in distribution of fi nished goods to domestic
retail outlets.
Cit
y
Vil
lag
eg
Wholesaler
Reeler
Factory
Cottage
Reeler
Trader
Trader
Cottage
Dyer
HandloomDyleng
WeavingFactory
Wholesaler
Weaver
ProvincialTrader
Ganrment
Factory
Middleman
InternetSales
BoutiqueRetail
TouristFacilities
DomesticRetail
ForeignYarn
Supplier
Silkworm
Breeder
Figure 18: Silk supply chain
Small weaving enterprises sell their output through
the commercial village marketing system to
medium-sized factories in the urban marketing
system. They purchase raw silk from suppliers
on credit and often resell the woven fabric to
wholesalers/traders on a cash basis.
There are also larger reeling and weaving factories
located in urban areas that use modern equipment.
They subcontract farmers groups and provide inputs
to farmers on credit, including imported species
silkworm eggs and materials necessary for their care.
The farmers are then required to sell their cocoons
back to the company as raw material. There are a few
of these located around Phnom Penh.
40 Improving Trade Competitiveness in Cambodia:
An Analysis Using a Trade and Transport Facilitation Assessment (TTFA)

Efforts by the government to promote the silk industry have focused on local production but lefts the marketing
aspects to agents. In contrast, the larger private companies integrate production and marketing.
The fi nished products that are exported include plain silk fabric, scarves, handbags and cushions. The most
common destinations are the US, EU (mainly France, Italy, Germany, and Switzerland), Singapore, and Australia.
Distribution channels include local retail, internet sales and exports to individual retailers. The domestic retail
is a mix of higher value goods sold through hotels and local boutiques and lower value goods produced for the
domestic market but purchased by tourists. Internet sales are business-2- consumer (B2C) with products sent
directly to the consumer.
The various markets for Cambodian silk products are summarized in Table 7.
Table 7: Markets for fi nished products
Market
Local Khmer
“Low-end” tourist (incl. expats)
“High-end” tourist (incl. expats)
Sophisticated export
Type of yarn
Almost 100 percent made from imported yarn, the cost
of the yellow yarn is higher for a less usable quality
(in the eyes of weavers)
Mostly imported silk from Thailand and Vietnam and
some mixed with synthetic yarn – Golden Khmer silk
yarn is too expensive for this market.
A limited number of Golden Khmer silk yarn products
available, the rest made from imported white silk yarn
(in a few hotel shops as well as some high street shops)
A limited number of Golden Khmer silk yarn products
Source: Cambodian Sericulture Stock Taking Report
5.4 Business modelsThe business models used in Cambodia can be differentiated by their sourcing of silk yarn and by the extent of
integration of their supply chains. The fi rst model is the village weaver that produces fabric exclusively from
local yarn. The second is the handicraft manufacturer that produces fi nished products using fabric produced
in the village from a mix of local and imported yarn. The third model is the commercial manufacturer that
produces fi nished products from fabric produced by weaving factories that use imported yarn but may also
incorporate yarn from village manufacturers.
Organizing principalThe manufacturers of the fi nished products organize the outbound supply chains. For products made from
local yarn, cooperatives or NGOs purchase yarn from local weavers, produce small volumes of handicrafts and
sell these direct to retailers and fi nal customers for sale. In the traditional arrangement, traders would have
performed this function but they are not able to provide the scale or management skills (quality control and
designs) required to produce goods for export. For products made from imported yarn, the fi rms manage the
manufacturing and sale of garments, accessories or household furnishings.
41Improving Trade Competitiveness in Cambodia:
An Analysis Using a Trade and Transport Facilitation Assessment (TTFA)

Span of controlThe span of control of the organizing principal varies. Village level organizations are more likely to
involve themselves in controlling the quality and quantity of inputs provided by the breeders, reelers, and
dyers. The larger commercial manufacturers buy their imported inputs through local wholesalers and
their domestic inputs through local traders. The organizing principal has more control over the outbound
supply chain since most of the sales are made directly to local retailers or to foreign customer via direct
distribution channels such as the Internet.
5.5 Supply chain performanceThe producers surveyed produce silk garments from a combination of local or imported yarn and dyes. The
fi nished goods are sold through local outlets and also shipped directly to Europe, North America and East Asia.
Imported yarn costs about US$50 per kilogram. It is purchased from local wholesalers who deliver the yarn
within a few days and are paid in cash. Locally produced yarn is purchased directly from the producers.
The delivery time, which includes dyeing the yarn, is up to 15 days. Payment is on a cash basis paid at time
of delivery.
For exports, the fi rms use a mix of sea and air shipments, the duration of transit and associated costs
vary according to the method of delivery. Some fi rms ship by sea as Less than Container Load (LCL)
cargo and by airfreight (60-70 percent by ocean, 30-40 percent by air). Others rely on courier services
(e.g. DHL, UPS, TNT). The order cycle from confi rmation of order to delivery to the destination port/
airport is as little as 1-2 weeks for air shipments and as much as 3 months for shipments by sea.
Typical shipments are relatively small with about 100-700 pieces with anaverage value of the US$2,000-
US$10,000, but orders can be as small as US$400 and as large as US$30,000.
Payments for exported silk products vary according to the sales channel. Exports are sold on an FOB
basis to wholesalers and retailers but on a CFR basis through Internet sales. For FOB shipments,
a 30-50 percent advance is paid at the time of order confi rmation and the rest is paid at the time of
shipment or one week thereafter. For CFR shipments, payment is made at the time the order is confi rmed
or when the goods are shipped. As a result the cash-to-cash cycle is only about 2 weeks. The producers rely
on their own funds for working capital.
5.6 Objectives and strategiesThe government’s main objective for the silk sector may be to increase employment for the rural poor and
older family members. The silk industry represents a very small share of the country’s economic
activity and trade, and currently lacks the inputs, scale and organization to be a major contributor to the
domestic economy or Cambodia’s export mix. However, as a small-scale, village-based activity, it
provides a signifi cant level of rural employment especially for women or the infi rm. An appropriate
strategy for increasing the volume of production at the village level may therefore be welfare-enhancing for
local communities.
The RGC’s policy options for expanding this industry may be most easily targeted at introducing modern
management of productive technology, perhaps through the introduction of cooperatives in each province
that can form a management structure and provide a framework through which to target reforms in
the industry. The production of silk products for export continues to be a handicraft industry based on
village- level craftsmen, which hampers the aggregation of the sector into more effi cient economies
of scale. While production can expand or contract to meet demand, it is not possible to introduce modern
management or production technology within the limits of the current industry structure. Handlooms
allow the industry to fi ll small orders with short delivery schedules but the outdated equipment
makes it diffi cult to control costs and quality. If the industry is to grow but continue to generate rural
employment, then a new mechanism must be developed for organizing this activity.
42 Improving Trade Competitiveness in Cambodia:
An Analysis Using a Trade and Transport Facilitation Assessment (TTFA)

Cambodia faces signifi cant competition from China for manufactured silk products and from Thailand in
traditional hand-woven products. This competition extends to Cambodia’s domestic market. Since Cambodia
lacks the scale to compete, it must currently focus on niche markets. The current mix of fi nal products—
primarily scarves, simple accessories and home furnishings—offer little in the way of style. Instead, they are
marketed based on the quality of the fabric and the cachet of being produced in Cambodia using traditional
means. The high-end products use “Golden Khmer silk yarn” but the supply relies on small weaving operations
creating problems with the reliability and consistency of the yarn.
A diversifi ed set of distribution channels is used including local sales to tourists, internet sales and supply
contracts with boutique outlets. Any further diversifi cation would require a signifi cant increase in scale. In
order to grow the Cambodian silk industry in the long run, it will necessary to develop new products
supported by new distribution channels. These need to be high-value products since Cambodia cannot
compete on cost or scale. One possibility is to refocus on the production of fabric and expand village level
production and emphasize color and quality through the formation of cooperatives and solid training for
local people toward quality and effi ciency.
5.7 ImplementationEfforts to expand production and develop new distribution channels will require cooperation between
the public and private sector. In order to make the transition from manufacturing handicrafts to
supplying fashion accessories, it will be necessary to increase scale of production. This can be achieved
through consolidation of production based on cooperatives, mergers, or marketing arrangements. Because
of the signifi cant level of involvement of NGOs in exporting silk products, this effort would require
collaboration from government and the private sector.
The consolidation of production would be complemented by adjustments to the inbound and outbound
supply chains. By increasing the size of orders for yarn, dyes and other inputs, the industry can develop a
direct relationship with suppliers and customize their orders. By consolidating the distribution of their
products, they can accept larger orders and reduce distribution costs. Individual producers can develop joint
marketing effort with individual brands treated as separate product lines. There are also opportunities for
reducing costs within the supply chain especially through tighter integration of the inbound supply chains
and consolidation of shipments on the outbound supply chains.
The main focus should be on increasing the value of the fabric itself, however. Since silk fabric is a
standard product, this requires differentiation in the quality of weaving, dyeing and product design. One
option is to open a second line of business that focuses on producing higher quality fabric. This would
be sold to high-end producers of fashion accessories and household furni-shings. This would take advantage
of the fl exibility of the village based system but introduce improved quality control. It would transfer
responsibility for design and marketing to those more familiar with the market (but not preclude
manufacture of fi nished products or the development of in-house designs). An example of this
strategy is presented in the box below.
A useful example of this was the pioneering efforts of the Jim Thompson Thai silk company
which was formed shortly after World War II to revive the Thai silk industry. It expanded its
business by building a relationship with the cottage industry in the village of Ban Krua and
encouraged them to use better looms and dyes. Because of its texture, the silk was more suited
to home furnishings and Thompson emphasized the bright colors and integrating the fabric
into contemporary design. He provided access to overseas markets through contacts with
high-end retailers in the US and through retail outlets in Bangkok. Over the decades the company
has evolved its product line from fabrics to garments and accessories and home furnishings and
now collaborates with international designers in furniture design.
43Improving Trade Competitiveness in Cambodia:
An Analysis Using a Trade and Transport Facilitation Assessment (TTFA)

The government can develop a more effi cient connection between Vietnamese suppliers of yarn and
domestic buyers by simplifying border-crossing procedures. This would encourage the buyers to formalize
their imports and, in the process, cut out various intermediaries. The weaving factories could import yarn
directly from producers and establish a relationship to ensure consistency and quality of the yarn.
The government can work with the private sector to encourage a joint purchasing effort. It can support
marketing of the industry to complement private sector efforts to market their product lines. Finally it can
coordinate with the private sector to develop and enforce standards for a Cambodian Silk Quality Assurance
Label and to provide training to factories on Standards, Metrology, Testing, and Quality (SMTQ).
Recommendations
RGC can implement policies to encourage the formation of coope-ratives in order to increase the
scale of production and rationalize the supply of yarn
Encourage the production of higher quality fabric through cooperatives or marketing associations
(still using the village-based approach emulating the Jim Thompson model.)
Use the cooperative structure tomake formal business relationships with Vietnamese suppliers in
order to establish a regular supply chain and bargain for better input prices.
RGC can initiate a joint purchasing effort on behalf of the cooperatives or marketing associations
RGC can work with appropriate agencies (such as the Institute of Standards Cambodia) to develop
and enforce relevant standards to promote exports.
The company currently operates factories where weaving, printing, design and tailoring are
performed. It promotes sericulture by raising and selling bivoltine silkworms in the factory
and working continues to work with village breeders under a subcontracting system.
44 Improving Trade Competitiveness in Cambodia:
An Analysis Using a Trade and Transport Facilitation Assessment (TTFA)


6. Logistics
6.1 Trade fi nanceThe majority of demand for trade fi nance is to provide working capital to increase the size orders that exporters
can accept. This is especially important for exports of agriculture products such as rice, rubber, cassava, maize,
and cashew nuts. Trade fi nance has been less important for imports of inputs to the production of exported
products. Instead the focus has been on orders for petroleum products, construction materials, car, agricultural
equipment, pharmaceutical products, and fast moving consumption goods.
The annual value of the various forms of trade fi nance is estimated to be in excess of US$100 million, which is
a relatively small percentage of the banks’ total portfolio. Import fi nancing is primarily in the form of L/C with
more than US$200 million issued per year.
Available instrumentsThe major banks vary in the trade fi nance products they offer. Some focus on L/C but others provide a broader
range of services including guarantees (advance, payment, retention, shipping) and documentary collections.
Most banks offer discounting and pre-shipment fi nancing for exports. Domestic L/C are for exports that require
domestic inputs are available, but there is little demand to date. A few banks offer trust receipts for import
transactions.
L/C for imports are issued in amounts up to several million US dollars for periods of 1-3 months although
longer periods can be arranged. The fee charged for L/C varies from 0.10-0.15 percent per month plus an
issuing fee. The collateral required may be as much as 100 percent of face value. The terms of the L/C do not
require that the bill of lading be issued in the name of the issuing bank but this is preferred.
The most common method of payment for both imports and exports is TT followed by a sight draft. Time drafts
are less common.
LoansCommercial banks offer loans for working capital in the form of overdrafts with a defi ned credit line. The
maximum tenor is 180 days to one year. The loans are backed by collateral and the balance sheet. Where
there is a clean fi nancial statement and other indicators of fi nancial soundness, loans may be issued without
collateral. Banks prefer lending to exporters for specifi c contracts rather than for general working capital.
For exports arranged through L/C, banks will discount the face value of the L/C up to 70-80 percent. However,
50-60 percent is more common. The annual interest rate is about 12 percent and processing fees are relatively
small although in some cases additional collateral is required. Some banks only provide post-shipment
discounting.
The interest rate in Cambodia is high compared with the interest rates in Hong Kong or Singapore. Therefore
Cambodian traders often use offshore fi nance arranged through their foreign buyers/traders. Foreign owned
fi rms arrange offshore fi nance through their parent companies. This is particularly common in the garment
industry. Other sources of trade fi nance, e.g. credit from foreign suppliers and buyers, or supply chain
intermediaries, are not signifi cant.
It is unclear to what extent high interest rates and collateral requirements depress demand for trade fi nance,
but the expectation is that the volume of trade fi nance will grow and a broader range of services will be offered
in the future. Possible changes in trade fi nance as a result of new regulations might include international rules
on the issue of L/C and the establishment of a credit bureau for sharing credit information.
46 Improving Trade Competitiveness in Cambodia:
An Analysis Using a Trade and Transport Facilitation Assessment (TTFA)

Foreign exchangeThe exchange rate regime in Cambodia includes offi cial and parallel exchange rates. The offi cial rate is
determined by the National Bank of Cambodia (NBC) for transactions between the NBC, government and the
public sector. The parallel rate is a freely fl oating rate used for all the private sector transactions.
All exporters and importers of goods and services need to make payments for their commercial transactions
through banks permanently established (domiciled) in the Kingdom of Cambodia. For exports, the proceeds
need to be credited to the exporters account with the domiciled bank.
The only restrictions on foreign exchange operations such as purchases and sales on foreign exchange
markets, all types of international settlements, and capital fl ows in foreign or domestic currency is that these
operations be undertaken through domiciled banks. As a result, banks are able to offer foreign exchange
transactions including spot, swap, forwards and options, however, so far demand has been limited.
Clearing and forwarding servicesThe logistics industry in Cambodia is relatively large given the size of the country. The Cambodian Freight
Forwarding Association, CAMFFA, has more than 200 members and is a well-organized union. The industry is
composed of many small fi rms, fewer medium sized fi rms and some large, international players. Most of the
medium-sized companies are part of international forwarding companies or networks.
For clearing and forwarding (C&F) agents, imports make up the largest share of their business, refl ecting
the trade imbalance of the country. Nevertheless, C&F companies also handle exports, mainly rice and
garments, as well as some admissions.
The C&F fi rms provide both domestic and international forwarding and may act as NVOCCs (non-vessel
operating common carriers). Almost all offer transport, consolidation, storage, packaging and labeling.
The larger fi rms provide inventory management and bonded storage. The more sophisticated companies,
mainly large international operators, perform assembly and customization, manage cold chains and provide
testing and quality controls.
The large, international forwarders compete primarily on quality of service. They operate in a different market
segment from the smaller service providers, which offer basic services and compete on price. The foreign
forwarders serve predominantly foreign suppliers, wholesalers/distributors and retailers. They serve a range
of clients including small and large volume shippers.
The foreign buyers have the dominant role in structuring export supply chains for FOB shipments. The
international forwarders often have service contracts with their larger clients giving them authority to
manage all logistics. Among the interviewed fi rms, all freight forwarders provide door-to-door service.
The dominant destinations are North America and Europe, followed by East Asia.
Major clients are producers of consumer goods (~60 percent) as well as fi rms from the construction sector
(~15 percent). Construction material is in most cases project cargo. Most of the contracts are for specifi c time-
periods with a fi xed unit price for shipping.
For outbound shipments, the forwarders issue bills of lading, combined bills of lading and multimodal transport
document. Some of the documents conform to the standard International Federation of Freight Forwarders
Associations (FIATA) format. The C&F fi rms use computer systems for all kinds of business operations,
including coordination of transport services, processing cargo/shipping information, coordination with the
consignees and communicating with banks.
All interviewed fi rms mentioned licenses and regulations as key impediments to expanding their services.
There were also problems with the reliability of trucking services as well as restrictions on what services they
are allowed to provide.
47Improving Trade Competitiveness in Cambodia:
An Analysis Using a Trade and Transport Facilitation Assessment (TTFA)

ClearingThe larger fi rms are more involved in clearing manufactured goods while the smaller fi rms cleared mostly
agricultural products. Large fi rms clear between 200-300 shipments per months while smaller fi rms clear as
little as one shipment a week.
The information for clearing cargo is entered into the system at the customs offi ce by the customs offi cer or
the broker. Delays in the clearing process are caused primarily by missing supporting documents or errors in
evaluation.
Imports are cleared either at the point of entry, an Inland Container Depot (ICD) or an inland customs facility.
The fees charged for clearing cargo vary with some brokers charging by declaration and others by the
quantity of goods cleared. There are signifi cant differences in the fees charged. Large international fi rms
have signifi cantly higher fees than their competitors. However, the absolute amount of informal fees seems
to be the same for all fi rms.
The time to obtain an import license or a certifi cate of origin varies depending on the issuing agency, the fi rm
and the commodity (manufactured or agricultural products). For example, a large international forwarder is
able to obtain these documents within one day for manufactured products, but it can take up to 10 days for
smaller fi rms. For agricultural exports it takes 3.5 days.
The time to clear exports depends on the gateway. The fastest clearance time is 2-6 hours at the airports. At
the land borders, cargo is cleared in 2-12 hours. At seaports the time is ½ - 2 days while at ICDs it is ½ - 1day.
According to the fi rms interviewed, it is often not clear what the exact document requirements are or what the
rates for duties and taxes will be. Further, there is a problem with discretionary behavior of offi cials, informal
payments and irregular enforcement of laws.
While computer systems are widely used in the industry, Electronic Data Interchange (EDI) is rarely used
for communication with clients or service provider.
International freight ratesThe freight rates on the international routes fl uctuate with global demand. They dropped dramatically in
2009 as a result of the global fi nancial crisis. They have since recovered but are still below the 2008 rates.
Examples of current rates for typical shipments from Cambodia to typical destinations are shown in Table 8.
These incorporate the basic discounts but not the deeper discounts available to large foreign importers. The
rates are also for basic level of service. These will increase for shipping lines offering faster or more reliable
services and decrease for those offering slower, less reliable services.
Table 8: Typical sea and air freight rates from Cambodia
Mode Direction Gateway Unit Currency Current Range 12 months ago
Ocean
To Rotterdam/Antwerp FEU US$ 1,800.00 2,500.00
from FEU US$ 900.00
To US east coast TEU US$ 3,800.00 3,600.00
To Yokohama FEU US$ 1,000.00 1,000.00
From Shanghai FEU US$ 1,000.00 1,000.00
Air To New York Kg US$ 4.00 4.60
To Frankfurt Kg US$ 3.00 3.00
From Taipei Kg US$ 1.50 1.50
To Singapore Kg US$ 0.85 0.85
From Singapore Kg US$ 1.20 1.00
Source: Trade and Transport Facilitation Assessment Survey
48 Improving Trade Competitiveness in Cambodia:
An Analysis Using a Trade and Transport Facilitation Assessment (TTFA)

6.2 Road transportWhile Cambodia has an extensive inland water network and a backbone rail line, road transport is the
dominant mode of freight transport. The railway consist of 640 km of single track meter gauge lines linking
Phnom Penh to Sihanoukville and to a terminus about 50 km from Poipet. The railway is used to transport
to the port but otherwise has a small share in the freight market. A concession to develop the rail system
was signed will Toll Railways in 2009 and should eventually generate a signifi cant increase of rail freight
despite the short travel distances. River transport is growing in importance with containers and bulk
cargoes moving by barge from the area around Phnom Penh down the Mekong to Cai Mep and the terminals
near Ho Chi Minh Port. These include schedule feeder services provide by some of the largest international
container shipping lines. The development of new terminals to serve both routes is indicative of the growing
interest in this mode. The trucking sector has been growing with the increasing trade in recent years and
is expected to continue its growth path.
It is estimated that about 340,000 TEUs entered Cambodia in 2010 of which about 86 percent was transported
on trucks (around 290,000 TEU) and the remainder on inland waterways (Figure 19). The large imbalance
with imports overweighing exports results in a large percentage of empty containers moving outbound, which
increases the cost of transporting the loaded containers.21
Cambodia’s trucking fl eet is estimated to include 1,500 heavy trucks. There are fi ve large trucking companies
with more than 100 trucks and a few more in the range of 60-100 vehicles. The majority of fi rms, however, are
small operators with 5-40 trucks. The Cambodian Trucking Association (CAMTA), has 15 members with a total
of 800 large trucks, the majority of which are semi-trailers. The trucking companies do not hire independent
operators to meet peak demands but instead rely on informal networks with other trucking companies
providing additional capacity. During the dry season, demand for transport increases between 30-50 percent.
Almost all trucks in Cambodia are second-hand imports from South Korea, Japan, Taiwan and the US. The
average age at time of imports is between 5-7 years. The present average age is about 15 years. Most companies
Cambodia’s Containerized Trade
Port of
entry/exit
Mode of
overland
transport
River
14%
Road
86%
Road
86%
340,310 teu
Phnom Penh
port
47,507 teu
Sihanoukville
port
258,775 teu
Road border
posts
34,31 teu
Figure 19: Cambodia’s containerized trade
Source: World Bank, Cambodia Corridor Assessment Study, 2011
21 This problem is exacerbated by the problem of matching demands for 20- and 40-foot containers, for containers controlled by different lines and the limited
time shipping lines allow for boxes to be returned to the port.
49Improving Trade Competitiveness in Cambodia:
An Analysis Using a Trade and Transport Facilitation Assessment (TTFA)

rely on their own funds to purchase trucks. Because of the age of the trucks most of the operating costs are
for labor, fuel consumption and maintenance accounting together for around 80 percent of all operating costs.
While this allows the local trucks to compete effectively for short haul movements within Cambodia, it places
them at a competitive disadvantage for transport goods to the ports in Vietnam and Thailand.
The principal cargos carried by the larger trucking companies are construction material, other project cargo,
imports/exports especially for the garment and footwear industry, and bagged rice in containers. Trucks
typically make only 5-6 lost distance trips per month, giving an annual mileage of less than 40,000km. They
have a low load factor due to of the lack of return loads. Some fi rms have their trucks wait at the destination
to try and obtain a return load. The return cargo is usually located through agents employed by the company
in e.g. Sihanoukville.
It is estimated that between 5-15 percent of trucks are overloaded with some trucks extending the chassis in
order to carry more. The use of strengthened twenty-foot containers which can carry over 20 tons of imports
are contributing to this problem. The average percentage of damaged or lost goods is around 3 percent. Most
of this occurs because of accidents or during cargo handling.
Competition from foreign truck operators is limited. Thai trucks can cross the border but are restricted to
operating within 30 km of the border. The number of Vietnamese trucks crossing the border carrying freight to/
from the Vietnamese ports is increasing but they often must return empty since they cannot carry local cargo.
The trucking market is divided in two segments. The fi rst provide basic movements on a shipment-by- shipment
basis with competition based on price. This market is dominated by local companies. The second offers a more
complete service including consolidation warehousing, and clearance with the emphasis on quality of service,
Recently some large foreign operators, mainly from Japan, have entered this market offering their services
primarily to foreign companies.
The larger companies engage in contract haulage with time-based contracts. They use IT systems to manage
their fl eet and are increasing their use of GPS systems. The smaller family-run companies provide haulage
on a shipment-to-shipment basis with few long-term contracts. They operate on a limited number of routes
such as Phnom Penh-Sihanoukville. The use of computer systems is very low and the company’s management
capacity depends solely on the ability of the owner.
The terms of payment for trucking services varies from payment at the time service is provided to payment
from 10 days to a maximum of 3 months after the service is provided. Normally, it takes 5 to 30 days to collect
payments.
6.3 Clusters and corridors
CorridorsThe trade corridors serving Cambodia have had a signifi cant impact on trade. They have improved access to
the port at Sihanoukville but also provided access to the more effi cient ports in Vietnam thereby reducing
the time and cost for international shipment. They have fostered regional trade by expediting both formal and
informal trade with Vietnam and Thailand. The four major trade corridors are:
1. Western Cambodia-Poipet-Bangkok
2. Central/Eastern Cambodia-Bavet-H o Chi Minh Port
3. Phnom Penh-Sihanoukville
4. Central Cambodia- Mekong-Ho Chi Minh Port to Cai Mep
The fi rst two are land routes. The last two are multimodal and include water routes that use barges
carrying both containers and general cargo. The fi rst three are shown in Figure 19 and the fourth in Figure
50 Improving Trade Competitiveness in Cambodia:
An Analysis Using a Trade and Transport Facilitation Assessment (TTFA)

Table 9: Routes to the South China Sea
Deadweight tons (DWT)
Sections River Km Low Water Hight Water
Phnom Penh - Vam Nao Pass Mekong 154 3,000-4,000 5,000
Vam Nao Pass - South China Sea Mekong 194 3,000-4,000 3,000-4,000
Bassac 198 5,000 5,000
Figure 20: Corridors for Poipet and Bavet
20. The physical characteristics of these routes are described in Table 9. For the water routes, the transit
time is 2 to 3 days for Sihanoukville including the time for loading and unloading and 4 to 5 days for Cai
Mep. A typical container barge is shown in Figure 20. It has a capacity of 144 TEU, length of 78 meters and
draft of 4.8 meters.
The most important corridors are those providing connections to the Vietnam deepwater facilities (No’s 2 and 4).
For agricultural goods these provide access to larger general cargo vessels. For containers they provide access
to direct calls by vessels operating on the global corridor to the US and to Europe. Both offer savings in freight
rates because of the larger traffi c volumes at the Vietnamese ports. The only constraint is the procedures for
border crossing and movement of goods in transit. Efforts to facilitate trade on these routes are being pursued
at both the regional and bilateral level but more needs to be done to insure uninterrupted movement. The
performance of these corridors is improving as the shipping lines become involved in providing feeder services
to the ports. Additional improvements in performance should be prioritized based on the impact on the cost and
time for movement over the entire length of the corridor.
51Improving Trade Competitiveness in Cambodia:
An Analysis Using a Trade and Transport Facilitation Assessment (TTFA)

Figure 21: Delta route to Ho Chi Minh
Figure 22: Delta container barge
ClustersMost of Cambodia’s manufacturing is clustered around Phnom Penh while its agricultural production is
clustered near the borders with Vietnam and Thailand. Although Cambodia has an extensive collection of SEZs
(Figure 21), there are few industrial clusters that provide economies of scale or support a network of suppliers.
Only four of the zones have signifi cant levels of activity and even these have occupancies of 20 percent or less.
Also there is little specialization. Two of the zones, Manhattanville Svay Reing and Tia Seng Bavet, have a large
number of garment factories and one, Sihanoukville, has a signifi cant number of factories producing leather
goods (Table 10). However, all have a random collection of enterprises.
Manhattanville and Tia Seng are located on the Vietnam border and serve as transfer points for goods moving
through the port facilities near Ho Chi Minh. However, they do not provide signifi cant logistics services. The only
logistics hub is along the Mekong near Phnom Penh but it is more a collection of cargo-handling facilities than
a hub offering broad storage, transport and trade facilitation services.
52 Improving Trade Competitiveness in Cambodia:
An Analysis Using a Trade and Transport Facilitation Assessment (TTFA)

It is likely that there will be some agglomeration of garment and footwear industries as the larger zones increase
in size. It is also expected that the Phnom Penh logistics hub will grow in terms of capacity and variety of services.
Efforts to improve the existing clusters develop additional clusters should focus on increasing competitiveness
by providing effi cient connections to the trade routes and encouraging development of domestic suppliers to
serve the factories located with these clusters. This requires better coordination between government and the
private sector in planning the development of the clusters. The development of new zones should be based
on a value proposition that emphasizes effi cient logistics rather than taxes and other fi nancial incentives.
Table 10: Enterprises in three successful SEZs
Sihanoukville SEZ 2 Phnom Penh SEZ
No. of Investors – 18
4 Shoes, bags, leather products
3 Garments
Vehicle assembling Bicycles assembling House
ware products Household appliances Plastics
Floor and plywood
Others
Manhattan Svay Reing SEZ
No. of Investors - 18
5 Garment and textile
3 Packaging products
2 Footwear Neoprene wet suits Packaging bag
Plastic
Bicycle
Bolt-Nut
Hi-tech equipment recycling
Hospital
Mattress products
Others
No. of Investors - 37
4 Plastic
3 Food Processing
3 Wiring Harness
3 Footwear and leather products
2 Carton box and paper processing
2 Japanese traditional clothes
Garment
Shoulder Pads
Baby goods and toy
Labels
Packaging materials Electrical equipment Small-size
motor
Motorcycle assembly, accessories and spare parts
Steel processing for construction
Others
Tai Seng Bavet SEZ
No. of Investors – 11
4 Garment
3 Bicycle
3 Footwear, Gloves
Shoulder Pads
Others
Source: Trade and Transport Facilitation Assessment Survey
53Improving Trade Competitiveness in Cambodia:
An Analysis Using a Trade and Transport Facilitation Assessment (TTFA)

Figure 23: Developed SEZs in Cambodia
54 Improving Trade Competitiveness in Cambodia:
An Analysis Using a Trade and Transport Facilitation Assessment (TTFA)

ANNEX I:
RICE

Annex I: Rice
Global tradeThe global trade has grown steadily over the last two decades as shown in Figure 1. Of global production, trade
accounts for only about 7.2 percent. India and China produce about half of total output, but generate only about
11 percent of total exports. In contrast Vietnam and Thailand account for half of total exports but only 16
percent of global production. Five countries account for over 4/5 of total exports as shown in Table 1. Of these,
India’s value per kg is highest since most of its exports are Basmati rice. Thailand has the second highest value
per kilogram because of its various branded products, including fragrant rice, and the quality of the milling.
Vietnam has the lowest value since most of its export is generic, white rice.
35
30
25
20
15
10
5
0
Mil
lio
n t
on
s
20011999
2003
20052007
20092011
1989
19911993
19951997
Figure 1: : Global rice trade 1989-2011 (million tons)
Annex Table 1: Leading rice exporters (by volume, value and market share)
Volume (million tons) Value per ton (US$) Market Share (%)
Million tons 2008 2009 2010 2008 2009 2010 2008 2009 2010
Thailand 10.01 8.57 9.05 610 589 590 33.7 29.4 29.0
Vietnam 4.65 5.95 6.73 623 448 444 15.7 20.4 21.6
India 3.54 2.15 2.51 804 1,115 916 11.9 7.4 8.0
Pakistan 3.05 3.19 4.00 800 557 569 10.3 10.9 12.8
United State 3.22 2.99 4.50 688 731 523 10.8 10.3 14.5
Uruguay 0.74 0.93 0.80 598 498 491 2.5 3.2 2.6
China 0.97 0.78 0.62 497 668 672 3.3 2.7 2.0
World Total 29.69 29.15 31.15 713 638 615
Source: “Vietnam’s Rice Balance: Recent Trends, Future Projections, and Implications for Policy”
Vietnam Food Security and Value Chain, Policy Note #1, May 2011.
Source: USDA Economics, Statistics and Market Information System.
56 Improving Trade Competitiveness in Cambodia:
An Analysis Using a Trade and Transport Facilitation Assessment (TTFA)

Most of the traded rice is milled and packaged in bags for shipping. As rice is a highly segmented crop, each
market has different prices and consumer preferences. Prices are determined by type, quality (moisture
content, grain length, percentage broken, translucency, etc), consistency of variety and impurities (disease
and foreign matter)22. The basic distinction is between glutinous, aromatic, Japonica, and Indica. The trade
in glutinous rice (sticky rice) is extremely small, about 300,000 tons per year. Indica is the most prevalent
with roughly 23.5 million tons traded annually. The remaining two, aromatic and Japonica, average 5.7 and
1.5 million tons per year, respectively.
The majority of the rice trade is conducted between developing countries. There are two primary channels
for this trade. The fi rst is government to government which generally involves large quantities of low value
rice shipped in multiple shipments over a period of time. Although the government negotiates the contract,
it is often left to the private sector or individual state-owned enterprises to procure and mill the rice for export
at an agreed date. The other channel involves contracts between private parties. These are usually arranged by
brokers, international grain traders, or buying associations. International traders take long and short positions
in the commodity market, but also take ownership of the grain and may use back- to-back sales-purchase
agreements to connect the exporter and the importer.
In contrast the brokers act as middleman in the negotiation between the exporter and importer. They assume no
commercial risk and collect only a commission. The associations purchase grain for their members. The largest
is Associated Marketing Service in Europe, which represents Ahold, Dansk, ICA, Migros, and WM Morrison
Supermarkets among others.
PricesThe price of traded rice is determined by availability of supply and demand. Demand increases with population
but varies with the increase in disposable income. On the other hand, a variety of factors affect supply and
because rice is a thinly traded commodity and there is limited substitution between varieties, price volatility can
be quite high (Figure 2). In 2008, the international price peaked due to various factors that led major exporters
to restrict shipments to maintain domestic stockpiles with a reciprocal panic buying by importers.
19801982
19841986
19881990
19921994
19961998
20002002
20042006
20082010
US
D p
erm
etr
ic t
on
1100
1000
900
800
700
600
500
400
300
200
100
Annex Figure 2: Price of Thai white rice 5 percent broken (US$ per metric ton)
Source: Vietnam Food Security and Value Chain, Policy Note #2, May 2011.
22 Value Chain Study by GDS June 2003, page 24.
57Improving Trade Competitiveness in Cambodia:
An Analysis Using a Trade and Transport Facilitation Assessment (TTFA)

Cambodia production and tradeCambodia’s rice production consists of mainly three types: (1) fragrant rice grown in the northwest during the
rainy season; (2) traditional, non-aromatic rice grown during the rainy season in the southeast and (3) IRRI high
yielding varieties grown during the dry season in the southeast along the Vietnam border. A recent report by
the World Bank estimates that half of the total harvest is made up from the traditional non-aromatic varieties,
which include Phkar Khney, Neang Minh, and Neang Khon. About one third to one fourth of the total production
consists of the IRRI rice. Fragrant rice has signifi cantly expanded in recent years, and is about 20 percent of the
total production.
The rice growing areas run diagonal from the Northwest to the Southeast of the country along the Tonlé Sap
and the Mekong River (Figure 3). The fragrant rice is grown in the northwest along the border with Thailand,
while the IRRI rice is grown in the southeast close to the Vietnam border. Due to the relatively high cost for
transport, the proximity of modern mills and large-scale trading operations just across the border, a signifi cant
portion of Cambodian padi is transported to Thailand and Vietnam for processing.23
Annex Figure 3: Rice growing areas in Cambodia (red)
Source: USDA.
23 Other factors contributing to this movement are the lack of domestic milling capacity and shortage of working capital to purchase padi.
58 Improving Trade Competitiveness in Cambodia:
An Analysis Using a Trade and Transport Facilitation Assessment (TTFA)

The rice sector in Cambodia consists of about 2.9 million rice farms with an average area of less than 2 hectare
and producing approximately 3.0-3.5 tons of padi per year.24 Total production of padi grew at about 8 percent
per year from 2000 to 2010 due both to an increase in the average yield and harvested area. The increase in
yield was achieved through various means including expansion of irrigation infrastructure; increased use of high
yielding varieties; and an intensifi cation of the crop cycle allowing double cropping during the main wet season.
Although the average productivity is considerably below the global average, it is comparable with Thailand, the
largest rice exporting country, which has an average yield of 2.88 tons/ha.25
Rice is harvested throughout the year, but about 60 percent of production is harvested during the wet season
(November to January). The majority of wet season rice is planted in traditional varieties. Farmers usually
choose these because they are easier to grow, require fewer imported inputs and meet local tastes. The dry
and early wet season rice is planted using improved varieties because of their higher yields and shorter growing
periods.
Rice for export is collected from June to December (early and medium rice, Table 2). Late rice, fl oating rice and
upland rice, all of which are traditional varieties, are consumed domestically.26 Rice is collected from Eastern
Cambodia between December and May and from the Northwest between July and November
The amount of rice exports has increased rapidly in the last few years from 10,000 tons in 2008 to 51,000 tons
in 2010 and 175,000 tons in 2011. In 2010, over 90 percent rice exported shipped to the E.U. and Russia both of
which provide duty-free access. This was due in part to the granting duty free access for Cambodian rice to the
EU in 2009 under the EBA initiative. The principal destination is France with a 55 percent share of Cambodian
rice exports, followed by Poland and Lithuania with another 15 percent. Asia imports less than 4 percent and
North America less than 2 percent.
24 Based on ABiC survey data, average landing holding of farmer is 1.2 hectares (minimum landholding is less than 0.5 hectares and maximum landholding is 200
hectares). Ministry of Agriculture, Forestry and Fishery records that average paddy yield is 2.97 tons per hectare.25 USDA, FAO and Reuters.26 Suvannaphum, Mr. Anurut.
3
2.75
3.25
3
2.75
2.5
2.25
2
1.75
2.5
2.25
2
1.75
1.5
2000 2001 2002 2003 2004 2005 2006 2007 2008 2009 2010
Mil
lio
n H
ec
tare
To
ns
/He
cto
are
Area Harvested Yield
Annex Figure 4: Cambodia rice production, 2000-10 (million hectare and tons/hectare)
Source: Ministry of Agriculture, Forestry and Fisheries.
59Improving Trade Competitiveness in Cambodia:
An Analysis Using a Trade and Transport Facilitation Assessment (TTFA)

Annex Table 2: Type of padi rice production
Rice system Cultivated area (%) Variety Crop calendar
Upland Rice 2.3 Traditional Jun to Nov
Early Rice 24.8 IR and Fragrance Jun to Sep
Medium Rice 46.3 Traditional and fragrant Jun to mid Nov and Dec
Late Rice 22.6 Traditional Jun to Jan
Floating Rice 4.1 Traditional May to Jan
Source: Sovanphum Investment
Rice exports to Russia are primarily non-fragrant rice, about one-quarter of sales to the EU last year was
fragrant rice. The principal competitor for fragrant rice is Thailand, but Vietnam also provides competition.
The principal competitor for non-aromatic rice is Vietnam. Demand for non-aromatic rice comes from large
consumers such as the Philippines, Indonesia and Africa.
Rice is exported by private traders. Despite a large number of traders, the market is dominated by fi ve as
shown in Figure 5.
2009 2010 2011
100%
90%
80%
70%
60%
50%
40%
30%
20%
10%
0%
Other
Anduriz SARL
Angkor
Loran
QC
Indochina
Intemational
Golden
Amru
Kmer Foods
Megagreen Imex
Annex Figure 5: Market share of major rice traders in Cambodia, 2009-11
Rice processingThe farmers solar dry the padi and sell their surplus at the farm gate to collectors or directly to mills. In that
way they avoid the cost of transport. Also this is a cash transaction. Post harvest losses are on the order of
15-20 percent depending on whether the padi was machine threshed or hand threshed.
The only check on quality of the padi is performed at the larger mills during the sale transaction when
measurements are taken for moisture content, percentage broken and purity.27 However, during peak buying
times, quality control is often done manually by random checking.
After the millers acquire padi, they pre-clean it to remove sand, straw and other large foreign matter and then
dry it using a mechanical dryer. The husk is then removed using a rice huller and a separator to collect the
brown rice. A de-stoning machine removes any remaining stone or metal. The rice may then be polished at the
27 The smaller mills will check for moisture.
60 Improving Trade Competitiveness in Cambodia:
An Analysis Using a Trade and Transport Facilitation Assessment (TTFA)

mill if it has a polished or at a separate polishing factory. Otherwise it is sold unpolished. Additional processing
includes the use of a length grader to measure the length and thickness of the rice and a color sorter to fi lter
the rice into different grades.
Cambodia’s modern rice milling capacity has doubled since 2009, but there are still only 14 medium-size rice
mills located in the rice producing regions (Table 3). The average capacity of these modern mills is about 15
tons per hour but a few of the newer mills (built after 2009) have a capacity between 20 and 30 tons of padi
per hour. These have yields in the range of 65-72 percent. The smaller mills that process padi and supply rice
to the larger mills or polishing factories have a capacity of less than 10 tons of padi per day. The yields for the
smaller mills are lower due to their age, about 62 percent -64 percent.
There are four rice-polishing facilities, two each located in Battambang and Phnom Penh. Their combined
capacity is about 250,000 tons per year.
Annex Table 3: Large rice mills in Cambodia (tons padi/hr)
Mill Capacity Location Comment
Existing 2009
Angkor Rice (AKK) 10 Near PP Built 2011
Golden Rice 20 Near PP Operational 2009, JV Reunion
Green Trade 10 Various, 4 of 6 in PPPartner Cavifood with plans of 24 ton mill to
begin construction in June
Lor Ngor Peng 8 K-Cham
Loran Import-Export 12.5 BattambangBuilt 1994 & expanded; Plans to add
30 ton/hr by mid 2012
Men Sarun 24 PPBuilt 2003, also polishes rice from its other
mill; also has 39 others mill elsewhere
Phou Poy Rice mils 9 Battambang At two mills
New Mills
Baitang 20 Battambang Built 2009, operational 2010
BVB 30 K-Thom Operational June 2011
Chhun Thom 10 Prey Veng Operational 2011
QQ Rice 12 Porsat Malaysian JV
Sour Keng QC Rice 12 K-Cham Built 2010
Yum Leoung 10 Battambang Mill Expansion operational June 2011
Vinh Cheang 12 K-Cham Under construction
Rice Polishing
Baitang 30 Battambang Built 2009, operational 2010
International Rice Trdg 10 PP Built 2010
Khmer Food 10 PP Built 2009
Loran Import-Export 30 BattambangOperation June 2011; this’s addition to 5
ton/hr existing capacity
Rice Upgrading
Ying & Yang Rice 10 Sih’vill port Built 2009, foreign company
Source: Slayton & Moniroth, 2011, page 14
61Improving Trade Competitiveness in Cambodia:
An Analysis Using a Trade and Transport Facilitation Assessment (TTFA)

It is estimated that over 3,000 varieties of rice are cultivated in Cambodia.28 As a result, various types of padi are
often mixed during the farming and collecting stage. Because of the low quality of the post- harvest processing,
lack of segregation of varieties during transport to the mill and limited quality control during milling, most of
the rice produced is of low quality with a high proportion of broken and immature rice.
The domestic pricing of rice for export varies by variety and percentage broken with the typical categories
Somaly, Phkaa Khnhei and mixed white with 5 percent, 15 percent, 25 percent and 35 percent broken. The price
range is +25 percent of the median value.
Rice transportThe transport of rice from the farm to the mill is done using small vehicles up to 10 ton trucks. The latter
are used for deliveries from growers associations to the larger commercial mills. Trucks capable of carrying
up to 40 tons are used for the movement of rice from the mills to Phnom Penh or other loading points. They
are also used for the transport of padi to mills in Vietnam and Thailand. From Phnom Penh the rice is loaded
in containers and moved by road to Sihanoukville where it is loaded onto container feeder vessels and then
transshipped at Singapore or Hong Kong for movement to the fi nal destination. Rice destined for regional
markets is moved directly from Sihanoukville to the destination on regional carriers. Beginning in September
2011, limited quantities of uncontainerized rice have been barged down the Mekong River directly to general
cargo vessels for loading in HCMC. The principal corridors over which the export rice moves out of the country
are shown in the following Figure 6.
Annex Figure 6: Trade fl ows of padi in Cambodia
Source: ACI, 2006
28 USDA, 2010
62 Improving Trade Competitiveness in Cambodia:
An Analysis Using a Trade and Transport Facilitation Assessment (TTFA)

Characteristics of fi rms surveyed1. The 4 traders interviewed are locally owned rice trading companies that purchase milled rice from local mills
2. Their principal products are white and jasmine rice. They buy both padi and milled rice from farmers
groups and local rice millers, respectively.
3. This is delivered to their facility by the supplier
4. The supplier is paid cash on delivery
5. The only problem with suppliers was inconsistent quality rice reported by one of the traders
6. The only diffi culty in obtaining adequate supply is that of working capital
7. These traders export from 60-100 percent of the amount that process
8. They sell the output primarily to Europe
9. The product is shipped on FOB terms and sold to foreign distributors (international traders). However
some of the Jasmine rice was sold to foreign retailers and distributors and shipped CFR
10. After export the rice receives additional processing in the form of packaging for retail purposes
11. These traders provide rice against fi xed orders put in one case maintain a stock of Padi for milling
12. The products are exported through Phnom Penh or Sihanoukville ports
13. The time from confi rmation of the order to loading on the ship is 5-14 days
14. Payment is received the time of transfer to the buyers representative
15. There are no signifi cant problems with documentation by the exports
16. The principal commercial problem is lack of working capital
17. The principal source of competitive advantage is the quality of the product and speed of delivery followed
by cost
18. In order to grow the business, two traders need to increase available supplies while one sees a need
to improve the quality of the export. For the former is necessary to expand warehouse capacity
19. The principal factors limiting the growth are working capital and ability to invest additional capacity
20. For exports there are problems with the availability of transport
21. Two of the traders are large-scale handling 20,000-25,000 tons per year while two are smaller niche
players handling 3,000-6,000 tons per year
22. The small traders handle orders with individual shipments whereas the large traders will also handle
orders with multiple shipments
23. The availability of milled rice/padi varies by season but is generally delivered the same day as ordered
or one day later
24. The size of the orders for input varies with the larger traders ordering in the thousands of tons of smaller
ones less than 100 tons
25. The larger traders receive daily deliveries
26. They export both white and jasmine rice
27. The typical sizes of export shipment varies from 3 to 15 TEU
28. The larger traders try to limit their minimum shipment to 5 TEU whereas the smaller traders will
take orders of one TEU, especially for Jasmine
63Improving Trade Competitiveness in Cambodia:
An Analysis Using a Trade and Transport Facilitation Assessment (TTFA)

29. Shipments are made on a weekly basis although for the smaller shipments on a monthly basis
30. The average value of shipments for white rice is about US$12,000-US$14,000 per container while
for Jasmine it is about US$21,000
31. One of the traders arranges their own shipments but the others use forwarders
32. Most of the rice is shipped in containers although one of the traders also ships as loose cargo
33. The rice is transported by truck from the factory either in container or in full truckload
34. The domestic movement is arranged by the traders and generally requires a one-week advance notice
35. The total order cycle from order confi rmation to delivery to the buyers warehouse depends on
the location of the order, for Europe this is 48-60 days but for East Asia it can be as little as 14 days
36. There are problems in the outbound logistics in obtaining containers and arranging for transport, both
of which need to be addressed
37. The percentage of delayed shipments varies by trader with the largest reporting 50 percent delays
but the other 3 reporting 10 percent or less
38. Most of the delays result from problems with production and diffi culties in coordinating transportation,
however the largest has problems with obtaining suitable quality rice at a reasonable price
39. The typical penalty for late deliveries is only 0.1 percent of the invoice value
40. In event of the delay they notify the buyer
41. The time for acquiring the necessary documentation for exports is 3 days for the letter of origin, 7 days
for the Phytosanitary certifi cate, one day for the fumigation certifi cate, four days for the quantity
certifi cate and 7-12 days for the chemical tests
42. There are no signifi cant problems with staying up-to-date on regulations and procedures
43. The principal problems in the outbound supply chains are lack of reliability in terms of domestic transport,
ineffi cient handling at the loading port and lack of availability of customs offi cials
44. The average unit cost for semi-milled rice is US$300-US$500 per ton for white rice and US$650-
US$750 for Jasmine rice
45. The inputs are priced based on the spot price and are paid for in cash at time of delivery although a partial
payment is often made at time of order
46. The traders are reliant for fi nancing on their own cash fl ow and a line of credit from a commercial bank
47. The terms for the lines of credit are about 9 percent interest for a one-year loan with a fi xed interest
rate (foreign exchange)
48 Communications between the traders and the buyers is by telephone, fax and e-mail
49. The trader is paid for the exports by TT when the goods are shipped
50. One of the traders uses letters of credit
51. The traders use various banks to fi nance their trade
Supply chains and cash fl owTwo models were examined. Both are rice trading and milling operation. The fi rst involves smaller volumes
transported from Phnom Penh dry port to Sihanoukville via road. The second involves large shipments moving
by barge from Phnom Penh to Sihanoukville.
64 Improving Trade Competitiveness in Cambodia:
An Analysis Using a Trade and Transport Facilitation Assessment (TTFA)

Partly done in parallel.because of continuous
flow
Partial shipments tothe port occur as rice
packaging proceed
Milled ricefrom small
millers$500/ton
Paddv Rice from farmcollector$400/ton
Store in Miller’sWare house
Chemical TestCertification
7-12 days
Milling the RiceMilled Rice10-30 ton/h
Miller pays
Cash on Delivery
Order 8.30 TEU
Production takes 6-15
day including: milling,
polishing and
packaging
Buyer pays inspection
companyfor test
(done in Vietnam)
Buyer pays 25% of
order up front
Packaging and
Labeling 2 days
Involce
Packing List VAT
10-12 days
Miller pays to
Trucker
Phytosanitary/Fumigation
7-12 days to prepare document
Phytosanitary Test Fumigate
Container
Store in Dry Port
Free of charge
Nominated
FFer
Warehouse
Miller pays to Freight
Forwarder $24/ton
includes all services
up to the ship
Miller pays to
Freight Forwarder
Load onto
ship
Bill of Lading. COCertificate of
Quantity Customs Declaration
Seller
Buyer
Transfer to
Mother ship
Buyer makes final
payment 15 to 21 days
after the order
75% of the total sale value
Total combined time feeder+mother:10 day to Malaysia15 day to Australia20 day to Europe30 day to USA
Destination
Truck Delivery cost $0.50per ton per 10km
1 day
Truck to Phnom PenhLoading 40min
1 dayUnloading 40min
$15/ton (from Battambong)
Truck to PAS
Loading 40min
Transit 5h
$186/TEU
Feeder ship to
Singapore
Mother ship
to
destination
Annex Figure 7: Rice model A
65Improving Trade Competitiveness in Cambodia:
An Analysis Using a Trade and Transport Facilitation Assessment (TTFA)

Events Day
Receive sale order 0
Buying paddy 1
Confi rm order 8
Receive packaging list 10
Milling, packaging and labeling 26
Transport to dry port 30
Custom Clearance 31
Transfer to vessel 32
Get the fi nal payment 50
Transactions Amount Event Offset
Buying paddy 119,040 2 -1
Receive packing list 35,000 4 -7
Milling, packaging and labeling 13,860 5 -14
Transport to dry port 5,000 6 -1
Custom Clearance 2,100 7 -1
Receive initial payment 105,000 9 -18
Receive fi nal payment 40,000 9 0
Financial InstrumentsStart End
Amount Event Offset Event Offset Fee Interest Collateral
Loan for working capital 65,000 2 -1 9 -18 15.0%
Annex Figure 8: Cash fl ow
Title Rice Export
Trade Export
Country Cambodia
Description White Rice Export
66 Improving Trade Competitiveness in Cambodia:
An Analysis Using a Trade and Transport Facilitation Assessment (TTFA)

Th
ou
sa
nd
s
Days
150
100
50
0
-50
0 5
10 15
20
25
30
35
40
45
50
55
60
65
70
75
80
85
90
95
10
0
10
5
-100
-150
Cash Flow
60
40
20
0
0 5
10 15
20
25
30
35
40
45
50
55
50
65
70
75
80
85
90
95
10
0
10
5
-20
-40
-60
Th
ou
sa
nd
s
Day
Cash Flow with Financing
60
-60
40
-40
0
20
DAYS
0 5 10 15 20 25 30 35 40 45 50 55 60 65 70 75 80 85 90 100
105
110
Thou
sand
s
Cash Exposure
67Improving Trade Competitiveness in Cambodia:
An Analysis Using a Trade and Transport Facilitation Assessment (TTFA)

keep 20% paddy
in stork as a
buffer
MillerWarehouse
Rice Millporduces
Milled Rice
Truck0.5 1day
$15/ton
Buyer pays 25% oforder up front
Miller pays totrucker
Mother ship
to destihation
Miller sells FOB Phnom
Penh Port, so buyer pays
for barge transport
Miller pays cash on
delivery
Miller pays foragricultural inputs at
planting time, reston de livery
Truck1 day
$15/ton from BTB$12/ton from Pursat
CommunityBased
Collector
ContractFarmer1 day
delivery time
Small Millers500kg-1ton
Max 3 weeksdelivery time
Phnom Penh PortWarehouse
Represertative Offices
- Hong kong
- Macao
- Manila
- Middle East
Order from buyer500-1200 ton
Bill of lading co
Certificate of Quanitity
Customs Declaratlon
Seller
Buyer
B.anget to HCMPort
48 hours$29-38/ton
Transfer toship in HCM port
Wait time
around 1-3 days
Mother ship
Buyer makes final payment
15 to 2 1 days after the order
75% of the total sale vatue
Regions
Annex Figure 9: Rice model B
68 Improving Trade Competitiveness in Cambodia:
An Analysis Using a Trade and Transport Facilitation Assessment (TTFA)
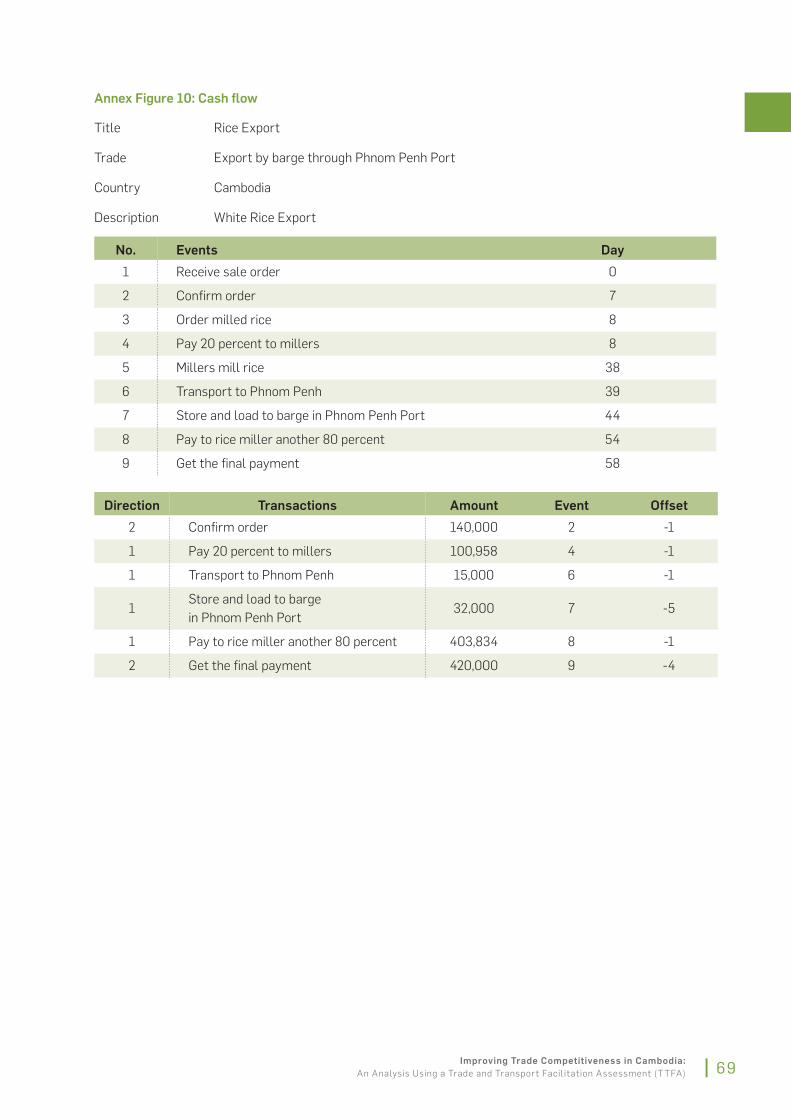
No. Events Day
1 Receive sale order 0
2 Confi rm order 7
3 Order milled rice 8
4 Pay 20 percent to millers 8
5 Millers mill rice 38
6 Transport to Phnom Penh 39
7 Store and load to barge in Phnom Penh Port 44
8 Pay to rice miller another 80 percent 54
9 Get the fi nal payment 58
Direction Transactions Amount Event Offset
2 Confi rm order 140,000 2 -1
1 Pay 20 percent to millers 100,958 4 -1
1 Transport to Phnom Penh 15,000 6 -1
1Store and load to barge
in Phnom Penh Port32,000 7 -5
1 Pay to rice miller another 80 percent 403,834 8 -1
2 Get the fi nal payment 420,000 9 -4
Annex Figure 10: Cash fl ow
Title Rice Export
Trade Export by barge through Phnom Penh Port
Country Cambodia
Description White Rice Export
69Improving Trade Competitiveness in Cambodia:
An Analysis Using a Trade and Transport Facilitation Assessment (TTFA)
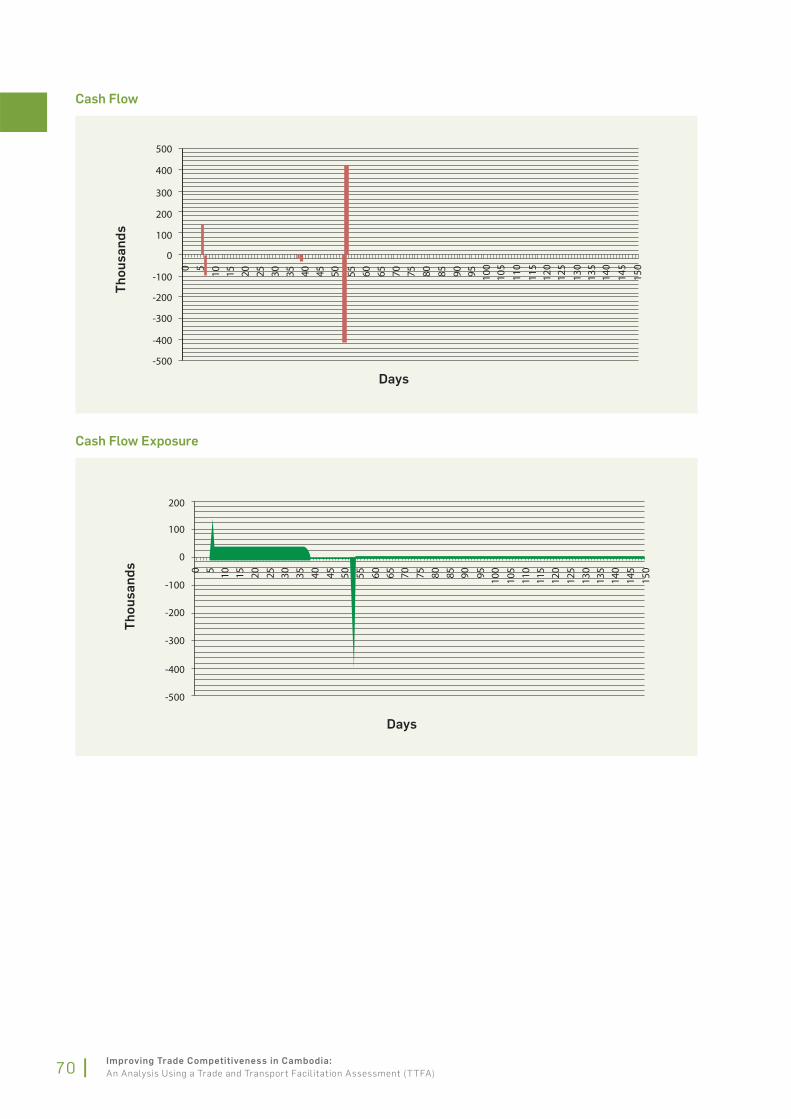
-500
-400
-300
-200
-100
0 5 10 15 20 25 30 35 40 45 50 55 60 65 70 75 80 85 90 95 100
105
110
115
120
125
130
135
140
145
150
0
100
200
300
400
500
Th
ou
sa
nd
s
Days
Cash Flow
Th
ou
sa
nd
s
Days
-500
-400
-300
-200
-100
0
0 5 10 15 20 25 30 35 40 45 50 55 60 65 70 75 80 85 90 95 100
105
110
115
120
125
130
135
140
145
150
100
200
Cash Flow Exposure
70 Improving Trade Competitiveness in Cambodia:
An Analysis Using a Trade and Transport Facilitation Assessment (TTFA)


Annex II: Garment
Global production and tradeThe growth of the global textile and apparel industry is driven by increases in population and disposable
income.29 Total revenues from the textile and apparel industry are estimated to have grown by about 30 percent
between 2006 and 2010. During this period, trade in textile and apparel grew by only half as much due to the
global fi nancial crisis, which reduced demand in both the US and EU. Despite this reduction, trade in textile
and apparel increased by more than 100 percent over the last decade (Figure 11). The volume of trade has
rebounded in 2010 and 2011 despite the on-going European sovereign debt crisis.
The growth in trade is a result of the
outsourcing of production to low wage
countries in Asia. This began in the 1950s
and early 1960s with Japanese exports to
Europe and the US. The increase in the cost
of production in Japan in the 1970s and
1980s led to a migration to manufacturers in
Taiwan, Korea and Hong Kong and provided a
further stimulus for trade. As the production
costs in these countries rose, a migration
began in the late 1980s to factories in China.
There was a complementary shift to
Southeast Asia but this lost momentum
during the Asian fi nancial crisis in the late
1990s.
400
350
250
150
100
50
0
300
200
2001 2002 2003 2004 2005 2006 2007 2009 20102008
25%
20%
10%
0%
-5%
-10%
15%
5%
-15%
Annex Figure 11: Global trade in garments, 2001-10 (US$ billion and growth)
Source: UN-Comtrade, 2012(HS-Codes 61, 62).
Hong Kong,
China: 40%
Italy: 5%
Germany: 5%
Bangladesh:
5%
Turkey:
4%Vietnam: 3%
India: 3%
France: 3%
Spain: 2%
Belgium: 2%
Indonesia: 2%
Other: 26%
Annex Figure 12: Largest apparel exporters, 2010 (%)
Source: Trademap.
29 Per capita spending on apparel grows less than proportionately with increases in per capita income
72 Improving Trade Competitiveness in Cambodia:
An Analysis Using a Trade and Transport Facilitation Assessment (TTFA)

Asia experienced particularly rapid growth
in exports over the last three years while
exports from Africa, Latin America and
Eastern Europe grew at a slower pace.
Eastern Europe is presently repositioning
itself towards higher value market segments
since their cost structure does not allow them
to compete with Asia. Egypt is in the process
of revitalizing its garment manufacturing to
complement its production and export of
cotton and cotton fabrics. South and Central
American countries are seeking to maintain
their present position.
The outsourcing had the greatest impact on the US where only 4 percent of its apparel is produced domestically.
Europe has been less affected although 85-90 percent of its apparel is still imported. Nevertheless, some
European countries continue to export. The largest exporters are Italy and Germany with each contributing 5
percent to global trade. Turkey and France contribute 4 percent and 3 percent, respectively, as shown in Figure
12. When intra-EU trade is considered, Italy is the second largest textile and clothing exporter in the world and
is the leader in the high value market, which has a large fashion component. Turkey has been able to achieve
strong growth in exports by creating a number of regional brands.
The principal destinations for exports of garments remain the US and the countries in the EU as shown in Figure
13. While the share of exports destined to the US and EU has remained relatively steady as shown in Table 4,
growth in demand in the last few years has come primarily from the larger emerging economies.
Market segmentsThe market for apparel can be divided into different segments based on the fi nal consumers, the fashion content
and the international buyers.
Final consumerFrom the perspective of product sophistication, apparel can be classifi ed into fi ve main categories. The
traditional categories are men’s, women’s, and children’s clothing. Athletic clothes have emerged as a separate
category in recent years. The remaining products include accessories and miscellaneous. Each category has
different characteristics as follows.
Women’s clothing has a signifi cant fashion component and a broader range of products in each of
the subcategories from formal to work to casual.
Men’s clothing has an increasing fashion component but remains much less than for women. The range
of products is also smaller.
Children’s clothing is a smaller market with fewer products because of the age range. The fashion
component is minimal but increasing, especially in mature markets.
Athletic clothes serve as casual clothes and sportswear. There is an increasing fashion component
and strong emphasis on the brand
Accessories include a wide product range most of which has a fashion component.
Consequently, women’s clothing accounts for roughly 50 percent of global trade, while men’s clothing adds up to
only 25 percent as shown in Figure 15.
japan; 7%
U.K; 6%
Germany;
10%
Other; 32%USA; 22%
France; 6%Italy; 5%
Spain; 4%Netherlands; 3%
Hong Kong
China; 5%
Annex Figure 13: Largest apparel importers, 2010 (%)
Source: UN-Comtrade, 2012.
73Improving Trade Competitiveness in Cambodia:
An Analysis Using a Trade and Transport Facilitation Assessment (TTFA)

Annex Table 4: Major destinations for garment exports, 2010 (US$ billion)
1995 2000 2005 2007 2008
World (US$ bn) 162.9 208.9 291.2 358.1 375.6
EU-27 (%) 45.5 39.8 45.2 46.1 47.3
United States (%) 25.4 32.1 27.5 23.7 22.0
Japan (%) 11.5 9.4 7.7 6.7 6.9
Russian Fed. (%) 0.0 0.4 0.8 3.9
Canada (%) 1.7 1.8 2.1 2.2 2.3
Switzerland (%) 2.3 1.5 1.5 1.5 1.5
U.A.E. (%) 0.8 0.2 1.5 0.4
Australia (%) 0.8 0.9 1.1 1.0 1.1
South Korea (%) 0.7 0.6 1.0 1.2 1.1
Norway (%) 0.9 0.6 0.6 0.6 0.7
Mexico (%) 1.2 1.7 0.9 0.7 0.7
China (%) 0.6 0.6 0.5 0.6 0.6
Singapore (%) 1.0 0.9 0.7 0.7 0.6
Turkey (%) 0.6
Source: (WTO, 2010); Apparel represented by SITC Code 84 as presented in “The Global Apparel Value Chain, Trade and the Crisis:
Challenges and Opportunities for Developing Countries” Gereffi , G. and Frederick, S., April 2010, Research Working Paper 5281,
World Bank.
Women Men Kids Other
50%24%
24%
2%
Annex Figure 14: Garment trade by product
category, 2010 (%)
Source: General Department of Customs and Excise, 2011.
HauteCouture
DesignerCollections
Fashion Basics
Basic Apparel
Retail Brands
Annex Figure 15: Fashion pyramid
Fashion contentWhereas, each of these segments has a fashion component, it is most important in women’s clothing and
accessories. The fashion component can be divided into fi ve categories, which are represented in the fashion
pyramid shown in Figure 15. The top of the pyramid, haute couture is the smallest but most expensive, whereas
basic garments is the largest in terms of volume but lowest in terms of cost. The characteristics of these fi ve
are as follows:
74 Improving Trade Competitiveness in Cambodia:
An Analysis Using a Trade and Transport Facilitation Assessment (TTFA)

Haute couture: This is the most expensive and exclusive of all segments and consists of custom-
made clothing from a small number of fi rms. Haute couture is sold exclusively at fashion shows
and through appointments at the designer’s store. Although the market is small it has been expanding
due to the new wealth in emerging markets such as India, China and the Middle East.
Designer collections: All couture houses also produce ready-to-wear clothes. The mass- produced
ready-to-wear collections are more profi table because they have a larger market, but depend on the
haute couture to preserve the brand’s image. Examples are Giorgio Armani, Christian Dior, Chanel,
Givenchy, Christian Lacroix, Emanuel Ungaro, John Galliano, and Alexander Mc Queen. The designer
collections are sold through a small number of branded retail stores located in upscale markets.
Fashion Basics: These mass-produced brands target middle-income households but retain a fashion
component. They have a relative short shelf life and generally produce several collections per year.
Examples of this segment are Inditex (Zara), H&M, Marks & Spencer, C & A, Next. Benetton, Coach,
Polo Ralph Lauren, and Abercrombie & Fitch Company. Fashion basics are sold through a small
number of branded retail stores located in upscale markets although the outlets are more widely
distributed in metropolitan areas.
Retail brands: These are similar to fashion basics but the brand is associated with the retail chain,
which sells a variety of brands. Retail brands are distributed through large retail chains.
Basic Apparel: These are the discount brands produced in large volumes and targeting low- income
consumers. They are distributed through large volume retailers such as Wal-Mart J.C. Penny, Carrefour,
Metro, Target, Kohl’s etc.
International buyersBuyers can be divided into four categories depending on their involvement in the downstream activity. These are
branded marketers and branded manufacturers, independent buyers and global retailers.30
Branded marketers are directly involved in design and marketing but contract out the manufacturing. They set
standards and specifi cations for the products. They use international third party logistics service providers but
their regular manufacturers assume an increasing role in the provision of logistics. Typical examples of brand
manufacturers are Nike, Adidas etc.
Branded manufacturers are involved in the entire supply chain. They have their own factories and retail outlets
in their major markets. However, many have refocused on their core competency and outsource most or all of
their production in order to concentrate on marketing and retailing.
Global retailers such as Wal-Mart, Kmart, Carrefour and others outsource the supply of apparel through
buying agents and sell their products exclusively in their own retail outlets
Independent buyers and wholesalers/distributors act as an intermediary between garment producers and
large retailers. They oversee production and the logistics between the factory and the retailer’s distribution
center. They are also assuming responsibility for quality control and social audits. These specialists, such as
Li-Fung, are increasing their share in the market as their clients refocus on marketing and retailing
Distribution channelsBasic apparel is distributed through buyers and wholesalers, who sell to large discount chains or outlets. Haute
couture is sold at fashion shows and through appointments at the designer’s store. Retail brands are distributed
through large retail chains. The basic fashions and retail brands are purchased by the retailer either directly or
through buying agents.
30 Aboni Study on GVC, UNESCAP, p. 36, 37.
75Improving Trade Competitiveness in Cambodia:
An Analysis Using a Trade and Transport Facilitation Assessment (TTFA)

In recent years, distribution channels have evolved as more brand manufacturers and marketers open their own
stores. At the same time, large retailers are developing proprietary brands using either in-house design teams
or brand marketers. Their production is often outsourced to one or more foreign factories. The large retailers
are also using different sources for fashion and basic apparel. While for brand manufacturers quick market
response and fl exibility are important, large retailers place mire value on low costs.
The role of intermediaries in the distribution channel has also changed. Some manufacturers manage their
global supply chains and act as direct suppliers to the buyers. In contrast, many retailers use buying agents that
provide a broad range of services including basic design and product development, quality control and supply
chain management, and monitoring the performance of factories with regards to social and environmental
standards.
Finally the relationship between supplier and buyer is changing as the development of global supply networks
creates demand for greater reliability. This has led to diversifi cation away from a single source or multiple
sources within a single country. At the same time, it has meant a reduction in the number of suppliers and
encouraged longer-term relationships with larger suppliers that serve multiple clients.
Value propositionThe branded retail chains used for fashion basics, e.g. H&M, Zara, Gap, Benetton, Diesel, introduced the concept
of fast-changing fashions. They increased the frequency of design changes (seasons) and focused on providing
an image for their fashion-oriented consumers. This implied a larger design component but focused on trends
rather than on original designs. The variety of colors and sizes increased, while prices were kept reasonable.
They also signifi cantly improved the performance of their supply chains in order to provide
Fast development cycles, with smaller batches and greater variety to offer customers the latest designs
in limited quantities to provide a sense of exclusivity;
Increased information and supply chain transparency to better monitor in-store stocks, to respond quickly
to consumer demand, to supply the design and marketing departments with real-time information on
sales and to deliver new fashion lines just-in-time; and
A large retail network covering all major cities of a country/continent. For example, H&M has 2,300
stores (in 43 countries), Mango 2,000 stores (in 103 countries) and Zara more than 1,000 stores worldwide.
Despite the great reliance on fast production and effi cient logistics, not all companies operating in this segment
have their own factories. For example, Gap, Mango and H&M do not have their own production facilities and
outsource all production while others outsource only part of their production.
Production of garments and textilesThe complete supply chain for apparel begins with the production of the textiles and ends with the distribution
of the apparel to different retail outlets as diagrammed in Figure 16. The production of textiles follows the
fl owing sequence spinning and either weaving or knitting the yarn then dyeing or printing the fabric and
fi nishing the fabric. For some fabric, dyeing is done before weaving. The fi nishing process for fabrics includes
various treatments to change the appearance, durability, etc. Mechanical spinning is used for natural fi bers,
while melt spinning of the polymer is used for synthetic fi bers. Natural fi bers are usually woven while
synthetic yarn is normally knitted.
76 Improving Trade Competitiveness in Cambodia:
An Analysis Using a Trade and Transport Facilitation Assessment (TTFA)

The supply chain is usually organized by the buyer
or the buyer’s representative who contracts the
services of the manufacturer. The principal activities
of the garment manufacturer are cutting, making,
trimming, packaging and labeling the garment. These
separate the supply chain into an inbound supply
chain for obtaining inputs and an outbound supply
chain for distributing the products. The buyer retains
responsibility for design and specifi cation of the
inputs and will normally assume responsibility for
distributing and marketing. However, responsibility
for sourcing or procurement of the inputs may be
assigned to the manufacturer. The business models
discussed below are based on variations in the
assignment of responsibility for the supply chain
activities.
One variation involves vertical integration with the
manufacturer participating in the production of the
fabric. This backward integration can include one or
more of the activities in producing the fabric as shown
in Figure 17. Dyeing and fi nishing involves the least
investment and labor, but simplifi es the sourcing of
fabric and reduces the delivery time. Weaving is more
capital intensive and also requires a larger labor
force.
Nautral andSynthetic Fibers
Spinning
Weaving Knitting
Quality
Control
Marketing
Desigs
Garment
Manufacturing
Branded ApparelProducer/Distributor
OverseasBuying Office
3rd PartyBuying Agent
TraderWholesaler
High EndRetail Chains
DiscountOutlets
Low EndRetail Chains
SpecialtyStores
NaturalFibers
DyeingYarn
SpinnigYarn
Spun Yarn
WeavingYarn
Dyeing orPrintingFabric
FinishingFabric
Cut andMake
Trim andAccessories
Greige Fabric
Rough Fabric
Uncut orPre-cutFabric
GarmentsUnfinished
Annex Figure 16: Supply chain from fi bers to apparel
Annex Figure 17: Input points for the garment
production activity
77Improving Trade Competitiveness in Cambodia:
An Analysis Using a Trade and Transport Facilitation Assessment (TTFA)

In order to ensure an effi cient weaving operation, the garment manufacturer continues to obtain some fabric
from other producers and the weaving operation sells part of its output to other manufacturers.
Alternative business modelsThe extent of backwards integration is one of the parameters that defi ne the business model applied by a
garment manufacturer. The other parameters relate to design and marketing.
Assembly/CMT (cut, make and trim) is the simplest model. The manufacturer produces the garments but is
not involved in design of the garment or the sourcing of the fabric. The manufacturer is paid a processing fee,
and uses fabric sourced, and in some cases produced, by the buyer.
Original Equipment Manufacturing (OEM)/FOB/Package Contractor is a model in which the manufacturer
sources and procures the fabric and produces the garments. The buyer provides exact specifi cations as well as
the design. A manufacturer with backwards integration may also produce the fabric.
Original Design Manufacturing (ODM)/Full Package Contractor is a model in which the manufacturer
carries out all steps involved in the production, including design, sourcing and procuring fabric, and distribution
of garments. The buyer approves the design and material used for production through an exchange of samples
produced by the manufacturer. In some cases, the manufacturer may also produce the fabric.
Original Brand Manufacturing (OBM) is a stand-alone business in which the manufacturer sells products that
are designed and produced under the company’s own brand. The manufacturer may also produce the fabric but
the actual manufacturing is frequently subcontracted. The fi rm may act as the supplier by taking control of the
distribution channel but the buyer often retains this responsibility.
Annex Table 5: Countries applying different business models
Functional Capabilities Country Examples
Cut, Make, Trim (CMT/Assembly) Cambodia, SSA, Caribbean, Vietnam
Package Contractor (OEM)Bangladesh, Indonesia
Sri Lanka, Mexico
Full Package Provider (ODM) Turkey, EU, India, China
Service ProvidersHong Kong, Taiwan, South Korea,
Singapore, Malaysia
Supply chain performanceThe demands on supply chain performance increase as the value of garments rises (Figure 18). Higher value
garments have a greater fashion component and, therefore, a shorter shelf life. They require shorter order
cycles and, at the same time, greater attention must be given to managing product inventory to avoid either stock
outage or overstock. In order for local manufacturers to win orders from producers of higher value garments,
they need to improve not only the quality of their production but also the performance of the inbound and
outbound supply chains including quality control. In many situations, an increase in garment value is associated
with sourcing a greater variety of higher value inputs. It also involves a greater variety of order sizes, both for
the initial orders and restocking. These changes require faster setup times for production lines and better
management of both inbound and outbound supply chains and the associated transactions. The manufacturer
must improve the rate of order fulfi llment by providing on-time delivery of products in good condition. While
there may be less emphasis on delivered cost relative to delivery time and order fulfi llment, the manufacturer
still expect the manufacturer to control the costs of both of inputs and production.
78 Improving Trade Competitiveness in Cambodia:
An Analysis Using a Trade and Transport Facilitation Assessment (TTFA)

Increase Order
Fulfillment
Arrival and
Condition
IncreaseFlexibilityOrder SizeInitial andRestockReduce
Order CycleDelivery Time
for Inputsand Products
Increase
Product
Value
Increase
Complexity
Components,
ProductionImprove
Quality andConsistency,
Inputs,Products
ControlDelivered Cost
Ex-factory,FOB, CFR
Annex Figure 18: Enhancements to supply chain performance with higher-value products
Cambodia’s garment industryThe value of Cambodia’s garment exports grew at a relatively uniform rate until the global fi nancial crisis
caused a contraction as shown in Figure 19. Its contribution to the global trade rose from 0.33 percent in
1998 to 0.95 percent in 2011. The contribution of the apparel industry to Cambodia’s GDP rose from around
1 percent in the early 1990s to about 10 percent in 2009. The apparel and footwear industry accounted for an
increasing portion of total industrial output until 2005, when it contribution leveled of at 55 percent as shown
in Figure 20.
3.5
3.0
2.5
2.0
1.5
1.0
0.5
0
1995
Bil
lio
n U
S$
1997 1999 20032001 2005 2007 2009 2011*
Annex Figure 19: Cambodian garment exports 1995-2011 (US$ billion)
Source: GMAC, 2011.
79Improving Trade Competitiveness in Cambodia:
An Analysis Using a Trade and Transport Facilitation Assessment (TTFA)
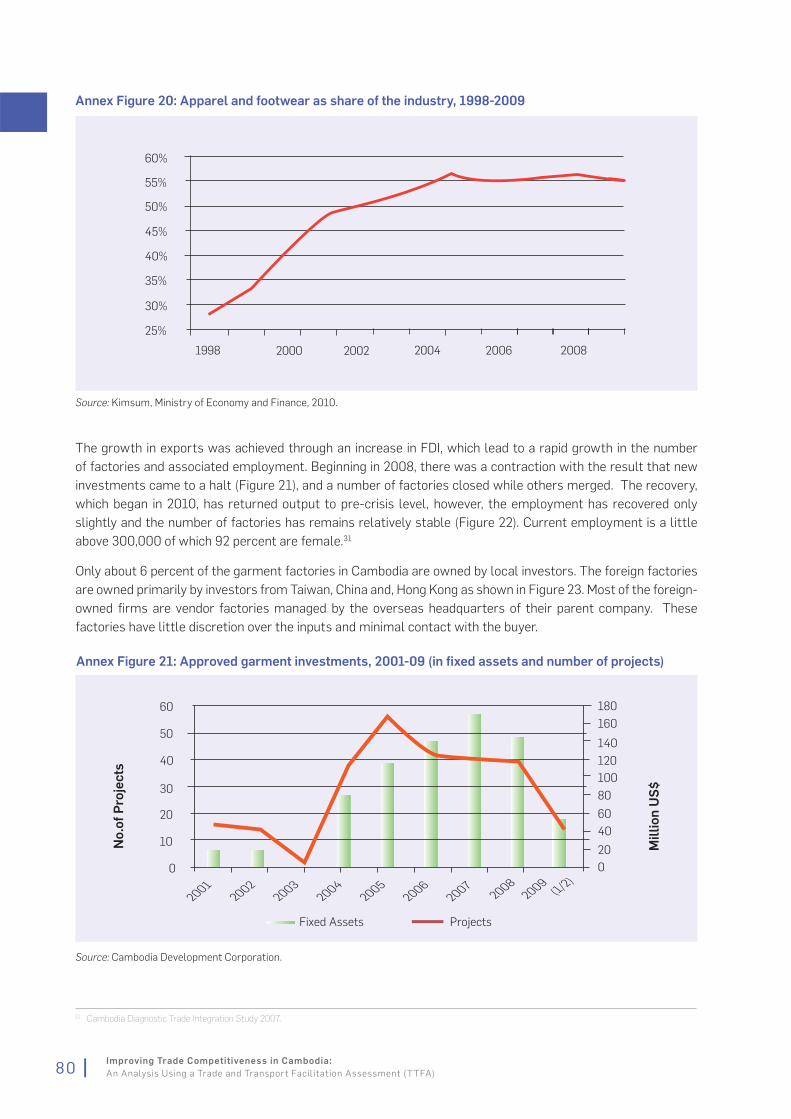
The growth in exports was achieved through an increase in FDI, which lead to a rapid growth in the number
of factories and associated employment. Beginning in 2008, there was a contraction with the result that new
investments came to a halt (Figure 21), and a number of factories closed while others merged. The recovery,
which began in 2010, has returned output to pre-crisis level, however, the employment has recovered only
slightly and the number of factories has remains relatively stable (Figure 22). Current employment is a little
above 300,000 of which 92 percent are female.31
Only about 6 percent of the garment factories in Cambodia are owned by local investors. The foreign factories
are owned primarily by investors from Taiwan, China and, Hong Kong as shown in Figure 23. Most of the foreign-
owned fi rms are vendor factories managed by the overseas headquarters of their parent company. These
factories have little discretion over the inputs and minimal contact with the buyer.
Mil
lio
n U
S$
Projects
20062007
20082009
50
30
20
10
0
60
40
20012002
20032004
2005
Fixed Assets
180
160
120
60
80
40
20
0
140
100
(1/2
)
No
.of
Pro
jec
ts
Annex Figure 21: Approved garment investments, 2001-09 (in fi xed assets and number of projects)
Source: Cambodia Development Corporation.
55%
60%
50%
40%
35%
30%
25%
45%
2006 20081998 2000 2002 2004
Annex Figure 20: Apparel and footwear as share of the industry, 1998-2009
Source: Kimsum, Ministry of Economy and Finance, 2010.
31 Cambodia Diagnostic Trade Integration Study 2007.
80 Improving Trade Competitiveness in Cambodia:
An Analysis Using a Trade and Transport Facilitation Assessment (TTFA)

The headquarters allocates orders from the buyers to the factory based on its capacity, unit costs, and
skill level relative to the other factories owned by the parent company. It then arranges for delivery
of inputs as well as shipping of the exports. As a result, the individual factories have little ability to attract
orders or to identify markets into which they could expand.
Most of the factories are located around Phnom Penh or in Kandal Province. While some are located in the
Export Processing Zones, most are outside because there is little difference since inputs can be imported
duty free.
Fa
cto
rie
s;
00
0 E
mp
loy
ee
s
Employment
400
1995 1997 1999
350
250
150
100
50
0
300
200
2001 2003 2005 2007 2009
Factories
Annex Figure 22: Garment factories and employment, 1995-2010 (# of factories and ‘000 employees)
Source: International Labor Organization, GMAC, 2011.
24%
16%
11%10%5%
4%
9%
12%Taiwan
China, prc
Korea
Hong kong
Malaysia
Singapore
Cambodia
Other
Annex Figure 23: Ownership of garment factories
32 GMAC presentation.
Various estimates have been made of the
proportion of the factories that are either
vendor factories or contract manufac-
turers involved in CMT/Assembly. The
results vary from 60 to 87 percent, in part
due to a problem of defi nition. At least
70 percent of the factories are contract
manufacturers or vendor factories, and
the latter account for most of them. A
small portion of the factories source
inputs and prepare samples (see box on
following page). There are also some
factories that produce their own designs
but these are small-scale production of
accessories with designs prepared by
NGOs and other social enterprises. A
number of the smaller factories produce
for the domestic market and sub-contract
to larger producers.32
81Improving Trade Competitiveness in Cambodia:
An Analysis Using a Trade and Transport Facilitation Assessment (TTFA)

Annex Box 1: Cambodia OEM factoryOne large company factory in Phnom Penh operates as an OEM. It is part of a Group that most
of its operations in South Asia but also has stand-alone factories in Cambodia, Mauritania and
Madagascar. The one in Phnom Penh, which has about 3000 employees, serves Gap.
Gap presents various styles to its contract manufacturers and asks for bids. The Group presents
bid but factory contributes to cost estimate. The factory will take orders of 10 thousand to 1
million but do not take orders for rapid replenishment. If they require additional capacity, they
subcontract other factories.
Gap nominates the suppliers and forwarder. Fabrics are sourced from fi ve suppliers in China,
India and Pakistan. The factory arranges procurement from these suppliers because group has
no particular advantage since material is not from Bangladesh. The fabric is usually shipped on
a CFR basis with payment on receipt in Sihanoukville, CAD using a TT. For this transaction they
use HSBC because of limitations on both Bangladesh and Cambodian banks. They do not use a
L/C because the Gap effectively acts as guarantor.
Once the order is confi rmed, the factory has 90 days to deliver to nominated forwarders. The
time for procurement of fabric is generally 30 days plus time to Cambodia for a total of 45
days. Samples are prepared to test for fi tting, washing and pre-production and approved by
GAP headquarters in SF. These involve relatively short turnaround times. Trim is obtained from
a variety of sources, e.g. zippers from HK, buttons from India and thread and packaging from
Vietnam, but these require less time for delivery. Production generally requires about 30 days.
Exports are shipped to Gap’s distribution center in forty foot containers with ocean transport
arranged by GAP’s nominated forwarder. Goods are shipped CFA with payment CAD and TT not
L/C. When shipments are delayed, they consult with GAP. About 1 percent of the shipments end
up being sent via Air-Sea
At present, there is no demand to reduce order time. They could try to produce fabrics locally,
but Cambodia has no tradition for textile manufacturing. They could produce their own synthetic
knitwear as is done in Bangladesh, but there is no justifi cation for this investment. The factory
does some washing and occasional over-dyeing, but see no benefi t in trying to establish a dyeing
and fi nishing operation.
Marketing and costing are done at the Group headquarters while merchandising is done through
its India offi ce. They use local banks to manage documents and local fi nancial transactions.
Otherwise they manage their cash-to-cash from internal funds.
Source: GMAC, 2011.
The average level of employment per factory is about 1100. The largest are those with Taiwanese
and Malaysian owners with an average of about 1,500 employees while locally owned factories average less
than 600 and Chinese fi rms about 650.33 About a quarter of the fi rms employ less than 500. The largest
factories employ 6,000-9,000.
33 Table 1.3, “Factory-Level Value Chain Analysis of Cambodia’s Apparel Industry”.
82 Improving Trade Competitiveness in Cambodia:
An Analysis Using a Trade and Transport Facilitation Assessment (TTFA)

There are a large number of buyers of the apparel exports. These include retailers from all segments, brand
marketers and retail chains. However, GAP is estimated to account for 30 percent of the production and the 15
largest buyers, which include H&M and Levi Strauss, Nike and Adidas and C&A and Target, purchase over half
of the exports.
Cambodia has no domestic suppliers of fabrics, threads, accessories and trim. Local inputs are limited
to packaging materials. About 70 percent of the fabric is imported from China, Taiwan and Hong Kong
and another 16 percent from Southeast Asia. A large proportion is ordered by the large foreign-owned
factories, which order from suppliers that have a relationship with the parent company and are very often
from the same country. For the factories that procure fabric, most do so according to the buyer’s specifi cations
and in many cases, from suppliers designated by the buyer.
A signifi cant majority of the garment exports
are destined for the US or EU (Figure 24), however,
the proportion going to other markets has been
increasing (Figure 25). The concentration of
export destinations in the US and EU are
encouraged by the various trade agreements
providing preferred access such as the Bilateral
United States-Cambodia Textile and Apparel
Agreement, and the EU’s EBA initiative.
Because the trade agreement with the EU has
restrictions on rules of origin related to double
transformation, exports have tended to focus
on sweaters and other items that meet this
requirement.
2% 7%55%
8%
28%US
Canada
EU-27
Japan
Other
Annex Figure 24: Cambodian garment export
destinations, 2010
Source: GMAC, 2011.
100%
90%
80%
70%
60%
50%
40%
30%
20%
10%
0%
R.O.W
Canada
EU
USA
2001 2002 2003 2004 2005 2006 2007 2009 20102008 2011
Annex Figure 25: Destination of Cambodian garment exports, 2001-11
Source: GMAC, 2011.
83Improving Trade Competitiveness in Cambodia:
An Analysis Using a Trade and Transport Facilitation Assessment (TTFA)
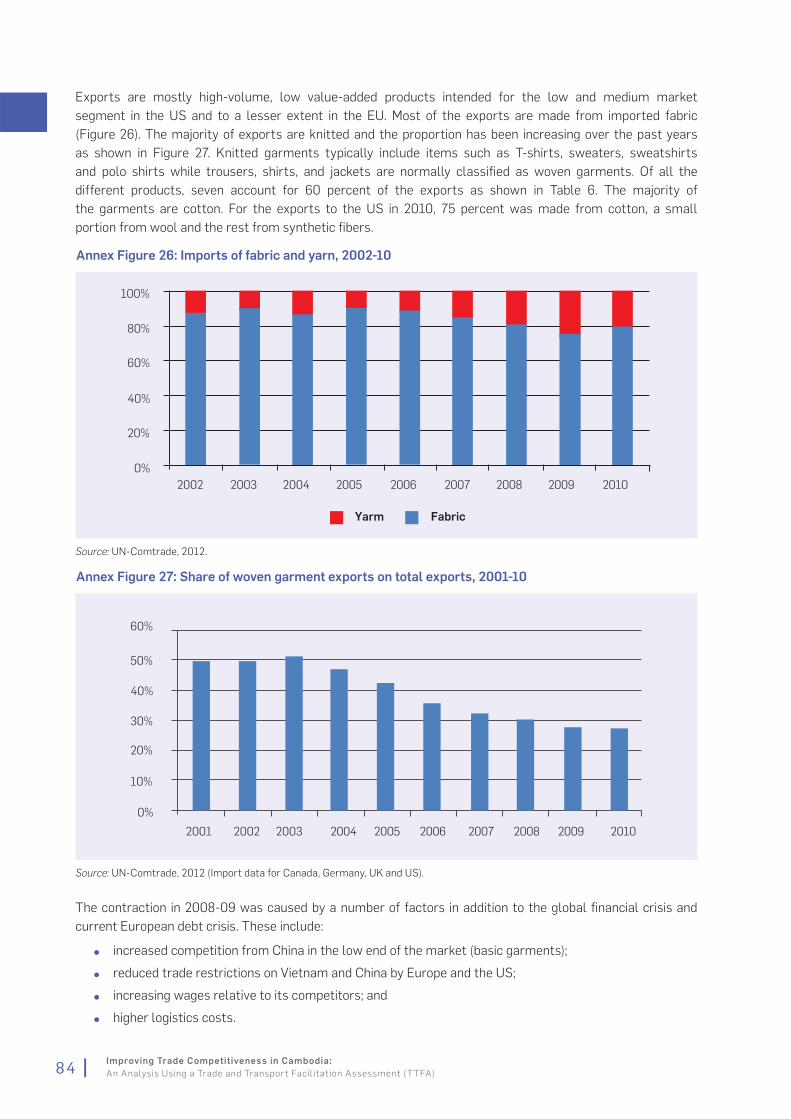
Exports are mostly high-volume, low value-added products intended for the low and medium market
segment in the US and to a lesser extent in the EU. Most of the exports are made from imported fabric
(Figure 26). The majority of exports are knitted and the proportion has been increasing over the past years
as shown in Figure 27. Knitted garments typically include items such as T-shirts, sweaters, sweatshirts
and polo shirts while trousers, shirts, and jackets are normally classifi ed as woven garments. Of all the
different products, seven account for 60 percent of the exports as shown in Table 6. The majority of
the garments are cotton. For the exports to the US in 2010, 75 percent was made from cotton, a small
portion from wool and the rest from synthetic fi bers.
The contraction in 2008-09 was caused by a number of factors in addition to the global fi nancial crisis and
current European debt crisis. These include:
increased competition from China in the low end of the market (basic garments);
reduced trade restrictions on Vietnam and China by Europe and the US;
increasing wages relative to its competitors; and
higher logistics costs.
2002
Yarm Fabric
2003 2004
100%
60%
40%
20%
0%
80%
2005 2006 2007 2008 2009 2010
Annex Figure 26: Imports of fabric and yarn, 2002-10
Source: UN-Comtrade, 2012.
2001 2002 2003
60%
40%
30%
20%
10%
0%
50%
2004 2005 2006 2007 2008 2009 2010
Annex Figure 27: Share of woven garment exports on total exports, 2001-10
Source: UN-Comtrade, 2012 (Import data for Canada, Germany, UK and US).
84 Improving Trade Competitiveness in Cambodia:
An Analysis Using a Trade and Transport Facilitation Assessment (TTFA)

Jun-04
Dec-04
Jun-05
Jun-06
Jun-07
Dec -05
Dec-06
Jun-08
Dec-07
Jun-09
Dec-08
Dec-09
Dec-01
Jun-02
Dec-02
Jun-03
Dec-03
50
30
10
US$
/doz
en
United States EU Total
Annex Figure 28: Decline in value of export prices
Source: World Bank, “Making the Cut”, 2011.
Annex Table 6: Top seven products in US and EU
H.S.Code Description Apparel Exports (%)
611020Sweaters, pullovers, sweatshirts
22
611030 8
610462Women’s or girls’ trousers
6
620462 11
620342 Men’s or boys’ trousers 8
610910 T-shirts, singlets, tank tops 5
610220 Women’s or girls’ overcoats 2
Total 60
Source: Staritz, USITC
During this period of slack demand, the buyers have been able to negotiate lower prices, introduce more
favorable payment terms, shorten their order cycle and require higher rates for order-fulfi llment. These
changes are unlikely to continue even after the economic recovery.
The challenge for the Cambodian apparel industry, aside from diversifying its market and reducing energy and
labor costs, is to adjust its production to changing market conditions. At the same time, it will have to increase
the unit value of its exports. Therefore, it must reverse the slide that has occurred primarily in the US market
over the last decade (Figure 28).
Cambodia has an extensive network of Special Economic Zones that were developed to attract new investment
and provide an environment that would stimulate the growth in exports. However, this has had very limited
impact. Most of the Zones are either non-operation or have few locators. Only a few are successful, but these
have attracted a potpourri of investors rather than creating clusters which would benefi t specifi c industries.
Perhaps most telling is the preference of garment factories to remain outside of these zones allowing them
more alternatives in choosing a site for their factories while retaining most of the benefi ts that the zone offer
such as duty free import of inputs and bonded storage.
85Improving Trade Competitiveness in Cambodia:
An Analysis Using a Trade and Transport Facilitation Assessment (TTFA)

Summary of fi rms surveyed 1. Of the fi ve fi rms surveyed three dealt primarily with knitted fabrics and the others with woven
textiles
2. All of the textiles are imported from either the original manufacturer or foreign distributors
3. All the fi rms use multiple suppliers but predominantly from China. A few fi rms also use material from
Southeast Asia
4. All fi rms have diffi culties with uncertainty of supply and price variations. Problems with delays
indelivery or quality control were less prevalent.
5. The fi rms produce primarily women’s’ wear for North America but one fi rm shipped primarily to the EU
6. All production is on a fi xed order basis with the exported products ready for retail
7. Demand for the products is subject to seasonal fl uctuation, however, most products are not subject
to variation in fashion and have a relatively long shelf lives
8. The typical order cycle, up to the point of shipment, is either 45 or 90 days depending on order size
and source of fabric
9. The time for international transport up to the buyer’s warehouse is typically 14-30 days
10. During periods of peak demand, orders would rise by about 25 percent. In order to meet the additional
demand, fi rms extend their working hours, add production lines and/or subcontract order fi rms
11. The fi rms indicated they shipped about 5 percent by air and the rest by ocean
12. While the time for payment vary according to the buy, it was typically 7-30 days after loading
onto the transport for export
13. Each of the fi rms had diffi culties with the time and the cost required for import permits and customs
declarations, both, however the most serious delays occur when waiting for the certifi cate of origin
which can only be issued after shipment and can take 5-10 days.
14. To obtain approval for Customs declarations for inputs often poses a problem because of the limited
availability of Customs offi cials. This process can take around 5-7 days.
15. The principal fi nancial risk faced by the fi rms was the variation in demand and pricing. Issues with
the logistics were not cited
16. The fi rms did not distinguish between cost, quality and uniqueness of product in terms of their
contribution to competitive advantage
17. The fi rms expect to grow their business through increasing volume. Only two indicated that
they contemplated increasing the unit value of the products they produce
18. The principal constraints to growth are the perceived lack of demand followed by diffi culties with
retaining skilled labor and securing adequate supplies of energy
19. Diffi culties with the inbound supply chain include the availability of inputs followed by customs
formalities. For the outbound supply chain, there are problems with certifi cate of origin and
customs formalities
20. Inputs are ordered as both single and multiple shipments
21. The order time for imported inputs range from 21 to 55 days with shipments ranging in value
between US$200,000 and US$900,000 or 4-12 TEU
22. Inputs are received on a weekly basis with shipments organized by the manufacturer who ships
them primarily on FOB basis
23. The fi rms operate in a duty-free zone and goods are kept there until the time they are exported
86 Improving Trade Competitiveness in Cambodia:
An Analysis Using a Trade and Transport Facilitation Assessment (TTFA)

24. The cost for moving the container from Sihanoukville port to the factories warehouse ranges
from US$715-US$905 which presumably includes the terminal handling charge; for exports
the range is US$470-US$1,000
25. A major cost of production is electricity. Depending on their size, factories spend between US$25,000
and US$117,000 per month
26. A typical shipment ranges in size from 1 to 20 containers. Shipment size depends on the size of
the fi rm and the season, but most fi rms will not accept shipments less than one container load
27. Products are shipped on a weekly basis
28. During the peak season between May and October volumes increased by 15-60 percent
29. The average value of export shipments varies from US$110,000 to US$325,000
30. Between 1 percent and 5 percent of the exports are shipped by air, the rest by ocean
31. Most shipments are arranged by forwarders
32. Trucking fi rms are given 5-7 days advanced notice for transport from factory to the port.
33. The average time from start of production to delivery to the ports is usually 2 weeks but can extend
up to 30 days.
34. Delays occur usually for 3-5 percent of shipments but one fi rm experienced delays in half of their
shipments. These delays are caused by problems in delivery of supplies and delays in production.
35. When a shipment is delayed, the fi rms notify the buyer and in some cases switch transport modes
36. The rate of rejection of shipments due to shortfalls or damage is 2 percent-5 percent with the result
that the buyer merely deducts the amount of the shortfall from the total payment
37. There are problems with obtaining information on current Customs regulations. Sources of
information include government, forwarders and GMAC
38. The fi rms use both forwarding agents and individual customs brokers to clear their goods fi rms used
39. Customs is seen as the biggest problem on both inbound and outbound supply chains
40. Imports are purchased through direct negotiation of contracts for a specifi c quantity, however,
all inputs are normally provided by the buyer.
41. Payments for imported inputs are made by arranging a specifi c time after shipment using time
drafts (TT). Only two fi rms used an L/C.
42. Typically the period of payment is 7-45 days after receipt of goods
43. Most communication with the buyer is through fax or e-mail
44. Four of the fi ve fi rms obtain funds to purchase the inputs by factoring the LC from the buyer
45. Payment for exports is received using a TT with a fi xed period after delivery of the goods to
the buyer’s warehouse. However, in some cases exports are paid according to a fi xed schedule.
46. The only cargo insurance is arranged by the freight forwarder.
47. None of the firms have a foreign exchange hedging strategy, potentially because they are
foreign-owned factories.
Flow chartsThe fi rms surveyed were all vendor factories. As a result they had very similar supply chains of which an
example is shown below. They did not have signifi cant cash fl ows because all transactions were handled by
their overseas headquarters. As a result the principal focus of the factory managers outside of production
was the domestic movement inputs and exports and the clearance of imported inputs and exports at the
international gateway, which in nearly all cases was the port of Sihanouk Ville.
87Improving Trade Competitiveness in Cambodia:
An Analysis Using a Trade and Transport Facilitation Assessment (TTFA)

Unloadfrom Vessel
Costs included in total below
Pay to FreightForwarder
Transport inputs to port
Ocean FreightCIF
Pay in cash at the Ministry
Inport Permit$35 per set 1-2 day
Letter of Credit
Procureinputs
Payment made byhead office
Process inputs
Payment made byhead office
Transport to
Vessel
Truck to factory WH same day as unloading and
clearance$715-905 per container
Invoice, Bill of lading,Packing list, Custom
Permit
Order
Annex Figure 29: Vendor factory fl owchart
88 Improving Trade Competitiveness in Cambodia:
An Analysis Using a Trade and Transport Facilitation Assessment (TTFA)

Production of export products
15-60 days
Scheduling containersfor export from factory 5-7 days
Truck to port within 1 day$475-1000 per container
CO is applied for when the goods are handed over to the
Freight Fowarder. It can be issued after the ship has departed.Offcially takes 3 days, but in
practice 5-10 days. Cost $25-35
Costs included in total above
Ocea.n FreightFOB
20.30 days
ExportMarkets
Store In factoryinventory for around
7-15 days, depends onproduction lead time
and order size
Loadonto Vessel
Seller
Buyer
Shipping Order/BooKing
Form
Pay to freightforwarder
Invoice. Packing list,Commercial DocumentsBill of lading certificate
of Origin
89Improving Trade Competitiveness in Cambodia:
An Analysis Using a Trade and Transport Facilitation Assessment (TTFA)


Annex III: Footwear
Global trade
Global Market and Centers of Production
Global revenue in the footwear industry has increased steadily. In 2005, it was about US$114 billion and
US$127 billion in 2010, implying and average annual growth of about 2.2 percent. The continuing global
fi nancial crisis has depressed this rate with growth in 2010 reduced to 0.8 percent. The impact of the economic
situation can also be observed within geographical regions. In 2010, for example, demand was noticeably weaker
in Europe’s periphery while demand in the US picked up in 2010 only to level off in 2011. Currently, China and
Japan are generating signifi cant growth in footwear consumption.34 Over the long term, a steady increase in
global shoe production is expected to continue driven both by population and increase in disposable income.
Because the production of footwear, especially shoes, requires a signifi cant input of semi-skilled labor, more so
than for the manufacture of garments, there has been a natural gravitation of the industry towards countries
that can offer the combination of skills and low wages. This led to the outsourcing of production beginning
in Japan in the 1970s. Since the 1980s, there has been a gradual shift in the center of production to Taiwan,
then South Korea and China. Now a further shift is the beginning to South Asia. Currently, most footwear is
manufactured in Asia, Latin America and Europe although the latter is declining sharply. The largest region
producing footwear is North Asia, with China producing about 7 billion pairs (2010) or 57 percent of the world’s
footwear production. The second largest producing region is South East Asia. Vietnam produced about 1
billion pairs in 2010 or around 8 percent of world production. Indonesia and Thailand were important shoe
manufacturers prior to the Asian fi nancial crisis and have only partly recovered since then.
South Asia accounts for about 9.6 percent of world production led by India, which has attracted many investors
from US, Europe and Taiwan. They are interested in producing mid-price shoes for both the domestic market
and for export. However, the growth rate for India is slower than for China. The second largest producer in South
Asia is Bangladesh, which is rapidly expanding its production.35 Latin American accounts for about 6.9 percent
of world production with the Brazilian footwear industry accounting for about 90 percent of the production.
Europe provides about 5.3 percent of global production. Italy produce premium-quality footwear accounting
for more than a third of Europe’s output. Low-cost producers have moved their factories to Eastern Europe,
but face strong competition from manufacturers in Asia. Turkey is also a major producer. The North American
footwear manufacturing industry has been in decline for several decades. In 2009, the US and Mexico accounted
for only 2.5 percent and 1.9 percent of the world production, respectively.36
The major markets for imported footwear remain North America, Europe and high-income countries in Asia e.g.
Japan, Taiwan, and Singapore. However, in the future, the share of total production consumed in these countries
will decline as consumption increases in China, India, Brazil and Southeast Asia, and other producing countries.
34 Adidas Annual report 2010.35 The largest shoe factory in the world is being constructed in Chittagong.36 Market and Trend Analysis (sent by John), page 2-11.
91Improving Trade Competitiveness in Cambodia:
An Analysis Using a Trade and Transport Facilitation Assessment (TTFA)

International Trade
International trade in footwear has increased signifi cantly as barriers to trade have been reduced and the relative
cost of international transport has declined. Also distribution networks have become more international as
consumer’s preferences changed.37
Demand for imports to the US has been relatively stable fl uctuating between 2 and 2.4 billion pairs between
2004 and 2010. The majority has been supplied by China (~85 percent) followed by Vietnam (~7 percent). The
remainder was source from 19 countries. Cambodia’s contribution, while still small, has grown from nothing in
2005 to over 3.2 million pairs.38
A similar picture can be drawn for the European market (EU-27). China is the leading supplier of footwear
products with a 72.6 percent market share followed by Vietnam with 11.9 percent. India and Indonesia are
also important suppliers with market shares of 3.1 percent and 2.7 percent respectively. In total, the EU-27
countries import about 2.5 billion pairs of shoes. Of this, Cambodia provided about 21.5 million, slightly less
than 1 percent of the imports.39
The rate of growth of China’s footwear exports has begun to slow in recent years, due to increasing wages,
increases in tariffs on imports to the EU, and efforts to diversify suppliers. This led to a migration of export
manufacturers to South East Asia, especially Vietnam, to take advantage of cheaper labor and production
costs. At the same time, India attracted investments from footwear manufacturers in the US, Italy and Taiwan.
While the trend for both the US and EU markets is a slow increase in the average price per pair for imports,
Cambodia has experienced a slight decrease in its average price for exports to the US but continues to export
higher value footwear than Vietnam and China. In Europe, Cambodia’s exports have experienced an increase in
average value and have remained at a higher level than China and Vietnam as shown in the fi gures below.
37 Market and Trend Analysis (sent by John)38 US Department of Commerce, http://otexa.ita.doc.gov/FLT/imports/cat10.htm39 Eurostat, http://ec.europa.eu/enterprise/sectors/footwear/files/statistics/footwear_en.pdf
World
China
Vietnam
Indonesia
Cambodai
2004
0,00
5,00
10,00
15,00
20,00
25,00
2005 2006 2007 2009 20102008
Annex Figure 30: Average import price of pair of shoes into the US market (US$ value per pair)
Source: US Department of Commerce and calculations by author.
92 Improving Trade Competitiveness in Cambodia:
An Analysis Using a Trade and Transport Facilitation Assessment (TTFA)

The decisions on where to produce the different categories of shoes depends on labor costs and two other
factors:
Type and availability of materials
Fashion component
The fi rst is an important consideration for the production of shoes with leather components since sourcing
higher quality leather is diffi cult and there is considerable competition. The production of hides and tanned
leather is typically a small-scale activity and most producing countries depend on local sources for a majority
of their production. Synthetic materials, including synthetic leather is relatively easy to obtain given the uniform
quality standards for different grades of synthetic resins, the scale of production and the concentration
of petrochemical plants in countries that are not major producers of footwear. Fashion is an important
consideration as it determines where design is executed. This has allowed high value producers such as Italy to
retain market share in terms of the value of exports. However, increasingly the production is being outsourced
initially through FDI and now through marketing arrangements.
The importance of these two factors varies with the different segments of the market, but is especially
important in the production of women’s footwear and athletic shoes.
20.00
15.00
10.00
5.00
0.002006
Extra-EU27
China
Vietnam
Indonesia
Cambodia
2007 2008 2009 2010
Annex Figure 31: Average import price of pair of shoes into the EU market (US$ value per pair)
Source: Eurostat and calculations by author.
93Improving Trade Competitiveness in Cambodia:
An Analysis Using a Trade and Transport Facilitation Assessment (TTFA)

Market segments
The footwear industry is segmented not only by the materials used but also by the end user. The general
categorization is as follows:
In terms of global revenues, women’s shoes are the largest product type with a 31.2 percent market share.
They have a very high fashion component and style changes regularly. In wealthier countries, woman purchase
multiple pairs for different occasions. Because a signifi cant portion of the value is in the design, these may be
designed and produced competitively in the developed countries, but increasingly production of even the
higher-value shoes are being outsourced to developing country producers.
Men’s shoes account for roughly 24 percent of global revenues. These shoes have a lower fashion- component
and therefore a longer shelf life. They can be mass-produced in countries with low-labor cost using less
sophisticated machinery. While synthetic leather has become an increasingly important segment of men’s
footwear, the demand for leather shoes remains strong and availability of leather limits the countries that can
compete in this segment.
Athletic footwear (both men and women) has become the most identifi able segment of the market. It is
dominated by a handful of international brand manufacturers, such as Nike and Adidas. These companies
design and market their products. They outsource the production but retain a signifi cant role in monitoring
production to insure the quality of the product and conformance with health and safety standards and good
labor practices.
Children shoes account for only 8 percent of industry revenue. While there is a growing segment that emphasizes
quality, design, and, brand, most of the market focuses on cost and durability. As a result, these shoes are
usually produced in countries with low labor cost.
Others account for about 8.2 percent of industry revenue. At the low-end are slippers (house slippers, slipper
socks and leather slippers). They represent 4.1 percent in terms of global revenues but much more in terms of
pairs. These are mass-produced in low-wage countries. At the mid-value level is safety footwear that typically
includes steel cap shoes, water shoes and. The remainders are niche products and include higher-value sport
shoes (ski shoes, football, ballet, hiking, golf, etc).
Annex Table 7: Product segment in footwear industry
Product types Percentage
Women’s shoes (excl. athletic) 31.2
Men’s footwear (excl. athletic) 24.0
Athletic shoes 20.2
Rubber and plastic footwear 8.2
Children’s shoes 8.0
Slippers 4.1
Protective footwear 3.3
Other 1.0
Source: IBIS World Industry Report 2010.
94 Improving Trade Competitiveness in Cambodia:
An Analysis Using a Trade and Transport Facilitation Assessment (TTFA)

Value propositionThe footwear market can be divided into sub-markets differentiated in terms of quality, cost and time for
delivery. The most basic division is based on quality. High-value footwear includes men’s leather shoes, women’s
shoes and internationally branded athletic shoes. These require high quality in terms of inputs, fi t and fi nish.
Design is also an important source of value especially for athletic shoes and women’s shoes. Quality control
is important throughout the supply chain, from sourcing of inputs through delivery to the buyer. The average
ex-works value of these products ranges from US$10 a pair and up. The buyers are larger brand manufacturers
or high-end retailers. Principal markets are Europe and North America although there is growing demand in
higher income developing countries, too. The logistics used for this segment emphasize high reliability both
inbound and outbound. On the inbound supply chain, consistency in the quality of inputs are critical whereas for
outbound it is important to deliver consignments with many different models and styles at fi xed delivery dates.
The mid-value products cover the fi ve basic types: men’s, women’s, kid‘s and athletic shoes, and specialty
footwear. These use a mix of materials, textiles, plastics (including synthetic leather) and rubber. The inputs
are mid-value but consistent in quality and the level of automation varies with product type and scale. The
designs are variations on standard designs. Buyers are wholesalers and large retail chains and logistics strike
a compromise between cost and reliability.
Lower-value footwear includes simple shoes and sandals produced from plastics. These use less expensive
inputs and are less durable. The designs are standard. Production of those allows for more automation as
well as higher volumes. The average value ex-works ranges between US$2-4 per pair. Buyers are primarily
wholesalers selling to low-end retailers. There is strong demand for these products both domestically and
for export but there is also strong competition from manufacturers in China. As for the logistics requirements,
volumes are large and value in terms of cost per pair is low. For inbound logistics, priority is given to
on-time delivery to support a lean production schedule. For outbound logistics, the volumes are large with
consignments having only a few models but a full range of sizes and colors and the emphasis is on minimizing
cost while maintaining reasonable delivery times.
Global production and employmentWhile the number of pairs of shoes produced between 2006 and 2010 increased by about 4.5 percent,
employment in the sector is estimated to have grown by about 6.5 percent. During this period wages as a
proportion of total revenues declined from 18.3-16.5 percent due to the migration of production to lower wage
cost countries continued. Premium-quality, high-value shoes continue to be produced in Western countries.
Based on value, nine European countries are among the top 15 exporters of footwear. Italy, Spain and Portugal
account for about 23 percent of total export value. On the other hand, most of the production in China, Indonesia
and other large manufacturing countries are predominantly low or low- medium value. Only a few countries
such as Thailand and Brazil produce med-high value shoes.
Footwear supply chainThere is a distinct division of activity in the footwear industry. Production takes place primarily in developing and
emerging market economies while design and marketing takes place in North America, Europe and East Asia.
Countries that were major production centers in the past e.g. South Korea and Taiwan, have managed to convert
themselves from domestic manufactures to managers of overseas factories and distributors of footwear
manufactured overseas. They are a signifi cant source of FDI for new factories in developing countries and
manage the distribution of branded products. Hong Kong and other trading centers act a buying agents and
wholesales for unbranded footwear produced by local manufacturers.
95Improving Trade Competitiveness in Cambodia:
An Analysis Using a Trade and Transport Facilitation Assessment (TTFA)

The brand is built and managed by global and regional headquarters with support from large distributors,
especially in less developed markets. The inputs, quality and design, are strongly related to the product design
and hence the marketing of the product.
Sourcing of raw materials is generally arranged at the manufacturing level subject to quality requirements
developed as part of the design. As indicated previously, the sourcing of leather is the most challenging. This
involves acquiring from slaughterhouses hides of suitable quality from various animals, tanning the hides (an
environmentally challenging process), and processing the leather to obtain a suitable fi nish. Acquiring and
tanning the leather is relatively low skill unlike producing fi nished goods.
Footwear productionThe sequence of footwear production begins with sourcing of material, accessories and components. The
suppliers include leather tanners, manufacturers of synthetic resins, canvas and other textiles, and producers
of insoles and outsoles, shoe lasts, and accessories. The insoles and outsoles are made of different materials
including rubber, PVC and polyurethane. These can be purchased in molded form (most common), pre-trimmed
in standard sizes or in uncut sheets. Shoe lasts are obtained from both local producers or imported. Materials
such as chemicals, buckles, threads, foam, etc., are usually sourced locally but include some imported materials.
The production sequence begins with preparation of samples either at the request of individual buyers or to
promote existing models. The designs may be obtained from the buyer, especially for high value footwear.
For footwear with a limited fashion component, manufacturers often revise existing designs sourced from
magazines, retail stores and other sources.
Once an order is received and confi rmed, procurement of materials begins. Only a few of the inputs are
maintained in inventory. First, the patterns and lasts are prepared for the required sizes. Once all inputs
have been delivered, production begins. The materials are cut based on patterns. This is done manually by
craftsman except for manufacturers handling very large orders. Machines are used for skiving and sewing.
The next step is the assembly process, which involves shaping the uppers on the lasts and attaching the
inner sole and then the outer sole. Once assembled, the shoe is taken for roughing, fi nishing and fi nal quality
checks before being shipped. Complete production of a pair of shoes normally takes two days. A typical
footwear fi rm using manual production produces an average of 1,000 pairs per day. This volume can increase
to 3,000-5,000 pairs with semi-automated processes. Large factories in China, Bangladesh and elsewhere
can produce over 10,000 pairs per day.
96 Improving Trade Competitiveness in Cambodia:
An Analysis Using a Trade and Transport Facilitation Assessment (TTFA)

An
ne
x F
igu
re 3
2: T
he
glo
ba
l va
lue
ch
ain
Fir
ms
Infr
as
tru
ctu
re
Ide
nti
fi c
ati
on
of
loc
al
reli
ab
le t
an
ne
rs,
imp
ort
ed
hid
es,
le
ad
tim
e t
o im
po
rt, fi
na
nc
ing
of
imp
ort
hid
es,
sh
oe
s
las
ts a
nd
co
mp
on
en
ts,
tra
nsp
ort
ati
on
se
rvic
es
Ac
cu
rate
cu
ttin
g o
f
ma
teri
als
ac
co
rdin
g
to s
pe
cs
(ma
jor
co
mp
on
en
t o
f p
rofi
t
ma
rgin
)
Tre
ein
g a
nd
pa
dd
ing
of
go
od
s p
er
ca
rto
n
De
live
ry t
o s
tore
s.
On
lin
e in
form
ati
on
wit
h r
eta
il o
utl
et
Te
lec
om
mu
nic
ati
on
Co
un
ter
se
rvic
e
Tra
nsp
ort
ati
on
se
rvic
e
Pro
cu
rem
en
t
Inb
ou
nd
ma
teri
als
So
urc
ing
ma
teri
al/
pa
rts
Pic
kin
g/d
eli
very
Inb
ou
nd
insp
ec
tio
n
Inb
ou
nd
re
ce
ivin
g
Inve
nto
ry m
ate
ria
l
Ma
na
ge
me
nt
Sto
rin
g
Sc
he
du
lin
g p
rod
uc
tio
n
Sch
edu
ling
su
bco
ntr
acto
rs
Eq
uip
me
nt
ma
inte
na
nc
e
Ma
teri
al/
par
t d
istr
ibu
tio
n
As
se
mb
ly M
on
ito
rin
g
Qu
ali
ty in
spe
cti
on
tes
tin
g
Re
wo
rkin
g
Pa
ck
ag
ing
De
live
ry/c
oll
ec
tin
g o
f
fi n
ish
ed
go
od
s fr
om
sub
- c
on
tra
cto
rs
Wa
reh
ou
sin
g O
rde
r
pro
ce
ssi
ng
Sc
he
du
lin
g o
f d
eli
very
to b
uy
ers
sto
res
Insp
ec
tio
n a
nd
de
live
ry
Bill
ing
/co
lle
ctio
n
Pa
ym
en
t
Pri
cin
g
Qu
ota
tio
n
Bu
yer
vis
it
Re
tail
sto
re
Dis
pla
y
Ne
two
rkin
g
Clu
ste
rin
g
Bra
nd
ing
Re
pa
ir/
as
se
ssm
en
t
of
da
ma
ge
d p
rod
uc
ts
Ma
in A
cti
vit
ies
Inb
ou
nd
Lo
gis
tic
sO
pe
rati
on
sO
utb
ou
nd
Lo
gis
tic
sM
ark
eti
ng
& S
ale
sS
erv
ice
s
So
urc
e: S
tate
of
the
se
cto
r re
po
rt, P
ea
rl 2
Pro
jec
t, P
hil
ipp
ine
fo
otw
ea
r, 2
00
3.
97Improving Trade Competitiveness in Cambodia:
An Analysis Using a Trade and Transport Facilitation Assessment (TTFA)

Cambodia’s footwear industryIn Cambodia, the footwear industry is relatively small consisting of about 37 export-oriented factories. Most
are owned by investors primarily from China, Taiwan, Hong Kong and Japan. In recent years, the number of factories
has increased rapidly. Twenty plants have been opened since 2008, most of them in the past two years that
were branches of existing fi rms. Over the next fi ve years, the industry is expected to continue its expansion,
growing by another 50-80 percent. Most of the plants are located in Phnom Penh and Kandal Province. Total
production is around 50 million pairs, less than 0.4 percent of total current world production.
Most factories are merely production facilities managed by their owners, who also control the input supply
chain. However, some of the facilities operate as OEMs and produce products directly for the buyers.
These factories produce primarily leather shoes as shown in Figure 33. The average value per pair has been
increasing (Figure 34) but remains very low at about US$4.25 per pair. Textile shoes have an average value
of US$9, which still relatively low. The typical factory has about 1,500 employees but some manufacturers
employ up to 6,000 workers. Total employment in the sector amounts to around 70,000. Wages are slightly
higher than in other industrial sectors because it is more diffi cult to fi nd and retain qualifi ed personnel. The
average monthly wage is US$61 base wage and US$30-40 in overtime and bonuses. These are slightly
higher than in China. Average productivity per worker is between four and eight pairs per day.
350
250
150
100
50
0
300
200
2001 2002 2003 2004 2005 2006 2007 2009 20102008
Plastic Leather Textile
Mil
lio
n U
S$
Annex Figure 33: Cambodian footwear exports by product group 2001-10 (mirror data in US$ million)
Most of the inputs including soles and the leather for the upper parts are imported. In 2010, the Cambodia
customs reported exports of footwear amounting to about US$180 million. The data from the importing
countries indicated about three times this amount. Some of the discrepancy can be explained by the difference
between FOB and CFR prices, but it still suggests a signifi cant under-reporting. More importantly, there is a
signifi cant difference in terms of commodity classifi cation, primarily for plastic/synthetic footwear. Both sets
of data indicate the dominance of leather shoes, but the mirror data suggests a growing proportion of plastic
and textile footwear.
The EU is the principal destination accounting for around 60 percent of total exports. The United Kingdom
(23 percent), Germany (15 percent) and Italy (6 percent) are the largest individual markets within the EU. Other
large buyers are Japan (16 percent) and the United States (9 percent). Most of the shoes produced are casual
shoes, sports shoes and sandals with some waterproof and safety shoes. Around 60 percent of all shoes are for
woman, 30 percent for men and 10 percent for children. About 80 percent are made with leather uppers and 10
percent each for synthetic and textile uppers. There is only little variation in demand by season.
98 Improving Trade Competitiveness in Cambodia:
An Analysis Using a Trade and Transport Facilitation Assessment (TTFA)

550 225
200
175
150
125
100
75
50
500
400
300
100
50
450
350
250
150
200
2001 2002 2003
Mirror Data
Mir
ror
Da
ta M
illi
on
US
D
Ca
mb
od
ia D
ata
Mil
lio
n U
SD
Cambodia Data
2004 2005 2006 2007 2009 20102008
25
Annex Figure 34: Cambodian footwear exports, 2001-10 (mirror data and Cambodian Customs data
in US$ million)
Source: UN-Comtrade, 2012.
Characteristics of fi rms surveyed 1. The fi ve factories surveyed are all production facilities for foreign vendors who manage the orders
from the buyers.
2. These factories use imported leather and fabric obtained from Asian sources, primarily from East
Asia, China, Taiwan and South Korea.
3. The leather is obtained directly from the tanneries whereas the fabric is ordered from suppliers
nominated by the buyers.
4. The principal diffi culty with the inputs is the consistency and quality especially for the leather. This
delays production and deliveries.
5. These factories produce a mix of products but generally specialize in one or two, e.g. men’s shoes,
women shoes, kids shoes.
6. The principal destinations for exports are Japan and the EU.
7. Most of the output is purchased by the factory’s foreign headquarters rather than directly by
the buyers.
8. The products are produced against fi xed orders and manufactured ready for retail.
9. The shelf life of the products is 3-6 months refl ecting seasonal demand.
10. Order cycle from when the initial order is confi rmed to when the fi rst shipment is loaded onto
the vessel is 60-90 days for new orders and 30 days for repeat orders. Another 12 to 20 days is
required for the transport by ocean to the importers warehouse.
11. During peak periods, the increase in orders are handled by extending the working hours.
12. The percent of shipments outside the region that use airfreight varies from less than 3 percent
for three of the factories to 10-20 percent for the other two.
99Improving Trade Competitiveness in Cambodia:
An Analysis Using a Trade and Transport Facilitation Assessment (TTFA)

13. Payment for exports account received within 7-30 days after shipment, either ex-factory or when
the goods are loaded on the vessel.
14. The documents that present the greatest problem are the permits and technical certifi cates for
the imported inputs. The time for obtaining the permits is supposed the only one day but normally
takes 3-5 days.
15. For the exports there are diffi culties with both the certifi cate of origin and the customs declaration.
For the former there are additional problems associated in with correcting minor mistakes. For
the latter customs will clear could setup factory.
16. The major fi nancial risks are those associated with not only fl uctuation demand and prices also
fl uctuation in exchange rates.
17. The current approach to growing the business is to increase the volume of orders by improving
the quality of the product, reducing the cost and speed of delivery. The reduction in cost includes
the transport costs although these are not major cost components.
18. The principal factors limiting the growth of the factories are the availability of skilled labor and
reliable energy.
19. Financing for investment and working capital are not important since this is the responsibility of
the headquarters.
20. The factories varied in terms of the amount of imported inputs delivered by air. The maximum was
60 percent for one of the factories but two of the others use no airfreight.
21. The average time for delivery of the imported inputs was 30-45 days.
22. Some of the orders involve multiple shipments.
23. These shipments are received on a weekly basis.
24. Shipments are arranged by the supplier but are shipped FOB.
25. These inputs are imported duty-free.
26. The smallest size shipment of exports is 1-2 TEU or 3,000-5,000 pairs.
27. An average shipment has a value between US$110,000 and US$550,000.
28. Exports are shipped on a weekly basis.
29. Peak shipments occur between June and October when the volumes shipped increase by 45-100
percent.
30. All shipments arranged by forwarders or shipping lines and nearly all are shipped in containers
which are loaded at the factory.
31. In general 5-7 days were required to arrange the domestic transport to the ports/airport.
32. Delayed shipments were 5 percent or less for three of the factories but 20-50 percent for the other
two with the principal cause being delays in receiving inputs often complemented by delays
in production.
33. When this occurs, the factory notifi es their headquarters which in turn informs the buyer.
34. Only one of the factories reported having a high rate of rejection of their shipments due to damage
or shortfalls. This results in an average discount of 8 percent on the payment.
35. The principal certifi cation for the exports is the certifi cate of origin which requires 3-5 days to obtain.
36. The inputs are ordered through long-term contracts.
37. Typical value for inputs range from US$15,000-US$55,000 per container.
100 Improving Trade Competitiveness in Cambodia:
An Analysis Using a Trade and Transport Facilitation Assessment (TTFA)

38. These are paid for using a TT with payment made at the time of delivery to the forwarder’s warehouse
or the vessel or a specifi ed time thereafter, 15-40 days.
39. Most orders are handled through fax or e-mail.
40. The cost of delivering the container from the port to the factory is US$400-US$700 for 20-foot
container and US$600-US$1,000 for a 40 foot container.
41. A similar cost is incurred for the movement of the goods from the factory to the loading ports/
airport.
42. Cargo insurance is arranged by the forwarder.
Supply chainThe supply chain for a vendor factory is shown in the following fl owchart.
101Improving Trade Competitiveness in Cambodia:
An Analysis Using a Trade and Transport Facilitation Assessment (TTFA)

Unload Transfer
Vessel
Costs included
in totall below
Pay to Freight
Forward et
Transport inputs to
port
Ocean Freight
CIF
Pay in cash at the
Ministry
Inport Permit
1 day processing $90
3-5 day processing $40
Letter of
Credit
Procure
inputs
Payment made by
head office
Process inputs
Payment made by
head office
Transport to
Vessel
Truck to fractory WH
with 1 day
$400-684.43 for 20’
$600-1010 for 40’
Invoice, Bill of lading,
Packing list Custom
Permit
Order
Amtex Figure 35: Supply chain fl owchart
102 Improving Trade Competitiveness in Cambodia:
An Analysis Using a Trade and Transport Facilitation Assessment (TTFA)

Production of export products
15-45 days
Scheduling Containers for Export from
Factory 7-14 days
Truck to PortWithin 1 day
$4.25-475 for 20’ $700-800 for 40’
CO is applied for when the
goods are handed over to the
Freight Fowarder. It can be issued
after the ship has departed.
Offcially takes 3 days, but in
practice 5-7 days. Cost $90-100
nomally and $250-300
fore express (1-2 day processing)
Costs included in total above
Ocea.n FreightFOB
20.30 days
Export Markets
Store In factory
Inventory for
around 7 days
Load ontoVessel
Seller
Buyer
Shipping Order/BooKing
Form
Pay to FreightForwarder
Invoice. Packing list,
Commercial Documents,
Bill of lading certificate
of Origin
103Improving Trade Competitiveness in Cambodia:
An Analysis Using a Trade and Transport Facilitation Assessment (TTFA)


Annex IV: Silk
Global production and trade
ProductionSilk production has its origin in China, where it is produced for a few hundred years. Today more than 60 countries
in the world produce silk. Most producers are located in Asia, which accounts for roughly 90 percent of mulberry
production and almost 100 percent of non-mulberry silk. However, in recent years, mulberry silk production
has also been established in less-traditional silk countries such as Brazil, Bulgaria, Egypt and Madagascar.40
The role of developing countries has increased strongly in the production of silk over the past decades. The silk
sector employs an estimated 1.8 million people, mainly in rural areas. More than half of them, around 1 million,
produce silk in China. Silk production is particularly important to rural areas, as not much land or capital is
required. Also sericulture provides an income opportunity for woman and older family members and therefore
counteracts urbanization.
As can be seen in the chart above, global silk production is by far dominated by China and India (both by value
and weight). Together they accounted for a production of about 124,000 tons in 2009. The next largest producer,
Uzbekistan, Brazil, Thailand and Vietnam produced a total of only 2.8 million tons.41 Cambodia produced
somewhere between 250 and 350 tons.
International trade
A large portion of silk production is consumed locally, however, there is signifi cant trade in intermediates
with cocoons exported to producers of silk yarn, silk yarn exported to produce of silk textiles and silk textiles
exported to producers of silk garments. Even countries such as India, which produce the full range from cocoons
to garments, import a signifi cant level of intermediate goods. Most large producers of silk textiles, with the
notable exception of China, import silk yarn. Countries such as Thailand and India do so in order to supplement
their own production.42
00
0 T
on
s
180
160
120
60
80
40
20
0
140
100
2005 2006 2007 2009(P)2008
Other
India
China
00
0 T
on
s
3
2.5
1.5
0
0.5
2
1
2005 2006 2007 2009(P)2008
Japan
Korea
Vietnam
Thailand
Annex Figure 36: World raw silk producing countries, 2005-09
Raw Silk Production Other Asian Raw Silk Producers
Source: Silk industry in China, ISC Website (January 2010).
40 http://www.fibre2fashion.com/industry-article/38/3793/the-global-silk-industry1.asp41 FAOSTAT 200942 Thai silk sector analysis, p. 34
105Improving Trade Competitiveness in Cambodia:
An Analysis Using a Trade and Transport Facilitation Assessment (TTFA)

The global trade in silk can be divided into four categories: cocoons, raw silk, silk textiles, and fi nished
silk products. The growth in trade of the fi rst two categories is shown in Figures 37 and 38. In the last ten
years, trade in silk yarn has fl uctuated between 10,000 and 16,000 tons with values between US$240 and
US$390 million.
The trade in silk textiles grew rapidly up until the global fi nancial crisis but appears to be recovering as shown
in Figure 39. The trade in silk apparel has grown along with the growth in apparel but at a slower rate due to
limitations on supply. Sill textiles and apparels remain a luxury good and account for a very small portion of
the global trade.
The largest exporter of silk yarn and silk products is China, which accounted for more than half of the trade in
2010. China remains he leading source of silk yarn, but is increasing its exports of fi nished products. The next
largest exporters are Italy and India, accounting for roughly 11 percent and 10 percent by value, respectively.43
Cambodia has a minimal market share of silk trade, less than 0.05 percent.
Cambodia’s trade in silk products increased from US$2.2 million in 2001 to US$3.2 million in 2010, (Figure 40).
In reached a record-high of US$3.5 million in 2009, but has since declined due to the current sovereign debt/
Euro crisis.
16
14
18
10
6
4
2
0
12
8
4
3
5
1
2
0
1999
Ra
w S
ilk
, o
oo
me
tric
to
ns
Raw Silk Silkworm Cocoons
Co
co
on
s,
oo
o m
etr
ic t
on
es
2000 2001 2002 2003 2004 2005 2006 2007 2008 2009
Annex Figure 37: Value of global raw silk and cocoon trade
Source: FAOSTAT, 2011.
Raw Silk Cocoon
Mil
lio
n U
S$
Co
co
on
360
320
400
240
160
120
80
40
0
280
200
Mil
lio
n U
S$
Ra
w S
ilk
1999 2000 2001 2002 2003 2004 2005 2006 2007 2008 2009
14
10
6
4
2
0
12
8
Annex Figure 38: Weight of global raw silk and cocoon trade
Source: FAOSTAT, 2011.
43 UN Comtrade.
106 Improving Trade Competitiveness in Cambodia:
An Analysis Using a Trade and Transport Facilitation Assessment (TTFA)

3.0
2.5
2.0
1.5
1.0
0.5
0.0
2002 2003 2004 2005 2006 2007 2009 20102008
Bil
lio
ns
US
$
3.0
3.5
4.0
2.5
2.0
1.5
1.0
0.5
0.0
20022001 2003 2004 2005 2006 2007 2009 20102008
Mil
lio
n U
S$
Annex Figure 39: World trade in silk fabrics
Annex Figure 40: Cambodian silk exports
Source: UN-Comtrade, 2012.
Source: UN-Comtrade, 2012.
Production processThe silk production process is complex and involves a diverse set of activitie (Figure 41). The production
cycle can be divided into sericulture, production and distribution. The former represents the inbound supply
chain that delivers silk yarn for weaving. Production refers to weaving and the manufacture of textiles
and garments. Distribution refers to the outbound supply chain and includes marketing and can include
downstream value addition.
The activities in the inbound supply chain are shown in the diagram below. It begins with the production of
cocoon and the reeling of silk yarn. There are three types of silkworms commonly used for producing cocoons.
Native mulberry silkworms are traditionally produced by farmers and are based on egg stocks that are
maintained by the farmers themselves. The native silkworms offer low cost and greater disease tolerance but
have lower yields than other varieties. These are used by small-scale farmers to supplement their income.
107Improving Trade Competitiveness in Cambodia:
An Analysis Using a Trade and Transport Facilitation Assessment (TTFA)

Mulberry Tree
Silkworm
Raising
Cocoon
Production
Silk Reeling
Degumming
Dyeing
Weaving
Made up
Annex Figure 41: Production process of silk
Foreign hybrids (bivoltine) produce larger, usually white cocoons that can be reeled in factories. The eggs can
usually be hatched at any time. Their silk fi lament can be as long as 1500 meters and therefore has a high
yield that provides quick return. However, the eggs are expensive and are more susceptible to diseases so that
breeders must be trained in their use. These hybrids are promoted by private companies and used by medium-
sized farmers who breed silkworms commercially.
Local hybrids (poly-bivoltine44) are
inexpensive but limited in supply. In
addition, their quality is inconsistent and
they are more susceptible to diseases.
These are promoted by government and
used primarily by small-scale farmers
but in some cases are used in commercial
breeding.
Most of the world production of silk (90
percent) is obtained from bivoltine, which
has the same agricultural schedule and
the same intake of mulberry leaves, but
generates a thread over ten times longer
and enable the mechanization of the
various stages production. In Southeast
Asia, the traditional variety is “Bombyx
mori”, also referred to as Golden Silk
because of the color of the cocoons. This
is usually a polyvoltine hybrid.
The primary inputs to the production of the cocoons are the silkworm larvae and the mulberry leaves to feed
the silkworms. Improved varieties that produce many more leaves have been introduced but they require
improvements in cultivation techniques and irrigation.
Silkworm cocoons are purchased from the breeders by reelers who produce the yarn. The reeling technology
depends on the type of silkworms. Traditional and poly-voltine varieties require hand-reeling, while foreign
bivoltines can be machine-reeled. The difference can be seen both in terms of quality and quantity: hand-
reeling produces a lower yield of uneven yarn. After reeling, the silk de-gummed, bleached and dyed. Traders at
the village level act as a middlemen between reelers and dyers in their village or within short proximity of their
village. Provincial and district traders then sell the yarn to weavers.
The production of fabric and garments is organized as a traditional cottage industry or as a small scale
commercial activity. For the former, the breeders reel their cocoons, weave the yarn ad produce silk fabrics,
usually on handlooms. This type of arrangement is maintained in relatively few countries, specifi cally India,
Thailand, Indonesia, Lao PDR, and Cambodia. For the latter, the breeders sell the cocoons to silk reeling
factories, which then sell it to weavers either directly or through a trader.
44 Bi-volitine refers to silkworks that can have two generations per year. Polyvoltine, also called multivoltine, refers to silkworms that can have more than two
generations (life cycle) in a year.
108 Improving Trade Competitiveness in Cambodia:
An Analysis Using a Trade and Transport Facilitation Assessment (TTFA)

The weavers may be individual craftsmen but are more often part of cooperatives or employees of private fi rms
manufacturing silk handcrafts. Depending on the silkworm, weaving can be done with traditional handlooms,
modernized handlooms, or semi-automatic looms. Local traders sell the dyed yarn to small producers or a spot
basis while provincial or district traders sell to lager producers under longer-term arrangements. Some of the
larger traders may also be involved in the production of textiles.
From the weavers the silk product goes to garment manufacturers or home textile producers. These have
different levels of involvement in the supply chain. The larger ones generally exert greater control over
the supply chain (starting from the silkworm production), while the smaller ones limit their involvement to
purchasing silk from weavers or traders.
There are several types of products that can be made from silk or silk blends including home textiles and
interior decorations, fashion garments and accessories, and both modern and traditional garments. These are
sold primarily in medium and high value markets. The principal distribution channels are local stores and hotels
that cater to tourists, Internet sales and foreign boutique outlets and small chains.
Annex Table 8: Models for silk production
Cooperatives silk handcraft cottage enterprise Private silk handcraft cottage enterprise
Silk Yarn Purchasing: The groups buy silk yarns
from members who reared silkworm and reeled
silk yarn, farmers’ groups from other villages, and
reeling factories. Beside the silk yarns, other inputs
such as dyes and chemicals are also purchased by
groups.
Silk Yarn: There are two types of silk yarn used in
the factories:
- hand reeled yarn from the farmers;
- silk yarn from reeling factory;
- machine reeled yarn.
Reeling factories provide twisting and doubling as
well as dyeing the yarn for weavers.Silk Yarn Processing: The silk yarns, produced need
to rewinding, doubling and twisting before the
degumming process.
Design: There are two ways to design products.
The fi rst is individual design where farmers’ groups
provide silk yarns to members who design patterns
and color by themselves. Most of their products
are traditional designs, which are followed by
generations. The members have their own designs
and special skills according to their wisdom and
knowledge. The Government trains them on new
techniques, which they can then apply to their
works, to improve product quality.
The second way is to provide custom designs and
colors, where weaving groups process products
according to their orders. There are many types
of traditional silk handcrafts that are produced by
these groups. However, about 20 percent of the
total silk products are modern silk fabrics such as
plain and batik silk fabrics.
Products: The main products are traditional
fabrics, modifi ed fabrics for home textile, plain
fabrics, batik fabrics, printing fabrics, carpets
and rugs, garments and silk products.
Design Pattern: Medium scale silk handicraft
factories, which have a section to design patterns
and colors of products, both apply traditional and
modern patterns. Some patterns are custom-
designed for individual orders. Often designers use
computers to produce high quality output. Small
factories do not have a design section, instead the
owner does it.
109Improving Trade Competitiveness in Cambodia:
An Analysis Using a Trade and Transport Facilitation Assessment (TTFA)

Degumming/Dyeing: Both of chemical and natural
dyes may be used by the groups. After products are
designed, the members receive dyes and chemicals
from the groups for chemical dyes.
However, members need to prepare raw materials
by themselves for natural dyes. Skeins of
processed silk yarn are degummed and dyed.
Degumming and dyeing: At the degumming and
dyeing stage, low cost equipment is mostly used
by small silk handicraft cottage factories. Medium
scale factories often invest in automatic dyeing
machines, which produce higher quality of dyed
yarn than typical dyeing machines.
Weft Yarn Preparation: After fi nishing with dying,
the strings are then untied and the thread wound on
small spools. The small spool is put one by one into
shuttle as in order at the fi nal stage of weft yarn
preparation.
Warp yarn preparation: Warp yarn is produced by
wounding it on a wooden board with knobs around
which yarns are led so that a length of warp can
be obtained without tangles. The number of warp
yarns is related to specifi c beaters that are used for
weaving. In the next step, the warp yarn is removed
from the frame and each yarn is subsequently
passed through the string heddles by twisting it
together with the warp end left from
the previous weaving.
Weft: Factories hire laborers to do yarn
preparation in the factory. They may use
motorized winding equipments.
Warp: The same method of warp preparation as
model 1 is adopted by small-scale silk handicraft
cottages. A warp preparation tool is used in
medium scale silk cottages.
Weaving: Typical hand looms are used to weave.
The looms are located in individual member‘s
houses, only 5– 10 looms at group’s offi ce for
demonstration. The members weave fabrics in
their homes and the fabric is collected and sent
to the group where it is checked for length and
quality and stored.
Loom: Handicraft cottages industries use traditional
loom/ hand throwing shuttle handloom or fl y shuttle
handloom. Traditional handlooms with low weav-
ing speed and are used for delicate patterns and
designs of traditional fabrics. A fl y shuttle loom is
used in industrial weaving because it is about 2-3
times faster than a traditional loom. However, fl y
shuttle looms cannot be used for complex designs
or patterns.
Weaving management: The factories employ
laborers to weave fabrics at the factory. Wages
are paid according to meter of fabrics woven and
according to design/pattern. However, factories
also make informal contracts with weavers outside
their employees to weave fabrics. The weavers
usually have experience of at least six months and
receive further training at the factory . Contract
weavers work at home on their own looms. The
factories are in full control of the production
volume and home producers are required to fi nish
their job at a certain time. Contract weaving is
widely adopted because it requires less capital for
investment than other systems. However, a good
relationship between the factory and contract
weavers is critical.
Quality Control: Within this process all woven silk
fabrics, both those weaved by factory weavers and
home weavers, are checked for number of meters,
patterns, design, texture etc.
110 Improving Trade Competitiveness in Cambodia:
An Analysis Using a Trade and Transport Facilitation Assessment (TTFA)

Processing: Silk fabrics are sent to fi nishing factory
or shops for fi nishing. Most SMEs do not have silk
fabric fi nishing section.
Printing: SME factories do not have printing
facilities because of the high capital cost.
If printing
is required, the fabrics are sent to a printing factory.
The printing factories usually have patterns for
weavers to select from. They charge according to
pattern and by the number of meters.
Finishing: Woven fabrics are sent for the fi nishing
process to a fi nishing factory. The cost of the
fi nishing process depends on the number of meters.
Garments: Most weaving factories have a direct
partnership with a retail outlet. The garment shops
order silk fabrics from weaving factories which they
design and process.
Marketing: The prices are set based on the
complexity of design and labor input.
Marketing: The markets for silk fabrics, garments
and products are mainly for export, wholesale
and outlets with small volumes sold domestically.
Adapted from “International Workshop on Silk Handcrafts Cottage Industries and Silk Enterprises Development in Africa, Europe,
Central Asia and the Near East”, Second Executive Meeting of Black, Caspian seas and Central Asia Silk Association (BACSA),
Bursa, Turkey, 6 -10 March 2006
Annex Table 9: Number and location of Cambodian silk weavers, 2010
Area Number Weavers Specialization
Takeo 12,584Hol (86 percent), Plain Fabrics (8 percent),
Krama (6 percent)
Kandal 4,513 Phamuong , Chorobab, Lberk
Kampong Cham 770 Hol (95 percent)
Prey Veng 2,037 Plain Fabrics/Organza (83 percent), Krama (17 percent)
Northwest Area 321 Plain Fabrics, Blanket, Krama (70 percent)
Source: Khmer Silk Villages (April, 2010)
Cambodia’s silk industryCambodia participates in all three activities of the silk trade. At present there are about 1300 breeders and
160 hectares of mulberry trees that produce approximately 5 metric tons of silk yarn per year. This is
considerably less than the 50 metric tons produced during the 1950s. The loss in production is due in large part
to low productivity in silk production and higher returns from other crops. However, the number of breeders has
increased slightly in recent years are shown in Figure 42.
111Improving Trade Competitiveness in Cambodia:
An Analysis Using a Trade and Transport Facilitation Assessment (TTFA)
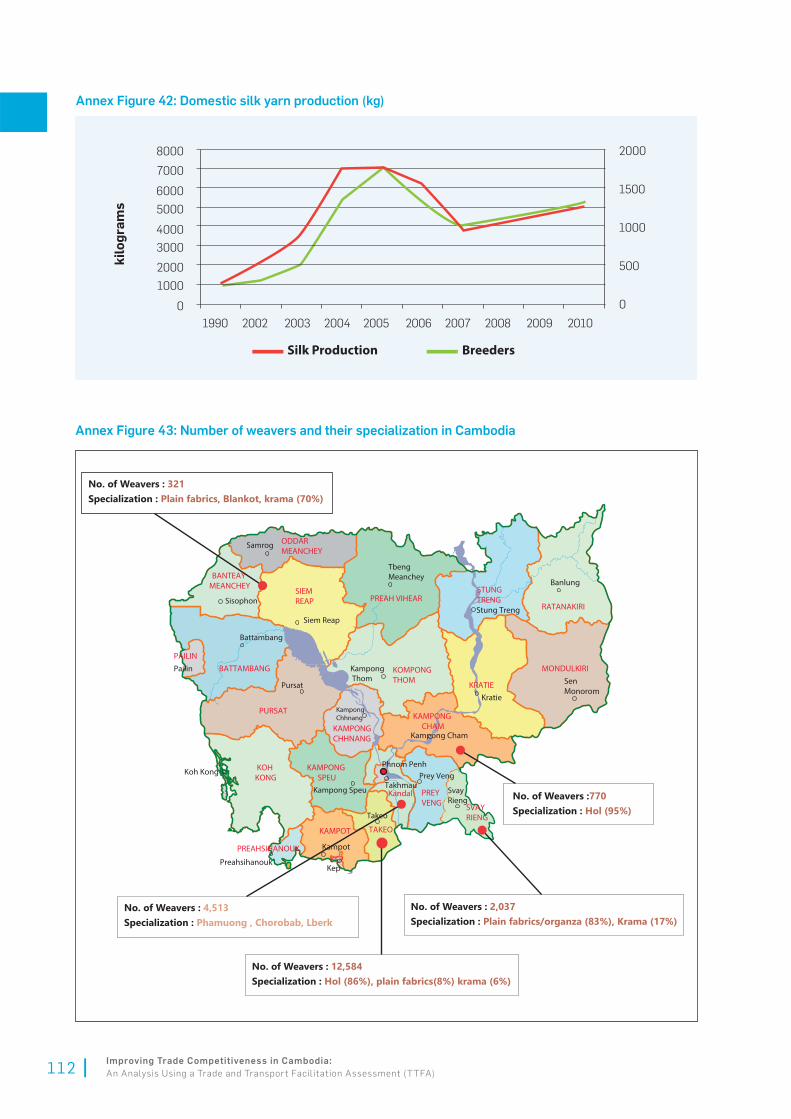
Siem Reap
SIEM REAP
Samrog ODDAR MEANCHEY
Tbeng Meanchey
PREAH VIHEAR
Kampong Thom
KOMPONG THOM
MONDULKIRISen Monorom
KAMPONGCHHNANG
KOH KONG
Kampot
KAMPOT
BANTEAY MEANCHEY
Sisophon
Battambang
BATTAMBANG
Pursat
PURSAT
KandalTakhmau
Svay Rieng
PREY VENG
Takeo
TAKEO
Kampong Speu
KAMPONG SPEU
Preahsihanouk
RATANAKIRI
Kampong Cham
No. of Weavers : 321Specialization : Plain fabrics, Blankot, krama (70%)
No. of Weavers :770Specialization : Hol (95%)
No. of Weavers : 2,037Specialization : Plain fabrics/organza (83%), Krama (17%)
No. of Weavers : 12,584Specialization : Hol (86%), plain fabrics(8%) krama (6%)
No. of Weavers : 4,513Specialization : Phamuong , Chorobab, Lberk
Kratie
Banlung
KRATIE
Stung Treng
STUNG TRENG
Kampong Chhnang KAMPONG
CHAM
Phnom Penh Prey Veng
SVAY RIENG
KEPKep
PREAHSIHANOUK
Koh Kong
Pailin
PAILIN
Annex Figure 43: Number of weavers and their specialization in Cambodia
6000
7000
8000
5000
4000
3000
2000
1000
0
20021990 2003 2004 2005 2006 2007 2009 20102008
kilo
gram
s
2000
1500
1000
500
0
Silk Production Breeders
Annex Figure 42: Domestic silk yarn production (kg)
112 Improving Trade Competitiveness in Cambodia:
An Analysis Using a Trade and Transport Facilitation Assessment (TTFA)

The region most suitable for mulberry tree cultivation is in the northwestern region in Oddar Meanchey and
Preah Vihear provinces and in the eastern region in Prey Veng, Kampong Cham, Kratie, Stung Treng, Rattanakiri,
and Mondulkiri provinces. Some mulberry plantations have been established in Banteay Menachey and Siem
Reap provinces.
Production of the yarn is concentrated in the Northwest while the weaving of the yarn takes place in the south
(see map). The total number of weavers is estimated to be between 18,000 and 20,000, most of whom are
concentrated in fi ve areas: Takeo, Kandal, Kampong Cham, Prey Veng and the Northwest area (Figure 42).
Cambodia produces about 2.4 million sq m of fabric, which requires it to import about 400 metric tons of the
silk yarn. The yarn is sourced from Vietnam with smaller amounts from China and Uzbekistan. Gross output of
the sector is about US$50 million, of which about US$25 million represent the cost of yarn import. Most of the
production is for domestic consumption. Less than 10 percent is exported.
The majority of manufacturers of fi nished products are located in Phnom Penh. The sector is dominated by
small producers and NGOs but there are also a number of joint ventures and foreign-owned companies.
Their capacity for design and product and market development is limited.
Thai silk industry45
Most of Thailand’s silk is destined for the domestic market (about 70 percent). The rest is exported and consist
of intermediate products such as silk fabrics and yarns (64 percent of exports) and fi nished goods including
garments and accessories (24 percent) and home textiles (12 percent). The value of its exports is around
US$31 million.
Thailand has two silk supply chains, one for polyvoltine (producing multiple generations in a year) and one
for bivoltine (producing two generations per year). These are used to produce hand and machine reeled yarn.
Polyvoltine varieties cannot be machined reeled and are rougher and thicker, whereas bivoltine varieties can
be machine woven. Thailand produces only about 1,400 tons of silk yarn per year. Of this about 1,080 tons are
handicraft production from polyvoltine and poly-bivoltine cocoons, while 320 tons are industrial production
from bivoltine cocoons.
The supply chain for the former starts with the production of cocoons by rearers farmers. The three main
stages of processing, cocoon rearing, yarn reeling and weaving are all performed at the farm level. About
117,000 farmers produce an average of 80kg of cocoons. About 15kg of cocoons produce about 1kg of yarn of
which 60 percent is sold to traders and the remaining 40 percent is degummed and woven into fabric. Thus
the total yarn available for weaving on traditional wooden looms is around 265 tons, which produces about 1.15
million yards of woven fabric or 4.3 yards per kg of yarn. Some 30 percent of this is kept for own consumption
and combined with 180 thousand yards of fabric coming from the poly- bivoltine chain to produce more than
half a million yard yards for domestic consumption. The other 70 percent of fabric produced in the polyvoltine
marketing chain is sold to small fabric traders who also purchase fabric from the poly-bivoltine chains. Half of
the about 1.225 million yards is sold.
The polyvoltine cocoons are reeled by hand and used for weft yarn. Machine reeling is done in factories using
bivoltine cocoons purchased from contract farmers to produce both weft and warp yarn. Most of the weft yard
is produced locally while a signifi cant portion of the warp yarn is imported (often smuggled) from China and
Vietnam, The power loom sector dominates the production of fabric in the country, accounting for more than
90 percent of the total fabric production.
45 Source: This section draws heavily from “The Case of Thai Home Textiles: Building Export Competence of a SME Dominated Value Chain”, Chiang Mai University,
November 2007, www.value- chains.org/dyn/bds/docs/657/ThailandSilk071107.pdf
113Improving Trade Competitiveness in Cambodia:
An Analysis Using a Trade and Transport Facilitation Assessment (TTFA)

The poly-bivoltine supply chain involves bout 31,500 breeders that produce about 130kg of cocoons per farm
and sell around 70 percent of their yarn. Most is sold to other farmers who reel weft yarn. Only about 15 percent
is sold to reeling groups and reeling factories. After degumming their yarn the poly- bivoltine producers have
around 80 tons of yarn to weave. This is augmented with another 40 tons of yarn purchased from local traders
and woven to produce about 5 yards of fabric per kilogram of yarn. About two-thirds of the fabric is then is sold
to small traders.
The traders combine the fabrics from poly-voltine and voltine silk and sell about half through street vendors
and the rest through formal retail trade.
Thailand has also evolved two general business models based on village-level production of the silk yarn.
One relies on a cooperative and the other on a private fi rm to organize the production and sale. The marketing
channels are similar but with slight differences as shown in Table 10.
Annex Table 10: : Markets for different business models
Cooperatives silk handcraft cottage enterprise Private silk handcraft cottage enterprise
Export
Factories obtain their export order through
international fairs, outlets and e-commerce.
Weaving factories join international road
show and trade fairs which are promoted by
the government.
Wholesale
Producers sell their products directly to
traders, silk processing shops, and exporters.
Then they order their products from networks
with SMEs in the local area.
The traders buy silk fabrics as a raw material
and process it into fi nished goods.
The exporters make patterns and designs and
order production of the products for delivery at
a fi xed date.
The main customers for wholesale are traders, silk
processing shops, garment factories and exporters.
They purchase fabric through formal and informal
orders.
Factories receive orders through their
website, international and local trade
shows and retail outlets.
Retail
Silk fabrics are sold through street vendors and
formal retail trade. Most of SME silk handicraft
producers establish outlets to present their
products for order and sale. Tourists and local
people are the main customers.
The formal retail trade is the most important
market. Several fairs and exhibitions are organized
by government both at national level and
provincial level.
Most factories have outlets in the capital, big
cities, resorts etc. to present their products.
Tourists, local people are the main customers.
Some weaving factories have their outlets in
the fairs for marketing.
114 Improving Trade Competitiveness in Cambodia:
An Analysis Using a Trade and Transport Facilitation Assessment (TTFA)

Characteristics of fi rms surveyed1. Three small producers of silk garments were interviewed.
2. They import either silk yarn which they weave or cloth which they used to produce garments.
3. They also import chemical dyes as well as some natural dyes primarily from the region.
4. The imported silk and silk yarn is purchased from local wholesalers who deliver the yarn and cloth to the
factory and are paid cash on delivery.
5. There is a problem with the availability of supply as it varies from month to month and has inconsistent
quality. However, this does not appear to have a signifi cant impact on their ability to fulfi ll orders.
6. They produce scarves, bags, shawls and also fabric for export.
7. The major markets are developed countries in Europe, North America and East Asia.
8. These products are sold on an FOB basis to foreign wholesalers and retailers.
9. Producers receive a 30-50 percent advance payment at the time of order confi rmation.
10. They produce to order except for one small producer who maintains export inventory.
11. Firms vary in terms of mode of shipment with one fi rm using only airfreight, another shipping 70 percent
by air and the third shipping two-thirds by sea.
12. The order cycle can be as little as 1-2 weeks with airfreight but by sea 3 months for distant destinations.
13. The fi rm’s principal source of competitive advantage is the uniqueness of their product, the quality and the cost.
14. All 3 fi rms are looking to increase the volume of orders as a way to grow their business. For this purpose
are attempting to improve the quality and diversity of products.
15. The greatest constraint to grow is lack of demand followed by limited working capital, production
technology and quality control, as well as the availability of labor.
16. The outbound supply chains do not pose any challenges other than the cost of domestic transport.
17. The consumption of inputs is only about 50-100 meters of cloth month, which is delivered within a few
days by road from the local wholesaler.
18. Deliveries are relatively small and correspond to size of the producers output, nevertheless inputs are
delivered weekly.
19. Export shipments are relatively small, with 100-700 pieces.
20. The average value of an export shipment is US$2,000-US$10,000 although it can be as small as US$400
and as large as US$30,000.
21. A forwarder selected by the producer arranges for export shipments, but in certain cases the buyer
nominates the forwarder.
22. Exports are shipped from the factory in cartons by road with the movement arranged by the forwarder.
115Improving Trade Competitiveness in Cambodia:
An Analysis Using a Trade and Transport Facilitation Assessment (TTFA)

23. The goods produced are ready for retail.
24. Two of the three fi rms have very few late shipments but 30 percent experience delays due to delays in
production.
25. The yarn costs about US$50 per kilogram and the cloth about US$10 per meter based on the spot
market price.
26. The inputs are purchased on a cash basis and paid at time of delivery.
27. The delivery time is generally one-day for fabric and yard but most dyes require up to 15 days.
28. The producers rely on their own funds to manage their cash fl ows.
29. The export sold on a shipment by shipment basis.
30. Communication with the buyers by e-mail.
31. Payment for the goods occurs at the time of delivery or one week thereafter and is paid by TT or bank
transfer.
32. Letters of credit are not used in this trade.
33. The cash-to-cash cycle is only about 2 weeks.
Supply chains and cash fl ows modelsThree business models were examined. The fi rst uses local yarn together with imported yard in its weaving.
The second uses exclusively low yarn while the third uses exclusively imported yarn. All produce silk
products for retail and are distributed both locally and internationally.
116 Improving Trade Competitiveness in Cambodia:
An Analysis Using a Trade and Transport Facilitation Assessment (TTFA)

Buys when needed,typically 50-100kg
Locally producedGolden Silk yarn$45-50 per kg
Silk Yarn (andDyes)
$50-55 per kgSame day delivery
or pickup atwholesale market
Store finishedproduct at
business ownpremises
$400-5,000Buyer
SellerFOB
Loading ontoPlane
Arranged bycourier
Airmail to export market
Customers typically:- Retailer
- Wholesaler
Transport by Courier(TNT/DHL/UPS/
FedEx)$1/ scarf
Receive orderSize: Typically
20-25kgTime:-55 days
Weavingscarves
Customer pays 50%deposit Wire/
bank transfer typicallytakes only a few days
Customer pays finaloutstanding a mount
when order is ready toship
Packing list,Invoice, etc.
Every 1.5months delivery$2.5-5 per order
Package productsfor shipment
Annex Figure 44: Silk model A
117Improving Trade Competitiveness in Cambodia:
An Analysis Using a Trade and Transport Facilitation Assessment (TTFA)

Annex Table 11: : Cash fl ow for model A
Events Day
Purchase locally produced yarn from growers 0
Receive order 30
Receive initial payment 32
Purchase additional yarn from market 33
Produce scarves 33
Prepare scarves for shipment 88
Receive fi nal payment 90
Hand over shipment to Freight Forwarder 91
Direction Transactions Amount Event Offset
1 Purchase local yarn 2,500 1
2 Receive initial payment 2,500 3
1 Purchase additional imported yarn 2,750 4
2 Receive fi nal payment 2,500 7
Financial Instruments
Start End
Amount Event Offset Event Offset Fee Interest Collateral
Loan for working capital 2500 1 0 7 0 15.0%
118 Improving Trade Competitiveness in Cambodia:
An Analysis Using a Trade and Transport Facilitation Assessment (TTFA)

Th
ou
sa
nd
s
Cash Flow
Days
3
2
1
0
-1
-2
-3
0 5
10
15
20
25
30
35
40
45
50
55
60
65
70
75
80
85
90
95
10
0
10
5
11
0
11
5
12
0
12
5
13
0
13
5
14
0
14
5
15
0
Annex Figure 45: Cash fl ows for silk model A
Th
ou
sa
nd
s
Cash Flow with Financing
Days
0.00
-0.05
-0.10
-0.15
-0.20
-0.25
-0.30
0 5
10
15
20
25
30
35
40
45
50
55
60
65
70
75
80
85
90
95
10
0
10
5
11
0
11
5
12
0
12
5
13
0
13
5
14
0
14
5
15
0
Th
ou
sa
nd
s
Cash Exposure with $2500 Loan
0.0
-0.1
-0.1
-0.2
-0.2
-0.3
-0.3
-0.4
-0.4
0 5 10
15
20
25
30
35
40
45
50
55
60
65
70
75
80
85
90
95
10
0
10
5
11
0
11
5
12
0
12
5
13
0
13
5
14
0
14
5
15
0
Days
119Improving Trade Competitiveness in Cambodia:
An Analysis Using a Trade and Transport Facilitation Assessment (TTFA)

Annex Figure 46: Silk model B
Seller$5,000-10,000
per
shipment FOB Buyer
Truck to PASArranged by Freight
Forwarder.Est. $500 per shipment
FOB (onto ship)
Purchased regularly,5-1 kg 3-5 times
per month
Days 100% natural
made fromgathered natural
products
WeavingFabricandscarves
Customer pays 30.50%deposit Wire/bank
transfer typically takes only a few days
Receive orderSize: Typically
~ 500-700 piecesTime: ~3 months
Store finishedproduct at
business ownpremises
Package products
for shipment
Shippingmode
Transport by Courier
(TNT/DHL/UPS/FedEx)
Arranged by buyer
Loading onto
Plane
Arranged by
courier
Loading onto ship
Arranged bycourier
Ocean LCL
freightto export market
Customers typically:
- Retailer
- Wholesaler
Seller$5,000-10,000
per
shipment FOB Buyer
Airmail to export
market
Customer pays finaloutstanding a mount
when order is ready toship
Bill of lading
invoice, etc
2/3rd
1/3rd
Ocean
Air
Silk Yarn $50 per kg
Same day deliveryor pickup at
wholesale market
120 Improving Trade Competitiveness in Cambodia:
An Analysis Using a Trade and Transport Facilitation Assessment (TTFA)

Th
ou
sa
nd
s
Cash Flow
Days
4
3
3
2
2
1
1
0
-1
-1
0 5
10
15
20
25
30
35
40
45
50
55
60
65
70
75
80
85
90
95
10
0
10
5
11
0
11
5
12
0
12
5
13
0
13
5
14
0
14
5
15
0
Annex Figure 47: Cash fl ows for silk model B
Events Day
Receive order 0
Receive initial payment 2
Buy inputs at local wholesale market 3
Weaving 4
Package products for shipping 94
Receive fi nal payment 96
Hand over shipment to Freight Forwarder 97
Transactions Amount Event Offset
Receive initial payment of 50 percent 2,500 2
Purchase inputs at market 2,500 3
Receive fi nal payment 3,000 6
Pay freight forwarder for shipping and handling 500 7
Annex Table 12: Cash fl ow for silk model B
121Improving Trade Competitiveness in Cambodia:
An Analysis Using a Trade and Transport Facilitation Assessment (TTFA)

Amtex Figure 48: Silk model C
Buys around 2 time per year 600kg
Imported
Chinese Yarn
$60/kg
Store in local
ware house at
firm premises
piece,$1000-20000
per shipment Buyer
Seller
FOB Around
$20 per
Loading ontoPlane
Arranged bycourier
Airmail to exportmarket
Customers typically:- Retailer
- Wholesaler
Transport by Courier
(TNT/DHL/UPS/FedEx)
$1.24/scarf if order 500pc
$2.40 if 100pc more if less
Receive order
Size: Typically 300 pc
but ranges 50-1500
Time: ~ 78 days
Weaving
scarves
Customer pays 50% deposit
Wire/bank transfer typically
takes only a few days
Customer pays final
outstanding a mount
when order is ready to ship
Package products
for shipment
Pickup at the Port
Shipping from China
$0.8/kg for iformal
and $6.6/kg forformal
Store finishedproduct at
business ownpremises
Packing list,
Invoice, etc.
Improving Trade Competitiveness in Cambodia:
An Analysis Using a Trade and Transport Facilitation Assessment (TTFA) 122

Events Day
Order silk yarn inputs from China 0
Pick up yarn from port and store in warehouse 30
Receive order 60
Receive initial payment 62
Produce silk scarves 63
Pack and prepare scarves for shipment 141
Receive fi nal payment 143
Ship scarves to customer 144
Transactions Amount Event Offset
Pay for imported silk yarn 3,600 1 0
Pay informal import 480 2 0
Receive initial payment 3,000 4 -2
Receive fi nal payment 3,720 7 -2
Pay freight forwarder 720 8 0
Financial InstrumentsStart End
Amount Event Offset Event Offset Fee Interest
Loan for working capital 3.500 1 0 4 -2 15.0%
Th
ou
sa
nd
s
Cash Flow
Days
5
4
3
2
1
0
-1
-2
-3
-4
0 5
10
15
20
25
30
35
40
45
50
55
60
65
70
75
80
85
90
95
10
0
10
5
11
0
11
5
12
0
12
5
13
0
13
5
14
0
14
5
15
0
Annex Figure 49: Cash fl ow for model C
Annex Table 13: Cash fl ow for model C
123Improving Trade Competitiveness in Cambodia:
An Analysis Using a Trade and Transport Facilitation Assessment (TTFA)

Cash Flow with Financing
Days
Th
ou
sa
nd
s
-1
-1
0
0 5 10
15
20
25
30
35
40
45
50
55
60
65
70
75
80
85
90
95
10
0
10
5
11
0
11
5
12
0
12
5
13
0
23
5
14
0
14
5
15
0
1
1
2
2
3
3
4
4
Th
ou
sa
nd
s
Cash Exposure with $3500 Loan
Days
3.0
2.5
2.0
1.5
1.0
0.0
-0.5
-1.0
-1.5
0 5 10 15 20 25 30 35 40 45 50 55 60 65 70 75 80 85 90 95 100
105
110
115
120
125
130
135
140
145
150
124 Improving Trade Competitiveness in Cambodia:
An Analysis Using a Trade and Transport Facilitation Assessment (TTFA)


Bibliography
Garments Abernathy, F. H., A. Volpe, and D. Weil. The Future of the Apparel and Textile Industries: Prospects and Choices
for Public and Private Actors. Harvard Center for Textile and Apparel Research, 2005. Abonyi, G. Linking
Greater Mekong Subregion Enterprises to International Markets: The Role of Global Value Chains, International
Production Networks and Enterprise Clusters. New York: United Nations ESCAP, 2006.
Adhikari, R., and Y. Yamamoto. “The textile and clothing Industry: adjusting to the post-quota world.”Industrial
Development for the 21st Century, 2007: 183-232.
Bargawi, O. Cambodia’s Garment Industry - Origins and Future Prospects. ESAU Working Paper 13, Overseas
Development Institute, 2005.
Better Factories. Cambodia’s Garment Industry Rebounds from the Global Economic Downturn. Available
at http://www.betterfactories.org/content/documents/Industry percent20Data percent20Sheet percent
202011_ March2011 percent20(EN).pdf, International Labour Organization , 2011.
Fadiga, M. L. “US consumer purchasing decisions and demand for apparel.” Journal of Fashion 9, no. 4 (2005):
367-379.
Garment Manufacturer Association in Cambodia. GMAC 2010 - 14th Anniversary. Available at http://gmac-
cambodia.org/bulletin/2010.pdf, Garment Manufacturer Association in Cambodia, 2009.
Gereffi , G. “International trade and industrial upgrading in the apparel commodity chain.” Journal of International
Economics 48 (1999): 37-70.
Gereffi ,G., and O. Memedovic. The global apparel value chain: what prospects for upgrading by developing
countries. Vienna: UNIDO, 2003.
Gereffi , G., and S. Frederick. The Global Apparel Value Chain, Trade and the Crisis: Challenges and Opportunities
for Developing Countries. Policy Research Working Paper 5281, The World Bank, 2010.
Jassin O’Rourke Group. “Strategies for Success in a Global Sourcing Environment.” National Textile Association.
Amelia Island, Florida: Jassin O’Rourke Group, 2005.
Jassin-O’Rourke Group, LLC. “Global Apparel Manufacturing Labor Cost Analysis .” New York: Jassin- O’Rourke
Group, LLC, 2008.
Jones, R. M. “The Apparel Industry.” Blackwell Science (Blackwell Science), 2002: 254.
Kimsun, T. A Review of Cambodian Industrial Policy. Section 1 of the Sixth Annual Development Review,
Cambodian Development Research Institute, 2010-2011. Loo, K. “Cambodia Garment Industry.” Shanghai, 2011.
Nathan Associates Inc. and Werner International. Factory-Level Value Chain Analysis of Cambodia’s Apparel
Industry. USAid, 2007.
Natsuda, K., K. Goto, and J. Thoburn. Challenges to the Cambodian Garment Industry in the Global Garment
Value Chain. RCAPS Working Paper No. 09-3, Ritsumeikan Center for Asia Pacifi c Studies (RCAPS), Ritsumeikan
Asia Pacifi c University, 2009.
126 Improving Trade Competitiveness in Cambodia:
An Analysis Using a Trade and Transport Facilitation Assessment (TTFA)

Nordås, H. K. The Global Textile and Clothing Industry post the Agreement on Textiles and Clothing.
Discussion Paper No. 5, Geneva: World Trade Organization, 2004.
Norum, P. “The Demand for Accessories, Footwear and Hosiery.” Journal of Fashion Marketing and Management
3 (1999): 55-66.
Royal Government of Cambodia. National Strategic Development Plan, Update 2009-2013. Available at http://
www.ilo.org/wcmsp5/groups/public/---asia/---ro-bangkok/documents/publication/wcms_145085.pdf, Royal
Government of Cambodia, 2010.
Salinger, L., and et al. Measuring Competitiveness and Labor Productivity in Cambodia’s Garment Industry.
Available at http://www.werner-newtwist.com/en/newsl-vol-002/article percent203 percent20-percent20
annex percent20- percent20Cambodia percent20Study.pdf, USAid, 2005.
Sanchez, A. “The Textile Industry in the Philippines and Thailand: A Comparison.” Journal of Philippine
Development; No. 30 17, no. 1 (1990): 68-87.
Seiha, N. “Garment Industry in Cambodia.” Economic Institute of Cambodia.
Socio-Economic and Environmental Research Institute. Malaysian Textile & Apparel Industry. 2007. http://
www.seri.com.my/v3/fi les/econ_brief/2007/EconBrief2007-5.pdf (accessed January 2012).
Staritz, C. Making the Cut? Low-Income Countries and the Global Clothing Value Chain in a Post-Quota and
Post-Crisis World. The World Bank, 2011.
Thoburn, J. The Impact of World Recession on the Textile and Garment Industries of Asia. Working Paper
17/2009, Vienna: UNIDO, 2010.
Tokatli, N. “Global sourcing: insights from the global clothing industry - the case of Zara, a fast fashion retailer.”
Journal of Economic Geography 8 (2008): 21-38.
Torres, C. Value Chain Analysis. Winter Semester 2004/2005.
UN-Comtrade. ITC Trade Statistics. 2012. http://www.intracen.org/trade-support/trade-statistics/(accessed
January 2012).
WTO. Options for least-developed countries to improve their competitivenessin the textiles and clothing
business. WT/COMTD/LDC/W/37, Geneva: WTO, 2005.
Yamagata, T. Prospects for Development of the Garment Industry in Developing Countries: What Has Happened
Since the MFA Phase-Out? Discussion Paper No. 101, Institute of Development Economics, JETRO, 2007.
RiceAgrifood Consulting International and CamConsult. Cambodia Agriculture Sector. Diagnostic Study, Phase 1 of
Design, Agricultural Program, Cambodia, 2007-12 – Program Concept Document Final Report, AusAID, 2006.
Agrifood Consulting International. Rice Value Chain Study: Cambodia. World Bank, 2002.
Bun Heng, O. L. Cambodia Rice Export and Reality 2011/2012. Singapore, September 21, 2011. “Cambodia SME
Development in Selected Agri-Sectors/Value Chains–Final Scoping and Design Report.”
Global Development Solutions, LLC. Towards A Private Sector-Led Growth Strategy for Cambodia. Volume 1:
Value Chain Analysis, World Bank, 2003.
127Improving Trade Competitiveness in Cambodia:
An Analysis Using a Trade and Transport Facilitation Assessment (TTFA)

Maneechansook, C. Value Chain of Rice Exported from Thailand to Sweden. Master’s (one year) thesis in
Business Administration, Boras: University of Boras, 2011.
PIZ Logistics Co., Ltd. . Bonded Warehouse & 3rd Parties Logistics Provider. Phnom Penh, Unknown.
PIZ Logistics Co., Ltd. Bulk Service Phnom Penh/ Vietnam. Phnom Penh, Unknown.
Shigetomi, S. Thailand: Towards a Developed, Rice-Exporting Country (Chapter 4). Available at http://d- arch.
ide.go.jp/idedp/SPT/SPT003200_006.pdf, IDE JETRO.
Slayton, T., and S. Muniroth. A More Detailed Road Map for Cambodia Rice Exports. Market Research, World
Bank, 2011.
Suvannaphum Investment Co., Ltd. Logistics Department. Logistics and Infrastructure plan for Rice Export
Cambodia. Phnom Penh, August 1, 2011.
Suvannaphum Logistics Dept. Port Projects Scope out Line Sales and Marketing. Phnom Penh, September 5,
2011.
UN-Comtrade. ITC Trade Statistics. 2012. http://www.intracen.org/trade-support/trade-statistics/(accessed
January 2012).
Value Chain Unit; Trade Promotion Department. Rice Sector Profi le. Ministry of Commerce, 2010.
Wiboonpongse, A., and Y. Chaovanapoonphol. “Rice Marketing System in Thailand.” Agribusiness Management
towards Strengthening Agricultural Development and Trade. Multiple Cropping Center, Chiang Mai University;
National Chung Hsing University; The Ministry of Agriculture and Cooperatives,2001.
SilkAgrifood Consulting International. Northeast Thailand Silk Value Chain Study. Project Brief Series, Agrifood
Consulting International, 2005.
Central Silk Board. Note on the Performance of Indian Silk Industry & Functioning of Central Silk Board. Note,
Bangalore: Central Silk Board, 2011.
Chiang Mai University. Value Chain Analysis for Thai Home Textiles Silk Sub-sector EU-Thailand Small Projects
Facility The Case of Thai Home Textiles: Building Export Competence of a SME Dominated Value Chain.
Institute for Science and Technology Research and Development , Chiang Mai : Chiang Mai University , 2007.
Emerging Markets Consulting. Cambodian Commodity Chain Analysis Study Volume 1: Comparative Industry
Assessments. EMC, Coalition to Address Sexual Exploitation of Children in Cambodia, Plan, 2005.
Gibbons, B., and J. Vahl. Cambodian Sericulture Stock Taking Report: For Cambodian Sector-Wide Silk Project.
Geneva: International Trade Centre, 2008.
Global Sources. Cambodia Sourcing Reports: Silk Fashion Accessories. Global Sources, 2010.
Ministry of Commerce, Cambodia. Trade Sector Development and Aid for Trade in Cambodia. Phnom Penh:
Ministry of Commerce, Cambodia, 2011.
Ministry of Industry and Commerce, Lao PDR. “Sustainable Silk and Handicraft Production.” World Bank.
2009. http://siteresources.worldbank.org/INTRANETTRADE/Resources/239054-1239120299171/5998577-
1254498644362/6461208-1300387998578/Lao_Silk_Handicraft.pdf (accessed January 2012).
128 Improving Trade Competitiveness in Cambodia:
An Analysis Using a Trade and Transport Facilitation Assessment (TTFA)

Patil, B. R., and et al. Sericulture: An Alternative Source of Income to Enhance the Livelihoods of Small- scale
Farmers and Tribal Communities. Research, Pro-Poor Livestock Policy Initiative, 2009.
Roll, M. Asian brand strategy: How Asia builds strong brands. Palgrave Macmillan, 2006.
UN-Comtrade. ITC Trade Statistics. 2012. http://www.intracen.org/trade-support/trade-statistics/(accessed
January 2012).
Van den Akker, L., M. P. Gautam, and B. Bijl. Chyangra Cashmere and Silk Products: Export performance and
potential. Project NEP/A1/01A, International Trade Center, WTO, UNCTAD, 2007.
OtherAsian Development Bank. Lao People’s Democratic Republic Transport Sector Assessment, Strategy, and Road
Map. Mandaluyong City: Asian Development Bank, 2012.
BDLINK (Cambodia) and Tridos Facet. Study on Access to Financial Services for Small and Medium Agri
Business Enterprises in Cambodia. Inception Briefi ng, Phnom Penh: World Bank, 2011.
Emerging Markets Consulting. Mapping of Trade Processes – Cambodia. Final Report under the Trade Develop-
ment Support Program, Phnom Penh: World Bank, European Commission, UNIDO, DANIDA,2010.
Sau, S. “Economic Corridors and Industrial Estates, Ports, Metropolital and Alternative Roads in Cambodia.”
In Intra- and Inter-City Connectivity in the Mekong Region, by Bangkok Research Center, edited by M. Ishida.
Bangkok: IDE-JETRO, 2011.
Sayavong, P. Import and Export Process Mapping in Lao PDR. Vientiane: The World Bank/Government of
Lao PDR, 2008.
Siphana, S. An Analysis of Trade Facilitation and Import/Export Processes in Cambodia. Presentation of
Findings to the Supreme National Economic Council (SNEC), UNESCAP, 2011.
Sovicheat, P. “Improving Trade-Related Governance Cambodian Case Study.” Regional Conference on Investment
and Competitiveness in East Asia – From Diagnostics to Action. Kuala Lumpur: Ministry of Commerce, Kingdom
of Cambodia, 2005.
—. “Private Sector Needs in the Improvement of Trade Facilitation.” AITIC Regional Workshop: Trade Facilitation
Negotiations for Asian LDC Members and Observers of the WTO. Phnom Penh, 2009.
129Improving Trade Competitiveness in Cambodia:
An Analysis Using a Trade and Transport Facilitation Assessment (TTFA)