
Protecting Infant Industries:
Canadian Manufacturing and the National Policy, 1870-1913
Richard Harris
Department of Economics, Simon Fraser University
Ian Keay†
Department of Economics, Queen’s University
94 University Avenue
Kingston, ON
K7L 3N6
Canada
Frank Lewis
Department of Economics, Queen’s University
† Corresponding author. The authors thank Byron Lew, Ann Carlos, and participants at the University of
Colorado-Boulder Economics Department seminar series, the Queen's University 2014 Economic History
Conference, and the 2013 Canadian Economics Association Meetings for helpful comments and
suggestions. Eugene Beaulieu and Jevan Cherniwchan generously shared data and documentation.
1
ABSTRACT
Protecting Infant Industries:
Canadian Manufacturing and the National Policy, 1870-1913
In contrast to traditional neo-classical models of international trade, industrial
organization and learning-by-doing trade models describe how protective tariffs can
encourage output expansion, productivity improvement and falling prices. The 1879
National Policy substantially increased tariff protection to some, but not all, Canadian
manufacturing industries. Treating the National Policy tariffs as a natural experiment,
and using treatment intensity and difference-in-differences approaches, we find strong
support for the predictions of the new trade models. After 1879, industries that received
greater protection experienced faster growth in output and productivity, and larger price
reductions. The industries targeted by the National Policy also exhibited larger
increasing returns to scale and faster learning rates. In addition to addressing a central
theme in Canadian economic history, our results shed light on the broader issue of infant-
industry protection.
JEL Classification: N71; N61.
Keywords: Infant industries; tariffs and industrial development; Canadian development.
2
1. Introduction
As part of the Dominion Government's 1879 budget, the Canadian parliament
passed what has become known as the National Policy. The legislation had broad nation
building objectives that were to be achieved by substantially increasing tariffs on a long
list of manufactured goods and through measures to promote railway-building and
immigration. Since its introduction, the role of the National Policy in Canadian
economic development has been controversial. The debate, moreover, has important
implications for our understanding of infant-industry protection that extend well beyond
the Canadian historical context (Baldwin 1969; Melitz 2005). Empirical work on the
impact of both protection (Irwin and Temin 2001; Irwin 2000; Bils 1984; Krueger and
Tuncer 1982) and trade liberalization (Amiti and Konings 2007; Schor 2004; Tybout and
Westbrook 1995) in the presence of infant industries gives a mixed picture. We would
hardly claim to resolve the question, but our empirical findings shed light on a literature
that has been mainly theoretical, while confronting directly a central theme in Canadian
economic history.
W.T. Easterbrook and Hugh Aitken’s (1956) classic, Canadian Economic
History, presents what is regarded as the traditional view, which reflects the claims made
by John A. Macdonald in 1878 when, as leader of the opposition Conservative Party, he
first proposed the National Policy. As Easterbrook and Aitken put it (1956: 394), the
National Policy supported: "...a strong economic and political unity to 1930, a better
balanced and diversified though vulnerable transcontinental economy, and a rise to
'middle nation' role in world affairs.” According to this interpretation, higher protective
tariffs promoted economic and industrial development, and were a vital source of
government revenue. This view of the National Policy is not without its critics. Dales
(1966) and Easton et al. (1988), for example, use standard neoclassical trade models in
support of their revisionist view that the National Policy reduced per-capita income
growth and possibly extensive growth.
In light of the growing influence of the large, mainly theoretical, 'new' trade
literature that describes how tariff protection for infant industries can increase
productivity and the pace of industrial development, there is a need to revisit both the
traditional and revisionist perspectives. The Canadian experience of increased tariff
3
protection under the National Policy provides us with an opportunity to test the
theoretical predictions of the neo-classical and new trade models, while investigating the
impact of the policy on Canadian development.
We present versions of two models, prominent in the new trade literature. The
first treats the manufacturing sector as a Cournot oligopoly, where a tariff can promote
growth through internal scale economies. The second model focuses on external
economies and the impact of tariff protection on learning by doing. These models
describe mechanisms through which tariffs can trigger increases in output and
productivity. We use Urquhart's (1993) data on fifteen Canadian manufacturing
industries, spanning the years 1870-1913, to compare the performance of industries that
were targeted by the National Policy with those that were not. Using treatment intensity
and difference-in-differences estimation approaches, where industries receiving
substantial tariff protection comprise the targeted group, we identify large, statistically
significant impacts on output, productivity and price. We also find evidence of
increasing returns to scale and learning-by-doing, with those industries most affected by
the National Policy being particularly sensitive to output expansion through their scale
economies and learning rates. Our findings support the two new trade models, and the
traditional view that the National Policy fostered infant industries and promoted
Canadian economic development.1
2. Tariffs and Canadian Economic Growth, 1870-1913
Prior to the work of Urquhart (1986, 1993), 1879 was not seen as a watershed
year for the Canadian economy. According to earlier interpretations, the last thirty years
of the nineteenth century was a period of generally sustained growth, albeit with a
slowdown during the general recession of the early 1890s (Hartland 1955; Firestone
1960; Bertram 1963). Although Young (1955), McDougall (1971), Barnett (1966) and
Altman (1987) point to faster growth in the decade following the introduction of the
National Policy, they argue that the ‘wheat boom’, 1896-1914, was the true break point in
Canadian development. Urquhart’s annual national income estimates have since allowed
1 Supporting infant industries with tariff protection is not costless. Even where infant industry effects can
be identified, the net contribution to welfare may be small or even negative (Head 1994; Inwood and Keay
2013; Irwin 2000). We do not consider the general equilibrium or broader welfare effects.

4
researchers to address the issue of timing more rigorously. Inwood and Stengos (1991),
for example, test for structural breaks in gross national product and investment over the
period 1870 to 1985, concluding that 1896 was an important discontinuity (see also
Green and Urquhart 1987; Green and Sparks 1999). Certainly in terms of aggregate
output and population, 1896-1914 was a period of remarkable growth unmatched in
Canadian history. Nevertheless, the experience of the 1880s, both in manufacturing and
in measures of per capita growth, is in some ways comparable to the wheat boom years.
INSERT TABLE 1 HERE
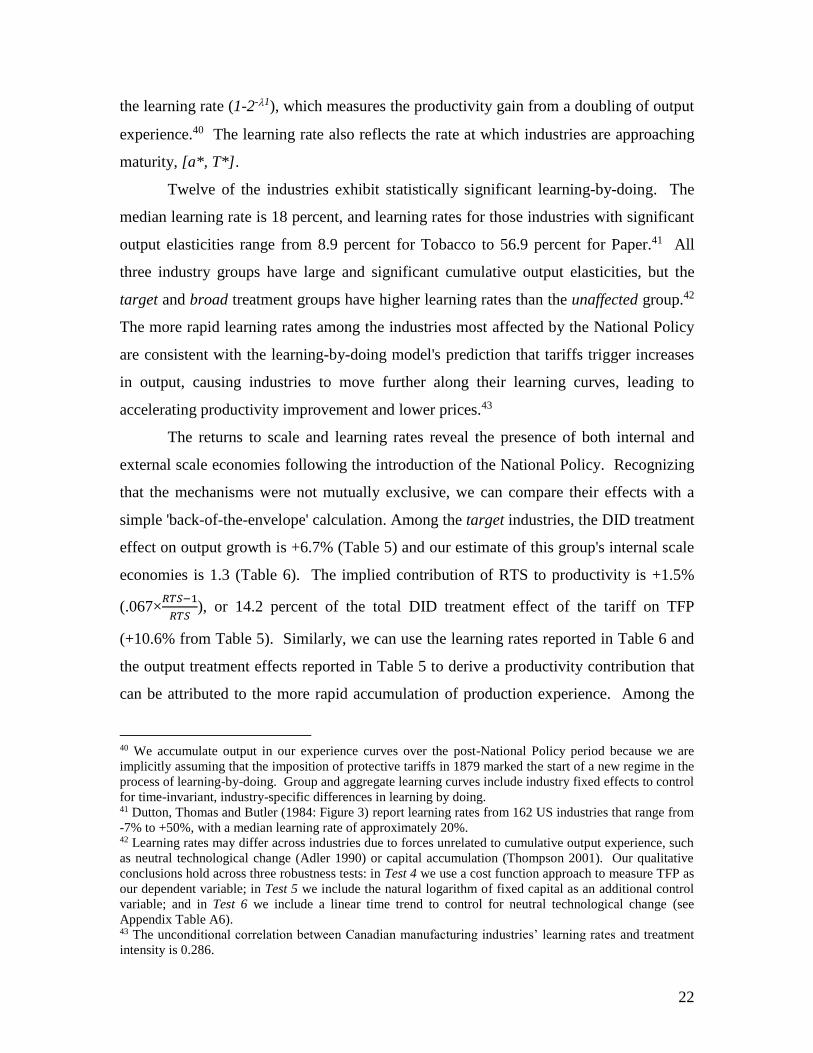
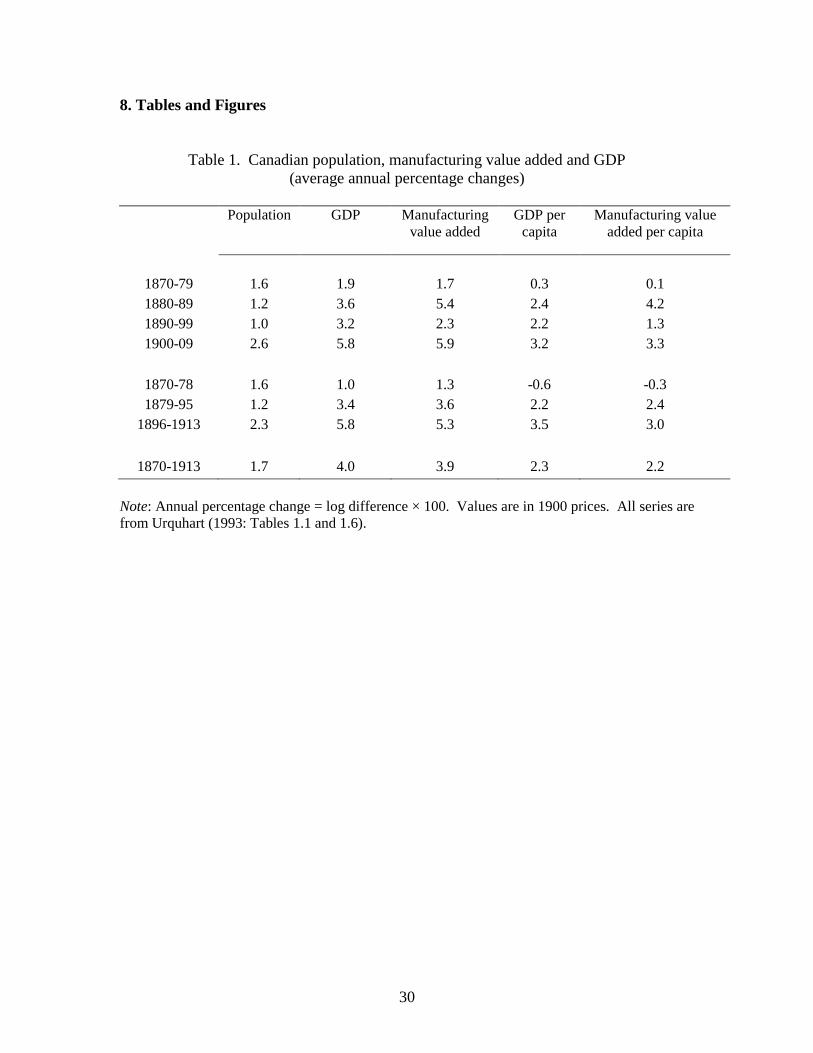
Population and GDP increased much more rapidly during the decade after 1900
than during the 1880s. Population grew at an average annual rate of 2.6 percent, as
compared to 1.2 percent, and GDP grew by 5.8 percent rather than 3.6 percent (see Table
1). However, in per capita terms the differential in GDP growth was less than 1 percent,
3.2 percent as compared to 2.4 percent, and total manufacturing output grew just 0.5
percent faster during the 1900s. In fact, per capita manufacturing output grew more
rapidly during the 1880s than during the first decade of the twentieth century. If we
include the recession years of the early 1890s and the boom years of the late 1890s, with
1896 marking the start of the wheat boom, then the growth in manufacturing output from
1879-1895 differs from the post-1896 period by less than 2 percent, and growth in
manufacturing output per capita differs by just 0.6 percent.
Not only was growth during the 1880s close to that experienced during the wheat
boom years, it represented a sharp break from earlier years. Although population grew
more slowly after 1879, GDP growth accelerated by 1.7 percentage points and
manufacturing output by 3.7 percentage points. Per capita manufacturing output, which
was stagnant through the 1870s, grew at an annual rate of 4.2 percent during the 1880s,
ending the decade 50 percent higher than at the start.2 Comparing the decade leading up
to the National Policy to the last twenty years of the nineteenth century and the first
decade of the twentieth confirms that 1880 (and to an even greater extent, 1879)
2 There was no comparable acceleration in US growth during the 1880s. US manufacturing output grew
more slowly from 1880-89 than 1870-79, and real GDP growth was flat (Carter et al. 2006: 3-24, 4-612).

5
represents a significant break in terms of GDP, manufacturing output, and the
corresponding per capita measures.3
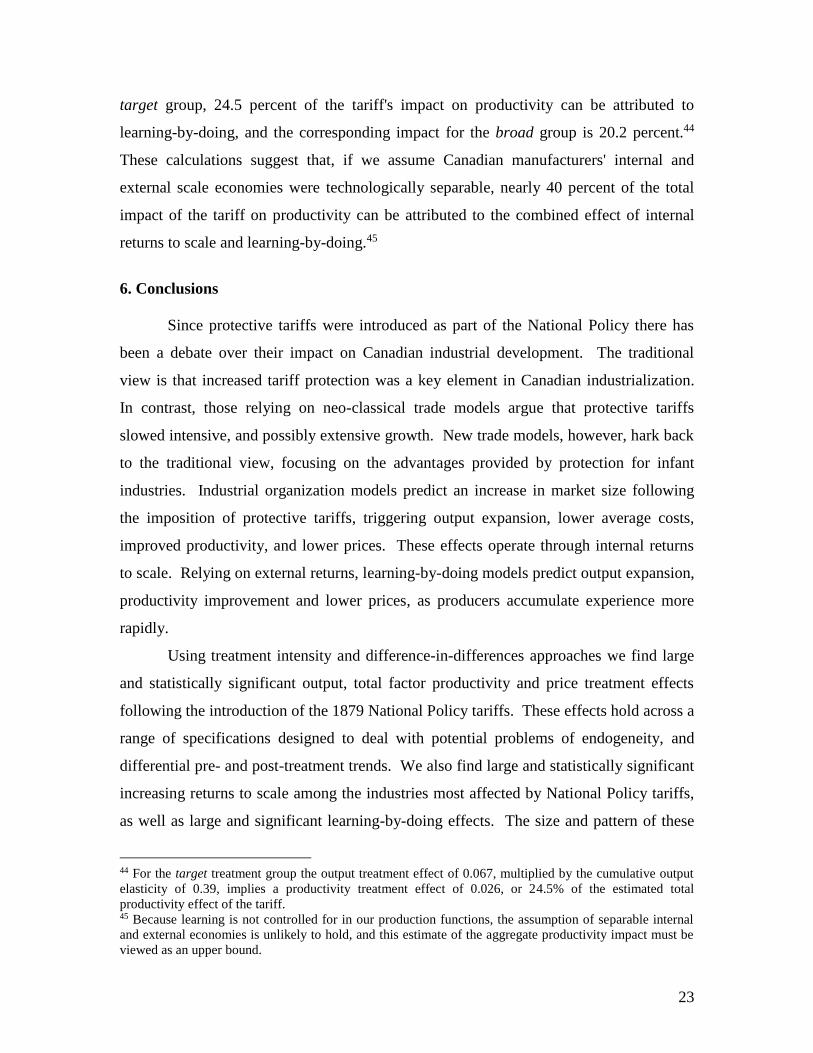
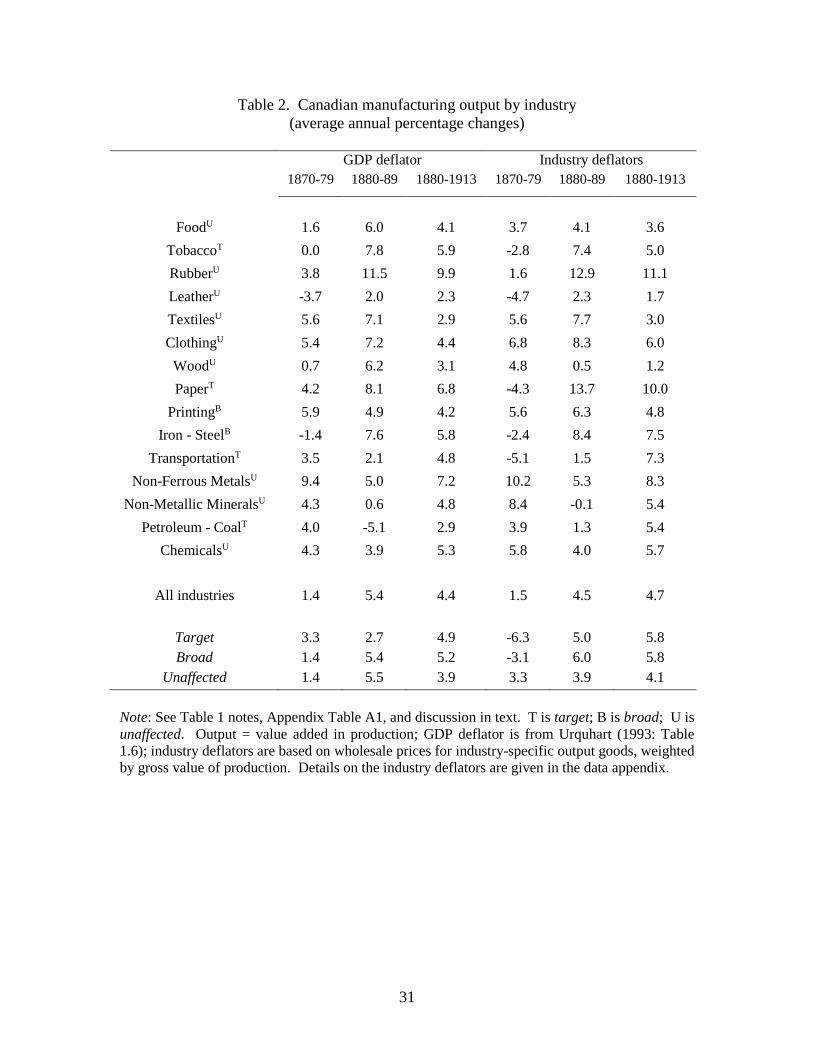
Even more revealing than the macroeconomic evidence is the expansion in
industry-level output after 1879. Table 2 reports real value added growth rates for fifteen
industries over the years 1870-79, 1880-89, and 1880-1913.4 To better relate these
growth rates to the differential effects of the National Policy, industries have been
divided into three groups based on how directly they were affected. The first of these, the
target group, are the four import-competing industries with the largest tariff increases.
This group consists of Tobacco Products, Paper Products, Transport Equipment, and
Petroleum and Coal Products. The second broad group adds Printing and Publishing, and
Iron and Steel, industries that benefitted from large tariff increases, but were not as
strongly import-competing.5 What we call the unaffected group received much smaller
tariff increases in 1879 or faced little import competition. This third group comprises
Food and Beverages, Rubber Products, Textiles, Clothing, Wood Products, Non-Ferrous
Metal Products, Non-Metallic Minerals, and Chemical Products.
INSERT TABLE 2 HERE
After 1879 the output of those industries receiving the largest increases in tariff
protection under the National Policy accelerated more rapidly. Applying a GDP deflator,
average growth among the nine industries in the unaffected group increased from 1.4
percent per year prior to the National Policy to 3.9 percent in the post-1879 period (1880-
1913) - an acceleration of 2.5 percentage points. The corresponding increase among the
industries in the target group was just 1.6 percent, while real output among the broad
group accelerated by 3.8 percentage points. We note, however, that because industry
output is derived from a single aggregate GDP deflator, these differences in real growth
rates do not reflect changes in relative prices. Allowing for industry-specific price
3 Tests for differences-in-means and trend breaks confirm significant differences in GDP, GDP per capita,
manufacturing output and manufacturing output per capita growth rates before and after 1879. 4 Urquhart (1993: 39-43) identifies manufacturing industries at the two-digit SIC (1948) level. We omit
two of Urquhart's industries: Electrical Apparatus (data is unavailable before 1890) and Miscellaneous
Industries. Together, these industries produced less than 3% of manufacturing value added in 1913. 5 Industries in the target group satisfy: (i) % increase in ad valorem tariff rates between 1875 and 1880
exceeds 37.5%, and (ii) import intensity in 1875 exceeds 30%. The two additional industries satisfy (i), but
their 1875 import intensities were low (17% for Printing and Publishing, and 20% for Iron and Steel). See
Appendix Table A1.

6
changes, we find considerably stronger evidence that output accelerated much faster
among the industries that received greater tariff protection.6 Deflating nominal value
added by industry-specific wholesale price indexes reveals that growth in the unaffected
group accelerated by just 0.8 percentage points after 1879, whereas growth rates among
the target and broad groups increased by 12 percent and 9 percent, respectively.7
The aggregate evidence reported in Table 1 and the industry-specific evidence in
Table 2 suggest a positive relationship between greater protection due to the National
Policy and economic growth, but, of course, they do not imply causality. In the next
section we present two models that describe mechanisms that can yield a potential causal
connection between tariff protection and output growth, productivity improvement and
falling prices. The first is an industrial organization model based on imperfect
competition and internal scale economies. The second is based on learning by doing
where the emphasis is on external economies.
3. Two Models of Tariff Protection and Growth
3.1 Industrial Organization Model
In the spirit of the 'new' theories of international trade, our first model describes
one of the channels through which internal scale economies operate for firms within an
oligopolistic framework. Following Harris (1984), Horstmann and Markusen (1987), and
Melitz and Trefler (2012), we treat a manufacturing industry as a Cournot oligopoly with
free entry. In this simple framework manufacturing uses only labour, while agriculture
uses labour and land.8 We apply the assumption made by Dales (1966) of a constant
money wage, or equivalently, a constant real wage expressed in units of the agricultural
good.
6 Industry-specific output prices are based on benchmarks in Barnett (1966). Interpolation is based on
prices reported in Michell (1931), Urquhart and Buckley (1965), Trade and Navigation Reports, various
newspaper sources, and Eaton's Fall Catalogues. Information on data sources and how the series were
constructed is provided in the Data Appendix. 7 All of these comparisons apply to the period 1880-1913. Comparing instead the first decade following
the National Policy (1879-1888) gives similar results, although, where the GDP deflator is applied, the
acceleration in the unaffected group is greater, and the target group exhibits a slight decline in growth rates. 8 Because late-nineteenth century Canada was open to unfettered capital flows, the absence of reproducible
capital in this model does not affect the relevance of its predictions in our historical context.

7
Let c denote the marginal cost of production within a manufacturing industry; w
the money wage; v the variable input of labour per unit of output within a representative
firm (assumed constant); and f the fixed labour required to start up a representative firm.
Prices are set in a free-entry Cournot model such that:
pm = mark-up marginal cost = wv (1)
and
pm = average cost = wv + wf/q , (2)
where q denotes output per firm, and the Cournot mark-up. The N firms in the industry
are assumed to sell a homogenous good. To keep matters simple we follow the standard
practice of treating domestic demand for import-competing manufactures as a function of
domestic prices, pm, and world prices, pm*. This Armington assumption of imperfectly
substitutable domestic and foreign manufactures, which contrasts with the standard neo-
classical demand assumption, is a necessary building block for any model of imperfect
competition. Aggregate demand for domestic manufactures also depends on aggregate
income and, hence, the total labour force, which, following standard practice, we identify
as population. We simplify the analysis by assuming that the labour income elasticity of
demand for domestic manufactured goods is one, and the land income elasticity of
demand is zero. These assumptions imply the following linear demand function for the
domestic manufacturing industry:
D(pm, pm*; w, L) = wL( - pm + pm*) , , > 0 (3)
where L is the total labour force. We restrict prices to the relevant range, so demand is
positive. The demand function can be written in inverse form as:
pm = a - b Q , (4)
where Q is total domestic demand for manufactures; a = / + / pm* ; and b = 1 /
wL. With Cournot pricing, domestic firms take the output produced by other domestic
firms as exogenous, which implies the following industry equilibrium condition between
prices and output:
pm = c + bq , (5)
where q is the output of a representative firm (= Q/N). Substituting the marginal cost
condition, c = wv, into (5) gives:
pm = wv + q/wL . (6)

8
Combining the Cournot pricing condition (6) with the zero profit condition (2) gives us
the following relationship between output per firm, the wage rate, and population:
q = w(fL)½ . (7)
Given the cost conditions and the assumption of unitary income elasticity of
demand, output per firm is therefore proportional to the wage rate. More significant is
the fact that output per firm depends on the square root of market size, as measured by
population, L. We refer to the relationship between q and L defined in (7) as the market
size schedule, depicted in Figure 1. This relationship works through the perceived
elasticity of demand and the zero profit condition. Larger markets increase this elasticity
and, therefore, reduce mark-ups, . This means that for profits to remain at zero, an
increase in market size must raise output per firm.9
INSERT FIGURE 1 HERE
To solve for equilibrium in the economy as a whole we need to introduce the
agricultural sector, which produces a homogeneous good, 'food', for export at an
exogenous world price, with labour and land. The labour market clearing condition, L =
Lf + Lm and (2) implies:
L = Lf + N(vq + f) , (8)
where Lf is labour in agriculture; Lm is labour in manufacturing; and N is the number of
firms in manufacturing. From (3), equilibrium in the manufactured goods output market
is:
wL( - pm + pm*) = Nq . (9)
Defining the demand for manufactured goods per dollar of labour income as:
d(pm, pm*) = - pm + pm* , (10)
we can derive the following relationship between the two endogenous variables q and L,
from (2), (8), (9) and (10):
w d[AC(q), pm*]AC(q) = 1 - Lf / L , (11)
where AC(q) is average cost per firm. Note that Lf is fixed if money wages are constant.
We define:
ψ(q) = d [AC (w, q), pm*]AC(q) . (12)
9 In contrast to product differentiation models of trade (with constant elasticity of substitution between
varieties), in which increased market size leads to an increase in variety, not larger firms, lower mark-ups
with zero profits necessarily imply an increase in output per firm in this model.

9
Since prices equal average cost, this is the value of spending on manufactured goods per
dollar of labour income. It is also the share of the labour force in manufacturing.10 The
slope of ψ with respect to q can be derived as:
ψ (y) = AC (q) d (+1) , (13)
where is the price elasticity of per capita demand. We assume that demand for
domestic manufactures is price elastic, so < -1. In this case, the set of (L, q) which
satisfy (11), denoted by LL in Figure 1, clear both goods and labour markets. LL slopes
upwards, meaning that larger populations, with fixed Lf, require a larger share of total
spending on domestic manufactured goods to clear the goods market. So while average
costs (and prices) fall as q increases, demand must rise more than enough to allow total
spending on manufactured goods to rise. In this case, the LL schedule cuts the market
size schedule from below.11
Imposing a tariff on manufactured goods in this model raises foreign prices for
domestic consumers. This has no effect on the market size schedule, but it affects the LL
schedule through the shift argument, pm*, of the demand function. At initial per firm
output levels and population sizes, (q0, L0), the increase in the tariff raises per capita
demand and hence total demand for manufactured goods, leading to a horizontal shift in
the LL schedule to LL'. This induces the entry of new firms and the expansion of
employment within domestic manufacturing. The latter effect is reinforcing, in the sense
that demand for manufactured products increases even further due to the increase in
population. Increased profitability, together with a larger market size via the entry effect,
leads firms to expand output, cut mark-ups and lower prices. These effects will be
measured as increasing returns to scale. In summary, the tariff:
a) increases market size through import substitution and increased population,
raises total demand for import competing manufactures, and raises per firm output (and
firm size);
b) reduces Cournot mark-ups, leading to lower average costs and prices, and
higher productivity.
10 With labour mobile between sectors, wages in agriculture and manufacturing will be equal. Also note
that we are assuming all spending is from labour income. 11 This will be true in the neighbourhood of a stable equilibrium. Note that for populations less than Lf the ψ
schedule is undefined.

10
It is also useful to consider the quantitative impact of a tariff implied by this
model. From the definition of ψ, it follows that if a tariff induces a 10 percent increase in
per capita demand for manufactured goods, then the share of the total labour force in
manufacturing, (L-Lf) / L, must also increase by 10 percent, holding per firm output
constant. The increase in market size, however, means that per firm output will also rise
and prices will fall, leading to further increases in the share of labour in manufacturing.
The initial import substitution effect, therefore, provides a lower bound for the ultimate
impact on the size of the domestic manufacturing sector.
This industrial organization-inspired model predicts output expansion,
productivity improvement and falling prices in response to the introduction of a
protective tariff. The key to the identification of these effects is the measurement of
significant scale economies among those industries affected by the change in policy - the
tariff triggers output expansion and a reduction in Cournot mark-ups, which are reflected
in increasing returns to scale, productivity improvements and price reductions.
3.2 Learning-by-Doing Model
Our second model provides an infant industry justification for protection based on
learning-by-doing (LBD). In this model, industry productivity is an increasing function
of industry 'experience', proxied by cumulative output. When tariff protection facilitates
increases in output, cumulative output rises more quickly, experience is gained,
productivity increases, costs fall, and prices fall. Protection, therefore, is one means of
increasing output to bring an infant industry to maturity sooner.12
As before, the manufacturing industry produces a close substitute for a competing
foreign good, whose price, pm*, is fixed in world markets. Total domestic manufacturing
output at time v is denoted by Q(v); and, setting the initial time at 0, cumulative output
Z(t) is:
Z(t) = 0t Q(ν) dν . (14)
12 Economic historians have long appealed to versions of the learning-by-doing model first formalized by
Arrow (1962). For example see David (1970), Williamson (1972), and Irwin (2000).

11
The domestic manufactured good is produced under constant returns, with labour as the
only input.13 Productivity is denoted a(Z), where Z is a proxy for experience, and we
assume that the productivity curve has a logistic S-shape which reaches an upper bound,
a*, at a(Z*).14 In the present context a* can be thought of as reflecting best-practice
technology available internationally. Thus, international diffusion of knowledge
combined with experience jointly account for the shape of the learning curve. Perfect
competition within manufacturing ensures that prices are set so that pm = w/a. The per
capita demand function is the same as in the first model, implying that total domestic
manufacturing output is given by:15
Q = d(pm, pm*) w [Lf + a(Z) -1 Q] . (15)
Normalizing w and noting that pm can be expressed as a(Z)-1, (15) can be rewritten as:
Q = 1-*]a(Z)mp ,1-d[a(Z) -1
fL*] mp ,-1d[a(Z) . (16)
From (16), the sign of the slope of Q with respect to Z, for Z < Z*, is -sign( + s), where
is the price elasticity of per capita domestic demand and s is the expenditure share for
the domestic manufactured good. As before, < -1, implying dQ / dZ is positive. From
(14), the model's dynamics are given by dZ/dt = Q.
The evolution of per period output, Q, and cumulative output, Z , is represented in
Figure 2, where arrows indicate the dynamics. Initial output is Q0 (where Z=0), and the
economy moves along the Q(Z) curve with Q rising until cumulative output reaches the
boundary value, Z*. At this point the economy switches to the steady-state output level
Q*. Productivity grows along with Z, rising steadily until learning ceases. Thus the
manufacturing sector grows, productivity rises, and domestic prices fall over the interval
[0,Z*].16
13 Since Canada was open to unfettered inflows of capital, the constant returns assumption is a reasonable
approximation. 14 Because output is produced with a single factor in this model, a(Z) captures labour productivity alone.
The model can easily be generalized to include multiple factors of production, in which case a(Z) becomes
a measure of TFP. In our empirical investigation we derive TFP based on a four factor, log-linear, Cobb-
Douglas production function. 15 The agricultural sector is also the same as in the first model. Note that labour market clearing implies
that Lm = a(Z) -1 Q. 16 It could be argued that this is not a 'true' infant industry model because the industry grows independent of
any policy intervention. It would be possible to make the industry in this model a long run infant by
amending the learning curve such that no learning takes place unless output achieves some critical level.
12
INSERT FIGURE 2 HERE
The introduction of a tariff increases the demand for domestic manufactures so
that the impact on Q for a given Z is derived from (16) as:
Q / = ( d / ) [Lf / (1- da-1)2] > 0 , (17)
where is the ad valorem tariff. Thus, an increase in the tariff shifts the Q schedule up,
and both initial output and permanent long run output are increased (see Figure 2). As
well, the tariff speeds up the rate at which an industry proceeds up its experience curve,
and therefore brings forward the date at which it matures. Note, however, that the tariff
has only a transitional impact on productivity. In summary:
a) a protective tariff permanently increases the size of the manufacturing industry
relative to the no-tariff situation, and output and cumulative output grow faster;
b) manufacturing productivity grows faster than it would without the tariff, and
prices fall faster.
Similar to the industrial organization model, this model predicts that an increase
in tariff protection can accelerate output expansion, improve productivity, and reduce
prices. But here the channel is learning-by-doing.
4. Estimating the Impact of the National Policy Tariffs
4.1 Output, Productivity and Price
The neo-classical trade model that underpins the revisionist view of the National
Policy (Dales 1966, Easton et al. 1988), predicts slower growth in response to the
National Policy tariffs. Perhaps the most important distinction between this model, and
the industrial organization and learning-by-doing models, relates to prices and
productivity. In the neo-classical framework, domestic and foreign manufactured goods
are perfect substitutes which, in a small open economy, implies that the price of domestic
manufactured goods increases by the tariff rate. The industrial organization model yields
a very different prediction. In that model, domestic and foreign goods are imperfect
substitutes, and industries are characterized as free-entry oligopolies. A tariff, through its
effect on market demand and entry, increases firm size and lowers mark-ups, resulting in
Another approach would be to introduce foreign productivity growth so pm* is falling. In this case even
with domestic productivity growth, the relative size of the domestic market might not change and there
could be a permanent productivity gap. Krugman (1987) has a model with some of these characteristics.

13
higher productivity and lower prices. In the learning-by-doing model, the tariff increases
the rate at which domestic production experience accumulates, which accelerates
productivity growth and leads, for a time, to lower prices. Both models predict large
output effects, due to a combination of more firms and increased output per firm.
INSERT TABLE 3 HERE
To explore how well these models conform to the Canadian experience, we
analyse industry-specific output, productivity and price changes following the
introduction of the National Policy tariffs. In Table 3 we report annual percentage
changes in output, total factor productivity (TFP) and price for each industry and for our
three industry groups - target, broad and unaffected – averaged over the pre- and post-
National Policy periods. Although these performance indicators vary widely, producers
in the target and broad groups had slower output and productivity growth before 1879,
and faster output and productivity growth after, relative to the unaffected industries. As
well, the output prices of industries in the target and broad groups rose faster before 1879
and fell faster after 1879. For example, annual output growth in the target industries was
-2.2 percent from 1870 to 1879, and +7.4 percent from 1880 to 1913. TFP growth went
from -8.3 percent to +4.8 percent, and price changes from +4.7 percent to -1.0 percent.
In contrast, the unaffected industries experienced slower output and productivity growth
after 1879, and prices, after falling from 1870 to 1879 by -2.2 percent per year, increased
from 1880 to 1913 at 0.6 percent. To further explore the role of the National Policy in
these differences, we adopt treatment intensity and difference-in-differences (DID)
approaches that allow us to address the connections with more statistical rigour.
Before the implementation of the National Policy, the average ad valorem tariff
on manufactured goods was 14.9%.17 The average tariff in 1880 was 21.7%, and in 1890
it was 23.3%.18 The increase in protection was both abrupt and uneven in its application
17 Eugene Beaulieu and Jevan Cherniwchan generously provided data and documentation for the average
ad valorem tariffs used in this paper; = ∑ value all duties collected / ∑ value all manufactured imports
(for home consumption). Values are derived from product-specific figures reported in the Trade and
Navigation Reports. All products are assigned a six-digit Harmonized Description and Coding System
(HS6) code, then aggregated up to two-digit 1948 Standardized Industrial Classification (SIC2) industries
to match Urquhart (1993). See Beaulieu and Cherniwchan (2014) for a description of the aggregation. 18 Between 1879 and the mid-1890s protection was periodically extended both across and within industries.
These changes included a major revision of the tariff schedule in 1887, under Macdonald's finance minister,
Charles Tupper (McDiarmid 1946).

14
across industries. Between 1875 and 1880, Tobacco Products, for example, received an
increase in protection of 44 percentage points; the tariff on Transport Equipment
increased from just 1% in 1875 to 26.7% in 1880; and protection for Petroleum and Coal
Products tripled, from 6% to 18%. In contrast, tariffs on Non-ferrous Metal Products
increased by only 0.5 percentage points; and protection for Wood Products fell by 5
percentage points. Even Textiles, an industry regarded as one of the main beneficiaries
of the National Policy in much of the Canadian historiography, received only a 2.4
percentage point increase in tariff protection.
The uneven and abrupt implementation of Prime Minister John A. Macdonald's
protectionist agenda allows us to treat the National Policy as a 'natural experiment'. In
March 1879, in an environment where Canada's manufacturing industries were operating
under common domestic and international macroeconomic conditions, some industries
received substantially increased tariff protection while others did not. We first use a
treatment intensity approach to identify the impact of industry-specific tariff increases on
output, total factor productivity and prices, where we control for average growth before
and after the policy change.
The estimated effects from our treatment intensity equations are elasticities that
reflect the percentage change in output, productivity or price that occurred in response to
a 1 percent increase in industry-specific ad valorem tariff rate in 1879. The estimating
equations take the form:
ln xit - ln xit-1=α0+ α1 policyt+ α2 intensityi+ α3 (policyt intensityi)+et , (18)
where x represents output (q), total factor productivity (TFP), or output price (p);19 policy
is a regime variable that takes the value 0 before 1879 and 1 from 1879-1913; intensity is
measured as the percentage change in ad valorem tariff rates between 1875 and 1880;20 i
19 Output is measured as industry-specific gross value of production (Urquhart 1993: Table 4.1) divided by
an industry-specific output price index (Barnett 1966). TFP is measured as output relative to a Tornqvist
index of raw materials, labour, capital and fuel, with cost shares as weights. Input values are from
Urquhart (1993), and the industry-specific raw material price indexes are described in the Appendix. The
unskilled manufacturing wage index and the user cost capital are from Inwood and Keay (2012). The
Canadian coal price index is from Michell (1933). 20 If we use the level change in tariff rates between 1875 and 1880, or the percentage change between 1875
and the maximum rate over the 1880 to 1910 period as our measure of treatment intensity, standard errors
are affected, but our main qualitative conclusions hold. The ranking of our industries based on the
percentage change in tariff rates and the level or maximum change are statistically indistinguishable
(Kendall's = 0.676 (p-value=0.001) and 0.733 (p-value=0.000), respectively).

15
identifies industries, classified at the 2-digit,1948 SIC level; t identifies year; and e is an
error term. The data form a panel of 660 observations (15 industries over 44 years).21
The equations are estimated by generalized least squares (GLS), robust standard errors
are clustered by industry, and because the dependent variables are measured as log-
differences, random effects are included to control for unobserved, time-invariant
industry characteristics that are uncorrelated with the independent variables.22
The dependent variable in (18) is the annual growth rate of one of three
performance indicators; output, productivity or price. The constant term controls for
average changes in the dependent variables before 1879. The policy variable controls for
average changes in these indicators after 1879. The intensity variable controls for
changes in performance before 1879 that are correlated with the tariff adjustments that
occurred under the policy. Finally, the responsiveness of industry output, productivity
and price to the tariff changes - the treatment effect - is captured by the coefficient on the
interaction between the policy and intensity variables, α3 in (18). The sum of the intensity
and policy×intensity interaction effects (α2 + α3) reflects the aggregate impact of a 1
percent increase in tariff protection on an industry's growth rates averaged over the full
1870-1913 period.
INSERT TABLE 4 HERE
In Table 4 we report parameter estimates and robust standard errors for the output,
productivity and price treatment intensity equations. The elasticity of output growth with
respect to intensity under the National Policy is +3.6%, the elasticity of TFP growth is
+4.6%, and the elasticity of the price change is -4.6%. All these treatment effects are
highly significant. Even after we control for average growth rates and differential pre-
policy growth, industries that received greater tariff protection experienced faster output
and productivity growth, and lower price changes after 1879 than those industries with
smaller tariff changes.
In keeping with our comparisons in Table 3 and as further evidence of the impact
of the National Policy tariff, we have also estimate difference-in-differences (DID)
21 When we take the first difference of the natural logarithm of the dependent variables we lose one
observation for each industry, leaving us with 645 observations for estimation. 22 The dependent variables are first-differenced to ensure parallel pre-treatment trends and stationarity.
Log-differences minimize Akaike information criteria. First-differencing removes any unobserved, time-
invariant industry fixed effects that are correlated with the independent variables.

16
equations that use categorical variables to distinguish between industry groups. The DID
equations take the form:
ln xit - ln xit-1 = β0 + β1 policyt + β2 groupi + β3 (policyt groupi) + εt , (19)
where group takes the value 0 for the unaffected industries, and 1 for industries either in
the target or broad groups, as defined earlier. Table 5 reports the estimated treatment
effects and robust standard errors for output, productivity and price for both the target
and broad groups.23 The DID treatment effects are large and highly significant. The
output effect is +6.7% for the target group and +5.2% for the broad group. The
productivity effect is +10.6% for the target group and +8.0% broad group, and the price
effects are -6.7% and -5.6%.24 These results corroborate our treatment intensity
estimates. So, whether we base the impact of the National Policy tariffs on treatment
intensity or on industry groups, we obtain results consistent with the output, productivity
and price effects implied by the industrial organization and learning-by-doing new trade
models, but not by the neo-classical model.
INSERT TABLE 5 HERE
4.2 Endogeneity, Parallel Trends and Structural Change
Before accepting the treatment effects reported in Table 4 and 5 as identifying
causal connections, some caution must be exercised. First, because tariff changes under
the National Policy were determined politically, there is the question of endogenous
treatment. Second, growth trends across industries prior to 1879 may not have been
parallel, in which case our estimated treatment effects may be capturing pre-existing
differential trends that were unrelated to the policy. Third, even if the tariff was not
designed to pick ‘winners' based on industry performance prior to the policy, those
industries that enjoyed relatively large increases in tariff protection may have been in a
23 As a robustness check we also use an 'intent-to-treat' approach to industry categorization in which the
target group is comprised of either: only those industries that were strongly import competing before the
imposition of the National Policy; or all Canadian manufacturing industries (using matching US industries
as a control group). Even these target groups, which include some industries that received very small
changes in their tariffs after 1879, experienced relatively faster output and productivity growth, and falling
prices after the imposition of the National Policy (see Appendix Table A4: Panel A and B). 24 If we use a cost function approach to TFP measurement, we find that the tariff's treatment effect on
productivity remains large: +7.3% and +9.5% for the two treatment groups.

17
better position to exploit the structural changes that were transforming the Canadian
economy after 1879.
Endogeneity in the choice of tariffs has been raised in other contexts. Feenstra
and Lewis (1991), for example, develop a two-country model of negotiated trade
restrictions that includes a role for political pressure, and Karacaovali (2011: 34) includes
productivity differences in his study of tariff rate determination in Columbia, concluding
that: “...more productive sectors have...more to gain from lobbying and can potentially
generate more protection.”25 In the context of the National Policy, it seems clear that
treatment intensity was not randomly assigned, but there is no evidence that Canadian
policy makers structured tariffs to reward anticipated success. O.D. Skelton’s (1914:
140) General Economic History, 1867-1912 gives no indication of any intention or
awareness that the tariffs were intended to promote 'winners'. On the contrary, Skelton
reports that the tariff was seen as a defensive measure: “The home market must be
preserved. Conviction grew of its importance and its peril.” Prime Minister John A.
Macdonald’s addresses to Parliament make explicit the objectives of protection for
threatened industries and industrial diversification, as in his presentation to the House of
Commons in 1878 (Canada, House of Commons Debates 1878: 854): “(The National
Policy tariffs) will restore prosperity to...struggling industries, now so sadly depressed,
and will prevent Canada from being made a sacrifice market.”
The estimates in Tables 4 and 5 are consistent with Macdonald's speeches and
Skelton's assessment of how the National Policy tariffs were structured. In the 1870s, the
industries targeted by the National Policy were doing poorly; our intensity measures are
strongly negatively correlated with output and productivity growth and price reductions
before 1879 (2 < 0 for output and productivity growth, and > 0 for price changes). This
suggests that any plausible endogeneity in treatment works against our finding that larger
tariff increases promoted growth in the targeted industries.26
25 In the Canadian context, Beaulieu and Emery (2001) argue that pork packers' opposition to the removal
of protectionist tariffs may have contributed to the defeat of Wilfred Laurier's Liberal Party in the 1911
federal election. 26 Inwood and Keay (2012: Tables 2, 4, 5) report K/L ratios, TFP and returns to scale derived from the
1871 Canadian Industrial Census manuscripts for nine of the industries included in our study. Although
treatment by National Policy tariffs may not have been random, it was uncorrelated with the industries' K/L
ratios, TFP and RTS in 1871 (unconditional correlation = -0.010, 0.009 and -0.048, respectively).

18
We also address the question of endogeneity more formally by adopting an
instrumental variables (IV) strategy that uses a two-stage control function.27 In the first
stage we instrument for intensity in (18) with a set of political outcome, location and
market structure variables (Grossman and Helpman 1994).28 We find that treatment
intensity under the National Policy was high when an industry's value added (in 1871)
was concentrated in electoral districts with close votes in the 1878 federal election
(Conservatives' vote shares were near 50%), and in districts where voters strongly
supported the Conservative Party (Conservative vote shares exceeded 60%).29 An
industry's treatment intensity was also high if its value added in 1871 was concentrated in
Toronto or Montreal, or if the industry had a large, dominant firm.
Parameter estimates and robust standard errors from the second stage of our IV
estimation of (18), as well as diagnostic test results for instrument strength (first stage
partial F-test), instrument validity (Sargan's over-identification test), and the presence of
endogeneity (Hausman's specification test), are reported in Table 4. Even after
instrumenting for treatment intensity, we still find that output and productivity increased
faster, and prices more slowly for those industries that received large tariff increases
under the National Policy. In fact, the IV treatment effects are very similar to our
baseline estimates: the output elasticity is the same (3.6%); the TFP elasticity is slightly
higher, at 5.5%; and the price elasticity is slightly lower (-4.3%). This is further evidence
that any endogeneity in the choice of the tariff schedule does not alter our conclusions.
A second concern is that differential pre-treatment trends may have an impact on
our estimated treatment elasticities. We know that the targeted and broad industries were
growing more slowly than the unaffected industries during the 1870s, but there is no
evidence that growth rates among the industry groups were converging before the tariffs
were imposed. We cannot statistically distinguish between linear time trends in the
27 We note that the DID approach should be less affected by potential endogeneity, because industries
would have had more influence over the percentage change in their tariffs once they had been targeted for
protection, than they would have had over the government's decision to protect or not. 28 We use average Conservative vote share and average Conservative vote share squared in the ten largest
electoral districts - in terms of 1871 industry value added - a Toronto-Montreal urban dummy, and
industry-specific 1871 concentration ratios as excluded instruments in the first stage. See Appendix Table
A2 for first stage and diagnostic test results. 29 Holding all else constant, predicted treatment intensity is minimized in electoral districts where
Conservative vote shares in 1878 were approximately 57%.

19
industry groups' output, TFP or price growth rates during the pre-policy period. A
placebo test that imposes counterfactual treatment in 1875 reveals no statistically
significant treatment effects associated with output, productivity or price before the
policy. And a full set of year fixed effects interacted with treatment intensity also reveals
no significant treatment effects before tariffs were imposed in 1879.30 Growth rates
among the target and broad industries were not converging towards the unaffected
industries' growth rates prior to 1879.
A final identification issue to consider relates to the post-policy parallel trends
assumption. Structural changes were taking place in the economy between 1870 and
1913, including shifts in the geographic distribution of production and changes in
industry composition. Although all manufacturers were producing in a common
macroeconomic environment, they were not equally exposed to the structural changes
that were taking place. Using micro-data from the 1870-71 industrial census, Inwood and
Keay (2012: Table 2) report that the industries in the unaffected group were larger, more
capital intensive and more urban than industries in targeted groups. Moreover, according
to Barnett’s (1966: Table D.13) international trade shares, industries that experienced
smaller tariff changes were more export oriented. These differences introduce the
possibility that changes in the Canadian economic environment that were unrelated to
National Policy tariffs, could have had differential effects on the targeted and unaffected
industries.
Because the wheat boom (1896-1913) has long been identified as an era of
dramatic economic transformation in Canada, one approach is to truncate the time series
and re-estimate our treatment intensity equation over the pre-wheat boom years.
Restricting our panel to the 1870-1895 period, we still find statistically significant
differences in performance. The output and productivity of industries targeted by the
National Policy increased faster, and prices more slowly. The estimated treatment effects
from the truncated sample are all within +/- 1.5% of the full sample (see Table 4).31
30 Minimum p-values for 2 tests for common pre-treatment trends are 0.351 for output growth, 0.763 for
productivity growth, and 0.955 for price growth. For output growth we find only one positive and
significant treatment effect before 1879 (in 1871), for TFP we find no positive and significant pre-treatment
effects, and for price growth we find no negative and significant effects. 31 Results from the truncated sample estimates are reported in Appendix Table A3: Panel A.

20
Removing the wheat boom years deals with a particular concern about post-policy
parallel trends.32 To address the problem of structural change more generally, we re-
estimate (18) including controls for raw material prices, urban population levels, net
migration, and transport costs, where these variables are allowed to have differential
effects on the targeted and unaffected industries.33 The treated industries' performance
indicators are sensitive to changes in transport costs and urban population levels but, even
after controlling for these potentially confounding factors, the estimated treatment effects
are still large and significant.34
The results from the alternate specifications and tests all point to the robustness of
our empirical findings. As predicted by the industrial organization and learning-by-doing
models, we find that the National Policy tariffs promoted faster output and productivity
growth, and price declines among the industries that received larger increases in
protection.35
5. Returns to Scale and Learning-by-Doing
The industrial organization model predicts that the exploitation of internal scale
economies following the introduction of protective tariffs will trigger increases in output,
improvements in productivity and reductions in price. To investigate the importance of
internal returns to scale (RTS) for Canadian manufacturing industries, we estimate
industry-specific four-factor Cobb-Douglas production functions:
32 1879 was an unusual year in that it was the start of a recovery from a deep recession. If this recovery
was not uniform across treated and untreated industries, then including 1879 in the treatment period could
contribute to the violation of the parallel trends assumption. We find no changes in sign or significance
when we estimate treatment effects assuming treatment began in 1880 rather than 1879 (see Appendix
Table A3: Panel B). 33 If we estimate (18), dropping the policy x intensity interaction term and including our pre and post-policy
controls, the post-1879 regression residuals for the targeted groups and the unaffected group are statistically
indistinguishable from zero and each other. This is evidence that the targeted and unaffected groups'
conditional trends are parallel. 34 All industries appear only weakly affected by changes in raw material prices and net migration (see
Appendix Table A3: Panel C). Because Canadian manufacturing output (and productivity and price) could
have affected labour demand, and hence the incentive to move to Canada and the incentive to move into
urban centres, the OLS estimates of (18) and (19) with controls for urban population and net migration may
be biased due to endogeneity. Using an IV estimation approach the treatment effects (with controls) still
remain large and significant (see Appendix Table A3: Panel D). 35 These results, of course, do not include the general equilibrium or welfare effects of tariff protection.
Irwin (2000) finds that the protection of the tinplate industry in the US had negative welfare effects from
1870-1913. Head (1994) concludes that during the same period the protection of the U.S. steel rail industry
had, at best, as small positive welfare effect.

21
ln qit = γ0 + γ1 ln Lit + γ2 ln Kit +γ3 ln Mit +γ4 ln Fit + νt , (20)
where the factors of production are labour (L), capital (K), raw materials (M) and fuel
(F); ν is an error term; and t spans the post-policy period, 1880-1913.36 We derive
industry-specific RTS (= ∑ 𝛽𝑏4𝑏=1 ) from the estimated parameters in (20).
INSERT TABLE 6 HERE
Eight industries exhibit increasing returns to scale after 1879, two have decreasing
returns, and five constant returns (see Table 6). The median RTS is 1.057 (Chemical
Products), the minimum is 0.865 (Food and Beverages), and the maximum is 1.383
(Transport Equipment). All industry groups exhibit strongly increasing returns, but the
target and broad groups have significantly larger returns to scale than the unaffected
industries.37 This pattern in internal scale economies is consistent with the predictions of
the industrial organization model, where a higher protective tariff triggers increases in
output, thereby shifting industries' LL schedules, driving down mark-ups, reducing
average costs, and fostering larger returns to scale (see Figure 1).38
In the learning-by-doing model, productivity improvements and price reductions
result from more rapid accumulation of production experience following the imposition
of a tariff. To estimate the logistic experience curves (or learning rates) described by the
LBD model, we assume that cumulative output, Z, can proxy for production experience.39
ln TFPit = 0 +1 ln Zit + μt , (21)
where output is accumulated from 1880 to period t (Zit = ∑ 𝑄𝑖𝑗𝑡𝑗=1880 ); μ is an error term;
and the elasticity of TFP with respect to cumulative output, 1, can be used to calculate
36 Because we consider the imposition of protective tariffs under the National Policy a regime change, from
revenue-based tariffs to protection-based tariffs, our estimation period begins in 1880. Sensitivity tests
(reported in Appendix Table A5: Test 1) confirm that our qualitative conclusions are not affected by the
estimation of RTS over the full 1870-1913 period. We have insufficient degrees of freedom to reliably
estimate our production functions over the pre-policy period. Group and aggregate production functions
include industry fixed effects to control for time-invariant, industry-specific technological differences. 37 Our qualitative conclusions hold across three additional robustness tests: in Test 2 we move to a three-
factor log-linear Cobb-Douglas production function by dropping Fuel; in Test 3 we use a Value Added
output measure, which allows us to move to a two-factor production function by dropping both Fuel and
Raw Materials; in Test 4 we include a linear time trend to allow for neutral technological change (see
Appendix Table A5). 38 The unconditional correlation between Canadian manufacturing industries’ RTS and treatment intensity
is 0.671***. 39 Using industry data to estimate experience curves requires that we assume perfect knowledge spillovers
across firms within an industry, and no spillovers across industries or national borders. Head (1994: 149-
50) discusses the validity of these assumptions for late nineteenth and early twentieth century US steel rail
producers.
22
the learning rate (1-2-1), which measures the productivity gain from a doubling of output
experience.40 The learning rate also reflects the rate at which industries are approaching
maturity, [a*, T*].
Twelve of the industries exhibit statistically significant learning-by-doing. The
median learning rate is 18 percent, and learning rates for those industries with significant
output elasticities range from 8.9 percent for Tobacco to 56.9 percent for Paper.41 All
three industry groups have large and significant cumulative output elasticities, but the
target and broad treatment groups have higher learning rates than the unaffected group.42
The more rapid learning rates among the industries most affected by the National Policy
are consistent with the learning-by-doing model's prediction that tariffs trigger increases
in output, causing industries to move further along their learning curves, leading to
accelerating productivity improvement and lower prices.43
The returns to scale and learning rates reveal the presence of both internal and
external scale economies following the introduction of the National Policy. Recognizing
that the mechanisms were not mutually exclusive, we can compare their effects with a
simple 'back-of-the-envelope' calculation. Among the target industries, the DID treatment
effect on output growth is +6.7% (Table 5) and our estimate of this group's internal scale
economies is 1.3 (Table 6). The implied contribution of RTS to productivity is +1.5%
(.067×𝑅𝑇𝑆−1
𝑅𝑇𝑆), or 14.2 percent of the total DID treatment effect of the tariff on TFP
(+10.6% from Table 5). Similarly, we can use the learning rates reported in Table 6 and
the output treatment effects reported in Table 5 to derive a productivity contribution that
can be attributed to the more rapid accumulation of production experience. Among the
40 We accumulate output in our experience curves over the post-National Policy period because we are
implicitly assuming that the imposition of protective tariffs in 1879 marked the start of a new regime in the
process of learning-by-doing. Group and aggregate learning curves include industry fixed effects to control
for time-invariant, industry-specific differences in learning by doing. 41 Dutton, Thomas and Butler (1984: Figure 3) report learning rates from 162 US industries that range from
-7% to +50%, with a median learning rate of approximately 20%. 42 Learning rates may differ across industries due to forces unrelated to cumulative output experience, such
as neutral technological change (Adler 1990) or capital accumulation (Thompson 2001). Our qualitative
conclusions hold across three robustness tests: in Test 4 we use a cost function approach to measure TFP as
our dependent variable; in Test 5 we include the natural logarithm of fixed capital as an additional control
variable; and in Test 6 we include a linear time trend to control for neutral technological change (see
Appendix Table A6). 43 The unconditional correlation between Canadian manufacturing industries’ learning rates and treatment
intensity is 0.286.
23
target group, 24.5 percent of the tariff's impact on productivity can be attributed to
learning-by-doing, and the corresponding impact for the broad group is 20.2 percent.44
These calculations suggest that, if we assume Canadian manufacturers' internal and
external scale economies were technologically separable, nearly 40 percent of the total
impact of the tariff on productivity can be attributed to the combined effect of internal
returns to scale and learning-by-doing.45
6. Conclusions
Since protective tariffs were introduced as part of the National Policy there has
been a debate over their impact on Canadian industrial development. The traditional
view is that increased tariff protection was a key element in Canadian industrialization.
In contrast, those relying on neo-classical trade models argue that protective tariffs
slowed intensive, and possibly extensive growth. New trade models, however, hark back
to the traditional view, focusing on the advantages provided by protection for infant
industries. Industrial organization models predict an increase in market size following
the imposition of protective tariffs, triggering output expansion, lower average costs,
improved productivity, and lower prices. These effects operate through internal returns
to scale. Relying on external returns, learning-by-doing models predict output expansion,
productivity improvement and lower prices, as producers accumulate experience more
rapidly.
Using treatment intensity and difference-in-differences approaches we find large
and statistically significant output, total factor productivity and price treatment effects
following the introduction of the 1879 National Policy tariffs. These effects hold across a
range of specifications designed to deal with potential problems of endogeneity, and
differential pre- and post-treatment trends. We also find large and statistically significant
increasing returns to scale among the industries most affected by National Policy tariffs,
as well as large and significant learning-by-doing effects. The size and pattern of these
44 For the target treatment group the output treatment effect of 0.067, multiplied by the cumulative output
elasticity of 0.39, implies a productivity treatment effect of 0.026, or 24.5% of the estimated total
productivity effect of the tariff. 45 Because learning is not controlled for in our production functions, the assumption of separable internal
and external economies is unlikely to hold, and this estimate of the aggregate productivity impact must be
viewed as an upper bound.

24
internal and external scale economies are consistent with the predictions of the new trade
models. The empirical evidence does not prove causation, nor can it clearly distinguish
the relative importance of the different mechanisms. Nevertheless, the models highlight
channels through which the tariffs may have contributed to Canadian industrial
development.
More generally, our findings support the traditional view of the National Policy,
which dates back to the National Policy itself. In the early 1880s, the House of
Commons formed a select committee (Canada, House of Commons 1883) to, “...inquire
into the operation of the tariff.” As part of the inquiry, the committee commissioned
Alfred H. Blackeby to look into the state of manufacturing in Ontario and Quebec, and
Edward Willis to do the same for the Maritime provinces. Each surveyed hundreds of
firms, writing detailed reports for the committee. Their conclusions are remarkably in
line with our statistical analysis. Blackeby and Willis report significant increases in
output, as well as productivity improvements and price declines. Blackeby (1883: 4, 6),
for example, reports:
The value of the product in money does not represent the whole of the
increase which has taken place...Prices are so much lower now in most cases
that a like production in value would mean a 10 to 15 percent difference in
bulk...Production has increased in a greater ratio than the number of hands,
showing by means of better appliances and facilities brought into use, by
reason of the larger trade to be done, each man produces more now than six
years ago... That the general result of that change [the 1879 tariff] has proved
decidedly beneficial to manufacturing industries there is now no dispute, and
is fully borne out by the figures herewith submitted.
Blackeby and Willis' findings are in stark contrast to the revisionist view articulated by
Dales (1966: 109-10): "[the tariff] is the price we pay for our protected manufacturing
industry...protection fosters inefficient, oligopolistic forms of market organization in
Canada...Canadian growth has been distorted by the National Policy."
The traditional view of the National Policy, as reflected in Blackeby's and Willis’
findings, is very much in line with our results. Perhaps equally important, our

25
conclusion, that infant industry protection promoted Canadian industrial development,
has potentially broad implications for other countries and time periods.

26
7. References
Adler, P.S. (1990), "Shared Learning," Management Science 36, 938-57.
Altman, M. (1987), "A Revision of Canadian Economic Growth: 1870-1910," Canadian
Journal of Economics 20, 86-113.
Amiti, M. and J. Konings (2007), "Trade Liberalization, Intermediate Inputs, and
Productivity: Evidence from Indonesia," American Economic Review 97, 1611-38.
Arrow, K. J. (1962), "The Economic Implications of Learning by Doing," Review of
Economic Studies 29, 155-73.
Baldwin, J.R. (1969), "The Case against Infant-Industry Tariff Protection," Journal of
Political Economy 75, 295-305.
Baldwin, J.R. and A.G. Green (2008), "The Productivity Differential Between the
Canadian and US Manufacturing Sectors: A Perspective Drawn from the Early Twentieth
Century," Canadian Productivity Review 22, 1-35.
Barnett, R.F.J. (1966), "Canada's Manufacturing Development and Foreign Trade, 1870-
1915," Department of Economics, Bishops University, mimeograph.
Bertram. G. W. (1963), "Historical Statistics on Growth and Structure in Manufacturing
in Canada, 1870-1957," in J. Henripin and A. Asimakopolous, eds., Canadian Political
Science Association Conference on Statistics, 1962 and 1963 (Toronto), 93-146.
Beaulieu, E. and J. Cherniwchan (2014), "Tariff Structure, Trade Expansion and
Canadian Protectionism from 1870-1910," Canadian Journal of Economics 47, 144-72.
Beaulieu, E. and H. Emery (2001), "Pork Packers, Reciprocity and Laurier's Defeat in the
1911 Canadian General Election", Journal of Economic History 62, 1083-1101.
Bils, M. (1984), “Tariff Protection and Production in the Early U.S. Cotton Textile
Industry,” Journal of Economic History 44, 1033-45.
Canada (1883), Census of Canada, 1880-81, Vol. 2 (Ottawa).
Canada (1894), Census of Canada, 1890-91, Vol. 3 (Ottawa).
Canada (Various Years), "Trade and Navigation Reports," Sessional Papers, Parliament
of Canada (Ottawa).
Canada, House of Commons (1883), Select Committee to Inquire into the Operation of
the Tariff on the Agricultural Interests of the Dominion, Reports (Ottawa).

27
Canada, House of Commons (March 7, 1878), Debates (Ottawa).
Carter S., S. Gartner, M. Haines, A. Olmstead, R. Sutch and G. Wright, eds. (2006),
Historical Statistics of the United States:Millennial Edition (New York: Cambridge
University Press).
Dales, J.H. (1966), The Protective Tariff in Canada's Development (Toronto: University
of Toronto Press).
David, P.A. (1970), "Learning by Doing and Tariff Protection: A Reconsideration of the
Case of the Ante-Bellum United States Cotton Textile Industry," Journal of Economic
History 30, 521-601.
Dutton, J.M., A. Thomas and J.E. Butler (1984), "The History of Progress Functions as a
Managerial Technology," Business History Review 58, 204-33.
Easterbrook, W.T., and Aitken, H.G.J. (1956), Canadian Economic History (Toronto:
Macmillan).
Easton, S. T., Gibson, W. A., and Reed. C. G. (1988), "Tariffs and Growth: The Dales
Hypothesis," Explorations in Economic History 25, 147-63.
Feenstra, R.C. and T.R. Lewis (1991), "Negotiated Trade Restriction with Private
Political Pressure," Quarterly Journal of Economics 106, 1287-1307.
Firestone, O.J. (1960), "Development of Canada's Economy," in Conference on Research
in Income and Wealth, Trends in the American Economy in the Nineteenth Century,
Studies in Income and Wealth, vol. 24 (Princeton: N.B.E.R. and Princeton University
Press).
Green, A.G. and G.R. Sparks (1999), “Population Growth and the Dynamics of Canadian
Development: A Multivariate Time Series Approach,” Explorations in Economic History
36, 56-71.
Green, A.G. and M.C. Urquhart (1987), "New Estimates of Output Growth in Canada,"
Perspectives on Canadian Economic History, D. McCalla (ed), Toronto: Copp, Clark,
Pitman.
Grossman, G.M. and E. Helpman (1994), "Protection for Sale," American Economic
Review 84, 833-50.
Harris, R.G. (1984), "Applied General Equilibrium Analysis of Small Open Economies
with Scale Economies and Imperfect Competition," American Economic Review 74,
1016-33.

28
Hartland, P. (1955), "Factors in Economic Growth in Canada," Journal of Economic
History 15, 13-22.
Head, K. (1994), "Infant Industry Protection in the Steel Rail Industry, " Journal of
International Economics 37, 141-65.
Horstmann, I. and J. Markusen (1986), "Up the Average Cost Curve: Inefficient Entry
and the New Protectionism," Journal of International Economics 20, 225-247.
Inwood, K. (1995), "The Census Representation of Canadian Industry, 1871-91," Social
History 28, 347-74.
Inwood, K. and I. Keay (2012), "Diverse Paths to Industrial Development: Evidence from
Late Nineteenth Century Canada," European Review of Economic History 16, 311-33.
Inwood, K. and I. Keay (2013), "Trade Policy and Industrial Development: Iron and Steel
in a Small Open Economy, 1870-1913," Canadian Journal of Economics 46, 1265-94.
Irwin, D. (2000), "Did Late-Nineteenth Century US Tariffs Promote Infant Industries?
Evidence from the Tinplate Industry," Journal of Economic History 60, 335-60.
Irwin, D. and P. Temin (2001), “The Antebellum Tariff on Cotton Textiles Revisited,”
Journal of Economic History 61, 777-98.
Isserlis, L. (1938), "Tramp Shipping Cargoes and Freights," Journal of the Royal
Statistical Society 101, 53-146.
Karacaovali, B. (2011), “Productivity Matters for Trade Policy: Theory and Evidence,”
International Economic Review 52, 33-62.
Krueger, A. and B. Tuncer (1982), “An Empirical Test of the Infant Industry Argument,”
American Economic Review 72, 1142-52.
Krugman, P. (1987), "The Narrow Moving Band, the Dutch Disease, and the Competitive
Consequences of Mrs. Thatcher," Journal of Development Economics 27, 41-55.
McDiarmid, O.J. (1946), Commercial Policy in the Canadian Economy (Cambridge MA:
Harvard University Press).
McDougall, D.M. (1971), "Canadian Manufacturing Commodity Output, 1870-1915,"
Canadian Journal of Economics 4, 21-36.
Melitz, M.J. (2005), “When and How Should Infant Industries Be Protected,” Journal of
International Economics 66, 177-96.

29
Melitz, M.J. and D. Trefler (2012), "Gains from Trade when Firms Matter," The Journal
of Economic Perspectives 26, 91-118.
Michell, H. (1931), Statistical Contributions to Canadian Economic History, Volume 2
(Toronto: MacMillan).
Schor, A. (2004), “Heterogeneous Productivity Response to Tariff Reduction: Evidence
from Brazilian Manufacturing Firms,” Journal of Development Economics 75, 373-96.
Skelton, O.D. (1914), “General Economic History, 1867-1912,” in A. Shortt and A.
Doughty, eds., Canada and Its Provinces, Vol. 9 (Toronto: Edinburgh University Press).
Thompson, P. (2001), "How Much did the Liberty Shipbuilders Learn? New Evidence
for an Old Case Study," Journal of Political Economy 109, 103-37.
Urquhart, M. C. (1986), "New Estimates of Gross National Product, Canada, 1870-1926,"
in S.L. Engerman and R.E. Gallman, eds., Long-Term Factors in American Economic
Growth (Chicago: N.B. E.R. and University of Chicago Press).
Urquhart, M.C. (1993), Gross National Product of Canada, 1870-1926: Derivation of the
Estimates (Montreal: Queen's McGill Press).
Urquhart, M.C. and K.A.H. Buckley (1965), Historical Statistics of Canada (Toronto:
MacMillan).
Williamson, J.G. (1972), "Embodiment, Disembodiment, Learning by Doing, and
Returns to Scale in Nineteenth Century Cotton Textiles," Journal of Economic History
32, 691-705.
Young, J.H. (1955), "Comparative Economic Development: Canada and the United
States," American Economic Review: Papers and Proceedings 45, 80-93.
30
8. Tables and Figures
Table 1. Canadian population, manufacturing value added and GDP
(average annual percentage changes)
Population GDP Manufacturing
value added
GDP per
capita
Manufacturing value
added per capita
1870-79 1.6 1.9 1.7 0.3 0.1
1880-89 1.2 3.6 5.4 2.4 4.2
1890-99 1.0 3.2 2.3 2.2 1.3
1900-09 2.6 5.8 5.9 3.2 3.3
1870-78 1.6 1.0 1.3 -0.6 -0.3
1879-95 1.2 3.4 3.6 2.2 2.4
1896-1913 2.3 5.8 5.3 3.5 3.0
1870-1913 1.7 4.0 3.9 2.3 2.2
Note: Annual percentage change = log difference × 100. Values are in 1900 prices. All series are
from Urquhart (1993: Tables 1.1 and 1.6).
31
Table 2. Canadian manufacturing output by industry
(average annual percentage changes)
GDP deflator Industry deflators
1870-79 1880-89 1880-1913 1870-79 1880-89 1880-1913
FoodU 1.6 6.0 4.1 3.7 4.1 3.6
TobaccoT 0.0 7.8 5.9 -2.8 7.4 5.0
RubberU 3.8 11.5 9.9 1.6 12.9 11.1
LeatherU -3.7 2.0 2.3 -4.7 2.3 1.7
TextilesU 5.6 7.1 2.9 5.6 7.7 3.0
ClothingU 5.4 7.2 4.4 6.8 8.3 6.0
WoodU 0.7 6.2 3.1 4.8 0.5 1.2
PaperT 4.2 8.1 6.8 -4.3 13.7 10.0
PrintingB 5.9 4.9 4.2 5.6 6.3 4.8
Iron - SteelB -1.4 7.6 5.8 -2.4 8.4 7.5
TransportationT 3.5 2.1 4.8 -5.1 1.5 7.3
Non-Ferrous MetalsU 9.4 5.0 7.2 10.2 5.3 8.3
Non-Metallic MineralsU 4.3 0.6 4.8 8.4 -0.1 5.4
Petroleum - CoalT 4.0 -5.1 2.9 3.9 1.3 5.4
ChemicalsU 4.3 3.9 5.3 5.8 4.0 5.7
All industries 1.4 5.4 4.4 1.5 4.5 4.7
Target 3.3 2.7 4.9 -6.3 5.0 5.8
Broad 1.4 5.4 5.2 -3.1 6.0 5.8
Unaffected 1.4 5.5 3.9 3.3 3.9 4.1
Note: See Table 1 notes, Appendix Table A1, and discussion in text. T is target; B is broad; U is
unaffected. Output = value added in production; GDP deflator is from Urquhart (1993: Table
1.6); industry deflators are based on wholesale prices for industry-specific output goods, weighted
by gross value of production. Details on the industry deflators are given in the data appendix.

32
Table 3. Manufacturing performance indicators
(average annual percentage changes)
Output TFP Price
1870-79 1880-1913 1870-79 1880-1913 1870-79 1880-1913
FoodU 4.3 3.1 -1.5 -0.4 -2.4 1.3
TobaccoT -2.2 4.7 -7.8 0.3 2.4 1.7
RubberU -1.9 10.2 -6.4 1.0 1.9 -0.3
LeatherU -2.1 1.8 -0.4 -0.3 0.7 1.4
TextilesU 3.8 3.0 -9.3 0.6 -0.3 0.8
ClothingU 7.0 5.6 1.8 2.6 -1.7 -0.7
WoodU 4.6 1.1 3.1 -1.3 -4.4 2.7
PaperT -3.2 9.9 -13.6 6.6 8.2 -2.4
PrintingB 6.0 4.4 -2.1 1.4 0.0 0.2
Iron-SteelB -1.1 7.6 -3.8 2.3 0.6 -0.9
TransportT -3.3 7.9 -11.1 3.2 8.3 -1.7
Non-FerrousU 10.6 8.9 -1.0 2.4 -1.1 -0.3
Non-MetallicU 9.2 5.5 2.2 1.9 -4.5 0.2
PetroleumT 5.1 6.2 -11.7 2.7 -0.2 -1.6
ChemicalsU 5.2 5.2 -0.7 0.4 -1.9 0.4
All industries 2.3 4.5 -2.0 1.0 -0.5 0.5
Target -2.2 7.4 -8.3 4.8 4.7 -1.0
Broad -1.5 7.3 -7.1 4.1 4.2 0.2
Unaffected 3.7 3.4 0.1 -0.4 -2.2 0.6
Note: See Table 1 and 2 notes. Output = gross value of production deflated by industry wholesale
price indexes; total factor productivity = Tornqvist index using output, labour, capital, raw
materials and fuel, with cost shares as input weights.

33
Table 4. National Policy treatment effects: treatment intensity, 1870 - 1913
GLS IV
Output TFP Price Output TFP Price
Control - pre-NP
(constant)
Treatment - pre-NP
(intensity)
Control - post-NP
(policy)
Treatment effect
(intensity x policy)
0.042***
(0.015)
-0.027***
(0.007)
0.009
(0.018)
0.036***
(0.008)
-0.003
(0.016)
-0.042***
(0.008)
0.015
(0.019)
0.046***
(0.010)
-0.015
(0.012)
0.037***
(0.007)
0.021
(0.014)
-0.046***
(0.010)
0.039***
(0.015)
-0.023***
(0.009)
0.009
(0.019)
0.036***
(0.011)
0.003
(0.014)
-0.050***
(0.0010)
0.009
(0.017)
0.055***
(0.011)
-0.012
(0.015)
0.033**
(0.013)
0.019
(0.018)
-0.043***
(0.017)
N
First stage partial F-test
Hausman specification test
Sargan over-ID test
R2
645
0.010
645
0.022
645
0.018
645
2.71
(0.258)
2.53
(0.470)
0.011
645
10.63
(0.000)
3.27
(0.195)
0.941
(0815)
0.023
645
3.27
(0.195)
0.769
(0.857)
0.019
Note: See Table 2 notes, estimating equations described in text, and Appendix Table A2. Log-
differenced dependent variables; random effects GLS and IV estimation; robust standard errors
(clustered by industry) reported in parentheses; treatment intensity = % Δ tariff (τ ) between 1875
and 1880. Excluded instruments for treatment intensity include: average Conservative Party vote
share in 10 largest census districts (district choice based on 1871 industry value added);
Conservative vote share squared; urban fixed effect (=1 for Toronto and Montreal districts);
concentration ratio (= value added for largest establishment / value added for district). First stage
weak instrument partial F-Test identifies statistically significant excluded instruments in first
stage (H0 = jointly significant first stage excluded instruments); Hausman specification test (2
with 2 degrees of freedom) identifies the presence of endogeneity (H0 = exogenous second stage
explanatory variables); Sargan over-identification test (2 with 2 degrees of freedom) identifies
instrument validity (H0 = exogenous first stage excluded instruments). *, **, *** indicate
statistical significance with 90%, 95%, 99% confidence.

34
Table 5. National Policy treatment effects: difference-in-differences, 1870-1913
Target treatment group Broad treatment group
Output TFP Price Output TFP Price
Control - pre-NP (constant)
Treatment - pre-NP (group)
Control - post-NP (policy)
Treatment effect (group x policy)
0.038**
(0.016)
-0.049**
(0.019)
0.013
(0.018)
0.067***
(0.024)
-0.004
(0.013)
-0.091***
(0.022)
0.016
(0.014)
0.106***
(0.030)
-0.006
(0.011)
0.054*
(0.029)
0.010
(0.013)
-0.067*
(0.035)
0.040**
(0.019)
-0.036
(0.023)
0.011
(0.021)
0.052*
(0.019)
-0.001
(0.016)
-0.068***
(0.025)
0.012
(0.017)
0.080***
(0.031)
-0.008
(0.013)
0.043*
(0.024)
0.015
(0.015)
-0.056**
(0.028)
N
R2
645
0.009
645
0.026
645
0.011
645
0.010
645
0.022
645
0.010
Note: See Table 4 notes and estimating equations described in text. *, **, *** indicate statistical
significance with 90%, 95%, 99% confidence.

35
Table 6. Returns to scale and learning-by-doing, 1879-1913
Returns to scale Learning-by-doing
Z elasticity Learning rate
FoodU
TobaccoT
RubberU
LeatherU
TextilesU
ClothingU
WoodU
PaperT
PrintingB
Iron-SteelB
TransportT
Non-FerrousU
Non-MetallicU
PetroleumT
ChemicalsU
0.865**
1.007
0.958
1.097
0.895*
1.271**
1.010
1.327***
1.001
1.257***
1.383**
1.135**
1.054**
1.128**
1.057***
0.051
0. 089**
0.121**
0.079
0.128***
0.223***
0.141***
0.569***
0.119***
0.185***
0.187***
0.235***
0.184***
0.327***
- 0.018
0.035
0.060
0.080
0.054
0.085
0.143
0.093
0.326
0.079
0.120
0.122
0.151
0.120
0.203
-0.013
All industries 1.212*** 0.209*** 0.135
Target
Broad
Unaffected
1.297***
1.282***
1.158**
0.388***
0.318***
0.143***
0.236
0.198
0.095
Note: Estimating equations described in text. *, **, *** indicate statistical significance with at
least 90%, 95%, 99% confidence.

36
Figure 1: Industrial organization model: the effect of a tariff
Population L
Output / Firm q
Market Size Schedule
q=w(fL)½
L0 L'
q'
q0
LL
LL'

37
Figure 2: Learning-by-doing model: the effect of a tariff
Cumulative Output Z
Industry Q
Z*
Q̂
*Q
0Q̂
0Q
Dynamics with Tariff )(' ZQ
Dynamics without Tariff )(ZQ


