Download - PROJECT INFORMATION - Oklahoma
PROJECT INFORMATION Sponsoring Organization Oklahoma Department of Transportation
DUNS Number 8247000740000
EIN 736017987
Name of Project Reconstruction of US-281 “Bridgeport” Bridge over Canadian River
Type of Project Bridge
Location of Project Canadian and Caddo Counties, Oklahoma
Urban/Rural Rural
Congressional District 3rd
BUILD Application Amount Requested $22,000,000
BUILD Application Agency Match $12,895,000
Primary Point of Contact Matthew Swift, Division Engineer
Strategic Asset & Performance Management, ODOT
(405) 521-2704

1.0 PROJECT DESCRIPTION ............................................................................................................................ 1
1.1 Project History ..................................................................................................................................... 3
1.2 Transportation Challenges .................................................................................................................. 5
2.0 PROJECT LOCATION................................................................................................................................. 7
3.0 GRANT FUNDS, SOURCES AND USES OF PROJECT FUNDS ...................................................................... 8
3.1 Funding Sources .................................................................................................................................. 8
3.2 Project Budget ..................................................................................................................................... 8
4.0 SELECTION CRITERIA ............................................................................................................................. 10
4.1 Primary Selection Criteria ................................................................................................................. 10
4.1.1 Safety ......................................................................................................................................... 10
4.1.2 State of Good Repair .................................................................................................................. 11
4.1.3 Economic Competitiveness ........................................................................................................ 13
4.1.4 Environmental Sustainability ..................................................................................................... 16
4.1.5 Quality of Life ............................................................................................................................. 17
4.2 Secondary Selection Criteria ............................................................................................................. 18
4.2.1 Innovative Technology ............................................................................................................... 18
4.2.2 Innovative Project Delivery ........................................................................................................ 20
4.2.3 Innovative Financing .................................................................................................................. 20
4.2.4 Partnership ................................................................................................................................. 21
5.0 ENVIRONMENTAL RISK REVIEW ............................................................................................................ 21
5.1 Project Schedule ............................................................................................................................... 21
5.3 Required Approvals ........................................................................................................................... 22
5.3.1 Environmental Permits and Reviews ......................................................................................... 22
5.3.2 State and Local Approvals .......................................................................................................... 24
5.3.3 Federal Transportation Requirements Affecting State and Local Planning ............................... 25
5.4 Assessment of Project Risks and Mitigation Strategies .................................................................... 25
6.0 BENEFIT COST ANALYSIS ....................................................................................................................... 26
6.1 Summary of Findings and BCA Outcomes ......................................................................................... 26
6.2 BCA Sensitivity Analysis ..................................................................................................................... 28

Figure 1 – Original Route 66 Corridor through the U.S. ................................................................................ 1
Figure 2 – Bridgeport Bridge (historicbridges.org) ....................................................................................... 2
Figure 3 – Worsening Cracks and Corrosion in Gusset Plates....................................................................... 2
Figure 4 – 2016 Alternative Analysis Overview Map .................................................................................... 4
Figure 5 – Heavy Truck Traffic on the Bridge ................................................................................................ 5
Figure 6 – Existing and Proposed Bridge Cross Sections ............................................................................... 6
Figure 7 – Project Location Map ................................................................................................................... 7
Figure 8 - Accident History on the Bridgeport Bridge, 2013-2018 .............................................................. 10
Figure 9 – Bridgeport Bridge – Detour Route ............................................................................................. 12
Figure 10 – Arkansas River Shiner ............................................................................................................... 16
Figure 11 – Route 66 Museum – Clinton, OK .............................................................................................. 17
Figure 12 – Bicycle Route 66 (www.adventurecycling.org) ........................................................................ 18
Figure 13 – Construction with Pre-Cast Abutments ................................................................................... 19
Figure 14 – Summary of Schedule Highlights ............................................................................................. 22
Figure 15 – Historic Purcell-Lexington Bridge ............................................................................................. 24
Table 1 – Project Funding Sources ………………………………………………………………………………………………………..8
Table 2 - Uses of Funds and Project Budget ………………………………………………………………………………………….9
Table 3 – Summary of Costs in Millions of 2018 Dollars ………………………………………………………………………..13
Table 4 – Summary of Job Creation and Economic Impact …………………………………………………………………..15
Table 5 – Overall Results of the Benefit Cost Analysis in Millions of 2018 Dollars ………………………………….27
Table 6 – Overall Benefits in Millions of 2018 Dollars ……………………………………………………………………………28
Table 7 – Quantitative Assessment of Sensitivity, Summary ………………………………………………………………… 29

1.0 PROJECT DESCRIPTION The Oklahoma Department of Transportation (ODOT) is presenting this application for Better
Utilizing Investments to Leverage Development (BUILD) funding for the reconstruction of the
structurally deficient multi-span pony truss bridge on current US-281 (old Route 66) over the
Canadian River between Canadian and Caddo Counties in Oklahoma. The bridge and 17.7-mile
corridor of roadway on which it is located is listed on the National Register of Historic Places
(NRHP). Utilizing innovative methods, ODOT wishes to address the deficient conditions of the
bridge and preserve the historic integrity of this corridor. ODOT is eager to present the merits
of this project for consideration and is requesting $22,000,000 in BUILD funds to assist with
construction costs associated with this historic bridge reconstruction project.
Officially commissioned in 1926, Route
66 traversed 2,448 miles from Chicago,
Illinois to Santa Monica, California
(Figure 1). More than 400 of those
original road miles ran through the State
of Oklahoma. ODOT maintains several
hundred miles of the original Route 66
road alignment along with the
associated original bridge structures. In
cooperation with United States
Department of Transportation (USDOT)
guidelines and in consultation with the
Oklahoma State Historic Preservation
Officer (SHPO) and other interested parties, ODOT is committed to prioritizing the historic
preservation of these segments.
The existing bridge was constructed in 1933 as part of the original Route 66 corridor. The
approximately 3,945-foot long Warren pony truss structure consists of 38 100-foot long
“camelback” pony truss spans, with two 36-foot long multi-beam approach spans at either end
(Figure 2). The bridge is evaluated and inspected by ODOT on a biannual basis and is
summarized in a “Fracture Critical Bridge Inspection Report.” According to the latest report
(October 2019), the bridge is rated as structurally deficient (SD), having several critical elements
that are rated in poor condition, including the deck and superstructure (see bridge inspection
reports (BIR) at US-281 Bridgeport BUILD.
Figure 1 – Original Route 66 Corridor through the U.S.

In 2019, the bridge was posted for the restriction of heavy traffic loads, first with a maximum of
15 tons, then lowered to a maximum of 9 tons after worsening cracks and corrosion were
discovered in gusset plates (Figure 3), floor beams and stringers. Due to the quickly
deteriorating condition of the bridge, as of May 2020, ODOT has determined that even with
ongoing inspection and maintenance, the bridge will have to be closed to all traffic within 7
months.
Figure 3 – Worsening Cracks and Corrosion in Gusset Plates
The bridge is currently 24 feet wide with one driving lane in each direction. The roadway
approaches at either end of the bridge consist of an 18-foot wide concrete (with asphalt
overlay) driving surface (two 9-foot driving lanes) with no shoulders, part of the original Route
2013 2018
Figure 2 – Bridgeport Bridge (historicbridges.org)

66 roadway. The current average annual daily
traffic (AADT) on US-281 across the bridge is
1,800 vehicles per day. Approximately 21% of
the daily vehicles are trucks and 12% are heavy
trucks (see traffic information at US-281
Bridgeport BUILD). The high truck volumes are a
concern for the aging structure, and field
observations indicate that many overweight
vehicles continue to use the bridge, despite its
load posting.
The project proposed in this application will reconstruct the bridge on its current alignment
with a 28-foot width. The reconstruction of the bridge will include replacing the substructure,
deck and entire superstructure. The historic pony trusses will be re-attached to maintain the
historic integrity of the original bridge. The bridge will also be repainted and restored to its
original look. Maintaining the bridge’s original look and feel, as well as the majority of its
original truss members, will preserve the historic context for years to come. The improvements
will be completed in accordance with AASHTO Guidelines for Historic Bridge Rehabilitation.
The Oklahoma legislature designated the Historic Route 66 as a State Scenic Byway in January
2005. In 2009, the U.S. National Park Service designated the entirety of Route 66 in Oklahoma
as a National Scenic Byway. ODOT is seeking the BUILD grant funds in order for the Bridgeport
Bridge to be restored and open to traffic in time with the planned 2026 Route 66 Centennial
celebrations.
1.1 Project History
As the bridge has aged and the size and number
of vehicles using the bridge has increased, ODOT
has recognized the need to make improvements
to the structure. In 2014, ODOT began an
alternatives analysis of the bridge, understanding
that the historic significance of the bridge would
demand a thorough review of all possible options to meet the requirements of Section 106 of
the National Historic Preservation Act and Section 4(f) of the Department of Transportation Act.
ODOT also saw the need to engage stakeholders early, knowing that there would be many
preservation-focused groups interested in the project.
Completed in 2016, the Alternatives Analysis evaluated rehabilitation and replacement options
for the Bridgeport Bridge, in accordance with FHWA’s Programmatic Section 4(f) Evaluation and
21% of the 1,800
vehicles driving on the bridge each day are trucks, despite a 9-ton maximum load posting.
The Bridgeport Bridge is widely considered
Oklahoma’s most significant historic bridge.
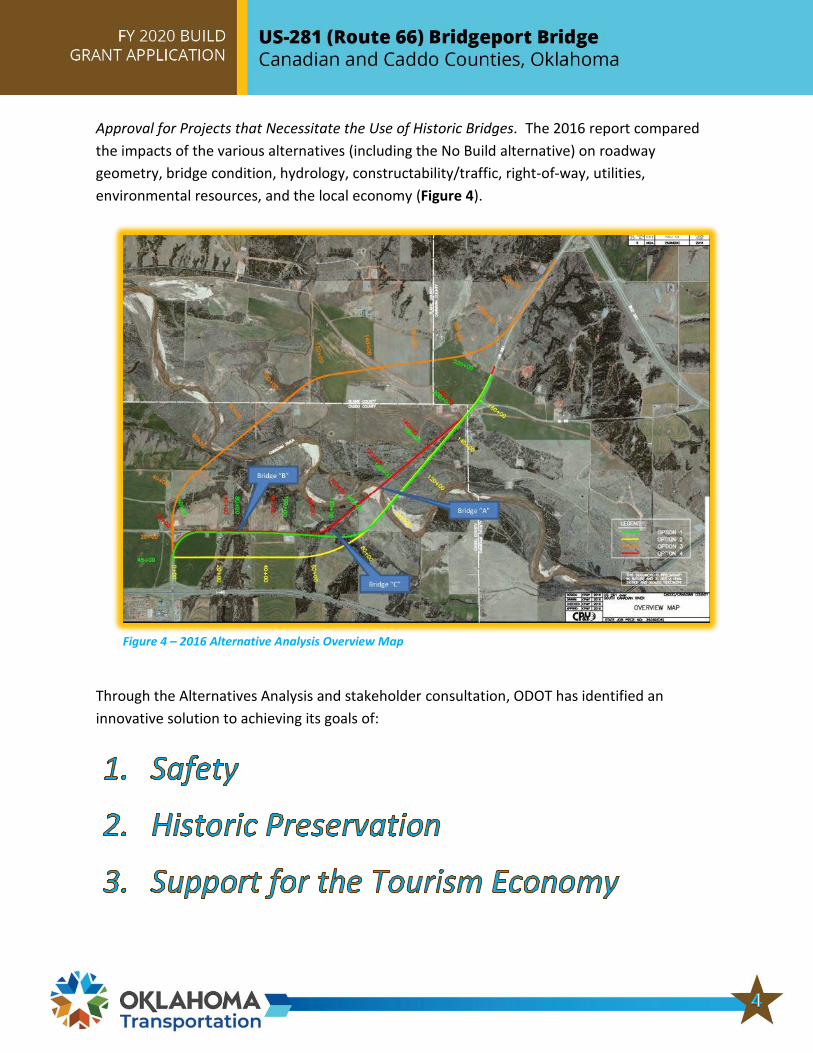
Approval for Projects that Necessitate the Use of Historic Bridges. The 2016 report compared
the impacts of the various alternatives (including the No Build alternative) on roadway
geometry, bridge condition, hydrology, constructability/traffic, right-of-way, utilities,
environmental resources, and the local economy (Figure 4).
Through the Alternatives Analysis and stakeholder consultation, ODOT has identified an
innovative solution to achieving its goals of:
Figure 4 – 2016 Alternative Analysis Overview Map

1.2 Transportation Challenges
The Bridgeport Bridge is widely considered Oklahoma’s most significant historic bridge. It is
significant for its scale and length, as the second longest bridge in Oklahoma and the longest
Route 66 bridge west of the Mississippi River. It is also significant for its repeating camelback
truss configuration. Finally, the bridge is significant as a contributing element to the NRHP-
listed segment of Route 66 from Bridgeport Hill-Hydro, which is also part of the Route 66
National Scenic Byway. As such, any alternative to improve the bridge must consider not only
preserving the historic integrity of the bridge itself, but of the overall Route 66 roadway.
The condition of the bridge demands that any rehabilitation alternative would require repair or
replacement of so many of the truss elements that it would be difficult to maintain the integrity
of the original materials and workmanship. Preserving the bridge as a monument was also not
feasible, given that a new bridge in reasonably close proximity would negatively affect the
setting, feeling, and association of the historic structure. In addition, closing the bridge to
traffic would have negative impacts on the visitor experience of Route 66, and could have a
negative economic impact on the region as tourist traffic would be diverted elsewhere.
Despite its narrow width and recent
load postings, high volumes of truck
traffic (including loads much heavier
than currently allowed) continue to
use the bridge, preferring the shorter
route rather than detour the 11.5
miles on US-281 BUS (Figure 5). ODOT
considered an alternative that would
close the bridge to trucks and only
allow passenger vehicles; however,
enforcing such a closure would be
difficult, and a restriction of this kind
would also preclude use of the bridge
by recreational vehicle (RV) users
wanting to drive Route 66.
Due to the age of the bridge (over 35 years past its design life) and to the continual use by
heavy trucks, the condition of the bridge has deteriorated rapidly over the past 10 years, and
an accelerated schedule for replacement is now critically necessary. The proposed project will
address the transportation challenges by replacing the superstructure with a new multi-beam
steel structure and a concrete deck. The substructure will also be replaced, and the original
Figure 5 – Heavy Truck Traffic on the Bridge

pony trusses will be reattached to the outside of the steel beams. In this manner, the trusses
are no longer bearing the full structural load but would still appear in the same configuration as
the original structure for drivers and for observers (see Figure 6). The restored bridge will be
able to support the current and future anticipated heavy truck traffic while maintaining its
historic significance.
The existing bridge railings will be replaced with modern crash-tested railings with a design
consistent with the historic context of the bridge, in accordance with the Secretary of the
Interior’s Standards for Rehabilitation as outlined by AASHTO NCHRP Project 25-25, Task 19
(March 2007). ODOT has had previous success using modern railings that are historically
consistent with Route 66-era originals.
Existing Bridge Proposed Bridge
Figure 6 – Existing and Proposed Bridge Cross Sections
Existing Trusses
Existing Trusses
Replaced on New Bridge
Structures
24’ wide 28’ wide

2.0 PROJECT LOCATION
The US-281 Bridgeport Bridge is located in the far northeast corner of Caddo County, Oklahoma
and spans approximately 3,945 feet across the South Canadian River and the associated flood
plain ( Latitude 35°32’30.0” N / Longitude 98°19’14.5” W ). The project is not within a U.S.
Census-designated urbanized area, and is considered to be in a rural location (Figure 7 and
“Project Location Map” at US-281 Bridgeport BUILD). US-281 and the Bridgeport Bridge
connect US-281 to Route 66 and I-40. While the bridge is load posted and not appropriate for
large trucks, many freight shipping companies and other trucks still choose to use US-281 rather
than US-281 BUS, since that route adds 11.5 miles to a trip to/from the north or west.
However, if the Bridgeport Bridge is forced to close, all traffic would be required to use this
detour.
The Bridgeport Bridge is adjacent to other transportation infrastructure including the Austin,
Todd and Ladd (AT&L) Railroad approximately 1.5 miles to the north, and Hinton Municipal
Airport 2 miles to the southeast.
Figure 7 – Project Location Map
ROUTE 66

3.0 GRANT FUNDS, SOURCES AND USES OF PROJECT FUNDS
ODOT is the project sponsor and is requesting $22 million in BUILD funds to
contribute to the construction of the project. The total future eligible costs are
$34,895,000 and ODOT proposes to contribute 37% matching funds toward
the project.
3.1 Funding Sources
ODOT has committed to provide matching State funds, totaling approximately $12.9 million. A
summary of the funding sources is listed in Table 1 below:
TABLE 1 - PROJECT FUNDING SOURCES
3.2 Project Budget
A detailed summary of project fund uses by individual project element is in
Table 2 below. A detailed cost estimate can be found at US-281 Bridgeport
BUILD. In summary, ODOT is proposing to fund approximately $12.9 million of
the total future eligible project costs of $34.9 million through obligated State
sources and is requesting $22 million in BUILD funds from USDOT. The contribution from
ODOT’s State match represents 37% of the total project cost, which it intends to use for
construction of the project. Pre-construction costs are currently receiving other federal
assistance and are not included in the funds eligible for BUILD assistance.
ODOT has invested $688,009 (including a
portion of its Federal Aid allocation) in
prior work on this project, which has
been part of ODOT’s 8-year Construction
Work Plan since 2008. Prior expenses
have included reconnaissance data
FUTURE
ELIGIBLE COSTS
TOTAL PROJECT
COSTS
Pre-Incurred Future Pre-Incurred Future Pre-Incurred Future
Pre-Construction $137,602 $164,512 $0 $0 $550,407 $658,050 $0 $1,510,571
* Construction $0 $12,895,000 $0 $22,000,000 $0 $0 $34,895,000 $34,895,000
TOTAL ELIGIBLE
COSTS $0 $12,895,000 $0 $22,000,000 $0 $0 $34,895,000 $36,405,571
% OF FUTURE
ELIGIBLE COSTS 37% 63% 100%* Construction Estimate includes 15% Contingency
SOURCES of FUNDS
NON-FEDERAL (ODOT) OTHER FEDERALBUILD
ODOT Share: $12.9 million (37%) BUILD Share: $22.0 million (63%)
TOTAL Eligible Costs: $34.9 million

collection, preliminary engineering and alternatives analysis, stakeholder meetings,
environmental analysis, and final design. Funds for the remainder of the pre-construction costs
are under contract to ODOT’s consultant.
TABLE 2 - USES OF FUNDS AND PROJECT BUDGET
PROJECT
CATEGORY
PROJECT
ELEMENTAMOUNT
FUNDING
SOURCE
% OF
TOTAL
SPLIT IN
DOLLARS
ODOT 32,127$
OTHER FED 128,510$
ODOT 269,987$
OTHER FED 1,079,947$
Sub Total Total Pre-Const. $1,510,571 100% ODOTN/A NOT
ELIGIBLE1,510,571$
ODOT 11.5% 4,028,000$
BUILD 19.7% 6,874,000$
ODOT 19.3% 6,720,000$
BUILD 32.8% 11,446,000$
ODOT 1.2% 405,000$
BUILD 2.0% 697,000$
ODOT 2.7% 949,000$
BUILD 4.6% 1,621,000$
ODOT 0.8% 275,000$
BUILD 1.4% 475,000$
ODOT 1.5% 518,000$
BUILD 2.5% 887,000$
ODOT 37.0% $ 12,895,000
BUILD 63.0% $ 22,000,000
* All Construction Elements Include a 15% Contingency
Pre-Construction
(Pre-Incurred)
DETAILED USE of FUNDS
Bridge Painting
$0 -$ R/W & Utility
Relocation
Environmental
Design
Substructure
ReplacementSuperstructure
Rehabilitation$18,166,000
$160,637
$1,349,934
$10,902,000
$1,102,000
$2,570,000
TOTAL ELIGIBLE
COSTS
Total
Construction$34,895,000
Mobilization
Construction *
$1,405,000
Roadway &
Traffic Control$750,000
Removal and
Resetting Trusses
4.0 SELECTION CRITERIA
4.1 Primary Selection Criteria
4.1.1 Safety
Safety is of primary concern in the planning, design and construction of all
ODOT projects. ODOT’s mission statement reads, in part,” …to provide a safe,
economical and effective transportation network for the people, commerce
and communities of Oklahoma." Of special focus at ODOT over the past 15 years has been the
replacement or rehabilitation of structurally deficient (SD) bridges throughout the State. Since
2005, when the SD bridge focus began, the number of highway system SD bridges in Oklahoma
has been reduced from 1,168 down to 132 at the end of 2018
(https://www.ok.gov/odot/Highway_System_Conditions.html).
The Bridgeport Bridge is one of ODOT’s
remaining SD bridges and is quickly
deteriorating to the point of closure in
coming months. The proposed
reconstruction of the bridge with modern
steel beams and precast deck panels using
ultra high-performance concrete (UHPC) will improve the bridge to current load bearing
standards which will be able to safely carry high truck volumes. Providing a safe crossing of the
Canadian River will enhance mobility for the region and increase the efficiency of freight traffic.
This project is consistent with the USDOT’s Rural Opportunities to Use Transportation for
Economic Success (ROUTES) initiative to improve deteriorating infrastructure conditions,
promote regional connectivity, and facilitate economic growth and competitiveness in rural
areas.
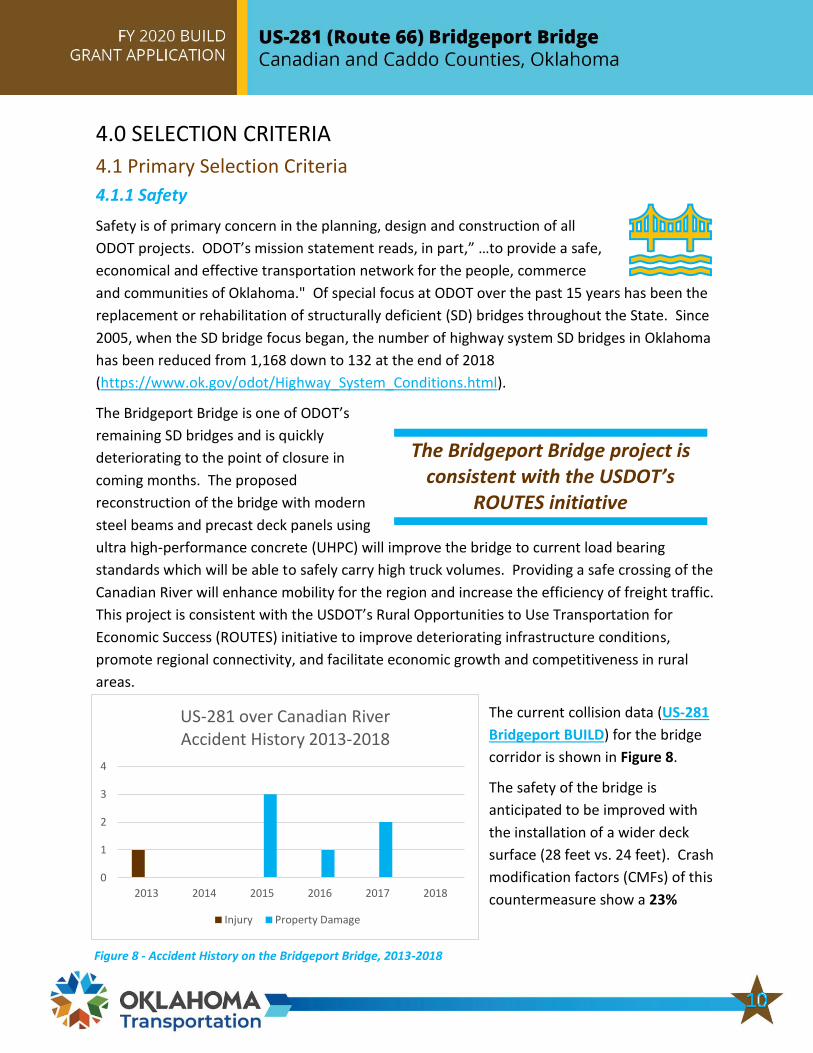
The current collision data (US-281
Bridgeport BUILD) for the bridge
corridor is shown in Figure 8.
The safety of the bridge is
anticipated to be improved with
the installation of a wider deck
surface (28 feet vs. 24 feet). Crash
modification factors (CMFs) of this
countermeasure show a 23%
The Bridgeport Bridge project is consistent with the USDOT’s
ROUTES initiative
0
1
2
3
4
2013 2014 2015 2016 2017 2018
US-281 over Canadian RiverAccident History 2013-2018
Injury Property Damage
Figure 8 - Accident History on the Bridgeport Bridge, 2013-2018

reduction in crashes with the lane
width increases
(www.cmfclearinghouse.org). The
monetary value of safety benefits is
calculated in the benefit-cost analysis
(BCA) as $61.8 million or $17.7 million
discounted at 7%.
4.1.2 State of Good Repair The existing Bridgeport Bridge is 85 years old and had an original anticipated design
life of 50 years. The bridge has a sufficiency rating of 5 out of 100 and is
classified as structurally deficient (SD). This rating has dropped from 21 in
2018. A bridge is classified SD if the deck, superstructure or substructure is rated in
"poor" condition (0 to 4 on the NBI rating scale). Sufficiency ratings are determined during the
biennial bridge inspection and are intended to indicate a measure of the ability of a bridge to
remain in service. As discussed above, ODOT has focused on correcting SD bridges and this has
been reflected in the Department’s 8-Year Construction Work Plan. This plan is ODOT’s means
of maintaining its transportation facilities in a state of good repair and addressing current and
projected vulnerabilities. The Bridgeport Bridge project is currently in the 8-Year Work Plan for
construction in 2022.
Because of the critical condition of the bridge and the need for careful monitoring, annual
maintenance cost is averaging $93,000 and it has been determined that the without
improvement, the bridge will need to be removed from service within 7 months. A closure
would threaten future transportation network efficiency, mobility of goods and people, and
economic growth. Should the bridge be closed to traffic, mobility in the area would be
adversely affected by the 11.5-mile detour (see Figure 9). Similarly, the Bridgeport Bridge is also
used as a detour if there is an incident or congestion on I-40. Given the potential for higher
severity accidents on the interstate, a serious incident can close the facility for several hours.
Should the Bridgeport Bridge be closed, freight, emergency response vehicles, and the traveling
public on I-40 would have no option but to wait for traffic to clear.
Estimated Safety Benefit of the Project (Discounted 7%):
$17.7 Million

The improvements as a result of the bridge reconstruction will provide a safe and stable
structure with an extended design life of 75 years. ODOT would continue to use State funds for
maintenance which is estimated to be approximately $4.7 million over the next 20 years (see
bridge maintenance costs at US-281 Bridgeport BUILD). Compared to the costs of maintaining
the current bridge, even after closure, the new bridge is estimated to result in a savings of $1.0
million in agency cost (discounted at 7%). This project will ensure good condition of this
important rural connection. Table 3 below summarizes the reconstruction option over the
project lifecycle.
Estimated Maintenance Savings of the Project (Discounted 7%):
$1.1 Million
Figure 9 – Bridgeport Bridge – Detour Route

TABLE 3 - SUMMARY OF COSTS IN MILLIONS OF 2018 DOLLARS
Over the Project Lifecycle
In Constant Dollars Discounted at 7 Percent
Discounted at 3 Percent
Construction & Development Costs $35.0 $27.9 $31.7
Operations and Maintenance $13.3 $2.2 $5.8
Total $48.3 $30.1 $37.5
4.1.3 Economic Competitiveness This section demonstrates the Project’s benefits in terms of:
These benefits flow from the Project’s improved travel times and travel time reliability. Travel
time reliability increases the efficiency of movement of goods and people and is an important
element in business travel and freight movement, especially with demand for efficient “just in
time” freight delivery, and truck driver “hours of service” rules. The Bridgeport Bridge currently
carries over 1,800 vehicles per day, including 360 truck trips per day and is an important link for
the local and regional movement of both goods and people. This link is in imminent danger of
closing due to the poor condition of the bridge. If this bridge is closed, traffic would be forced
to use an 11.5-mile detour route, increasing travel times by approximately 13 minutes, as well
as costs. Travel time savings would result from avoidance of detours, which would be longer
than the existing route. Vehicle
operating costs were calculated for the
additional miles traveled under a
detour.
The Project would result in improved
travel times and vehicle operating cost
savings. Results suggest a benefit of
$30.0 million in travel time savings
and $29.3 million in vehicle operating
Estimated Travel Time Savings (Discounted 7%):
$30.0 Million

costs (discounted at 7%) over the life
of the Project, improving long-term
efficiency, reliability, and costs of the
movement of workers and goods.
The economic outcomes generated
by the project improve the
connectivity between home and
workplaces and between production
and consumption sites. At the same time, these outcomes increase the competitiveness of the
United States by increasing efficiency in the movement of goods. In addition to the monetized
travel time savings, the higher speeds and increased reliability along the corridor provided by
the project imply that trucks spend less time on the road and can reach their destinations
faster. The delivery times will lead to inventory cost savings, which are important to improve
connectivity between production and consumption sites and to increase the fluidity of the
movement of goods.
Economic impact of the proposed project was also assessed in terms of the jobs
and other measures of economic activity generated by construction and related
project expenditures. The construction of the Bridgeport Bridge project would
trigger incremental expenditures on construction, equipment, supplies,
maintenance, etc. Economic impacts are typically presented as estimates of
incremental employment, business output, employment income, and value added attributable
to the project. The analysis considers direct, indirect, and induced impacts.
Direct impacts are the immediate effects of project expenditures such as employment of
construction workers and business revenues of the construction company. Indirect impacts are
employment of workers and business revenues of firms supplying input materials and services
to the construction company and throughout the supply chain. Induced impacts capture the
effects of re-spending of workers’ income on consumption goods and services. More detail on
the methods for calculating these impacts are presented in the BCA Tech Memo at US-281
Bridgeport BUILD.
Table 4 illustrates the anticipated job creation as a result of the project. For the local economy
(Caddo and Canadian Counties), construction activities related to the project are expected to
generate a total of 47 jobs, $12.7 million in business output, $2.4 million in employment
income, and $6.7 million in value added. Over 90 percent of the impacts are due to the general
construction expenditures.
Estimated Vehicle Operating Cost Savings (Discounted 7%):
$29.3 Million
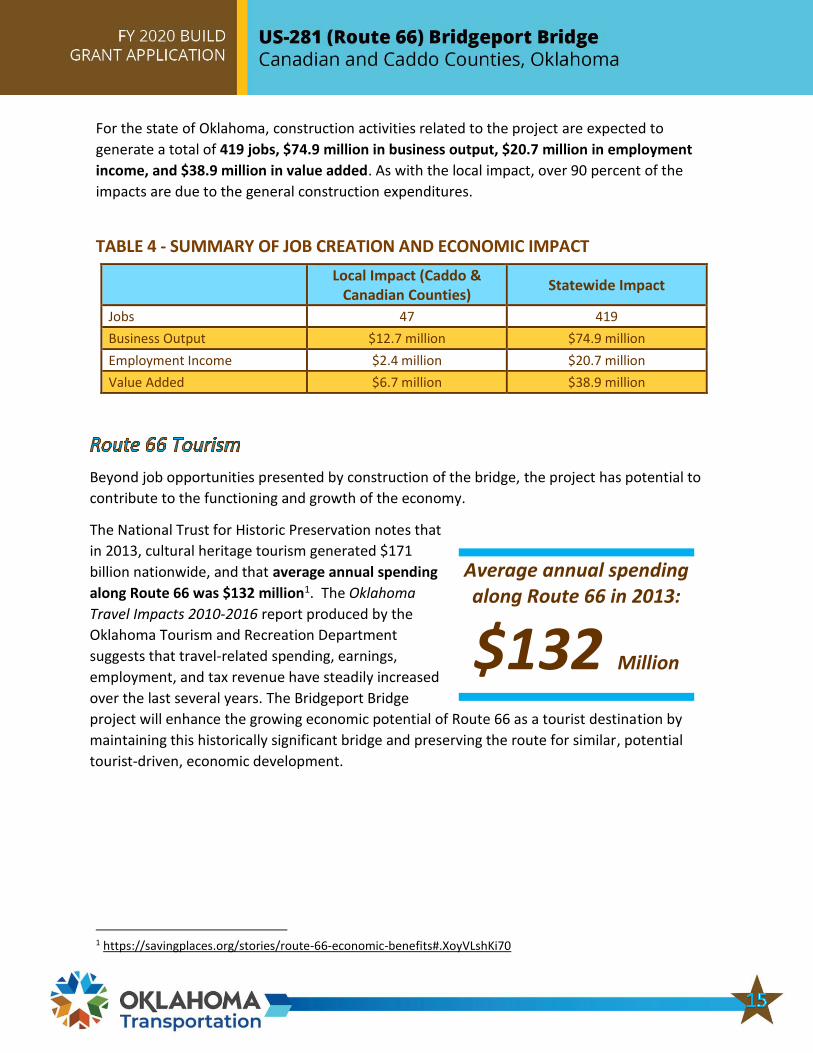
For the state of Oklahoma, construction activities related to the project are expected to
generate a total of 419 jobs, $74.9 million in business output, $20.7 million in employment
income, and $38.9 million in value added. As with the local impact, over 90 percent of the
impacts are due to the general construction expenditures.
TABLE 4 - SUMMARY OF JOB CREATION AND ECONOMIC IMPACT
Local Impact (Caddo & Canadian Counties)
Statewide Impact
Jobs 47 419
Business Output $12.7 million $74.9 million
Employment Income $2.4 million $20.7 million
Value Added $6.7 million $38.9 million
Beyond job opportunities presented by construction of the bridge, the project has potential to
contribute to the functioning and growth of the economy.
The National Trust for Historic Preservation notes that
in 2013, cultural heritage tourism generated $171
billion nationwide, and that average annual spending
along Route 66 was $132 million1. The Oklahoma
Travel Impacts 2010-2016 report produced by the
Oklahoma Tourism and Recreation Department
suggests that travel-related spending, earnings,
employment, and tax revenue have steadily increased
over the last several years. The Bridgeport Bridge
project will enhance the growing economic potential of Route 66 as a tourist destination by
maintaining this historically significant bridge and preserving the route for similar, potential
tourist-driven, economic development.
1 https://savingplaces.org/stories/route-66-economic-benefits#.XoyVLshKi70
Average annual spending along Route 66 in 2013:
$132 Million

4.1.4 Environmental Sustainability
The project will reduce energy consumption by shortening the trip required to
travel US-281. One benefit to the environment can be measured in the
reduction of fuel emissions that would occur as a result of maintaining the
Route 66 corridor. Currently the bridge is unsafe for larger trucks and is posted at a 9-ton load
limit. Larger trucks are currently directed to detour 11.5 miles around the bridge.
Approximately 1,800 vehicles a day travel this route, and should the bridge be closed, as it
would without this project and BUILD funding, all
vehicles would have an additional travel distance of
11.5 miles. The environmental benefits to the
reduced fuel emissions is calculated in association
with the vehicle operating cost in the BCA. This
amounted to $0.6 million in constant 2018 dollars or
$0.2 million in dollars discounted at 7 percent.
Therefore, the project would provide a modest
reduction in emissions, compared to the baseline.
The project will be constructed to avoid adverse
environmental impacts to water quality,
wetlands, and endangered species as much as
possible. The Canadian River provides designated
critical habitat for the Arkansas River Shiner,
listed by U. S. Fish and Wildlife Service (USFWS) as
a threatened species (Figure 10). Any
construction within 300 feet of the ordinary high-
water mark of the river is considered an impact to
this habitat and requires formal Section 7
consultation with the USFWS. Work in the river can
be completed outside of the shiner spawning season (approximately May 1 – Aug 30), thus
minimizing impact to the ongoing sustainability of this species and the water resources. ODOT
will coordinate the USFWS consultation through its designated liaison, which will streamline the
process while resulting in outcomes that protect the species and its habitat.
Finally, the project sustains the cultural environment of the surrounding region as the best
construction option to preserve the historic bridge and NRHP-listed historic Bridgeport Hill-
Hydro district. The project preserves the historic integrity and viewshed, maintains the driver
experience of Route 66, and provides a safe reliable structure.
Average emissions savings (Discounted 7%):
$0.2 Million
Figure 10 – Arkansas River Shiner
4.1.5 Quality of Life
The Route 66 corridor continues to grow in popularity as a nostalgic road trip
adventure and is certain to surge in popularity with the upcoming 2026
Centennial anniversary. The Bridgeport Bridge is not only an essential historic link in the Route
66 story, it is also an essential physical link, connecting nearby Route 66 tourist attractions both
east and west, from Robert’s Grill (since 1926) in El Reno, OK to the Cherokee Trading post in
Calumet, OK.
The bridge is situated between the two cities
of Weatherford and El Reno, connected by
the historic Route 66 corridor (see Figure 7).
Just west of the bridge is the Route 66
Museum down the road in Clinton, OK
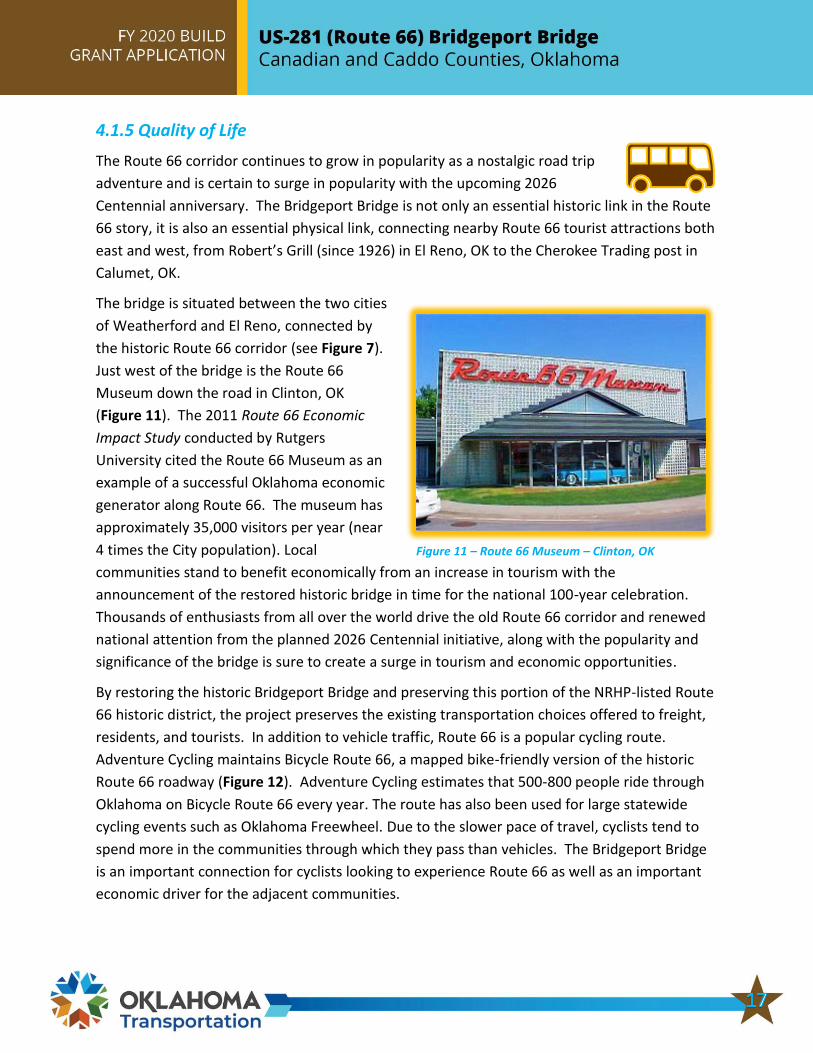
(Figure 11). The 2011 Route 66 Economic
Impact Study conducted by Rutgers
University cited the Route 66 Museum as an
example of a successful Oklahoma economic
generator along Route 66. The museum has
approximately 35,000 visitors per year (near
4 times the City population). Local
communities stand to benefit economically from an increase in tourism with the
announcement of the restored historic bridge in time for the national 100-year celebration.
Thousands of enthusiasts from all over the world drive the old Route 66 corridor and renewed
national attention from the planned 2026 Centennial initiative, along with the popularity and
significance of the bridge is sure to create a surge in tourism and economic opportunities.
By restoring the historic Bridgeport Bridge and preserving this portion of the NRHP-listed Route
66 historic district, the project preserves the existing transportation choices offered to freight,
residents, and tourists. In addition to vehicle traffic, Route 66 is a popular cycling route.
Adventure Cycling maintains Bicycle Route 66, a mapped bike-friendly version of the historic
Route 66 roadway (Figure 12). Adventure Cycling estimates that 500-800 people ride through
Oklahoma on Bicycle Route 66 every year. The route has also been used for large statewide
cycling events such as Oklahoma Freewheel. Due to the slower pace of travel, cyclists tend to
spend more in the communities through which they pass than vehicles. The Bridgeport Bridge
is an important connection for cyclists looking to experience Route 66 as well as an important
economic driver for the adjacent communities.
Figure 11 – Route 66 Museum – Clinton, OK

Without the project, travelers would no longer be able to experience this portion of Route 66
and would have to bypass the scenic and culturally historic area by using I-40. This would also
negatively impact the economic potential of the local area, as access to Route 66 tourist
destinations may become important economically for the rural community in the near future
with the renewed national promotion efforts underway. The potential for tourist-oriented
development could lead to other growth in the way of jobs, and more local and convenient
services for the community.
The project would also allow for the transport of essential services (emergency vehicles, school
bus and U.S. mail routes) through the rural community which would otherwise be rerouted to
the next available river crossing on I-40. Detouring these services would result in increased
response times and less desirable use of the interstate for school bus routes. Constructing the
project would maximize efficient access to jobs, health care, and social services for this rural
population.
4.2 Secondary Selection Criteria
4.2.1 Innovative Technology
ODOT plans to employ several innovative and cost-effective design solutions
which include pre-cast concrete components that can be constructed in large
quantities off-site and can be easily delivered and assembled in sections according
to a predetermined order and schedule.
Estimates Indicate
500-800 Cyclists Ride Route 66 in
Oklahoma Every Year
Figure 12 – Bicycle Route 66 (www.adventurecycling.org)

One planned innovation is an Accelerated Bridge
Construction (ABC) system which will allow the
construction contractor the flexibility to plan and
schedule the construction of individual
components in harmony with available company
labor forces. The precast prefabricated abutment
system is an innovation to help reduce bridge
construction time (Figure 13). The technology
consists of prefabricated precast abutment
elements cast on or off-site utilizing standard
materials. The precast elements create an
efficient system that is compatible with
conventionally constructed abutment elements
and are capable of carrying bridge loads with
predictable and reliable performance.
Using this approach, the designer places the bridge directly on the substructure unit, creating a
seamless and smooth transition between the bridge and approach roadway without cast-in-
place concrete. The smooth transition from the roadway to the bridge helps alleviate the
“bump at the end of the bridge” problem caused by differential settlement between the bridge
abutment and the approaching roadway. ABC offers the following advantages:
• : Precast abutment construction employs commonly available equipment
and materials and does not require specialized labor. Constructing a precast abutment can
potentially result in appreciable user cost savings over the duration of the project versus
abutments built with conventional methods by reducing the overall closure time.
• : Once constructed and installed, precast prefabricated
abutments are also durable and easy to maintain. These units do not increase the cost or
frequency of maintenance.
• : Precast prefabricated bridge abutments also perform well
and can be designed for a wide range of loading conditions, such as in seismic areas and rapidly
changing water elevations.
Along with the abutments, the bridge deck will be
designed and constructed using prefabricated full
depth deck panels with ultra high performance
concrete (UHPC) connections with a surface overlay
to create uniformity along the bridge. The ABC
systems are promoted by the Federal Highway
Administration (FHWA) Every Day Counts (EDC)
Figure 13 – Construction with Pre-Cast Abutment
Accelerated Bridge Construction and UPHC are
promoted by the FHWA Every Day Counts initiative

Program. The EDC program is a State-based model that identifies and rapidly deploys proven,
yet underutilized innovations to shorten the project delivery process, enhance roadway safety,
reduce traffic congestion, and improve environmental sustainability. Proven innovations
promoted through EDC facilitate greater efficiency at the State and local levels, saving time,
money and resources that can be used to deliver more projects.
4.2.2 Innovative Project Delivery
ODOT’s ABC system approach will also allow ODOT to maintain a project
delivery schedule that can quickly address the challenges and reduce the
amount of time the bridge would need to be closed to traffic. As noted above,
using the precast materials will reduce the amount of time it will take the contractor to
mobilize and construct since concrete bridge elements will not be cast in-place.
The project will also streamline other preconstruction project delivery requirements such as
environmental study, documentation, and permitting. ODOT will pursue environmental
approval as a Categorical Exclusion (CE) under the National Environmental Policy Act (NEPA). A
schedule challenge in obtaining timely approval would be USFWS consultation for the Arkansas
River Shiner and Section 404 permit coordination with the U.S. Army Corps of Engineers
(USACE). ODOT currently has liaison staff in place at both the USFWS and USACE to review
ODOT projects. At ODOT’s direction, these staff can prioritize the Bridgeport project as needed
to meet schedule milestones.
ODOT may also consider other proven strategies to reduce construction contract time such as
Cost-Plus-Time Bidding (A+B bidding) and Lane Rentals.
4.2.3 Innovative Financing
ODOT has a practice described in State statue (Oklahoma Statutes, Title 69, O.S.
2016 § 1001-1004) of recycling revenue from the sale of excess or unused
publicly owned land or assets through authorization by the State Transportation
Commission and managed through ODOT’s Facilities Management Division. By statute, the
recycled funds from the sale of land or equipment is deposited in the State Highway
Construction and Maintenance Fund. These funds remain dedicated to being used toward
design, permitting, construction or maintenance of authorized and programmed highway and
bridge projects, and cannot be reallocated by the State legislature. Should the BUILD grant be
awarded these recycled funds would be available for use as a portion of the State’s matching
funds.

4.2.4 Partnership
There have been project information and stakeholder meetings held for this
historic bridge project, most notably in June of 2015, and September of 2016,
both at the Oklahoma History Center. At these meetings, alternate design
options were discussed, and comments were
received from the following consulting parties:
FHWA, SHPO, Oklahoma Tourism & Recreation
Department, Preservation Oklahoma, Inc,
Historic Bridge Foundation, National Park
Service, Oklahoma Historic Bridge and Highway
Group, and Oklahoma Route 66 Association.
Notes from these meetings can be found at US-
281 Bridgeport BUILD. Overall, the project has
received support from the consulting parties,
who agree that keeping the bridge open to traffic and preserving historic integrity are equally
critical. All entities have expressed support for the preservation options. Twenty-four
comments have been received on ODOT’s Cultural Resources website as a result of these
stakeholder discussions, all in support of Bridgeport Bridge preservation. Additional letters of
support have been received from US Senators Inhofe and Lankford as well as US Representative
Lucas in a joint letter of support, Oklahoma Lt. Governor Matt Pinnell, the State Chamber of
Oklahoma, the Oklahoma Historical Society, the Southwest Oklahoma Regional Transportation
Planning Organization (SORTPO) and Adventure Cycling. Letters and statements of support can
be found at US-281 Bridgeport BUILD.
5.0 ENVIRONMENTAL RISK REVIEW 5.1 Project Schedule
The illustration of the major project milestones is outlined in the summary of
schedule highlights below (see Figure 14), and the detailed project schedule is
included in US-281 Bridgeport BUILD. The schedule shows the completion
dates for design, permits, required approvals, and construction, meeting all BUILD-required
milestones. Environmental (NEPA) approvals are anticipated by January 2021. Right-of-way
acquisition and utility relocations are not anticipated. All necessary activities will be completed
to allow BUILD funds to be obligated by late 2021, well in advance of the September 30, 2022
deadline, and for construction to be completed by 2023 in order to be open to traffic in
advance of the Route 66 Centennial in 2026.
Bridgeport Bridge Project
Partners

Figure 14 – Summary of Schedule Highlights
Project construction will begin no later than January 2022, and BUILD funds will be expended
according to the construction invoicing and payment schedule. With construction estimated to
be complete in July 2023, ODOT can ensure that all construction claims can be paid, and all
BUILD funds will be expended in advance of the September 30, 2027 deadline.
5.3 Required Approvals
5.3.1 Environmental Permits and Reviews
The environmental studies (detailed research including but not limited to topics such as biology,
cultural resources, hazardous materials, and wetlands) have been completed and are
undergoing agency review. A public involvement plan is also underway to present the project
to the public and obtain input. It is anticipated that formal consultation with USFWS may be
required for the impacts to the Arkansas River Shiner critical habitat as mandated in Section 7
of the Endangered Species Act of 1973. Once environmental studies, preliminary engineering,
and public involvement are complete, ODOT will submit a single National Environmental
Protection Act (NEPA) document to FHWA for approval. It is anticipated that this project will
be processed with a Categorical Exclusion (CE). ODOT has scheduled the remainder of the
study, coordination and permitting efforts and is committed to obtaining FHWA approval of
the document by January 2021 per the project schedule.
Preliminary environmental data and constraints have been identified and were factors
considered in the 2016 design Alternatives Analysis. The Alternatives Analysis in support of
Section 4(f) of the DOT Act of 1966 for the historic bridge began in 2015, and coordination with
the Oklahoma SHPO and consulting parties is well underway. The parties have provided their
2020 2021 2022 2023
JAN 2022 Construction Begins
JULY 2023 Construction Completed
MAY 2020 Grant
Application
AUG 2020 65% Design
Complete SEPT 2021 FHWA Authorization
JAN 2021 NEPA
Approval
JUN 2021 Final PS&E Plans
Complete

feedback, comments and
concerns. While the
alternative design described
in this BUILD grant
application was not
specifically considered during
that analysis, discussion of
the goals of the project was
conducted within ODOT, and
a consensus was reached
regarding the final bridge
design and reconstruction.
The project meets the goals
of ODOT and the consulting
parties of providing a safe
facility, keeping the bridge
open to all traffic, and
preserving historic integrity. Completion of the Programmatic Section 4(f) Evaluation and
Approval for FHWA Projects that Necessitate the Use of Historic Bridges should follow a
standard review timeline once the detailed cultural resources study is completed and
concurrence is received on the Section 106 consultation. The archeological survey has been
completed and the SHPO has concurred with a finding of no historic properties affected
(beyond the bridge itself).
Formal consultation with USFWS can be time consuming; however, ODOT has consulted on
several projects and has a good coordination process with a dedicated USFWS staff liaison.
Once the Section 7 formal consultation begins, USFWS typically requires a 135-day (4 ½ month)
review period to determine species effect and consult regarding mitigation requirements.
ODOT is prepared to streamline this process and design for anticipated mitigation, such as
avoiding construction activities during the threatened species spawning season, and to phase
the project so that construction work roads do not impact more than 50% of the OHWM at a
given phase. The biological studies were completed in January 2020 and ODOT has begun the
USFWS consultation process.
Environmental studies and consultation are underway:
Section 4(f) Protects the historically significant bridge
NEPA Anticipated Categorical Exclusion
USFWS Section 7
Formal consultation on Arkansas River Shiner
Public Involvement
Obtain public input on alternatives and disclose impacts
Section 404 Permit
For work in Canadian River (anticipated April 2021)

The coordination regarding the historic bridge and associated NRHP-listed district has been
ongoing since 2015, including two official consulting party meetings. After additional Section
106 consulting party comments have been reviewed and preliminary engineering design is
complete for the selected alternative, ODOT will schedule a public meeting to obtain input from
the local residents, as well as interested parties and stakeholders. This meeting is planned for
October 2020. Questions and comments from the public will be addressed and included in the
NEPA document. Section 106 consulting party meetings will also continue to be a primary
element in obtaining stakeholder comments.
The only permitting anticipated for the project is a Section 404 Permit, to be coordinated with
the U.S. Army Corps of Engineers (USACE) in accordance with the Clean Water Act of 1972.
ODOT has identified known wetlands and is prepared to design to minimize impacts to
jurisdictional waters and anticipates a streamlined review and permit schedule. The permit
application will be submitted for approval with the final set of design plans and is anticipated to
be approved by April 2021. ODOT has a dedicated staff liaison at the USACE who reviews and
permits only ODOT projects, and who prioritizes reviews in response to ODOT’s priorities.
ODOT will direct this individual to provide review and approval in a timely manner in
accordance to the schedule.
5.3.2 State and Local Approvals
The project is currently programmed in the ODOT 8-
Year Construction Work Plan and Statewide
Transportation Improvement Program (STIP). No
additional state or local approvals are needed.
Support for the project by state and local entities is
indicated by several letters of support. The project
has the support of the ODOT Director, who has resolved to commit State funds and expedite
the project schedule in order to ensure the project is completed in time for the 2026 Route 66
Centennial celebrations. Copies of the certifications as assurances and letters of support can be
found at available at US-281 Bridgeport BUILD.
Included in the letters of support are testimonials from the Route 66 and historic preservation
community as to the importance and significance of this corridor and cultural preservation
project and appreciation of ODOT’s commitment to the preservation of historic Route 66
infrastructure.
The Project is included in ODOT’s 8-Year
Construction Work Plan and the STIP
Figure 15 – Purcell-Lexington Reconstruction
- 2018The Project is included in ODOT’s 8-Year
Construction Work Plan and the STIP

5.3.3 Federal Transportation Requirements Affecting State and Local Planning
The bridge project, including roadway approach improvements, has been programmed in
ODOT’s 8-year Construction Work Plan (CWP) 2020-2027 (scheduled for Federal Fiscal Year
(FFY) 2022 construction) and in the ODOT STIP. The project is consistent with the goals set out
in ODOT’s 2018-2027 Transportation Asset Management Plan (TAMP) with the goal of
maintaining and preserving Oklahoma’s transportation network. Additionally, the application
supports the mobility, connectivity, accessibility and economic vitality goals of the Oklahoma
Freight Transportation Plan, 2018-20222.
5.4 Assessment of Project Risks and Mitigation Strategies
There is some risk to the preconstruction schedule for this project given that
design and environmental work are not yet complete. A typical environmental
study and CE documentation process for ODOT spans approximately nine to 12
months from the start of studies to the completion of the NEPA document. This process is well
underway, and the BUILD schedule allows for an 18-month duration for this process. The risks
stem from that fact that the environmental studies for this project are not typical and would
likely require the additional time shown in the schedule. The factors that influence the risk are
the likely need for a formal Section 7 consultation with USFWS, completion of the historic
preservation (Section 4(f) and Section 106) processes, along with public involvement and the
subsequent response and documentation.
The schedule risk is mitigated by the fact that much of the preliminary work (environmental
reconnaissance, alternatives analysis, Section 4(f) and Section 106 coordination) has already
been completed or is nearing completion. Another factor mitigating this risk is that engineering
design and environmental study services are already under contract as shown in the schedule.
ODOT’s experience on similar projects is also a factor mitigating this risk.
ODOT recently completed the replacement of the historic US-77 Purcell to Lexington Bridge
over the Canadian River approximately 65 miles southeast of the Bridgeport Bridge (Figure 15).
Similar to the Bridgeport Bridge, the Purcell-Lexington Bridge was experiencing rapidly
deteriorating truss conditions and was ultimately forced to close. The Purcell-Lexington Bridge
2https://www.ok.gov/odot/Programs_and_Projects/Transportation_Programs/ODOT_Freight_Transportation_Plan.html

is a vital link between two communities
and required a detour of over 40 miles.
ODOT accelerated the design,
environmental approval, and permitting
and let the project within 18 months of
closure. Many of the same
environmental (USFWS) and historic
consultations (SHPO) were necessary, as
well as a critically time sensitive project
schedule due to deteriorating bridge
conditions. ODOT will apply lessons
learned and use the same agency
contacts and coordination methods that
successfully delivered that project to
completion on schedule.
One other project risk worth noting is
ODOT’s planned use of innovative
construction methods that have not been
completed at the size and scale of this
project. While construction of small
bridges using precast components has been
successful on many ODOT projects, the particular combination of techniques and the number of
bridge spans has not yet been attempted by ODOT. The innovative solution of re-attaching the
original steel trusses to the new bridge is also untested in Oklahoma. To mitigate these risks,
ODOT will continue consult with other DOT agency partners, FHWA and industry experts for
guidance to benefit from lessons learned and implement strategies that have been most
successful.
6.0 BENEFIT COST ANALYSIS
6.1 Summary of Findings and BCA Outcomes
The tables below summarize the BCA findings. The complete BCA Technical Memo and model
can be found at US-281 Bridgeport BUILD. Annual costs and benefits are estimated over the
life cycle of the project (years from 2019 to 2053). Construction is expected to be completed by
July 2023. Benefits accrue during the operation of the project (over the years 2023-2053),
beginning in August 2023.
Figure 15 – Historic Purcell-Lexington Bridge
The Purcell-Lexington Bridge highlights ODOT’s success with
historic bridge replacement on an accelerated timeline.
Figure 16 – Purcell-Lexington Reconstruction - 2018The Project is
included in ODOT’s 8-Year Construction Work Plan and the
STIP

Considering all monetized benefits and costs, the estimated internal rate of return of the
project is 19 percent. With a 7 percent real discount rate, the $27.9 million investment would
result in $78.4 million in total benefits, Net Present Value of $48.3 million, and a Benefit/Cost
ratio of approximately 2.73. With a 3 percent real discount rate, the Net Present Value of the
project is $114.0 million, with a Benefit/Cost ratio of 4.60 (Table 5).
TABLE 5 – SUMMARY OF BENEFIT COST ANALYSIS OUTCOMES IN MILLIONS OF 2018 DOLLARS
Project Evaluation Metric
Undiscounted Present Value at 7% Discount Rate
Present Value at 3% Discount Rate
Total Benefits $272.0 $78.4 $151.5
Total O&M Costs $13.3 $2.2 $5.8
Total Costs $35.0 $27.9 $31.7
Net Present Value $223.7 $48.3 $114.0
Benefit / Cost Ratio 7.39 2.73 4.60
Internal Rate of Return (%) 19.0%
BENEFIT COST ANALYSIS RESULTS
2.73 Benefit / Cost Ratio
4.60 Benefit / Cost Ratio
at the7 %
Discount Rate
at the 3 %
Discount Rate
Table 6 below compiles all project benefits evaluated. The table demonstrates that the
majority of project benefits (75.6 percent) is accounted for by travel time savings and vehicle
operating cost savings. The avoidance in accident costs accounts for 22.6 percent of the overall
benefits, while agency cost savings (maintenance savings) account for 1.4 percent.
Environmental cost savings account for 0.3 percent.

TABLE 6 - OVERALL BENEFITS IN MILLIONS OF 2018 DOLLARS
Benefit Categories Over Project Lifecycle
Undiscounted Present Value at 7%
Discount Rate Present Value at 3%
Discount Rate
Travel Time Savings $104.6 $30.0 $58.1
Vehicle Operating Cost Savings
$102.1 $29.3 $56.7
Reduction in Accident Costs $61.8 $17.7 $34.4
Environmental Cost Savings $0.6 $0.2 $0.4
Agency Cost Savings $3.0 $1.1 $1.9
Total Benefits $272.0 $78.4 $151.5
6.2 BCA Sensitivity Analysis
The BCA outcomes presented in previous sections rely on a large number of assumptions and
long-term projections, both of which are subject to considerable uncertainty. The primary
purpose of the sensitivity analysis is to help identify the variables and model parameters whose
variations have the greatest impact on the BCA outcomes: the “critical variables.” The
sensitivity analysis can also be used to:
• Evaluate the impact of changes in individual critical variables – how much the final results
would vary with reasonable departures from the “preferred” or most likely value for the
variable; and
• Assess the robustness of the BCA and evaluate, in particular, whether the conclusions
reached under the “preferred” set of input values are significantly altered by reasonable
departures from those values.
The sensitivity analysis was conducted with respect to changes in the value of travel time, value
of statistical life, capital cost estimate, and annual O&M. The changes in the value of statistical
life and capital cost estimate are the parameters that have the greatest impact on net present
value.
The outcomes of the quantitative analysis for the changes in value of travel time, value of
statistical life, capital cost estimate, and rate of growth in traffic estimate using a 7 percent
discount rate are summarized in the table below. Table 7 provides the percentage changes in
project net present value associated with variations in variables or parameters (listed in row),
as indicated in the column headers. The table demonstrates that this project features strong
performance even in situations when key input values change in the direction that reduces net
benefits. In all situations examined, BC ratio remains well above 2.

TABLE 7 - QUANTITATIVE ASSESSMENT OF SENSITIVITY, SUMMARY
Parameters Change in Parameter Value New NPV % Change in
NPV New B/C
Ratio
Value of Travel Time
Lower Bound of Range Recommended by US DOT ($10.63 for autos and $23.58 for trucks)
$40.0 -17.2% 2.44
Upper Bound of Range Recommended by US DOT ($18.17 for autos and $35.42 for trucks)
$54.2 12.2% 2.95
Value of Statistical Life
Lower Bound of Range Recommended by US DOT ($5.4 million)
$42.8 -11.4% 2.54
Upper Bound of Range Recommended by US DOT ($13.4 million)
$53.3 10.3% 2.91
Capital Cost Estimate
25% Reduction $54.9 13.7% 3.59
25% Increase $41.7 -13.7% 2.21
Rate of Growth in Traffic
Reduction from 1.98% to 1% Annually
$36.8 -23.8% 2.32


![Oklahoma State Immunization Information System OSIIS … User Guide - MP... · 1 Oklahoma State Immunization Information System OSIIS Web User Manual [UPDATED July 03, 2017]](https://cdn.vdocuments.site/doc/165x107/5a8528847f8b9ad30c8c345a/oklahoma-state-immunization-information-system-osiis-user-guide-mp1-oklahoma.jpg)