Cristiana Carvalho Morais
Degree in Marine Biology and Biotechnology
Production of bacterial biopolymers
from industrial fat-containing wastes
Dissertation presented in partial fulfilment of the Requirements for the Degree of Master in Biotechnology
Supervisor: Doctor Maria Filomena Andrade de Freitas, Post Doctoral
Researcher, REQUIMTE, FCT/UNL
Co-supervisor: Professor Maria da Ascensão Carvalho Miranda Reis, Full Professor, Faculdade de Ciências e Tecnologia, UNL
September 2013


Production of bacterial biopolymers from industrial fat-containing wastes, Copyright © Cristiana
Carvalho Morais, FCT/UNL, UNL
A Faculdade de Ciências e Tecnologia e a Universidade Nova de Lisboa têm o direito, perpétuo
e sem limites geográficos, de arquivar e publicar esta dissertação através de exemplares
impressos reproduzidos em papel ou de forma digital, ou por qualquer outro meio conhecido ou
que venha a ser inventado, e de a divulgar através de repositórios científicos e de admitir a sua
cópia e distribuição com objectivos educacionais ou de investigação, não comerciais desde que
seja dado crédito ao autor e editor.

v
Acknowledgments
I would like to express my gratitude to Dr. Filomena Freitas for being an outstanding
advisor, for encouraging and helping me to shape my interest and ideas and for her continuous help and support in all stages of this thesis. I want thank to Professor Maria d’Ascensão Miranda Reis for all I have learned from her and for their encouragement and for her consideration and support.
My deep gratitude goes to Madalena Cruz whose advices and suggestions were invaluable to me. She shared her knowledge about the topic and always helped me to improve my work.
I gratefully thank Dr. Alexandre Paiva and Professor Madalena Dionísio for allowing the use of their equipments and using their precious times to give their valuable advices.
In particular, I thank to FIMA SA – Unilever for providing me the carbon source material, particularly to Dr. Bruno Custódio and Engº Ricardo Fonseca for explaining me the production process and for all help needed. This project would have been unthinkable without their contribution.
I also thank to National Center for Agricultural Utilization Research, University Street, Peoria, USA, for their contribution in donating some bacterial cultures used in this work.
Furthermore, I want to thank to the colleagues from the Biochemical Engineering and Processes group laboratory for their friendship and support and whose co-operation and help this research would not have been possible.
Finally, I would like to thank my family and friends, especially my mother and father for always believing in me, for their continuous love and their supports in my decisions.


vii
Abstract
Polyhydroxyalkanoates (PHAs) constitute a group of biobased and biodegradable
polymers, which have been recognized as good substitutes for petroleum-based polymers in
many applications. The large-scale production of PHAs is limited by the high cost of the most
commonly used carbon sources (e.g. glucose, sucrose). However, the food industry generates
large amounts of wastes, including fat-containing materials that can be used as low cost carbon
sources for microbial cultivation, due their high carbon content.
In this study, several bacterial strains (Cupriavidus necator, Comamonas testosteroni,
Pseudomonas oleovorans, P. resinovorans, P. stutzeri, and P. citronellolis) were evaluated for
their ability to grow and produce PHAs using fat-containing wastes generated by the food
industry. The materials used in this study were mainly composed of free fatty acids, namely
mystiric, oleic, linoleic and stearic acid. In the preliminary shake flask experiments, C. necator,
C. testosteroni, P. oleovorans and P. citronellolis were able to grow and produce PHA polymer
on margarine waste with the highest content. Those strains were selected for batch bioreactor
experiments, wherein C. necator reached the highest polymer content (56%, wt/wt) and
volumetric productivity (0.33 gPHA/L.h), Lower PHA contents were achieved by P. citronellolis
and P. oleovorans (7.0 and 8.5%, wt/wt, respectively). However, in contrast with C. necator that
synthesized polyhydroxybutyrate [P3(HB)], those strains produced medium chain length
polyesters (mcl-PHA) containing monomers of 3-hydroxyoctanoate (HO) and 3-
hydroxydecanoate (HD). C. necator was also cultivated in two different fed-batch strategies. The
first cultivation achieved 76% (wt/wt) of P(3HB), while high cell densities were obtained in the
second cultivation (48 g/L of active biomass concentration). Finally, the P(3HB) and mcl-PHA
polymers had a glass transition temperature of 0.5–7.9ºC and -45.6, a melting point of 169.3–
173.4ºC and 60.9ºC, and degree of crystallinity of 48.7–56.6% and 0.7%, respectively.
Keywords: Fatty acids, waste, poly(3-hydroxybutyrate), medium-chainlength
polyhydroxyalkanoates (mcl-PHAs), Cupriavidus necator, Pseudomonas species


ix
Resumo
Os polihidroxialcanoatos (PHAs) são polímeros biológicos e biodegradáveis que são
reconhecidos como bons substitutos dos polímeros produzidos à base de petróleo em muitas
aplicações. Contudo, a produção em larga escala dos PHAs é limitada pelo elevado custo de
muitas fontes de carbono utilizadas (ex. glucose, sacarose). A indústria alimentar gera enormes
quantidades de resíduos, incluindo material gorduroso, que podem ser usados como fonte de
carbono de baixo custo no cultivo microbiano devido ao seu elevado conteúdo em carbono.
Neste estudo, várias estirpes bacterianas (Cupriavidus necator, Comamonas
testosteroni, Pseudomonas oleovorans, P. resinovorans, P. stutzeri, and P. citronellolis) foram
avaliadas quanto à sua capacidade de crescer e produzir PHAs, usando resíduos de gordura
gerados pela indústria alimentar. Estes resíduos eram compostos principalmente de ácidos
gordos livres, nomeadamente, ácido místirico, oleico, linoleico e esteárico. Nos ensaios
preliminares em frascos agitados, C. necator, C. testosteroni, P. oleovorans and P. citronellolis
foram capazes de crescer e acumular polímero de PHA com o maior conteúdo, usando
resíduos de margarina. Essas culturas foram cultivadas em reactor descontínuo, onde C.
necator obteve o maior conteúdo de polímero (56%, m/m) e produtividade (0.33 gPHA/L.h). Os
conteúdos de polímero de P. citronellolis and P. oleovorans foram inferiores (7.0 e 8.5%, m/m,
respectivamente). No entanto, em contraste com o poli(3-hidroxibutirato) [P(3HB)] produzido
pela C. necator, estas estirpes produziram poliésteres de cadeia média, contendo monómeros
de 3-hidroxioctanoato (HO) e 3-hidroxidecanoato (HD). Duas estratégias em reactor semi-
contínuo foram aplicadas com C. necator. O primeiro sistema semi-contínuo obteve 76% (m/m)
de conteúdo em polímero, enquanto no segundo sistema, elevada densidade celular foi obtida
(48 g/L de biomassa activa). Os polímeros de P(3HB) e mcl-PHA alcançaram uma temperatura
de transição vítrea de 0.5–7.9ºC e -45.6, um ponto de fusão de 169.3–173.4ºC e 60.9ºC, e uma
cristalinidade de 48.7–56.6% e 0.7%, respectivamente.
Palavras-chave: Ácidos gordos, poli(3-hidroxibutirato), polihidroxialcanoatos de cadeia média
(mcl-PHAs), Cupriavidus necator, Pseudomonas


xi
Contents
Abstract........................................................................................................................................vii
Resumo……………………………………………………………………………………………………ix
Contents.......................................................................................................................................xi
Index of Figures..........................................................................................................................xiii
Index of Tables............................................................................................................................xv
Nomenclature.............................................................................................................................xvii
Abbreviations..............................................................................................................................xvii
1 Motivation………………………………………………………………………………………………..1
2 Introduction……………………………………………………………………………...………….......3
2.1 – Fat wastes………………………………………………………………………………………...3
2.2 – Polyhydroxyalkanoates…………………………………………………………...……...……..6
2.3 – Applications………………………………………………………………………...……….....…9
2.4 – PHA-producing bacterial strains…………………………………………………..............…..9
2.5 – Production of PHAs in Bioreactors.............……………………………….…………….......15
2.6 – Downstream processing……………………………...……………………….…………..…..15
2.7 – Sustainability and environmental impact of PHAs………………………….............……...17
3 Materials and Methods……………………………………………………………………...………..21
3.1 – Fat wastes characterization……………………………………….…………………...……...21
3.1.1 – pH measurement ..................................................................................................... 21
3.1.2 – Density ..................................................................................................................... 21
3.1.3 – Water content .......................................................................................................... 21
3.1.4 – Solubility .................................................................................................................. 22
3.1.5 – Miscibility test .......................................................................................................... 22
3.1.6 – Total sugar content .................................................................................................. 22
3.1.7 – Inorganic content and composition ......................................................................... 22
3.1.8 – Elemental analysis .................................................................................................. 23
3.1.9 – Lipid profile analysis ................................................................................................ 23
3.1.10 – Free fatty acids content ......................................................................................... 23
3.1.11 – Fatty acids profile analysis .................................................................................... 24
3.2 – Microbial cultivation experiments……………………………………………………………..25
3.2.1 – Bacterial strains ....................................................................................................... 25
3.3.2 – Media ....................................................................................................................... 25
3.2.3 – Shake flask experiments ......................................................................................... 26
3.2.4 – Bioreactor cultivation ............................................................................................... 26
3.2.4.1 – General condition cultivation…………..…………..…………..………………….26

xii
3.2.4.2 – Batch cultivation experiments with selected bacterial strains………………….27
3.2.4.3 – Fed-Batch experiments with C. necator………………………………………….27
3.3 – Analytical techniques...………………………………………………………………….……..28
3.3.1 – Cell dry weight and substrate quantification ............................................................ 28
3.3.2 – Microscopic visualization of bacterial cells and intracellular PHA granules. ........... 29
3.3.3 – PHA Polymer Analysis ............................................................................................ 29
3.4 – Calculations……………………………………………………………………………………..30
3.5 – Polymer extraction………………………………………………………...…………………...30
3.6 – Thermal analysis……………………………………………………………..........…………..31
4 Results and Discussion……………………………………………………………………………....33
4.1 – Fat wastes characterization…………………………………………………………………...33
4.2 – Shake flask experiments…………………………………………………………………….…39
4.3 – Batch bioreactor cultivation experiments with the selected bacterial strains…………….43
4.3.1 – Batch cultivation experiment with C. necator DSM 428 .......................................... 44
4.3.2 – Batch cultivation experiment with C. testosteroni NRRL B-2611 ............................ 46
4.3.3 – Batch cultivation experiments with P. citronellolis NRRL B-2504 ........................... 48
4.3.4 – Batch cultivation experiments with P. oleovorans NRRL B-14683 ......................... 49
4.4 – Fed-Batch experiments………………………………………………………………….……..51
4.4.1 Fed-Batch bioreactor experiment with pulse feeding based on DO........................... 52
4.4.2 – Fed-Batch bioreactor experiment with periodic pulse feeding ................................ 54
4.5 – Thermal characterization of polymer……………………………………………...........……56
5 Conclusion and outlook………………………………………………………………………………59
6 References…………………………………………………………………………………………….61
7. Appendix…………………………………………………………………………………..............…67
7.1 Fat wastes characterization………………………...………………………………...........…...67
7.2 – Batch bioreactor cultivation experiments…………………………………………...............67
7.3 – Fed-batch bioreactor cultivation experiments……………………………………...............69

xiii
Index of Figures
Figure 2.1 – Flowsheet of the refinery process used by FIMA.
Figure 2.2 – Flowsheet of soapstock treatment and wastewater treatment plant at FIMA.
Figure 2.3 – General structure of polyhydroxyalkanoates (Lee, 1996a).
Figure 2.4 – Metabolic pathways involved in synthesis of PHA. PhaA, β -ketothiolase; PhaB,
NADPH-dependent acetoacetyl-CoA reductase; PhaC, PHA synthase; PhaG, 3-hydroxyacyl-
ACP-CoA transferase; PhaJ, (R)-enoyl-CoA hydratase; FabD, malonyl-CoA-ACP transacylase;
FabG, 3-ketoacyl-CoA reductase (Sudesh et al., 2000).
Figure 3.1 – Experimental setup of batch (a) and fed-batch (b) culture systems.
Figure 4.1 – Fat wastes from the manufacture process of margarine: a) margarine waste; b)
refinery waste; c) sludge.
Figure 4.2 – Mineral medium supplemented with fat wastes: a) margarine; b) refinery; c) sludge
after being kept in a rotary shaker at 200 rpm and 30ºC for 72 h.
Figure 4.3 – Lipid profile (%) of fat wastes: triglycerides (blue), diglycerides (red),
monoglycerides (green) and FFA (purple).
Figure 4.4 – The main components (%) in fat wastes: FFAs (blue) triglycerides (red),
diglycerides (green) and monoglycerides (purple), total sugar (light blue).
Figure 4.5 – Batch cultivation profile by C. necator DSM 428 using margarine waste as carbon
source.
Figure 4.6 – Optical microscopic photographs (100x) of bacterial C. necator DSM 428 cells
stained with Nile Blue at the beginning (a) and at the end (b) of the batch bioreactor experiment.
Figure 4.7 – Batch cultivation profile by C. testosteroni NRRL B-2611 using margarine waste as
carbon source.
Figure 4.8 – Optical microscopic photographs (100x) of bacterial C. testosteroni NRRL B-2611
cells stained with Nile Blue at the beginning (a) and at the end (b) of the batch bioreactor
experiment.
Figure 4.9 – Batch cultivation profile by P. citronellolis NRRL B-2504 using margarine waste as
carbon source.
Figure 4.10 – Optical microscopic photographs (100x) of bacterial P. citronellolis NRRL B-2504
cells stained with Nile Blue at the beginning (a) and at the end (b) of the batch bioreactor
experiment.
Figure 4.11 – Batch cultivation profile by P. oleovorans NRRL B-14683 using margarine waste
as carbon source.
Figure 4.12 – Optical microscopic photographs (100x) of bacterial P. oleovorans NRRL B-14683
cells stained with Nile Blue at the beginning (a) and at the end (b) of the batch bioreactor
experiment.
Figure 4.13 – Fed-batch bioreactor profile for cultivation of C. necator using margarine waste as
carbon source. Concentration of active biomass (X), polymer (PHA) and substrate are shown.

xiv
The substrate pulse occurred at 12, 16 and 20 h and the pH control was change by NaOH at 21
h.
Figure 4.14 – Fed-batch bioreactor profile for cultivation of C. necator using margarine waste as
carbon source. Concentration of active biomass (X), polymer (PHA) and substrate are shown.
The substrate pulses was manual added every 2 h, after 19 h. The pH was control by NH4OH
throughout the entire experiment.
Figure 7.1 – Maximum specific growth rate determination for C. necator DSM 428 in batch
cultivation using margarine waste as carbon source.
Figure 7.2 – Maximum specific growth rate determination for C. testosteroni NRRL B-2611 in
batch cultivation using margarine waste as carbon source.
Figure 7.3 – Maximum specific growth rate determination for P. citronellolis NRRL B-2504 in
batch cultivation using margarine waste as carbon source.
Figure 7.4 – Maximum specific growth rate determination for P. oleovorans NRRL B-14683 in
batch cultivation using margarine waste as carbon source.
Figure 7.5 – Maximum specific growth rate determination for C. necator DSM 428 in first fed-
batch cultivation using margarine waste as carbon source.
Figure 7.6 – Maximum specific growth rate determination for C. necator DSM 428 in second fed-
batch cultivation using margarine waste as carbon source.

xv
Index of Tables
Table 2.1 – Fatty acid composition (wt%) of several vegetable oils (Adapted from Zambiazi et
al., 2007).
Table 2.2 – Comparison of the physical properties of scl-PHAs and mcl-PHAs with
polypropylene (Adapted from Koller et al., 2010).
Table 2.3 – Production of PHA by various bacteria from different vegetable oils and fats, n.a.:
data not available.
Table 2.4 – Some of polyhydroxyalkanoates isolation methods, n.a.: data not available.
Table 2.5 – The current and potential large volume manufacturers of polyhydroxyalkanoates,
n.a.: data not available (Adapted from Kosior et al., 2006).
Table 4.1 – Physical properties of fat wastes. The values of pH, density and water content are
shown ± SD (n=2).
Table 4.2 – Chemical properties of fat wastes: elemental analysis (Carbon – C; Nitrogen – N;
Hydrogen – H; Sulphur – S) and total sugar. The values of elemental composition and sugar
content are shown ± SD (n=2).
Table 4.3 – Trace elements presented in fat wastes: aluminium (Al), calcium (Ca), iron (Fe),
sodium (Na), phosphorus (P) and potassium (K), determined by ICP.
Table 4.4 – The fatty acids distribution in fat wastes for lots 1 and 2.
Table 4.5 – Cell dry weight, PHA content and PHA composition for the shake flask experiments
with different bacteria grown on different fat-rich materials (margarine, saponified margarine,
refinery wastes, sludge, and virgin oil).
Table 4.6 – Kinetic parameters for cultivation of C. necator DSM 428, C. testosteroni NRRL B-
2611, P. citronellolis NRRL B-2504 and P. oleovorans NRRL B-14683 in batch bioreactor
experiments using margarine waste as carbon source.
Table 4.7 – Comparison of kinetic parameters for cultivation of C. necator DSM 428 in fed-batch
bioreactor experiments using margarine waste as carbon source and using soybean oil, n.a.:
data not available.
Table 4.8 – Thermal properties for the polymers produced by the different bacteria determined
by DSC analysis, n.a.: data not available. (HHp, 3-Hydroxyhepenoate; HN, 3-
Hydroxynonenoate).
Table 7.1 – Calibration solutions using in lipid profile analysis. Each component concentration is
expressed in μg/mL.


xvii
Nomenclature
[PHA] – Polymer concentration (g/L)
[Residual margarine waste] – Margarine waste concentration (g/L)
CDW – Cell dry weight (g/L)
OD600nm – Optical density at 600 nm
ppm - Part per million
qPHA – Specific productivity (gPHA/gX.h)
rPHA – Volumetric productivity (gPHA/L.h)
rs – Global substrate uptake rate (gs/L.h)
rpm – Rotation per minute
Tg – Glass transition temperature (ºC)
Tm – Melting temperature (ºC)
vvm – Gas volume per liquid volume per time (minutes)
X - Active biomass concentration (g/L)
YPHA/s – Storage yield (gPHA/gs)
Yx/s – Growth yield (gx/gs)
μmax – Maximum specific growth rate (h-1)
∆H – Melting enthalpy (J/g)
∆Hf – Melting enthalpy of 100% crystalline P(3HB) (J/g)
𝟀c – Crystallinity (%)
Abbreviations
AP – Peak areas ranging from C14:0 to C18:3
API – Peak area of methylheptadecanoate
BOD – Biochemical Oxygen Demand (ppm)
COD – Chemical Oxygen Demand (ppm)
Ctitr – Concentration of titrant (g/L)
DO – Dissolved oxygen (%)
FDA – U.S. Food and Drug Administration
FFAs – Free fatty acids
FW – Fat wastes
FW m – Mass of fat wastes after lyophilization (g)
FWm(H2O) – Mass of fat wastes (g)
HV – 3-Hydroxybutyrate
HD – 3-hydroxydecanoate

xviii
HO – 3-hydroxyoctanoate
HHD – 3-Hydroxydodecanoate
HHp – 3-hydroxyheptanoate
HHx – 3-hydroxyhexanoate
HTD – 3-hydroxytetradecanoate
HV – Hydroxyvalerate
GC – Gas chromatography
LB medium – Luria-Bertani medium
M – Molar weight of oleic acid
m1 – Mass of tube with dried biomass (g)
m2 – Mass of the empty tube (g)
mcl-PHAs – Medium-chain-length PHAs
mPHA – Mass of PHA (g)
mcells – Mass of liophylized biomass (g)
mfilm – Mass of the polymer film obtained after extraction (g)
mPHAmax – Maximum amount of PHA produced (g)
mms1 – Mass of tube with dried margarine waste (g)
mms2 – Mass of the empty tube (g)
ms – Mass of residual margarine waste (g)
msi – Mass of the initial margarine waste (g)
msf – Mass of the final margarine waste (g)
mX – Mass of liophylized biomass (g)
mXmax – Maximum amount active biomass (g)
n.a. – Data not available
P(3HB) – Poly(3-hydroxybutyrate)
P(3H-co-HV) or PHBV – Poly (3-hydroxybutyrate-co-3-hydroxybutyrate)
P(3H-co-4HB) – Poly(3-hydroxybutyrate-co-4-hydroxybutyrate)
PHA – Polyhydroxyalkanoate
PHBH – Poly(3-hydroxybutyrate-co-3-hydroxyhexanoate)
Pm – Mass of dried pellet (g)
scl-PHAs – Short-chain-length PHAs
SFWBm – Mass of syringe with fat wastes (g)
SEm – Mass of the empty syringe (g)
Sm – Mass of dried supernatant (g)
Vtitr – Total volume of titrant (mL)
V – Volume
wt – Weight
Wsmp – Fat waste weigh (g)

Motivation
1
1 Motivation
Plastic materials are present in everyday life in many forms, like utensils, packaging,
furniture, machinery housings and accessories, so they are used in almost all industries
(Khanna & Srivastava, 2005). Over the past few years, the use of plastics has grown
extensively: about 200 million tons of plastic materials, predominately petroleum derived, are
consumed yearly worldwide (Gironi & Piemonte, 2011). The reduction of crude oil resources
causes an increase of conventional plastics prices. Additionally, those plastics are discarded in
the environment, where they accumulate due to their non-biodegradability. On the other hand,
their disposal by incineration contributes to greenhouse gas emission and has high costs.
Recycling processes are a valuable alternative, but not the ideal solution, due to the difficulty in
sorting the different plastic materials and the impact on the properties of the recycled materials
(Castilho et al., 2009; López-Cuellar et al., 2011).
Thereby, there is a need for sustainable raw materials to replace fossil resources (Du et
al., 2012). In this context, polyhydroxyalkanoates (PHAs) are among the top group of
biopolymers that have been intensively investigated and are already being commercialized.
They are completely biodegradable under aerobic and anaerobic conditions and possess
properties similar to various synthetic thermoplastics. Moreover, they derived from sustainable
biomaterials and are synthesized by numerous microorganisms (Castilho et al., 2009; Khanna &
Srivastava, 2005). However, PHAs are still not competitive enough to replace the conventional
plastics due to their high production costs, which are mainly related to the high price of the
carbon source. The use of wastes generated by agriculture and industrial processes for PHA
production arises as a good alternative for reduction the overall production costs of the polymer
and is advantageous for waste management.
For this purpose, the objective of this work was the production of PHA using fat-
containing wastes generated by the food industry as the carbon source. The bioprocess
developed allows the economic valorisation of that residue, which needs to be treated before
disposal, with efficient production of value-added PHAs. Firstly, the fat materials were
characterized and several bacteria were screened for their ability to produce PHA from those
wastes. An optimization of bioprocess using the selected bacterial strain was carried out using
different strategies to improve polymer yield and productivity. The resulting PHA polymers were
characterized.

2

Introduction
3
2 Introduction
2.1 – Fat wastes
Vegetable oils and fats are the most important source of fat in the human diet (Strayer
et al., 2006). Derived from an array of vegetable sources (soybean, canola, cottonseed, corn,
etc.), oils are extracted and processed for a variety of food uses like frying the oil. They are
mainly composed of triglycerides (95%), which result from the combination of one unit of
glycerol and three units of fatty acids, and small amounts of mono and diglycerides (Reda &
Carneiro, 2007). Depending on the amount of saturated or unsaturated fatty acids, they may be
solid, semi-solid or clear liquid materials at ambient temperature. Oils contain one to four double
bounds in the carbon chain and because of the presence of unsaturated fatty acids they are in
liquid form at ambient temperature. Due to high content of saturated fatty acids, fats have high
melting points and are usually solids at room temperature. Oils and fats are insoluble in water
but soluble in most organic solvents (e.g. hexane, acetone or ethanol) and they have densities
lower than water. Besides, mono-, di- and triglycerides, oils and fats contain minor components,
such as phosphatides, cerebrosides, sterols, terpenes, fatty alcohols, free fatty acids and
vitamins (Strayer et al., 2006).
FIMA SA – Unilever, Portugal, uses a Oils and Fats Refining Process for the production
of margarine, creams, emulsified chocolate and culinary broths. Their global annual production
is about 47,000 ton (37,297 ton of margarine, creams and emulsified chocolate, and 9,433 ton
of culinary broths).
For margarine production, the raw materials required are crude, refined or semi-refined
oils that are treated in the refinery after coming to the manufactory. The main vegetable oils
used in the process are sunflower, corn, soybean, coconut and palm oils, palm kernel, coconut
oil and palm oil derivatives (stearin and olein oil). The main fatty acid composition of those
vegetable oils is given in Table 2.1.

Introduction
4
Table 2.1 – Fatty acid composition (wt%) of several vegetable oils (Adapted from Zambiazi et al., 2007).
Fatty acid Carbon number
Sunflower Corn Soybean Palm Coconut Palm
Kernel
Caprilic 8:0 - - - - 6.38 3.43 Capric 10:0 - - - - 5.56 3.23 Lauric 12:0 - - - - 45.46 46.14
Myristic 14:0 0.06 - 0.06 1.12 18.82 16.17 Palmitic 16:0 5.70 10.34 9.90 42.70 10.08 8.65
Palmitoleic 16:1 - - 0.08 - - - Stearic 18:0 4.79 2.04 3.94 4.55 4.31 2.27 Oleic 18:1 15.26 25.54 21.35 39.37 7.45 16.46
Linoleic 18:2 71.17 59.27 56.02 10.62 1.80 2.76 Linolenic 18:3 0.45 1.07 7.15 0.21 - - Arachidic 20:0 0.30 0.44 0.41 0.39 0.08 0.15 Gadoleic 20:1 0.22 0.37 0.22 0.17 0.06 0.17
Eicosadienoic 20:2 0.09 0.09 - - - - Behenic 22:0 1.16 0.31 0.48 0.58 - -
Lignoceric 24:0 0.31 0.26 0.21 0.06 - 0.30
Following a quality control, crude oils are subjected to a series of sequential steps from
refinery process (Figure 2.1):
1) neutralization with sodium hydroxide (caustic refining) to remove free fatty acids,
phosphatides and other materials (e.g. protein meal, glycerol, carbohydrates, resins and
metals);
2) bleaching to reduce colour pigments, as well as removal of oxidation products and
residual neutralizing soap. This process employs bleaching earth as an adsorbent;
3) deodorization (vacuum steam distillation process) for removal of trace volatile
components (e.g. aldehydes and ketones) that give rise to undesirable flavours, colours and
odours (Karasulu et al., 2011).
4) margarine production, where the fat phase is prepared by adding vitamins, natural
colourings, flavouring in the pre-treated oil to improve the quality and enhance flavour. Also
emulsifiers are added to stabilize the emulsion.
When required, the pre-treated oils may follow parallel paths:
5) hydrogenation is used to provide the desired stability and functionality to edible oil
products. The process consists of addition of molecular hydrogen to unsaturation points in the
fatty acids, eliminating double bonds and making them into partially or completely saturated fats.
There is generally a gradual increase in the melting point of the fat or oil, thus increasing their
oxidative and thermal stability (Strayer et al., 2006);
6) interesterification, which causes a redistribution of the fatty acids across the glycerol
backbone of the triglyceride. This process is carried out by adding a catalyst (sodium methylate)
that is neutralized and reused. The rearranged product is washed, bleached, and deodorized to
give rise to final oil product with different characteristics than the original oil blends.

Introduction
5
Neutralization and interesterification processes are done at temperatures within the range 85-
105⁰C.
Figure 2.1 – Flowsheet of the refinery process used by FIMA.
FIMA has a specific installation called Cleaning in Place (CIP) to perform the cleaning of
production lines, which contains all the oils not used. Figure 2.2 shows the flowsheet of
soapstock treatment and the wastewater treatment plant. Soapstock and other impurities
produced during the neutralization and interesterification processes are removed from the oil
stream by fatty acids regeneration. Sulphuric acid (96%) is added to the soapstock and
impurities solution, at 90⁰C with stirring, to neutralize the reaction mixture that is separated by
settling (1 and 2). The wastewaters generated by soap splitting and CIP and margarine
production are treated at a wastewater treatment plant. The first treatment (4 and 5) is
performed by a gravity separator and consists of removing free fatty acids from the wastewater
and collecting them in separated tanks. Fats from CIP and margarine production (margarine
waste) and soap spliting (refinery waste) are stored in tanks and sold to oil-recycling companies
(3). In some cases, the wastewater from margarine and refinery waste can be mixed when they
overflow (6). The sewage water passes through the homogenizer tank to collect the wastewater
(7) and, then, the large size pollutants are removed by the addition of a flocculating agent in
dissolved air flotation process (DAF) (8). The effluents from other process are also subject to
DAF process (9). The resultant effluent flows to a storage tank, resulting sludge. Therefore,
three types of fat material are generated at FIMA manufacture: fats from margarine and refinery
wastes and sludge. In 2012, 279 ton of fats of margarine and refinery waste were produced.
The annual production of sludge is about 1000 ton and their treatment has costs.

Introduction
6
Figure 2.2 – Flowsheet of soapstock treatment and wastewater treatment plant at FIMA.
The raw wastes and wastewaters generated from the food industry are the major source
of water and land pollution, because compounds with high lipid components are difficult to treat
(Cammarota & Freire, 2006). An increase in the biological oxygen demand (BOD) and chemical
oxygen demand (COD) occurs when improper disposal of these wastes occurs. This situation
leads to the deoxygenation of surface waters, infiltration into soil sediments and aquifer
contamination (Akaraonye et al., 2010). Treatment of these wastes is associated with high
costs of management, so their recycling is of great importance for the manufacturers (Taniguchi
et al., 2003). The valorization of waste oils and by-products not only avoids environmental
pollution and decreases the disposal costs, but also allows for the production of value-added
products (Castilho et al., 2009).
2.2 – Polyhydroxyalkanoates
Polyhydroxyalkanoates (PHAs) are polymers of hydroxyalkanoic acids that are
synthesized by many microorganisms as intracellular carbon and energy reserve materials or
reducing-power storage materials. Numerous prokaryotic microorganisms accumulate PHA

Introduction
7
under conditions of nutrient limitation, such as nitrogen or phosphorus, and in the presence of
excess carbon source (Lee, 1996a). Hence, PHAs are accumulated in the cytoplasm as densely
packed water insoluble granules. When the limiting nutrient is provided to the cell, these energy
storage compounds are degraded and used (Höfer et al., 2011). The PHA granules consist of
97.7% PHA, 1.8% protein and 0.5% lipids (Koller et al., 2010).
PHAs have received extensive attention mainly due to two interesting properties:
biodegradability and biocompatibility (Akaraonye et al., 2010). These polymers have the
capacity to be degraded by microorganisms into water-soluble oligomers and monomers (3-
hydroxybutyric acid, a known constituent of blood plasma) that are used as carbon source by
microorganisms in the natural environment (Ojumo et al., 2004). Also, it is important to refer that
PHAs are non-toxic in nature, presenting the advantage of being biocompatible, features that
render them suitable for use in many medical applications. Furthermore, these polymers
possess physical-chemical characteristics similar to traditional plastics, but have the
considerable advantage of being biocompatible and biodegradable (Lee, 1996a).
The general structure of PHAs (Figure 2.3) can be manipulated by genetic or
physiological strategies. The pendant group R varies from methyl (C1) to tridecyl (C13), that
influence the physical properties of the polymers, such as melting temperature, glass transition
temperature and crystallinity (Lee, 1996b). The biodegradability and biocompatibility of PHAs
are influenced by the sterospecific incorporation of R(-) monomer and these monomers can
have saturated, unsaturated, straight or branched side-chain (Koller et al., 2010). PHAs have a
high degree of polymerization, which is related with molecular weight, are highly crystalline,
optically active, isotactic and piezoelectric (Reddy et al., 2003). Depending on the
microorganism and the growth conditions, the molecular weight of these compounds varies in
the range of 2×10⁵ to 3×10⁶ (Khanna & Srivastava, 2005).
Figure 2.3 – General structure of polyhydroxyalkanoates (Lee, 1996a).
The lengths of the side chain and functional group have a great importance on the
physical properties. Based on the length of the side chain, PHAs can be classified as short-
chain-length (scl) or medium-chain-length polymers (mcl). Scl-PHAs include polyesters

Introduction
8
containing 3–5 carbon atoms and they are crystalline, britle and stiff polymers, with high melting
point and low glass transition temperature, e.g. P(3HB), poly(3-hydroxyvalerate) [P(3HV)] or the
copolymer P(3HB-co-3HV) (Lee, 1996a). In contrast, mcl-PHAs include those polymers formed
by monomers equal to or longer than C6, exhibiting low crystallinity and tensile strength but
high elongation to break, lower melting points and glass transition temperatures (Akaraonye et
al., 2010). Table 2.2 presents physical, mechanical and thermal properties of commercialized
PHAs comparing with polypropylene.
Table 2.2 – Comparison of the physical properties of scl-PHAs and mcl-PHAs with polypropylene (Adapted from Koller et al., 2010).
Today, approximately 150 hydroxyalkanoic acids have been reported as monomers of
polyhydroxyalkanoates (Steinbuchel, 2001). P(3HB) was the first PHA to be discovered and is
the most widely studied and best characterized PHA. It is a homopolymer of 3-hydroxybutyrate,
which has mechanical properties similar to polypropylene, like others scl-PHAs (Lee, 1996a).
The molecular weight of P(3HB) produced from wild-type bacteria (e.g. Cupriavidus necator ) is
usually in an interval of 104–106 with a polydispersity index around (Khanna & Srivastava, 2005;
López-Cuellar et al., 2011). It has a glass transition temperature (Tg) in range of 5–10⁰C,
whereas its melting point occurs at ~180⁰C, similar to that of polypropylene (176ºC) (Table 2.2).
But P(3HB) has still not been used in many industrial applications due to its low thermal stability
and excessive brittleness upon storage (elongation at break of 6%) (Koller et al., 2010; Lee,
1996a).
The polymer properties can be improved with the incorporation of monomer units such
as 3-hydroxyvalerate or 4-hydroxybutyrate to form copolymers, like P(3HB-co-3HV) which have
lower crystallinity and decreased stiffness, being more flexible and tougher than P(3HB) (Lee,
1996a).
Properties P(3HB) P(3HB-co-3HV)
mcl-PHAs
Polypropylene
Crystallinity (%) 40–80 55 – 70 20–40 70
Melting point (⁰C) 171–182 75–172 30–80 176
Density (g cm-3) 1.25 1.20 1.05 0.91
Tensile strength (MPa) 40 25–30 20 34
Glass transition temperature
(⁰C) 5–10 -13–8 -40–150 -10
Elongation at break (%) 6 8–1200 300–450 400
UV light resistance Good Good Good Poor
Solvent resistance Poor Poor Poor Good
Biodegradability Good Good Good None
Introduction
9
On the other hand, mcl-PHAs have gained much interest in research on biopolymers,
because of their ability of chemical modification which have shown promise for medical
applications (Sun et al., 2007).
2.3 – Applications
Due to their biocompatibility and biodegradability, PHAs present a great potential to be
used in several fields, such as packaging, agricultural, fisheries and medical applications. PHAs
have been used as packaging materials and shampoo bottles by Wella AG, Germany. Other
products have also been developed, including packaging films (e.g. bags, paper coatings) and
other products like razors, utensils, diapers, feminine hygiene products, cosmetic containers
and cups (Chen, 2009).
There is a high interest in the use of PHA in medicine. Their biocompatibility with a wide
range of tissues was demonstrated in various tests using animal models (Valappil et. al, 2006).
In 2007, the U.S. Food and Drug Administration (FDA) approved the use of P(4HB) for surgical
sutures in clinical applications, leading to enhancement of the use of PHA in medicine. Fixation
and orthopaedic applications include sutures, regeneration devices, fixation rods, bone plates
and bone fracture fixation, ligament and tendon grafts, bone graft substitutes and the fabrication
biodegradable heart valve scaffolds (Valappil et. al, 2006).
PHAs can be used in the synthesis of chiral compounds, such as enantiometrically pure
chemicals, and for the production of paints (Reddy et al., 2003). Besides that, it can be applied
in foils, films and performance additives, such as surface treatment of paper, replacing the
conventional petrochemical products (Akaraonye et al., 2010; Bourbonnais & Marchessault,
2010). They can also be used as biodegradable carriers of drugs, hormones, insecticides and
herbicides (Reddy et al., 2003).
In the food industry, there is much interest in PHAs as raw material in many
applications, such as edible packaging material, coating agent, flavour delivery agent or dairy
cream substitute in the food industry (Chakraborty et al., 2012).
2.4 – PHA-producing bacterial strains
More than 300 species of bacteria from Halobactericeae and Archaea families
synthesize PHAs. However only a few bacteria can be cultivated to high cell densities with a
high PHA content in a relatively short period of time (Lee & Choi, 1998). Some factors should be
considered in the choice the microorganism, including the cell’s ability to utilise an inexpensive
carbon source, growth rate, polymer synthesis rate, and the maximum extent of polymer
accumulation (Khanna & Srivastava, 2005). Cupriavidus necator, Rhodopseudomonas palustris,
Methylobacterium organophilum and Pseudomonas sp. are examples of bacteria that
accumulate PHAs under unfavorable growth conditions (Akaraonye et al., 2010). But, some

Introduction
10
bacteria have the ability to accumulate PHA under non-limiting conditions, e.g. Alcaligenes
latus and recombinant Escherichia coli (Akaraonye et al., 2010;Lee, 1996a).
Microorganisms are capable of producing PHA from various carbon sources, ranging
from inexpensive, complex waste effluents to plant oils and their fatty acids, alkanes and simple
carbohydrates (Sudesh et al., 2000). Sugars are the most commonly used substrates, but the
cost of this type of carbon source contributes largely to the high price of PHAs (Choi & Lee,
1999). For a sustainable biopolymers production, Kim (2000) examined inexpensive renewable
carbon sources as PHA carbon feedstock and concluded that their use can reduce the overall
production costs in about 40–50%. Fatty acids and vegetable oils are advantageous compared
with other substrates for large-scale PHA production. The theoretical yield coefficient of PHA
from vegetable oils (e.g. 1.38 g PHA per 1 g of linoleic acid) was higher than the yield from
glucose (0.48 g PHA per 1 g of glucose), because they contain much higher carbon content per
weight than sugars (Akiyama et al., 2003). Besides, wastes and by-products rich in oils are
better alternatives when compared with food grade oils. Production of PHA from these
substrates may cause an imbalance in food supply and depletion of food sources, which is a
social concern. For this goal, fats/oils and their recycled products are potentially useful
feedstocks for fermentation processes (Sudesh et al., 2011). A summary of PHA produced from
various vegetable oil and animal fats using wild-type bacteria in Table 2.3.

Introduction
11
Table 2.3 – Production of PHA by various bacteria from different vegetable oils and fats, n.a.: data not available.
Strain Operation Mode Carbon Source Initial
Carbon Source (g/L)
CDW (g/L)
PHA (g/L)
PHA content (%,
wt/wt)
Productivity
(gPHA/L.h) PHA
Composition References
C. necator DSM 428
Fed-Batch Soybean Oil 20 126 95.8 76 1.00 P(3HB) Kahar et al.
(2004) C. necator DSM 530
Batch Soybean Oil 20 15 13.0 83 0.15 P(3HB) Park & Kim
(2011) C. necator DSM
428 Shake flask Vegetable oils 10 3.6–4.3 2.9–3.4 79–82 0.04–0.05 P(3HB)
Fukui et al. (1998)
C. necator DSM 428
Fed-Batch Jatropha Oil 20 65.2 49.6 76 1.03 P(3HB) Ng et al. (2010)
C. necator DSM
428 Shake flask
Waste frying rapeseed oil
20 3.7 1.2 32 0.02 P(3HB) Verlinden et al.
(2011) C. necator DSM 428
Three-stages Canola oil 75 19.9 18.3 92 0.4 P(3HB), mcl-PHA López-Cuellar et
al. (2011) C. necator DSM
428 Batch
Emulsified plant oil
17 (0.5% GA)
10 7.9 79 0.11 P(3HB) Budde et al.
(2011a)
C. necator DSM 428
Shake Flask Waste plant oils
and tallow 10 4.8–7.3 3.1–5.8 57–80 0.04–0.08 P(3HB/3HV)
Taniguchi et al. (2003)
C. necator DSM
428 Shake Flask
Waste cooking oil
20 25.4 18.0 71 0.25 P(3HB) Kamilah et al.
(2013)
C. necator DSM 428
Batch Methylated oils 2.5 2–40 0.9–1.0 3–45 0.01– 0.03 P(3HB/3HV) Kocer et al.
(2003)
P. resinovorans NRRL B-2649
Shake Flask Vegetable oils
Animal fats 5 2.9–3.8 1.2–1.9 40–51 0.02–0.04 mcl-PHA
Ashby et al. (1998)
P. oleovorans NRRL B-14682
Shake Flask CSBPa 50 1.3 0.4 27 0.006 P(3HB) Ashby et al.
(2004) P. oleovorans NRRL B-14683
Shake Flask Tallow free fatty
acids 2.4–2.7 1.6 0.3 18 0.006 mcl-PHA
Cromwick et al. (1996)

Introduction
12
Table 2.3 (Cont.).
a Co-product stream from soy-based biodiesel production containing glycerol, fatty acid soaps, and residual fatty acid methyl esters. b Saturated biodiesel fractions originating from animal waste lipids.
P. resinovorans NRRL B-2649
Shake Flask Tallow free fatty
acids Tallow
2.4–2.7 0.9–1.3 0.1–0.2 14.6–15.1 0.002 – 0.004 mcl-PHA Cromwick et al.
(1996)
P. citronellolis NRRL B-2504
Shake Flask Tallow free fatty
acids 2.4–2.7 1.7 0.05 3 0.001 mcl-PHA
Cromwick et al. (1996)
P. citronellolis NRRL B-2504
Fed-batch SFAEb 5–7.5 30.6–
42 2.8–2.9 20–27 0.067–0.1 mcl-PHA Muhr et al. (2013)
P. stutzeri NRRL B-1317
Shake Flask Soybean oil 10 2.7 1.7 63 0.04 mcl-PHA He et al (1998)
P. oleovorans NRRL B-778
Batch linoleic acid,
methylated oils 2.5 0.6–2.3 0.3–1.9 7–29 0.01–0.08 mcl-PHA
Kocer et al. (2003)
C. testosteroni NRRL B-2611
Shake Flask Vegetable oils 20 n.a. n.a. 79–88 n.a. mcl-PHA Thakor et al.
(2005)

Introduction
13
Cupriavidus necator (formerly known as Ralstonia eutropha) is an aerobic, chemo-
organotrophic β-proteobacterium, known as the model organism for PHA production, because
of its ability for accumulation of high amounts of polymer (up to 90%), using simple carbon
sources, such as glucose, lactic acid and acetic acid (Riedel et al., 2012). This bacterium was
also reported to be able to accumulate P(3HB) up to approximately 80% (wt/wt) of the cell dry
weight from plant oils, as shows Table 2.3 (Fukui & Doi, 1998; Kahar et al., 2004). Since plant
oils were difficult to be efficiently used due to the heterogeneity of the two phase aqueous
medium, the substrate was emulsified in the growth medium using gum arabic as the
emulsifying agent (Budde et al., 2011a). Also, waste oil can become a good alternative
compared with pure oil or glucose as substrates for cultivation of PHA-producing bacteria.
Verlinden et al. (2011) reported the production of 1.2 g/L P(3HB) from waste frying oil by C.
necator (Table 2.3), which was similliar to the production obtained from glucose by the same
strain. Wild-type C. necator is widely used in industrial processes to produce PHA, therefore
there have been many studies to produce high PHA yield using mutant strains (Bhubalan et al.,
2008; Budde et al., 2011b).
Bacteria of the genus Pseudomonas are known for their ability to synthesize medium-
chain-length PHA (Lageveen et al., 1988). This genus belonging to rRNA homology group I,
which accumulates mcl-PHA when cultivated on various aliphatic alkanes or aliphatic fatty acids
(Huisman et al., 1989). Among the PHA-producing Pseudomonas species, P. oleovorans NRRL
B-14683, P. resinovorans NRRL B-2649, P. putida KT2442, and P. citronellolis were reported to
produce PHA from tallow, a cheap fat (Cromwick et al., 1996). Table 2.3 shows that several
Pseudomonas strains are able to grow and accumulate P(3HB) and mcl-PHAs using triglyceride
substrates, fatty acids and co-products stream from soy-based biodiesel production (CSBP)
(Ashby & Foglia., 1998; Ashby et al., 2004; He et al., 1998).
Comamonas testosteroni is also a promising candidate for PHAs production on different
carbon sources. It was studied by Thakor et al. (2005) for its ability to synthesize mcl-PHAs
during cultivation on vegetable oils, accumulating up to 78.5–87.5% (wt/wt) of the cellular dry
material (Table 2.3).
PHA synthesis is determined not only by the producing microorganism and the carbon
sources used, but also by the metabolic routes involved (Lageveen et al., 1988). Many long-
chain fatty acids can be used by microorganisms, in the presence of extracellular lipase that
induces their enzymatic hydrolysis (Kahar et al., 2004). After the lipase action, the fatty acids
are transferred through the cell membrane and metabolized via β-oxidation pathway to produce
PHA monomers. Fats can be subjected to a pretreatment procedure, like saponification, so that
fatty acids can more easily be incorporated by microorganisms, especially those that are not
able to synthesize lipases (Kocer et al., 2003; Tan et al., 1997). There are three metabolic
pathways (Figure 2.4) involved in the generation of PHA monomers. Control of these pathways
is ensured by many genes that encode different enzymes (Sudesh et al., 2000). In C. necator,
the synthesis of P(3HB) is a simple biosynthetic pathway that involves three enzymes and their
encoding genes. In the first step, two acetyl-CoA molecules are condensed to form acetoacetyl-

Introduction
14
CoA, a reaction catalyzed by β-ketothiolase, which is encoded by phaA gene. In the next step,
acetoacetyl-CoA is reduced to (R)-3-hydroxybutyryl-CoA by the enzyme acetoacetyl-CoA
reductase that is encoded by phaB gene and is NADPH-dependent. The last reaction, is the
polymerization of (R)-3-hydroxybutyryl-CoA monomers catalyzed by PHA synthase (encoded by
the phaC gene) (Lee, 1996a; Sudesh et al., 2000).
Figure 2.4 – Metabolic pathways involved in synthesis of PHA. PhaA, β -ketothiolase; PhaB, NADPH-dependent acetoacetyl-CoA reductase; PhaC, PHA synthase; PhaG, 3-hydroxyacyl-ACP-CoA transferase; PhaJ, (R)-enoyl-CoA hydratase; FabD, malonyl-CoA-ACP transacylase; FabG, 3-ketoacyl-CoA reductase (Sudesh et al., 2000).
Another type of PHA biosynthetic pathway is exhibited by Pseudomonas species that
derives the 3-hydroxyacyl-CoA to form mcl-PHAs, from the intermediates of fatty acid β-
oxidation pathway, enoyl-CoA, 3-ketoacyl-CoA, and/or S-3-hydroxyalcyl-CoA. Pseudomonas
species, except P. oleovorans, can also synthesize mcl-PHAs from unrelated carbon sources
such as carbohydrates, where the 3-hydroxyacyl monomers are derived from the de novo fatty
acid biosynthesis pathway (Sudesh et al., 2000).

Introduction
15
2.5 – Production of PHAs in Bioreactors
The production of PHA by microorganisms using different types of cultivation modes
has been studied for PHA production optimization. Batch and fed-batch fermentations are
widely used in the industrial PHA production (Chee et al., 2010).
There are many factors that influence the bioprocess, namely the physiological
requirements of the microorganism, such as the temperature range, stirrer speed, dissolved
oxygen concentration, pH and substrate composition and concentration (Tajalli & Roy, 2010).
Batch cultures have been employed in the investigation and optimization of scl-PHAs and mcl-
PHAs (Akaraonye et al., 2010). But this technique is not ideal to PHA accumulation, because
after the onset of nitrogen limitation the cell viability decrease and the cells are not fully active
and deteriorate partially (Akaraonye et al., 2010). Fed-batch fermentation is a classical strategy
in PHA production and one of the best methods used to ensure large amounts of polymer
accumulation within a shorter time span. For the fed-batch cultures, a two stages cultivation
method is most often employed. The main aim is to achieve a high cell density culture in the first
stage and, then, to increase the concentration of PHAs in a second stage by a nutrient limited
cultivation. In this context, this type of cultivation is suitable for bacteria that require limitation of
essential nutrients for the efficient synthesis of PHA (Akaraonye et al., 2010; Khanna &
Srivastava, 2005).
The nutrient concentration needs to be controlled, because a premature limitation of
nutrient limits the cell concentration and affects the final PHA concentration and consequently a
low PHA productivity. Also, if nutrient limitation is delay too long, cells are not able to
accumulate, resulting in PHA content and a low PHA productivity (Lee, 1996b). A fed-batch
strategy avoids problems of inhibition by substrate (López-Cuellar et al., 2011). Besides, in fed-
batch fermentation the optimal strategy is to feed the growth limiting substrates at the same rate
as the rate of substrate utilization by organism. This avoids by-products production by limiting its
quantity to the amount required for production of the product of interest (Akaraonye et al.,
2010).
2.6 – Downstream processing
Due to its intracellular nature, PHA recovery process from the biomass is a rather costly
process (Chee et al., 2010). Following biosynthesis process, cells containing PHAs are
separated from the cultivation broth by conventional procedures, such as centrifugation, and
then the harvested cells are lysed for PHAs recovery. Some factors have been considered when
choosing the adequate method for PHAs recovery, namely the production strain, the required
product purity, the availability of isolation agents and the acceptable impact on the molecular
mass (Koller et al., 2010). In Table 2.4, different strategies used for PHA recovery from the
biomass are summarized.
Introduction
16
Most commonly used methods involve extraction using solvents, like chloroform,
dichloromethane or 1,2-dichloroethane. Typically, the biomass is contacted with the organic
solvent, extracting PHA by its dissolution in the solvent. After removing cell debris by filtration,
the polyester is precipitated on a cold PHA antisolvent (e.g. ethanol and methanol) (Ramsay et
al., 1994). The use of solvents is very simple and effective and can achieve highly pure PHA
with high average molecular weight. Compared with other recovery methods, solvent extraction
causes negligible degradation to the polymers and is able to remove bacterial endotoxin,
making PHA suitable for medical applications. On the other hand, the solvent destroys the
natural morphology of PHA granules, which is advantageous for some applications, like the
production of strong fibbers, but disadvantageous for applications wherein amorphous polymer
is necessary (e.g. paper coating) (Bourbonnais & Marchessault, 2010; Jacquel et al., 2008).
Nevertheless, large amounts of toxic and volatile solvent are required, so that the extracted
polymer solution is not too viscous and the removal of cell debris is more effective. This large
quantity of solvent is not only an hazardous to human health and the environment, but also
increases the total production costs of PHAs (Choi & Lee, 1997).
In order to overcome these problems, other methods to recovery PHA has been
studied, based on digestion of non-PHA cellular materials by using chemical (e.g. sodium
hypochlorite) or enzymatic digesters (e.g. protease or lysozyme) (Table 2.4). A range of
surfactants have been evaluated for their ability of digestion of cellular materials and, among
them, SDS showed good performance (Chen, 2009; Ramsay et al., 1990). Mechanical cell
disruption, dissolved air flotation or extraction using supercritical CO2 have also been recently
reviewed as potentially good alternatives for PHA recovery (Hejazi et al., 2003; Tamer & Moo-
Young, 1998).

Introduction
17
Table 2.4 – Some of polyhydroxyalkanoates isolation methods, n.a.: data not available.
Method Strain Results Reference
Solvent extraction Chloroform
Cupriavidus necator DSM 545
Purity: 95%; Yield: 96%
Fiorese et al. (2009)
1,2-Propylene carbonate
C. necator DSM 545
Purity: 84%; Yield: 95%
Fiorese et al. (2009)
Methylene chloride C. necator DSM 428
Purity: 98% Zinn et al.
(2003)
Chemical digestion Surfactants
Palmitoyl carnitine C. necator
Release rate >85%
Lee et al. (1993)
Sodium hypochlorite C. necator DSM 545
Purity: 98% Berger et al. (1989)
Surfactant-sodium hypochlorite
Triton X-100-sodium hypochlorite
C. necator DSM 545
Purity: 98% Ramsay et al. (1990)
Surfactant-Chelate Betaine-EDTA disodium salt
C. necator DSM 545
Purity: >96%;
Yield: 90%
Chen et al. (1999)
Selective dissolution by protons
Sulfuric acid
C. necator
Purity: >97%; Yield:
>95%
Yu & Chen (2006)
Enzymatic digestion Bromelain; pancreatin
C. necator DSM 545
Purity: 89%; Purity: 90%
Kapritchkoff et al. (2006)
Mechanical disruption Bead mill High pressure homogenization
A. latus A. latus
n.a.
Tamer & Moo-
Young (1998)
Supercritical fluid SC-CO2
C. necator Yield: 89% Hejazi et al. (2003)
Dissolved air flotation Enzymatic hydrolysis, sonification, flotation
P. putida Purity: 86% Hee et al.
(2006)
Air classification
C. necator
Purity: 95%; Yield: 85%
Jacquel et al. (2008)
2.7 – Sustainability and environmental impact of PHAs
Regarding industrial PHA production, there are several companies producing PHAs on
a large scale, mainly P(3HB) and P(3H-co-BV). Some PHA products in the markets are
described in Table 2.5. But the industrial production is still small (50,000 ton per year) when
Introduction
18
compared to the conventional plastics market, estimated at 150 million ton per year (Castilho et
al., 2009). The major drawbacks in the production of PHA are the cost associated with
substrates and the extraction of the polymer from the cells. Factors like PHA productivity, PHA
content and PHA yield are all important factors to be optimized (Choi & Lee, 1999).
Table 2.5 – The current and potential large volume manufacturers of polyhydroxyalkanoates, n.a.: data not available (Adapted from Kosior et al., 2006).
The nature and availability of the substrate influence the cost of PHAs production, due
to the expensive price of raw materials, especially the carbon source. About 40% of the total
production cost is for raw material (Choi & Lee, 1999). Therefore, the production of a variety of
PHAs by different bacteria and a final product that is economically competitive with traditional
plastics with high volumetric productivity depend on the choice of media. The selection of the
substrate should not focus only on the market prices but also on availability (Akaraonye et al.,
2010).
Many studies of PHAs have showed a concern about their high production costs and
environmental impact compared with petrochemical-based polymers synthesizes (Choi & Lee,
1999). Comparative studies of life cycle assessment of PHAs versus oil-derived plastics were
done to evaluate the environmental impacts of PHA production (Gomez et al., 2012). These
researches concluded that the dominant contributor is the energy requirements for sterilization,
aeration, and agitation. Also, when carbon sources from agriculture feed-stocks are used, the
energy to produce their substrates have to be considered (Gomez et al., 2012). However, using
renewable resource, like oils and fats wastes, improves PHA manufacturing because energy
and greenhouse-gas emissions are reduced (Hassan et al., 2012).
Polymer Trade names Manufacturers Capacity (tons) Price (kg−1) (in 2010)
P(3HB) Biogreen® Mitsubishi Gas
Chemical Company Inc. (Japan)
10,000 €2.5–3.0
P(3HB) Mirel™ Telles (US) 50,000 €1.5
P(3HB) Biocycle® P(3HB) Industrial Company (Brazil)
50 n/a
PHBV and P(3HB)
Biomer® Biomer Inc. (Germany) 50 €3.0–5.0
PHBV, PHBV+
Ecoflex blend Enmat®
Tianan Biologic, Ningbo (China)
10,000 €3.26
PHBH Nodax™ P&G (US) 20,000–50,000 €2.5
PHBH Nodax™ Lianyi Biotech (China) 2000 €3.7
PHBH Kaneka PHBH
Kaneka Corporation (Japan)
1000 n.a.
P(3HB-co-4HB)
Green Bio Tianjin Gree Bio-Science Co/DSM
10,000 n.a.
P(3HB-co-4HB)
Meredian Meredian (US) 272,000 n.a.

Introduction
19
The optimization of the process is needed to reduce PHAs costs, because their price is
still high (US $ 1.99/kg, in 2010) (Kosior et al., 2006) compared with conventional plastics,
which is less than US $ 1/kg (Choi & Lee, 1997). For this purpose, the analysis of the entire
process for the production and recovery of PHA should to be done to design the most efficient
method of PHA production and to evaluate the approximate price of PHA produced on a
commercial scale. Development of efficient metabolically engineered strains capable of utilizing
cheap carbon sources, efficient cultivation strategies and improving the extraction and
purification processes are necessary to make PHA attractive on the polymers market
(Akaraonye et al., 2010; Jacquel et al., 2008).

20

Materials and Methods
21
3 Materials and Methods
3.1 – Fat wastes characterization
3.1.1 – pH measurement
The pH of fat wastes was determined at 50⁰C, due to their solid consistence at ambient
temperature, with pH electrode from Crison (basic 20 pH).
3.1.2 – Density
To determine the density, the three fat wastes (margarine, refinery and sludge) were
melted at 70ºC and transferred (5 mL) into pre-weighed syringes. After cooling to room
temperature the fat wastes were reweighed. The density (g/cm3) was calculated by Equation 1.
Duplicate analyses were performed for each sample.
𝐷𝑒𝑛𝑠𝑖𝑡𝑦 (g/cm3) =SFWBm−SEm
V (1)
SFWBm is the mass of syringe with fat wastes (g), SEm is the mass of the empty syringe (g) and
V is the volume of fat wastes (mL).
3.1.3 – Water content
To determine the water content, melted fat wastes (2 mL) were transferred into pre-
weighed tubes and let to cool at room temperature. The fat wastes were frozen in liquid nitrogen
and lyophilized (Telstar, Cryodos), for 2 days (temperature: -42 to -45ºC; pressure less than
0.35 mbar). The dried fat wastes were reweighed and the water content (%) was determined by
Equation 2:
𝑊𝑎𝑡𝑒𝑟 𝑐𝑜𝑛𝑡𝑒𝑛𝑡 (%) =FWm(H2O)−FWm
FWm(H2O) (2)
where FWm(H2O) is the mass of fat wastes (g) and FWm is the mass of fat wastes after
lyophilization (g). Triplicate analyses were performed for each fat waste.

Materials and Methods
22
3.1.4 – Solubility
The solubility of fat wastes in water and organic solvents (hexane (JMGS); ethanol,
(Scharlau); acetone (JMGS)) was determined by mixing 4 mL of each sample in 40 mL of each
solvent. The mixtures were stirred in the vortex (2500 rpm, 1 min, VWR) and centrifuged (16743
g, 15 min). The supernatant was transferred to pre-weighed plastic tubes and the solvent was
evaporated in a fume hood until constant weight was obtained. The water mixtures were
lyophilized for 2 days at a temperature range of -42 to -45ºC and pressure less than 0.35 mbar.
The pellets were also dried in the fume hood until constant weight and weighed. The solubility of
the fat wastes in each solvent was determined by Equation 3:
𝑆𝑜𝑙𝑢𝑏𝑖𝑙𝑖𝑡𝑦 (% 𝑒𝑥𝑡𝑟𝑎𝑐𝑡𝑖𝑜𝑛) =Sm
Sm+Pm× 100% (3)
where Sm is the mass of dried supernatant (g) and Pm is the mass of dried pellet (g).
3.1.5 – Miscibility test
It was tested the miscibility of fat wastes in the mineral medium, which would be used in
microbial cultivation (described in section 3.2.1). Each fat waste (2 mL) was mixed with 100 mL
mineral medium, in 250 mL shake flasks and placed in an orbital shaker for three days at 200
rpm, at different temperatures (30ºC and 37ºC). The miscibility of the fat wastes in the mineral
medium was evaluated by visual observation of the flasks. Then, the flasks were transferred to
ambient temperature for a week to verify the mixtures’ stability.
3.1.6 – Total sugar content
The fat wastes content in sugars was determined using the phenol-sulphuric acid
method. 500 mg of each fat waste were added to 0.5 mL of 5 % phenol (Sigma) and 2.5 mL of
concentrated sulphuric acid (Fisher). The mixtures were shaken for 10 min at 2500 rpm and
after 30 min their optical density was measured at 490 nm (Hach spectrophotometer, Lange). A
calibration curve was prepared using known concentrations of glucose (0–200 mg/L). The
quantity of sugar was expressed as percentage of sugar in fat wastes. Duplicate analyses were
performed for each sample.
3.1.7 – Inorganic content and composition
To determine the fat wastes composition in inorganic compounds, 1 mL of each fat
waste was added to a pre-weighed porcelain crucible. The crucibles were placed in
a preheated oven (Carbolite) at 550ºC, for 24h. Afterwards, the crucibles were placed in

Materials and Methods
23
desiccators to cool to room temperature and the ashes obtained were dissolved in 20 mL 2.3 M
sulphuric acid solution. The solutions were analyzed by Inductively Coupled Plasma - Atomic
Emission Spectrometry (ICP-AES), in ICP Horiba Jobin-Y, France, Ultima, to quantify their
content in aluminum, calcium, iron, magnesium, phosphorus, potassium and sodium.
3.1.8 – Elemental analysis
The carbon, hydrogen, nitrogen and sulphur content of each fat waste were analysed
using the elemental Analyser Thermo Finnigan – CE Instruments (Italy), model Flash EA 1112
CHNS. Duplicate analyses were performed for each fat waste.
3.1.9 – Lipid profile analysis
For the analysis of glycerin, mono, di and triglycerides by gas chromatography,
approximately 100 mg of each fat waste were accurately weighed in a 10 mL vial. Butanetriol
(internal standard IS1) and tricaprin (internal standard IS2) solutions (Sigma and TCI,
respectively) were prepared in pyridine (Carlo Erba) at concentrations of 1000 μg/mL and 8000
μg/mL, respectively, and used as internal standards. Four commercially available calibration
solutions (Sigma), containing glycerin, monoolein, diolein, triolein, butanetriol (IS1) and tricaprin
(IS2) were used to construct the calibration curves with concentrations in the range 5 – 1250
μg/mL (Table 7.1, section 7.1). Then, 0.8 μL of IS1, 100 μL of IS2 and 100 μL of the
derivatization agent (N-Methyl-N-(trimethylsilyl) trifluoroacetamide, Acros organics) were added
to the sample vial, which was hermetically sealed and shaken. After 15 min, 8 mL of n-heptane
(Carlo Erba) was added and the final reaction mixture was injected (1 µL) into a Thermo
Scientific TRACE GC Ultra equipped with a true cold On-column inlet and a flame ionization
detector (FID) automated by a TriPlus Autosampler for liquids was used. A non-polar Thermo
Scientific TRACE™ TR-BIODIESEL column (10 m, 0.32 mm, 0.1 µm) and a pre-column (1 m,
0.53 mm) was used, connected to the column by a leak-free high T purged connection. The
helium was used as carrier gas (3 mL/min for 12 min, then ramped to 5 mL/min at 0.5
mL/min2).The oven temperature was programmed from 80ºC (1 min) to 180ºC at 15ºC/min, then
to 230ºC at 7ºC/min, then to 365ºC (4 min) at 10ºC/min. The peak identification was done by
comparison of the retention times with a reference material. The amount of glycerin in each fat
waste was calculated with the calibration function derived from the glycerin calibration curve. In
the same way, the amount of mono-glycerides, di-glycerides and tri-glycerides were determined
from the monoolein, diolein, and triolein calibration functions, respectively.
3.1.10 – Free fatty acids content
The analysis of the free fatty acids content of fat wastes was done by automatic titration
(TIM 86J Titration Manager). 0.5 – 0.1 g of each fat waste were dissolved in 30 mL isopropanol

Materials and Methods
24
(Sigma) and titrated with NaOH (0.1M, Eka) in isopropanol, previously prepared. Three
electrodes were used for titration, as mentioned in standard NF.EN.ISO 660–1999. The
electrodes were positioned in the sample and, after allowing 30 s for pH reading to become
stable, the titration ran at 550 rpm. The results were expressed as acidity (% oleic acid) as
described by Equation 4:
𝐹𝐹𝐴𝑠 (%) = 𝑉𝑡𝑖𝑡𝑟 × 𝐶𝑡𝑖𝑡𝑟 × 𝑀 ×100
1000× 𝑤𝑠𝑚𝑝 (4)
where Vtitr is total volume of titrant used (mL), Ctitr is the concentration of titrant (mol/L), M is the
molar weight of oleic acid and Wsmp is the fat waste weight (g).
3.1.11 – Fatty acids profile analysis
The fatty acids composition of fat wastes was determined by gas chromatography (GC).
Accurately weighed (~25 mg) fat wastes were mixed with 2 mL of methanol (Fisher) containing
5% (v/v) of acetyl chloride (Sigma) in 10 mL capped vials. The mixtures were heated at 80ºC for
60 min. After cooling to room temperature, 1 mL of deionized water was added to each sample
and the mixtures were stirred in the vortex (2500 rpm, 30 s). Two layers were obtained. 600 μL
of the upper organic phase were transferred into another vial and mixed with 400 μL of
methylheptadecanoate (Sigma) at a concentration of 10 mg/mL. Samples were injected (0.5 μL)
on a Thermo Scientific TRACE GC Ultra equipped with a PTV inlet with backflush option and a
flame ionisation detector (FID), automated by a TriPlus Autosampler for liquids. A polar Thermo
Scientific TRACE TR-BIODIESEL column (30 m, 0.25 mm, 0.25 μm) and a pre-column (2 m,
0.53 mm) were used. Helium was used as the carrier gas (2 mL/min, constant flow mode). The
oven temperature was programmed from 120ºC (0.5 min) to 220ºC (1 min) at 30ºC/min, then to
250ºC (5 min) at 10ºC/min. The PTV injector program consisted of: 90ºC to 260ºC (10ºC/s), split
flow 100 mL/min; transfer time = 3 min; cleaning: 360ºC, split 250 mL/min x 20 min. Peak
identification was done by comparison of the retention times with a reference material. The ester
contents were determined as showed in Equation 5:
% 𝐸𝑠𝑡𝑒𝑟 =(
𝐴𝑃𝐴𝑃𝐼
)
∑(𝐴𝑃𝐴𝑃𝐼
)× 100% (5)
where AP is the peak areas ranging from C14:0 to C18:3, and API is the peak area of
methylheptadecanoate.

Materials and Methods
25
3.2 – Microbial cultivation experiments
3.2.1 – Bacterial strains
Bacterial cultures, preserved by liophilization, of Pseudomonas oleovorans NRRL B-
14682, Pseudomonas oleovorans NRRL B-14683, Pseudomonas oleovorans NRRL B-778,
Pseudomonas oleovorans NRRL B-3429, P. resinovorans NRRL B-2649, P. resinovorans
NRRL B-4205, P. citronellolis NRRL B-2504, P. stutezeri NRRL B-775, P. stutezeri NRRL B-
2461 and C. testosteroni NRRL B-2611 were offered by the National Center for Agricultural
Utilization Research, USA. C. necator DSM 428 was purchased from Deutsche Sammlung von
Mikroorganismen und Zellkulturen GmbH.
All bacterial strains were reactivated by inoculation of the lyophilized cells in liquid
Luria–Bertani LB (20 mL) in 100mL shake flasks, with cotton filters. Cells grew aerobically for 48
h, at 30°C and at 200 rpm, on a orbital shaker. The cultures were transferred to sterile 2 mL
cryovials containing sterile 20% glycerol (Sigma) as a cryoprotectant agent. The vials were
stored at -80°C. For short term storage (up to 24 h), the cultures were streaked onto solid LB
agar plates and incubated at 30ºC until isolated colonies were clearly observed. The plates
were then kept at 4°C.
3.3.2 – Media
LB liquid medium was used for pre-cultivation of bacteria. LB composition was as
follows (per litre of deionized water): bactotriptone 10.0 g (Quilaban), yeast extract 5.0 g
(Panreac) and NaCl 10.0 g (Panreac). The pH was readjusted at 7.0 with 5 M NaOH and then
LB medium was sterilized in a steam autoclave (Uniclave 77) at 120ºC for 20 min. Solid LB
medium was prepared by adding Agar (15 g/L, Pronagar). The mineral medium for bacterial
cultivation in shake flasks and bioreactor experiments had the following composition (per liter):
(NH4)2HPO4 1.1 g (Scharlau), K2HPO4 5.8 g (Panreac), KH2PO4 3.7 g (Panreac), 1 mL
MgSO4.7H2O (CMD Chemicals) and 1.0 mL micro-elements solution. Micro-elements solution
had the following composition (in 1M HCl, Sigma): FeSO4.7H2O 2.78, MnCl2.4H2O 1.98,
CoSO4.7H2O 2.81, CuCl2.2H2O 0.17, ZnSO4.7H2O 0.29, CaCl2.2H2O 1.67. Before sterilization at
120ºC and 20 min, mineral medium pH was readjusted at 7.4 with 5 M NaOH. MgSO4.7H2O and
micro-elements solution were prepared and autoclaved separately and added aseptically to the
medium after cooling. The substrate (fat wastes) was sterilized separately and added while hot
(~50ºC) to the mineral medium, under aseptic conditions, to give an initial concentration of 20
g/L of fat wastes.

Materials and Methods
26
3.2.3 – Shake flask experiments
For preparation of inocula, an isolated colony was taken from an agar plate prepared as
described above and inoculated into 50 mL liquid LB, in 250 mL shake flasks. Cells were
incubated at 30ºC and 200 rpm, for 72 h.
The cultures thus obtained were used as inocula for the shake flask cultivations in 250
mL flasks with 100 mL mineral medium supplemented with the substrate, as described above.
The flasks were placed in an orbital shaker at 30ºC and 200 rpm, for 72 h, to promote the
emulsification of the mixture prior to inoculation of the cultures. The pre-grown cells (10% v/v)
were transferred into the mineral medium and cultivated under the same conditions for 72 h.
Cell growth was monitored by measuring the optical density at 600 nm (OD600) (Elios α,
ThermoSpectronic). pH was also measured during the experiments. At the end of experiments,
20 mL samples were analyzed for biomass and PHA quantification. The analyses were
performed in duplicate.
For the preliminary culture screening study, fat wastes (margarine and refinery wastes
and sludge) and virgin oil were tested as carbon sources, using C. necator DSM 428 . Also
margarine waste was saponified (NaOH 5M was added to 40 mL margarine waste, at 55 ºC with
stirring, until a pH of 7.08 was reached) and tested with this culture.
The other bacterial cultures described in section 3.2.1 were tested for growth and PHA
accumulation using margarine waste as the sole carbon source.
3.2.4 – Bioreactor cultivation
3.2.4.1 – General cultivation conditions
Batch and fed-batch cultivations were performed in a 5 L bioreactor (BioStat® B-Plus,
Sartorius) with a double jacketed glass vessel and a maximum working volume of 5 L. The tank
geometry was an unbafled cylindrical tank equipped with a Rushton turbine.
In all experiments, the temperature and the pH were kept at 30± 0.1ºC and 7.0 ± 0.1,
respectively. pH was controlled by the automatic addition of 5 M NaOH or NH4OH solutions
(25%, Scharlau) and 2M HCl solutions. The aeration was provided by compressed air spargers
placed at the bottom of the vessel, with constant aeration rate (1 vvm). The dissolved oxygen
(DO) concentration was monitored with a DO electrode (Mettler Toledo) and maintained at 30%
of air saturation by automatically adjusting the stirring speed between 300 and 800 rpm and
supplementation with pure oxygen. Antifoam (Sigma) was automatically added as anti-foam
agent. The batch and fed-batch culture schemes are shown in Figure 3.1. During the
experiments, cell growth was monitored by measuring the OD600.

Materials and Methods
27
Figure 3.1 – Experimental setup of batch (a) and fed-batch (b) culture systems.
3.2.4.2 – Batch cultivation experiments with selected bacterial strains
The selected strains, C. necator DSM 428, Pseudomonas oleovorans NRRL B-14683,
P. citronellolis NRRL B-2504 and C. testosteroni NRRL B-2611, were cultivated in the bioreactor
under a batch mode. For inocula preparation, cells (40 mL) grown in LB for 24 h at 30°C on a
orbital shaker (200 rpm ) were inoculated into 400 mL of mineral medium containing 2% (wt/v)
of fat wastes (margarine waste) and incubated for 72 h under the same conditions. This culture
was inoculated into the bioreactor with an initial volume of 4 L. NaOH (5 M) was used to control
the pH. 25 mL samples were periodically taken for quantification of cell dry weight, PHA and
margarine waste concentration.
3.2.4.3 – Fed-Batch experiments with C. necator
C. necator DSM 428 was used in the fed-batch experiments. Two experiments were
performed, using different feeding strategies during the fed-batch phase:
a) Experiment 1: after 12 h of cultivation, margarine waste pulses (~20 g/L) were based
on the raise of the DO. pH was controlled by NH4OH solution (25%) and switched to 5 M NaOH,
after 19.6 h.
b) Experiment 2: after 19 h of cultivation, margarine waste pulses (~7.5 g/L) were added
every 2 h. pH control was done with NH4OH solution (25%) throughout the entire cultivation. In
this case, cells grew at 24 h in inocula preparation.
In all experiments, 25 mL samples were periodically taken for quantification of cell dry
weight, PHA and margarine waste concentration.

Materials and Methods
28
3.3 – Analytical techniques
3.3.1 – Cell dry weight and substrate quantification
The cell dry weight (CDW) and the concentration of fat wastes in the samples were both
determined by gravimetry. However, due to the nature of the substrates used in the
experiments, different procedures were tested to select for the most effective quantification
method. For the first procedure, 20 mL of cultivation broth were mixed with the same volume of
hexane (or ethanol for sludge), stirred in the vortex (2500 rpm, 30 s) and centrifuged (16743 g,
10 min). Then, the pellet was washed with 20 mL hexane and, finally, with 20 mL deionized
water. The washed cell pellet was transferred to a pre-weighed plastic tube and frozen in liquid
nitrogen before lyophilized for about 24 h (temperature: -42 to -45ºC; pressure less than 0.35
mbar). The CDW was determined by Equation 6:
𝐶𝐷𝑊 (𝑔/𝐿) =m1−m2
V (6)
where m1 is the mass of tube with dried biomass (g), m2 is the mass of the empty tube (g) and V
is the volume of cultivation broth sample (L).
The supernatant was recovered to another pre-weighed tube and dried until complete
evaporation of hexane (at room temperature, in a hood fume) and then re-weighed to determine
the margarine waste concentration (Equation 7):
[𝑅𝑒𝑠𝑖𝑑𝑢𝑎𝑙 𝑚𝑎𝑟𝑔𝑎𝑟𝑖𝑛𝑒 𝑤𝑎𝑠𝑡𝑒] (𝑔/𝐿) =mms1 − mms2
V(7)
where mms1 is the mass of tube with dried margarine waste (g), mms2 is the mass of the empty
tube (g) and V is the volume of cultivation broth sample (L).
For the second procedure, 10 mL of cultivation broth were lyophilized for 48 h
(temperature: -42 to -45ºC; pressure less than 0.35 mbar). The dried broth was washed twice
with 10 mL hexane and deionized water. Finally, the washed cell pellets were resuspended in
deionized water, transferred to pre-weighed tubes and lyophilized (24 h, temperature: -42 to -
45ºC; pressure less than 0.35 mbar) and reweighed. The CDW was determined by Equation 6.
For quantification of the margarine waste, the lyophilized broth (5 mL) was mixed with 5 mL of
hexane, vortexed (2500 rpm, 30 s) and centrifuged 10 min at 16743 g and 20°C. Subsequently,
3 mL of the upper hexane layer were transferred to a pre-weighed plastic flask and left to dry in
the fume hood (at room temperature) until a constant weight was obtained. The residual fat
remaining on the flask was weighed and its concentration was calculated by Equation 7.
Duplicate analyses were performed.

Materials and Methods
29
3.3.2 – Microscopic visualization of bacterial cells and intracellular PHA
granules
Cells were visualized under the optical microscope in phase contrast (Olympus BX51),
using a 100x magnification. For detection of PHA granules in bacterial cells, 1 mL of cultivation
broth was centrifuged at 16743 g for 5 min and the pellet was washed and centrifuged again.
After suspension of the cells in deionized water and addition of 500 μL of Nile Blue A solution
(Sigma), the cells were incubated at 70ºC for 10 min. Cells were put in a slide and observed by
epyfluorescence light in the same microscope.
3.3.3 – PHA polymer analysis
The polymer content in the bacterial cells and its composition were determined
according to the method of Braunegg et al. (1978), with small modifications. Approximately 3–5
mg lyophilized cells obtained as described above (section 3.3.1) were transferred into a screw-
capped tube and subjected to methanolysis with 1 mL chloroform (Sigma) containing 1 mg/mL
methylbenzoate (Sigma) as internal standard and 1 mL of 20% sulphuric acid in methanol, at
100°C for four hours, to break up the PHA and convert the constituents to their methyl esters.
After cooling to ambient temperature, 1 mL of deionized water was added to the reaction
mixture and stirred in the vortex (2500 rpm, 30 s). After phase separation, the organic phase (1
mL) was transferred to a vial containing molecular sieves (0.3nm, Merck). 1 μL of samples were
analyzed in GC, on a Varian CP-3800 system equipped with an ionization flame detector and
injector, at 240ºC. A ZB-5MS column (15 m, 0.25 mm, 0.25 μm) was used. Helium was used as
the carrier gas with constant flow rate of 1.5 ml/min. The temperatures program for P(3HB)
analysis was: the initial temperature was 60°C for 1 min; 60ºC to 120ºC (3ºC/min), 120 to 300ºC
(20ºC/min). P(3HB-co-HV) copolymer (Sigma) and mcl-PHA with 3-hydroxyhexanoate (HHx)
and 3-hydroxyoctanoate (HO) monomers (supplied by Biopolis) were used as standards. The
polymer standards were dissolved in chloroform and treated in the same way as the samples.
Quantitative determinations were done by assignment of the relative retention times of peaks to
the respective 3-hydroxy fatty acid methylesters. Duplicate analyses were performed. PHA
content, polymer concentration ([PHA], g/L) and active biomass concentration (X, g/L) were then
calculated by Equation 8, 9 and 10, respectively.
% 𝑃𝐻𝐴 =mPHA
mcells
× 100%(8)
[𝑃𝐻𝐴] =%PHA
100× CDW(9)
𝑋 = CDW − [PHA](10)

Materials and Methods
30
Where mPHA is the amount of PHA (mg), mcells (mg) is the amount of liophylized biomass in
sample.
3.4 – Calculations
The specific growth rate was calculated as the increase in cell mass per unit of time. A
slope linear regression between Ln (X) and time was done to determine the maximum specific
growth rates (μmax, h-1). The growth and storage yields (YX/s (gX/gs) and YPHA/s (gPHA/gs),
respectively) were determined using Equations 11 and 12, respectively:
YX/s =mX
ms
(11)
YPHA/s =mPHA
ms
(12)
where mPHA is the mass of polymer and ms is the mass of consumed margarine waste and mX is
the mass of liophylized biomass. The maximum PHA amount produced per liter reactor volume
per unit time was defined as the volumetric productivity (rPHA, gPHA/L.h) (Equation 13). The
specific productivity was defined as the maximum PHA amount (mPHAmax) per maximum active
biomass (mXmax) per time (qPHA, gPHA/gX.h), (Equation 14).
rPHA =mPHAmax
V. t(13)
qPHA =mPHAmax
mXmax. t
(14)
The global substrate uptake rate (rs, gs/L.h) was determined by Equation 15:
rs =msi − msf
V. t(15)
where msi (g) is the mass of the initial margarine waste, msf (g) is the mass of the final
margarine waste, V (mL) is the reactor volume and t (h) is the time of cultivation.
3.5 – Polymer extraction
Lyophilized cells obtained as described above (section 3.3.1) were extracted with
chloroform (0.1 g/L) at 37 °C for 72 h, at 200 rpm on an orbital shaker. The cellular debris were
removed by filtration with syringe filters with a pore size of 0.45 μm (GxF, GHP membrane,
PALL) and the PHA was precipitated in ice-cold ethanol (chloroform/ethanol 1:10). Thereof, the
mixture was centrifuged at 16 743 g rpm for 15 min at 4°C. The white precipitate was then
recovered in a pre-weighed flask and left at ambient temperature in a fume hood for the
remaining solvent to evaporate, resulting in highly pure PHA samples. The polymer content of
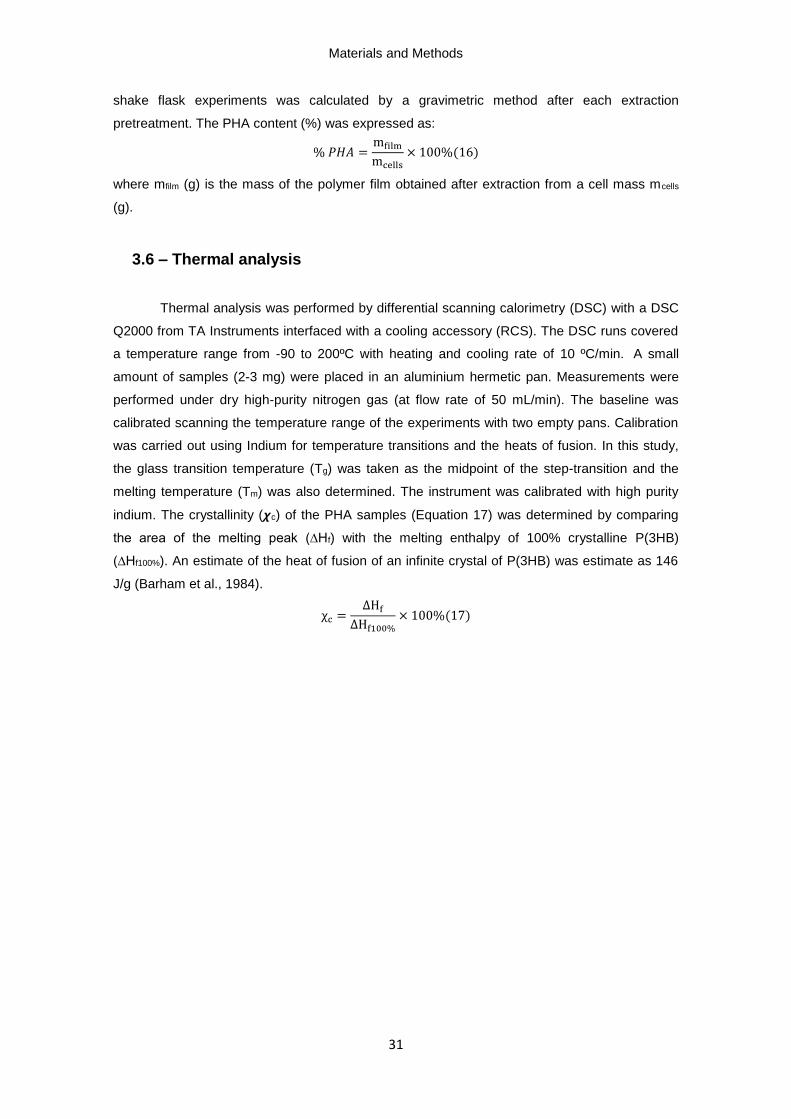
Materials and Methods
31
shake flask experiments was calculated by a gravimetric method after each extraction
pretreatment. The PHA content (%) was expressed as:
% 𝑃𝐻𝐴 =mfilm
mcells
× 100%(16)
where mfilm (g) is the mass of the polymer film obtained after extraction from a cell mass mcells
(g).
3.6 – Thermal analysis
Thermal analysis was performed by differential scanning calorimetry (DSC) with a DSC
Q2000 from TA Instruments interfaced with a cooling accessory (RCS). The DSC runs covered
a temperature range from -90 to 200ºC with heating and cooling rate of 10 ºC/min. A small
amount of samples (2-3 mg) were placed in an aluminium hermetic pan. Measurements were
performed under dry high-purity nitrogen gas (at flow rate of 50 mL/min). The baseline was
calibrated scanning the temperature range of the experiments with two empty pans. Calibration
was carried out using Indium for temperature transitions and the heats of fusion. In this study,
the glass transition temperature (Tg) was taken as the midpoint of the step-transition and the
melting temperature (Tm) was also determined. The instrument was calibrated with high purity
indium. The crystallinity (𝟀c) of the PHA samples (Equation 17) was determined by comparing
the area of the melting peak (∆Hf) with the melting enthalpy of 100% crystalline P(3HB)
(∆Hf100%). An estimate of the heat of fusion of an infinite crystal of P(3HB) was estimate as 146
J/g (Barham et al., 1984).
χc =∆Hf
∆Hf100%
× 100%(17)

32

Results and Discussion
33
4 Results and Discussion
4.1 – Fat wastes characterization
Two lots of the three fat waste materials were supplied by FIMA SA – Unilever. The
physical and chemical characteristics of all fat wastes were determined. As shown in Figure 4.1,
the visual appearance of margarine (a) and refinery (b) wastes was very similar: both were solid
at ambient temperature and were apparently homogeneous. However, the margarine waste had
a yellowish colour, while the refinery waste was darker and brownish. In contrast, the sludge (c)
showed two phases, a solid phase that contained a large amount of solid particles, and a liquid
phase, making this sample very heterogeneous. These characteristics are probably related to
their origin in the manufacturing process, which was described in section 2.1.
Figure 4.1 – Fat wastes from the manufacture process of margarine: a) margarine waste; b) refinery waste; c) sludge.
The physical and chemical characterization of the fat wastes included the determination
of: density, pH, water content, solubility in water and organic solvents, and composition in
organic and inorganic compounds. The pH of all fat wastes was low (Table 4.1). The margarine
waste had average pH of 3.97 and 4.03, for lots 1 and 2, respectively, while the refinery waste
pH was significantly lower (1.84 and 1.75, for lots 1 and 2, respectively). The sludge pH was
4.35 and 4.85, for lots 1 and 2, respectively. The amount of water was not above of 9% in the
margarine and refinery wastes and their density values were approximately 0.92 g/cm3 in both
lots (Table 4.1). These two fat wastes resulted from the initial treatment of wastewater arising
from the refinery and margarine production processes, consisting practically of fats that are not
soluble in water. Hence, their water content was expected to be low. Also, it is described that
fats have lower densities than water (Strayer et al., 2006). On the other hand, high water
contents were detected in the two sludge lots (88 and 78%, respectively) and their densities

Results and Discussion
34
were 0.43 and 1.04 g/cm3 for lots 1 and 2, respectively (Table 4.1). Such wastes are a mixture
of all effluents coming from successive washing processes (Figure 2.2, section 2.1), resulting in
high water contents, high heterogeneity and high variability between lots.
The solubility behaviour of the fat wastes was investigated in water and organic solvents
(ethanol, acetone and hexane) and the results are presented in Table 4.1. Those organic
solvents were chosen for being the most used in oil extraction processes (Johnson & Lusas,
1983; Sivarao et al., 2012). Regarding the margarine waste, the highest solubility was obtained
in hexane (93.05 and 97.50%, for lots 1 and 2, respectively) and acetone (95.18 and 99.14%,
for lots 1 and 2, respectively). Also, hexane had the best solubility values for the refinery wastes
(96.83 and 95.97%, for lots 1 and 2, respectively) (Table 4.1). As expected, the solubility of
these two wastes in water was very low, as shown in Table 4.1. For the sludge, only the organic
solvents were tested, because that waste material had a large amount of water. The solubility
results obtained were significantly different among lots 1 and 2 (Table 4.1). In lot 1, acetone and
ethanol solubilised close to 80% of the material, while only 14.67% was solubilised using
hexane. In lot 2, the solubility in hexane was higher (45.93%), while the solubility in acetone and
ethanol decreased to 44.47 and 52.53%, respectively. The heterogeneity of the sludge explains
these differing values between the two analysed lots.
Table 4.1 – Physical properties of fat wastes. The values of pH, density and water content are shown ± SD (n=2).
Considering that bacteria cultivation experiments are performed in aqueous media, the
ability to form stable fat wastes/water mixtures was tested for all fat wastes. Some factors
influence the miscibility of fats in water, like temperature, stirring and the addition of emulsifiers
(Paasimaa, 2005). Although the margarine and refinery wastes had low water solubility (Table
4.1), when the aqueous mixtures were kept at 30ºC, under constant stirring (200 rpm) for three
days, homogeneous emulsions were formed (Figure 4.2a and 4.2b). Also, after being left at
ambient temperature for a week, the aqueous mixtures maintained their homogeneity, without
phase separation, thus revealing a good stability. In spite of both fat wastes showing a
homogeneous cream coloured phase, the refinery waste aqueous mixtures had some
suspended particles that could be fat aggregates (Tamilvanan, 2004). The emulsifiers used
during the margarine production process may still have been present in the margarine wastes
Substrate pH Density (g/cm3)
Water content
(%)
Solubility (%)
Hexane Acetone Ethanol Water
Lot 1
Margarine 3.97±0.7 0.92±0.0 8.90±0.4 93.05 95.18 84.58 0.53
Refinery 1.84±0.0 0.92±0.0 7.18±0.1 96.83 89.29 85.97 2.87
Sludge 4.35±0.1 0.43±0.0 87.55±0.3 14.67 80.68 79.74 -
Lot 2
Margarine 4.03±0.3 0.91±0.0 4.70±1.0 97.50 99.14 91.38 0.11
Refinery 1.75±0.0 0.92±0.0 1.11±0.2 95.97 90.87 88.00 0.28
Sludge 4.85±0.0 1.04±0.0 77.92±1.6 45.93 44.47 52.53 -

Results and Discussion
35
and sludge and have provided emulsion stability. The overflow between effluents may explain
the presence of emulsifiers in refinery waste and also provided the emulsion (Figure 2.2, section
2.1). Due to their heterogeneity, when the sludge samples were added to water, many solid
particles remained in suspension or got stuck on the inner wall of the flask (Figure 4.2c).
Figure 4.2 – Mineral medium supplemented with fat wastes: a) margarine; b) refinery; c) sludge after being
kept in a rotary shaker at 200 rpm and 30ºC for 72 h.
The elemental analysis composition of each fat waste is presented in Table 4.2. The
main component present in all fat wastes was carbon, with average contents of 75, 74 and 67%
for margarine and refinery wastes and sludge, respectively. 10-13% hydrogen contents were
observed in all fat wastes. The presence of carbon and hydrogen atoms is due to the long
hydrocarbon chains of the fatty acids (Strayer et al., 2006). No nitrogen was detected in the
margarine and refinery wastes, in either lot, while small amounts of nitrogen were detected in
the sludge samples (Table 4.2). Trace amounts of sulphur were observed only in the margarine
waste (lot 1) and sludge (lot 2). The presence of this element may be related to the use of
sulphuric acid in fatty acid regeneration and the subsequent overflow between effluents (Figure
2.2, section 2.1).
The total sugar content was also quantified for all fat wastes (Table 4.2). Low sugar
contents were measured: 11.27 and 10.12% for margarine, 6.80 and 10.92% for refinery, 1.41
and 5.93% for sludge, in lots 1 and 2, respectively. The contact of effluents from vegetable oil
processing with other effluents might explain the presence of sugars in these wastes.

Results and Discussion
36
Table 4.2 – Chemical properties of fat wastes: elemental analysis (Carbon – C; Nitrogen – N; Hydrogen – H; Sulphur – S) and total sugar. The values of elemental composition and sugar content are shown ± SD (n=2).
Substrate Elemental composition (%) Total
sugar (%) C N H S
Lot 1
Margarine 75.25 ±0.5 0 12.43 ±0.3 0.39 ±0.1 11.27 ±3.3
Refinery 74.85 ±0.0 0 12.53 ±0.0 0 6.80 ±0.1
Sludge 67.23 ±0.6 1.3 ±0.0 10.89 ±0.3 0 1.41 ±0.0
Lot 2
Margarine 74.94 ±0.0 0 11.81 ±0.2 0 10.12 ±1.8
Refinery 73.53 ±0.3 0 12.48 ±0.1 0 10.92 ±0.3
Sludge 66.38 ±0.4 1.92 ±0.0 11.19 ±0.2 0.13 ±0.0 5.93 ±1.1
According to the ICP analysis, aluminium, calcium, iron, sodium, phosphorus and
potassium were detected in the fat wastes, in both lots, but their total contents were low (0.20–
3.33 g/L) (Table 4.3). Moreover the two lots of margarine and refinery wastes had rather
different inorganic content and composition. While in lot 1, the total inorganic content was 3.33
and 1.59 g/L, respectively, in lot 2 their content was only 0.55 and 0.20 g/L, respectively (Table
4.3). Regarding the margarine waste, the major inorganic components were calcium and iron
(Table 4.3). In the refinery waste, iron had the highest content (Table 4.3). It was observed a
similar inorganic content in sludge between lot 1 and lot 2 (0.
88 and 0.99 g/L, respectively), as shows Table 4.3. Only calcium and phosphorus achieved
concentrations above 0.15 g/L in sludge for both lots (Table 4.3). Vegetable oils contain varying
levels of trace elements depending upon exposure to different compounds during plant
cultivation season or during the extraction and processing of oils, such as bleaching, refining,
and deodorization. In addition, they can be incorporated by contamination from the metal
processing equipment and thus be suspended in the oil (Lepri et al., 2011). These aspects
might explain the presence of trace elements in fat wastes and the differences between lots.
Table 4.3 – Trace elements presented in fat wastes: aluminium (Al), calcium (Ca), iron (Fe), sodium (Na), phosphorus (P) and potassium (K), determined by ICP.
Substrate
Mineral salts (mg/L) Total (g/L) Al Ca Mg Fe Na P K
Lot 1
Margarine 0.08 1.52 0.04 1.41 0.12 0.13 0.03 3.33
Refinery 0.05 0.12 0.01 1.02 0.12 0.23 0.03 1.59
Sludge 0.04 0.18 0.02 0.09 0.27 0.24 0.05 0.88
Lot 2
Margarine 0.02 0.42 0.00 0.05 0.01 0.02 0.03 0.55
Refinery 0.02 0.07 0.00 0.01 0.02 0.04 0.04 0.20
Sludge 0.12 0.40 0.03 0.06 0.07 0.20 0.10 0.99

Results and Discussion
37
Figure 4.3 shows the results of the lipid profile of each fat wastes. High FFAs contents
were found in all three wastes. The highest FFAs content (approximately 76%) was obtained for
the margarine waste, while the other wastes had lower FFAs contents (56 and 36% in the
refinery waste and sludge, respectively) (Figure 4.3). Margarine waste had high FFAs content,
because these wastes had mainly hydrolyzed oils not used in refinery process (described in
section 2.1). On the other hand, soapstock from neutralization and interestification processes
were constituted by FFAs combined with the alkaline catalyst, as described in section 2.1. When
this soapstock was subjected to the regeneration process, refinery wastes were produced with
high FFAs content. Less than 21 and 12% tri- and diglycerides were found in the margarine and
refinery wastes, respectively (Figure 4.3). Trace amount of monoglycerides were detected and
no glycerol content was observed. Such tri-, di- and monoglycerides might have been
introduced in these wastes during oil extraction. The sludge samples only presented FFAs
(Figure 4.3). The other components were probably removed during the wastewater treatment
process.
Figure 4.3 – Lipid profile (%) of fat wastes: triglycerides (blue), diglycerides (red), monoglycerides (green) and FFAs (purple).
The fatty acid profile in the fat wastes was determined with a methanolysis assay (Table
4.4). Oleic (37–54%), linoleic (4–27%), stearic (11–18%) and mystiric acids (4–14%) were the
predominant components detected in all wastes. The fatty acid profile for the two margarine
waste lots were identical, except for linolenic acid (27.01% in lot 1 and 21.61% in lot 2) and oleic
acid, which had a lower content (48.67%) in lot 1 than in lot 2 (54.28%). The refinery waste also
showed similar fatty acid distribution between lots, but the content in mystiric (4.83% in lot 1 and
12.80% in lot 2) and oleic acids (48.64% in lot 1 and 37.19% in lot 2) were slightly different. In
contrast, the sludge had more significant differences between the two analysed lots: oleic acid
was the main component in both lots (41.26 and 54.05%), but its content was higher in lot 2; a
high content of mystiric acid (14.05%) was detected in lot 1, but its content was lower (7.81%) in
lot 2, while the opposite was observed for linoleic acid (4.89% in lot 1 and 16.43% in lot 2).
Vegetable oils used in the margarine production manufacture contained similar fatty acids
Results and Discussion
38
composition, where oleic and linoleic acids had the highest percentage (Zambiazi et al., 2007).
The percentage of the total saturated fatty acid content was about 21 to 36% and because of
that fat wastes were highly viscous and mostly in solid form at ambient temperature.
Table 4.4 – The fatty acids distribution in fat wastes for lots 1 and 2.
Substrat
e Mystiric
(%) Palmitic
(%) Stearic
(%) Oleic (%)
Linoleic (%)
Linolenic (%)
Lot 1
Margarine 6.20 3.33 11.50 48.67 27.01 3.29
Refinery 4.83 2.82 17.41 48.64 24.55 1.75
Sludge 14.05 6.41 11.69 41.26 4.89 2.68
Lot 2
Margarine 6.20 3.22 12.40 54.28 21.61 2.28
Refinery 12.80 5.21 18.34 37.19 23.76 2.70
Sludge 7.81 3.72 12.07 54.05 16.43 3.45
Since the margarine and refinery wastes were composed primarily of long-chain acids
with 12 to 22 carbons, these wastes were strongly hydrophobic. Therefore, the low pH values
are probably related to the large amount of fatty acids present in the fat wastes. Due to their
nature, fatty acids are easily extracted with nonpolar solvents, but they are poorly soluble in
water, which explains the low percentage of water extraction (Strayer et al., 2006). The sludge
had high water content and it fatty acids content was lower than other wastes, which may
explain the poor solubility in hexane. Hexane is constituted by six carbon atoms and is the most
nonpolar of the solvents used. Thereby, it has more affinity for hydrophobic compounds like fatty
acids. While ethanol and acetone have, respectively, two and four carbon atoms, they are
slightly more polar and can solubilise easier in water than hexane (Sivarao et al., 2012).
The main components presented in margarine and refinery wastes were FFAs, tri-,
diglycerides and sugar (Figure 4.4). The sludge contained basically water, FFAs and sugar.
Figure 4.4 – The main components (%) in fat wastes: FFAs (blue) triglycerides (red), diglycerides (green),
monoglycerides (purple), total sugar (light blue) and water (orange).
Results and Discussion
39
For most parameters determined (pH, density, water content and elemental
composition) the margarine and refinery wastes had very similar values among replicas (low
standard deviation values), indicating little variability among lots. On the other hand, for the
sludge samples, there were significant differences between replicate analyses and the two lots,
which reflect their heterogeneity. Moreover, the margarine and refinery wastes resulting from
the margarine production and refinery processes apparently have stable physical and chemical
characteristics, because the two lots analyzed did not present many differences in all
parameters.
According to the fat wastes characterization, these materials attract great interest as
carbon source for microbial cultivation due to their high carbon content, mainly FFAs with minor
sugars content. However, the presence of linolenic acid may affect the cell growth as it has
been reported as a cell growth inhibitor (Kahar et al., 2004). It was revealed that the low pH of
fat wastes did not affect the bacteria cultivation, due to the addition of base to raise the pH and
the buffering capacity of the mineral medium. Although fat wastes are insoluble in water,
homogeneous emulsions were obtained in the aqueous mixtures. This fact is important to
ensure that growth was not impaired by an inadequate supply of nutrients and oxygen (Doran,
1995). On the other hand, hexane and ethanol was revealed as the best solvent to extract and
quantify fat wastes.
4.2 – Shake flask experiments
In order to evaluate the best PHA producer strain, several bacteria were selected for
screening experiments, based on their ability to produce PHA from fats and oils reported in the
literature (Table 2.3, section 2.4).
Initially, the three fat-containing wastes supplied by FIMA were screened for their
suitability to support bacterial cell growth and PHA synthesis. C. necator DSM 428 was selected
for the substrate screening because it was reported to be able to grow and accumulate high
PHA contents in the biomass in the presence of an ample range of carbon sources, including
long-chain fatty acids (Budde et al., 2011a; Fukui et al., 1998; Kahar et al., 2004; Kamilah et al.,
2013; Kocer et al., 2003; López-Cuellar et al., 2011; Ng et al., 2010; Park & Kim, 2011;
Taniguchi et al., 2003; Verlinden et al., 2011) (Table 2.3, section 2.4).
As shown in Table 4.5, C. necator was able to grow and accumulate PHA in mineral
medium supplemented with all three substrates as sole carbon sources. However, after 72 h of
cultivation, cell growth was considerably lower with the refinery waste (1.7 g/L) than with the
margarine waste (10.4 g/L), even though high PHA contents were obtained in both assays (58.8
and 69.4% (wt/wt), respectively) (Table 4.5). The CDW achieved in the sludge experiment (5.2
g/L) was not accurate, because it was not possible to remove all the solid particles during the
cell washing process. The CDW and polymer content obtained with the margarine waste were
higher than the values reported by Verlinden et al. (2011) (3.7 g/L and 32% (wt/wt),
respectively) for C. necator grown on 20 g/L waste rapeseed oil, in similar cultivation conditions.

Results and Discussion
40
Taniguchi and co-workers (2003) reported that C. necator accumulated a PHA content in the
biomass of 63% (wt/wt), using waste oils in shake flask experiment. However, when tallow was
used as carbon source, they obtained a higher PHA content (80%). On the other hand, Fukui &
Doi (1998), reported higher PHA content (82%, wt/wt), but lower CDW (4.1 g/L) for C. necator
grown on 10 g/L oleic acid.
Due to its high FFAs content compared with other carbon sources (Figure 4.3), the
margarine waste not only demonstrated an efficient production of PHA, but also obtained the
highest cell dry weight. For that reason, all the following experiments were done with margarine
waste as substrate. Also, aiming to improve the performance of bacteria on the margarine
waste, this material was saponified (Table 4.5).
Table 4.5 – Cell dry weight, PHA content and PHA composition for the shake flask experiments with
different bacteria grown on different fat-rich materials (margarine, saponified margarine and refinery
wastes, sludge, and virgin oil).
Bacteria Substrat
e CDW (g/L)
PHA content
(%, wt/wt)
PHA composition (mol %)
HB HHx HO HD
C. necator DSM 428
Margarine 10.4 69.4 100 0 0 0
Refinery 1.7 58.8 100 0 0 0
Sludge 5.2 4.2 100 0 0 0
Saponified
Margarine 7.0 54.9 100 0 0 0
Virgin oil 6.7 49.9 100 0 0 0
C. testosteroni NRRL B-2611
Margarine
2.5 29.6 100 0 0 0
P. citronellolis NRRL B-2504
6.3 8.2 0 21 42 37
P. oleovorans NRRL B-778
0 - - - - -
P. oleovorans NRRL B-3429
3.2 0.9 0 0 71 29
P. oleovorans NRRL B-14682
3.7 0.8 0 0 72 28
P. oleovorans NRRL B-14683
2.1 1.4 0 0 70 30
P. resinovorans NRRL B-2649
3.9 0 - - - -
P. resinovorans NRRL B-4205
0 - - - - -
P. stutzeri NRRL B-775 0 - - - - -
P. stutzeri NRRL B-2461
0 - - - - -

Results and Discussion
41
The saponification has been reported to increase the solubility of fats in aqueous media
(Karasulu et al., 2011). C. necator was grown on saponified margarine waste and, after 72 h, it
attained a CDW of 7.0 g/L. However, the PHA content (54.9%, wt/wt) was lower than that
obtained on the margarine waste (69.4%, wt/wt) (Table 4.5). PHA production by C. necator from
saponified margarine waste was also lower when compared with emulsified plant oil (79% wt/wt)
(Budde et al., 2011a).
Virgin oil products, such as soybean oil, canola oil and palm oil, have been investigated
for PHA production with high polymer content in the biomass (Fukui & Doi, 1998; Kahar et al.,
2004; Park & Kim, 2011). Hence, for comparison, the culture was also cultivated on virgin oil,
under the same cultivation conditions. C. necator reached lower CDW and PHA content (6.7 g/L
and 49.9% (wt/wt), respectively) than on the margarine waste (Table 4.5). Because the main
component of virgin oil is triglycerides, the oil is first hydrolyzed by extracellular lipase into
FFAs, which are taken up by the cells for growth and PHA synthesis. Thus, in the case of
margarine waste, the carbon source was more available for growth and PHA accumulation than
when virgin oil was used (Cromwick et al., 1996; Kahar et al., 2004). These results suggest that
C. necator had preference towards FFAs than saponified fats or virgin oil as carbon sources.
The polymer produced by C. necator in all shake flask tests was a 3-hydroxybutyrate
homopolymer, P(3HB). According to the literature, C. necator is able to synthesize P(3HB), but
when suitable organic precursors are provided, such as propionic, valeric and pentanoic acids, it
is also able to produce copolymers poly(3-hydroxybutyrate-co-3-hydroxyvalerate, P (HB-co-HV)
(Bhubalan et al., 2008; Lee et al., 2008; Rao et al., 2010). Also, when canola oil was used as
carbon source, C. necator was able to synthesize mcl-PHAs (López-Cuellar et al., 2011).
Besides C. necator, C. testosteroni NRRL B-2611, P. citronellolis NRRL B-2504, P.
oleovorans NRRL B-778, P. oleovorans NRRL B-3469, P. oleovorans NRRL B-14682, P.
oleovorans NRRL B-14683, P. resinovorans NRRL B-2649, P. resinovorans NRRL B-4205, P.
stutzeri NRRL B-775 and P. stutzeri NRRL B-2461 species strains were screened in shake flask
assay, with margarine waste to select the best PHA producers on this waste (Table 4.5).
C. testosteroni NRRL B-2611, P. citronellolis NRRL B-2504, P. oleovorans NRRL B-
3429, P. oleovorans NRRL B-14682, P. oleovorans NRRL B-14683, P. resinovorans NRRL
B-2649 were able to use the margarine waste for cell growth. Nevertheless, the PHA content in
the biomass was different for each strain. C. testosteroni showed a maximum CDW of 2.5 g/L,
with a polymer content of 29.6% (wt/wt). Thakor et al. (2005) reported the efficiency of this
culture to convert different vegetable oils to mcl-PHAs (HHx, HO, 3-hydroxydecanoate (HD), 3-
hydroxydodecanoate (HHD) and 3-hydroxytetradecanoate (HTD)) up to 87.5% (wt/wt), in a
shake-flask experiment. Besides that, in the assay with margarine waste, C. testosteroni was
able to produce only P(3HB) homopolymer, maybe due to the substrate’s complexity.
On the other hand, P. citronellolis NRRL B-2504 cell growth was higher (6.3 g/L) than
that of C. testosteroni, but the biomass content in PHA was much lower (8.2%, wt/wt). The
polymer produced was a mcl-PHA, composed of 21 mol% HHx, 42 mol% HO and 37 mol% HD
(Table 4.5). Cromwick and co-workers (1996) reported lower CDW (1.7 g/L) and lower mcl-PHA

Results and Discussion
42
content (3%, wt/wt) for P. citronellolis grown on tallow free fatty acids. The produced PHA was
composed of 10 mol% HHx, 48 mol% HO, 28 mol% HD, 8 mol% HHD and 1 mol% HTD. The
differences in the composition of the mcl-PHA from margarine waste and tallow free fatty acids
(described by Cromwick et al. (1996)) could be related to some factors like the substrates
composition in fatty acids, namely different ratios of saturated and unsattured fatty acids, the
specificity of PHA-synthesizing system and the degradation of long-chain fatty acids. On the
other hand, since PHA synthase has high specificity for 3-hydroxyoctanoyl-CoA and 3-
hydroxydecanoyl-CoA, the mcl-PHA polymer obtained with the margarine waste had high
values of HO and HD monomers (Ashby & Foglia, 1998).
All P. oleovorans strains tested, except P. oleovorans NRRL B-778, were able to grow
on the margarine waste and accumulate PHA, though their CDW and the polymer content were
very low (2.1–3.7 g/L and 0.8–1.4%, wt/wt, respectively). Nevertheless, the synthesized
polymers were interesting since they were mcl-PHA composed of HO and HD monomers. P.
oleovorans NRRL B-14683, P. oleovorans NRRL B-14682 and P. oleovorans NRRL B-3429
synthesized a copolymer of HO (70–72 mol%) and HD (28–30 mol%). Cromwick and co-
workers (1996) also reported that up to 18% (wt/wt) of mcl-PHA (HHx, HO, HD, HHD, HTD
monomers) was accumulated by P. oleovorans NRRL B-14683 grown on tallow free fatty acids.
Interestingly, P. oleovorans NRRL B-14682 was reported to synthesize P(3HB) (27%, wt/wt)
from soy-based biodiesel production (Ashby et al., 2004), but no mcl-PHA production from fats
or oils has been reported in the literature. Besides that, production of PHA by P. oleovorans
NRRL B-3429 was also not found in literature, making it an interesting strain.
Despite P. resinovorans NRRL B-2649 has grown to a CDW of 3.9 g/L, no polymer
accumulation was observed (Table 4.5). The other tested P. resinovorans strain (NRRL B-
4205), P. stutzeri NRRL B-775 and P. stutzeri NRRL B-2461 were not able to grow on the
margarine waste, despite many Pseudomonas species have been reported as being able to
grow on oil/fat containing substrates (Du et al., 2012). P. resinovorans NRRL B-2649 was
reported to grow and accumulate mcl-PHAs using unhydrolyzed tallow and triglyceride
substrates as carbon sources (Ashby & Foglia, 1998; Cromwick et al., 1996). P. stutzeri NRRL
B-1317 was found to synthesize mcl-PHAs when growth on glucose and fatty acids (He et al.,
1998). Also, mcl-PHAs were obtained from linoleic acid and methylated oils (corn oil acids and
laurel seed oil acids), when Pseudomonas oleovorans NRRL B-778 was cultivated (Kocer et al.,
2003).
Apart from the differences in cultivation medium in the different reported literature
studies, the carbon source used in the shake flask experiments of this study was more complex
and might explain why some of the tested bacterial strains did not grow or produce polymer.
Based on the highest polymer content and/or the composition of the produced PHA, C. necator
DSM 428, C. testosteroni NRRL B-2611, P. citronellolis NRRL B-2504, P. oleovorans NRRL B-
14683 were chosen for subsequent experiments in bioreactor under controlled operation
conditions.

Results and Discussion
43
4.3 – Batch bioreactor cultivation experiments with the selected
bacterial strains
After the preliminary study in shake flask to evaluate the storage capacity performance
of each bacterium, batch bioreactor experiments were performed with the four organisms
selected using margarine waste as carbon source. The objective of these experiments was to
evaluate each culture’s performance under controlled cultivation conditions. All the batch
cultivations were operated at the same cultivation conditions (temperature, DO, stirring and pH)
with initial concentration of 20 g/L of margarine waste. The experiments were terminated when a
decrease of the stirring speed and the increase of DO was observed, since it indicated that the
metabolic activity of the cells had decreased. Figures 4.5, 4.7, 4.9, 4.11 and Table 4.6 show the
concentration profiles for active biomass and polymer concentration, and the kinetic parameters
of each batch experiment, respectively.
It was not possible to accurately quantify the substrate concentration during the assays
and only the initial and final samples of each experiment were analysed with an optimized
method developed during this study. The presence of saponified fats led to the formation of
three-phase systems (water, hexane and saponified fats) by adding hexane to the culture broth.
Due to their amphipathic nature, saponified fats were not completely removed during washing,
thus leading to incorrect substrate quantification. The optimized method consisted in first
removing water from the broth samples by lyophilisation (see section 3.3.1). Then, hexane was
added to the dried broth and only a two-phase system occurred. After centrifugation, the
supernatant contained residual margarine waste dissolved in hexane (hydrophobic phase),
while the pellet had the cellular material.
Also, Nile Blue staining was used to assess biopolymer accumulation by visualization of
the PHA granules under the optical microscope as orange fluorescence inside the cells (Figures
4.6, 4.8, 4.10 and 4.12).

Results and Discussion
44
Table 4.6 – Kinetic parameters for cultivation of C. necator DSM 428, C. testosteroni NRRL B-2611, P.
citronellolis NRRL B-2504 and P. oleovorans NRRL B-14683 in batch bioreactor experiments using
margarine waste as carbon source.
4.3.1 – Batch cultivation experiment with C. necator DSM 428
Figure 4.5 shows the cultivation profile of C. necator on margarine waste. The
exponential growth phase was initiated after a 3 h lag phase, with a maximum specific growth
rate was 0.15 h-1 (Figure 7.1, in section 7.2) (Table 4.6.). A significant increase of the active
biomass was only observed after 10 h of cultivation. Polymer production showed a similar trend
soon after (~12 h). At the end of experiment (20 h), the CDW reached a maximum of 11.2 g/L
with a P(3HB) content of 55.8% (wt/wt), corresponding to 6.4 g/L of polymer concentration and
4.7 g/L of active biomass concentration (Table 4.6). The volumetric and specific productivities
were 0.33 gPHA/L.h and and 0.061 gPHA/gX.h, respectively. From the initial 20 g/L margarine
waste available, 10 g/L were consumed, which corresponded to a global substrate uptake rate
of 0.51 gs/L.h (Table 4.6). The growth and storage yields were 0.37 gx/gs and 0.50 gPHA/gs,
respectively.
Bacteria μmáx (h-1)
CDW (g/L)
X (g/L)
PHA content (%, wt/wt)
PHA (g/L)
rPHA
(gPHA
/L.h)
qPHA
(gPHA/gx.h)
rs
(gs/L.h)
Yx/s
(gx/gs)
YPHA/s
(gPHA/gs)
C. necator DSM 428
0.15 11.2 4.7 55.8 6.4 0.33 0.061 0.51 0.37
0.50
C. testosteroni NRRL B-2611
0.40 14.0 13.0
7.2 1.1 0.06 0.015 0.70 0.16
0.08
P. citronellolis NRRL B-2504
0.39 8.1 8.0 7.0 0.6 0.04 0.004 0.84 0.48
0.04
P. oleovorans NRRL B-14683
0.37 3.4 3.4 8.5 0.3 0.02 0.004 0.70 0.21
0.02

Results and Discussion
45
Figure 4.5 – Batch cultivation profile by C. necator DSM 428 using margarine waste as carbon source
The microscope photograph show that the morphology of C. necator cells changed over
time: cells elongated as polymer granules were being accumulated (Figure 4.6a and 4.6b). The
high fluorescence observed is related with the high PHA content values obtained (55.8%, wt/wt).
Figure 4.6 – Optical microscopic photographs (100x) of bacterial C. necator DSM 428 cells stained with Nile Blue at the beginning (a) and at the end (b) of the batch bioreactor experiment.
The polymer content in the biomass was lower than the value obtained in the shake
flask assay (69.4%, wt/wt) (Table 4.5), but the CDW concentration was slightly higher (11.2 g/L
in the bioreactor cultivation against 10.4 g/L in shake flask). Besides that, the volumetric
productivity increased significantly from 0.10 gPHA/L.h to 0.33 gPHA/L in the batch bioreactor
culture, which is probably due to the controlled conditions (pH, dissolved oxygen concentration,
stirrer speed) that were kept in the bioreactor and not in the shake flasks (Doran, 1995).
Similarly to the shake flasks assays (Table 4.5) the produced polymer was a HB homopolymer
(Table 4.8).
Kahar et al. (2004) reported PHA production by C. necator cultivated on soybean oil,
achieving an active biomass concentration close to 17 g/L (in 18h) and a PHA content above
30% (wt/wt). At similar time of cultivation, the PHA content obtained with margarine waste as

Results and Discussion
46
carbon source was higher (55.8%, wt/wt) than that reported for soybean oil, but the active
biomass concentration was lower (4.7 g/L). These results indicate that C. necator was more
efficient in accumulating than growing in the margarine waste, as shown by the differences
between storage and growth yields (0.50 gPHA/gs and 0.37 gx/gs, respectively). The values
obtained with margarine waste were also higher than that reported for jatropha oil as substrate:
a range of 2-4 g/L of CDW and 40% (wt/wt) of PHA content were obtained after 12 h of
cultivation, corresponding to a volumetric productivity of 0.1 gPHA/L.h (Ng et al. 2010). This value
is considerably lower than that obtained with margarine waste.
In this study, the culture was unable to use all the available complex substrate (only half
of it was consumed). Since C. necator can not directly utilize try-, dy- and monoglycerides for
cell growth and PHA synthesis, these materials must first be hydrolyzed into FFAs by lipases
and then incorporated into the cells and metabolized (Kahar et al., 2004). Considering that the
margarine waste had high FFAs content (75%), the lipase activity of the cells might have been
low and the cellular mechanism was probably directed for the use FFAs and the culture was not
able to use the try-, dy- and monoglycerides present in the medium. Furthermore, some fatty
acids may have affected cell growth. Kahar et al. (2004) reported that C. necator grew well on
palmitic acid, oleic acid and linoleic acid, but could not grow well on linolenic acid. Although, the
margarine waste had approximately 3% of linolenic acid, the accumulation of this long-chain
fatty acid in culture broth could limit the transfer of other fatty acids into the cells. Hence, the
unutilized margarine waste might have inhibited cell metabolism.
Another possible explanation for the low substrate consumption and, subsequently, low
biomass production could be related with the high initial PHA content (35.2%, wt/wt) of the cells.
Apparently, during the first hours of the experiment (8 h), the microorganism had preference to
use the accumulated intracellular polymer reserves instead of consuming the external substrate.
4.3.2 – Batch cultivation experiment with C. testosteroni NRRL B-2611
After C. testosteroni was inoculated in the bioreactor, nearly 6 h of lag phase were
observed. The maximum specific growth rate was 0.40 h-1 (Figure 7.2, in section 7.2) (Table
4.6). Polymer production started after 8 h of cultivation, as shown in Figure 4.7. During the
experiment, both polymer and active biomass concentration had a similar profile, increasing to
1.1 g/L and 13.0 g/L, respectively, within 18 h of cultivation (Table 4.6). C. testosteroni
accumulated a maximum P(3HB) content of 7.2% (wt/wt). The volumetric and specific
productivities were 0.06 gPHA/L.h and 0.02 gPHA/gX.h, respectively (Table 4.6). The consumed
margarine waste was 16.8 g/L, corresponding to a global substrate uptake rate of 0.70 gs/L.h
(Table 4.6). The growth yield was 0.16 gx/gs, while the storage yield was only 0.08 gPHA/gs (Table
4.6).

Results and Discussion
47
Figure 4.7 – Batch cultivation profile by C. testosteroni NRRL B-2611 using margarine waste as carbon source.
The intracellular accumulation of PHA was confirmed by visualization of the Nile Blue
stained cells under the optical microscope (Figure 4.8). The epifluorescence was also observed
in C. testosteroni cells, but it was lower compared to C. necator cells due to the low polymer
content (7.2%, wt/wt)(Figure 4.8a and 4.8b).
Figure 4.8 – Optical microscopic photographs (100x) of bacterial C. testosteroni NRRL B-2611 cells stained with Nile Blue at the beginning (a) and at the end (b) of the batch bioreactor experiment.
Comparing to the shake flask experiment, wherein C. testosteroni reached an active
biomass concentration of 1.8 g/L (Table 4.5), in the bioreactor batch cultivation, the culture
attained a considerably higher cell density (13 g/L) (Table 4.6). But the biomass polymer content
was much lower (7.2 and 29.6%, wt/wt, in the bioreactor and shake flask experiments,
respectively) (Tables 4.6 and 4.5). Probably, the controlled conditions in bioreactor promoted
cellular growth over polymer synthesis. The polymer produced in either experiment was an HB
homopolymer (Tables 4.8 and 4.5).
Considerably higher polymer content (78.6–87.5%, wt/wt) has been reported by Thakor
et al. (2005) for C. testosteroni cultivation on vegetable oils. Further studies on batch bioreactor
cultivation with production of copolymers (predominantly HB units) were described by Caballerot
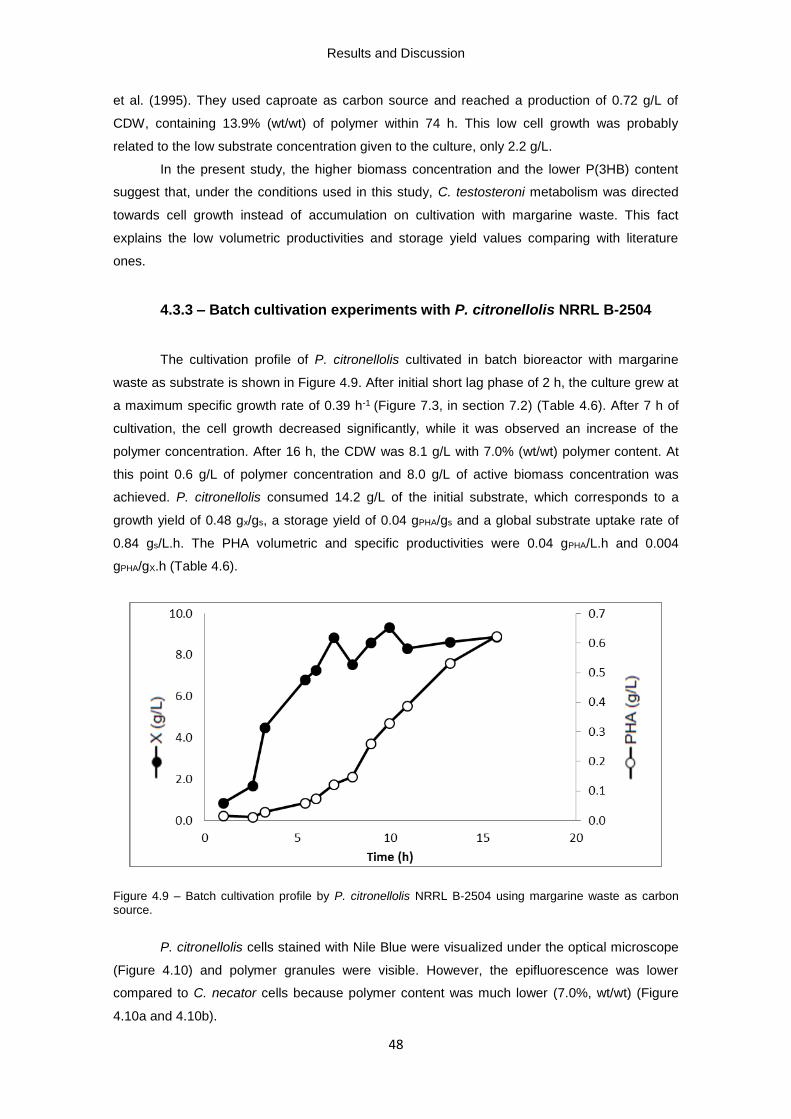
Results and Discussion
48
et al. (1995). They used caproate as carbon source and reached a production of 0.72 g/L of
CDW, containing 13.9% (wt/wt) of polymer within 74 h. This low cell growth was probably
related to the low substrate concentration given to the culture, only 2.2 g/L.
In the present study, the higher biomass concentration and the lower P(3HB) content
suggest that, under the conditions used in this study, C. testosteroni metabolism was directed
towards cell growth instead of accumulation on cultivation with margarine waste. This fact
explains the low volumetric productivities and storage yield values comparing with literature
ones.
4.3.3 – Batch cultivation experiments with P. citronellolis NRRL B-2504
The cultivation profile of P. citronellolis cultivated in batch bioreactor with margarine
waste as substrate is shown in Figure 4.9. After initial short lag phase of 2 h, the culture grew at
a maximum specific growth rate of 0.39 h-1 (Figure 7.3, in section 7.2) (Table 4.6). After 7 h of
cultivation, the cell growth decreased significantly, while it was observed an increase of the
polymer concentration. After 16 h, the CDW was 8.1 g/L with 7.0% (wt/wt) polymer content. At
this point 0.6 g/L of polymer concentration and 8.0 g/L of active biomass concentration was
achieved. P. citronellolis consumed 14.2 g/L of the initial substrate, which corresponds to a
growth yield of 0.48 gx/gs, a storage yield of 0.04 gPHA/gs and a global substrate uptake rate of
0.84 gs/L.h. The PHA volumetric and specific productivities were 0.04 gPHA/L.h and 0.004
gPHA/gX.h (Table 4.6).
Figure 4.9 – Batch cultivation profile by P. citronellolis NRRL B-2504 using margarine waste as carbon source.
P. citronellolis cells stained with Nile Blue were visualized under the optical microscope
(Figure 4.10) and polymer granules were visible. However, the epifluorescence was lower
compared to C. necator cells because polymer content was much lower (7.0%, wt/wt) (Figure
4.10a and 4.10b).

Results and Discussion
49
Figure 4.10 – Optical microscopic photographs (100x) of bacterial P. citronellolis NRRL B-2504 cells stained with Nile Blue at the beginning (a) and at the end (b) of the batch bioreactor experiment.
PHA content in the biomass was similar (7.0%, wt/wt) (Table 4.6) to the value obtained
in the shake flask experiments (8.2%, wt/wt) (Table 4.5). On the other hand, the active biomass
concentration has increased from 6.3 g/L to 8.0 g/L in bioreactor experiment. In both
experiments, mcl-PHA were produced. However, while the polymer produced in the shake flask
assays contained HHx, HO and HD monomers (Table 4.5), in the bioreactor experiment only
HO (50.8 mol%) and HD (49.2 mol%) monomers were observed (Table 4.8). This fact could be
explained by the substrate complexity or the incomplete degradation of long-chain fatty acids
responsible for the incorporation of HHx monomer.
In Muhr et al. (2013) study, P. citronellolis produced mcl-PHA from tallow-based
biodiesel using a discontinuous fed-batch mode. The μmáx was 0.10 h-1 (lower than that obtained
with the margarine waste) and the CDW was 30.6 g/L, after 72 h. Furthermore, a final mcl-PHA
content of 27 % (wt/wt) and a volumetric productivity of 0.11 gPHA/L.h were obtained. Despite the
low mcl-PHA content obtained with margarine waste, higher substrate concentration (64.7 g/L)
was used by Muhr et al. (2013). It should be taken in account that in this study, the experiment
was performed in a batch mode, while Muhr et al. (2013) experiment was performed in a
discontinuous fed-batch mode. This fact might explain the differences on volumetric productivity
values. Also, in contrast with this experiment, Muhr et al. (2013) controlled the pH with NH4OH
solution (25%). This strategy may be used to improve cellular growth of P. citronellolis on
margarine waste. Although the carbon sources in this study and in Muhr et al. (2013) study were
mainly fatty acids, a different composition of mcl-PHA was obtained with HHx, 3-
hydroxyheptanoate (HHp), HO, 3-hydroxynonenoate (HN), HD and HHD monomers. These
variations in the composition could be related to the substrates composition in fatty acids, as
described in section 4.2.
4.3.4 – Batch cultivation experiments with P. oleovorans NRRL B-14683
Figure 4.11 shows the cultivation profile for batch bioreactor experiment with P.
oleovorans NRRL B-14683. The lag phase was only 1 h. The maximum specific growth rate was

Results and Discussion
50
0.37 h-1 (Figure 7.4, in section 7.2) (Table 4.6) and a maximum CDW of 3.4 g/L was obtained
within 20 h. P. oleovorans produced PHA, up to a maximum of 8.5% (wt/wt) cell content (Table
4.6). The active biomass and polymer concentration reached 3.4 g/L and 0.3 g/L at the end of
the assay, respectively. Thus, it seems that substrate was consumed preferentially for cell
growth. This result is confirmed by comparing growth (0.21 gx/gs) and storage yields (0.02
gPHA/gs). The global substrate uptake rate was 0.70 gs/L.h. The volumetric and specific
productivities of polymer were 0.02 gPHA/L.h and 0.004 gPHA/gX.h, respectively (Table 4.6).
Figure 4.11 – Batch cultivation profile by P. oleovorans NRRL B-14683 using margarine waste as carbon
source.
Figure 4.12 shows the microscope photographs of P. oleovorans NRRL B-14683 cells
after staining with Nile Blue. In this case, the morphology of the cells basically did not change,
which is in accordance with the lower polymer accumulation (8.5%, wt/wt).
Figure 4.12 – Optical microscopic photographs (100x) of bacterial P. oleovorans NRRL B-14683 cells stained with Nile Blue at the beginning (a) and at the end (b) of the batch bioreactor experiment.
The controlled conditions in the bioreactor have contributed to improve PHA production.
P. oleovorans showed better growth (3.4 g/L of active biomass) and accumulation (8.5%, wt/wt)
(Table 4.6) in the bioreactor experiments than in shake flask experiment (2.1 g/L of active

Results and Discussion
51
biomass and 1.4% (wt/wt) PHA content) (Table 4.5). In both experiments, the polymer was
composed of 70 mol% HO and 30 mol% HD monomers (Tables 4.5 and 4.8).
Compared with PHA synthesis from methylated Jatropha curcas seed oil under batch
fermentation, P. oleovorans reached a lower PHA content (26.1%, wt/wt) (Allen et al., 2010).
However, the organism produced the copolymer poly (3-hydroxybutyrate-co-3-hydroxyvalerate,
P(3HB-co-3HV), instead of the mcl-PHA obtained from the margarine waste. On the other hand,
mcl-PHA accumulation was reported during growth of P. oleovorans in batch culture with
octanoate and nonanoate as carbon sources (Durner et al., 2001). In that study, higher
maximum specific growth rates (0.48 – 0.59 h-1) were observed. On the other hand, the polymer
composition was different: 12 mol% HHx and 88 mol% of HO for growth on octanoate, and 40
mol% HHp and 60 mol% HN for growth on nonanoate. Kim (2002) reported higher mcl-PHA
content (75%, wt/wt), as well as higher cell and polymer concentrations (55 g/L and 41 g/L,
respectively) when P. oleovorans NRRL B-14683 was cultivated in octanoic acid and
ammonium nitrate by a fed-batch culture technique. A polymer productivity of 0.6 gPHA/L.h was
achieved.
The results of the batch bioreactor cultivation represented an improvement of PHA
production over the previous experiments in shake flask, except for C. testosteroni. All bacteria
were able to use margarine waste for both cell growth and PHA synthesis. When compared with
other substrates, like vegetable oils, this carbon source might be a good alternative to produce
PHA, mainly using C. necator. This organism had the highest cell mass and PHA production
and, for this reason, was selected to optimize the cultivation using fed-batch strategies.
4.4 – Fed-Batch experiments
As an attempt to improve C. necator performance for reaching high cell concentration
and PHA accumulation, fed-batch bioreactor cultivations were performed. Two fed-batch
strategies with different types of substrate and nitrogen feeding were implemented. In both
strategies, the initial substrate concentration was 20 g/L. Figures 4.13 – 4.14 and Table 4.7
show the concentration profiles for active biomass, polymer concentration and substrate, and
the kinetic parameters of each fed-batch experiment, respectively. Also, Table 4.7 presents
literature values for the same strain, for comparison. The residual substrate concentration was
analysed with the optimized method developed described in section 4.3.

Results and Discussion
52
Table 4.7 – Comparison of kinetic parameters for cultivation of C. necator DSM 428 in fed-batch bioreactor
experiments using margarine waste as carbon source and using soybean oil, n.a.: data not available.
4.4.1 Fed-Batch bioreactor experiment with pulse feeding based on DO
In the first fed-batch cultivation (Figure 4.13), the margarine waste feeding was
controlled by DO and stirring speed variation. Aiming to attain high cell concentration, the
margarine waste was added to the culture after an increase of DO, followed by a reduction of
the stirring speed was observed, which were indicative that the metabolic activity of the cells
had decreased, probably due to low available carbon source concentration. Hence, fresh
substrate was added at that time. Also, during the first 21 h of cultivation, NH4OH was used for
pH control, serving also as the nitrogen source for cell growth, while afterwards it was replaced
by NaOH. This was intended to result as a nitrogen limitation for improvment of PHA
accumulation at the later stage of the experiment.
Figure 4.13 – Fed-batch bioreactor profile for cultivation of C. necator using margarine waste as carbon
source. Concentration of active biomass (X), polymer (PHA) and substrate are shown. The substrate pulse occurred at 12, 16 and 20 h and the pH control was change by NaOH at 21 h.
Substrate μmáx (h-1)
CDW
(g/L)
X (g/L)
PHA content (%, wt/wt)
PHA (g/L)
rPHA
(gPHA
/L.h)
qPHA
(gPHA/gx.h)
rs
(gs/L.h)
Yx/s
(gx/gs)
YPHA/
s
(gPHA
/gs)
References
Margarine waste
0.14 27.9 6.1 76.8 21.8
0.62 0.101 1.56
0.11
0.40 This work
0.17 57.5 48.4
15.8 9.1 0.22 0.004 2.44
0.48
0.09 This work
Soybean oil
n.a. 126 30.2
76 95.8
1.00 n.a. n.a. n.a. 0.76 Kahar et al.
(2004)

Results and Discussion
53
After a lag phase of less than 5 h, the cells entered the exponential growth phase,
achieving a maximum specific growth rate of 0.14 h-1 (Figure 7.5, in section 7.3) (Table 4.7).
This value is similar to the one obtained in the batch experiment (0.15 h-1) (Table 4.6). The first
carbon source pulse was added after 12 h of cultivation, when a rise on the DO (>31%),
followed by a significant reduction of the stirring speed, was observed. At that point, the active
biomass concentration was only 1.9 g/L, which was lower than that obtained in batch culture at
20 h (4.7 g/L) (Table 4.7 and 4.6, respectively). Two more pulses were added at 16 h and 21 h,
based on DO rise and stirring speed drop (Figure 4.13). It was expected that after the addition
of the carbon source pulses, the DO would decrease and the stirring speed would increase.
However, this behaviour was observed for a very short period of time (a few minutes) and, then,
the DO increased again. The active biomass concentration increased to 4.6 g/L before pH
control shift from NH4OH to NaOH. The cells continued to grow up 30 h (Figure 4.13), indicating
that there was enough nitrogen available for growth during that period of time. A maximum of
8.3 g/L of active biomass concentration was obtained at 30 h of cultivation.
Looking for polymer concentration, only 0.7 g/L were obtained before substrate pulses.
After each addition of margarine waste, this value increased significantly, as shown in Figure
4.13. As expected, when NaOH was used for pH control, the polymer concentration increased
substantially, achieving a maximum polymer concentration of 21.8 g/L at the end of the
experiment (Table 4.7).
After 35 h, 76.8% (wt/wt) of P(3HB) content, 27.9 g/L of CDW and 6.1 g/L of maximum
active biomass concentration were achieved (Table 4.7). The volumetric and specific
productivities were 0.62 gPHA/L.h and 0.101 gPHA/gX.h, respectively. The storage yield was 0.40
gPHA/gs, growth yield was 0.11 gx/gs and the global substrate uptake rate was 1.56 gs/L.h (Table
4.7).
At the end of the cultivation, the results obtained in this experiment showed that this
strategy enhanced both cellular growth and polymer accumulation compared to batch culture
(see section 4.3.1), since more carbon source was supplied to the microorganism. Higher
values of active biomass and PHB were obtained and the volumetric and specific productivities
were also enhanced. Nevertheless, the storage and growth yields were lower (0.40 gPHA/gs and
0.11 gx/gs, respectively) than the yields obtained in the previous experiment (0.50 gPHA/gs and
0.37 gx/gs, respectively) (Table 4.7 and 4.6, respectively). As observed in the batch culture, a
large amount of substrate was not consumed by the culture before the first pulse (Figure 13).
The inhibition by certain fatty acids, the inability to consume some substrate compounds and the
PHA content of cells at beginning of cultivation can explain this fact, as described in section
4.3.1. In this case, the inocula cells contained 51.8% (wt/wt) of PHA and it seems that cells
consumed firstly the polymer and then the substrate. Therefore, substrate was not depleted
when a new pulse of margarine waste was added, resulting in a gradual substrate accumulation
along operation time. This means that larger amounts of substrate were not consumed
compared to the batch culture and also the culture might have a long period of starvation
between pulses, because it only could consume a part of the available substrate.

Results and Discussion
54
On the other hand, a higher global substrate uptake rate was obtained (1.6 gs/L.h) and
higher growth and storage yields would be expected. This result was probably due to the fact
that C. necator diverted the substrate to maintenance or production of other secondary
metabolites (Doran, 1995).
Despite P(3HB) content was similar to that obtained in the literature (76%, wt/wt) (Kahar
et al., 2004; Ng et al., 2010), the overall productivity was lower than reported literature values
for other lipid-rich substrates. Kahar et al. (2004) achieved higher active biomass and polymer
concentration (30.2 g/l and 95.8 g/L, respectively) using soybean oil (Table 4.7). They also
reported a high yield of 0.76 gPHA/gs and volumetric productivity of 1.0 gPHA/L.h (Table 4.7).
Besides the use of a different substrate (soybean oil), the different values could be a result of
the feeding strategy used in that work (addition of soybean oil, ammonium chloride and
magnesium chloride at predetermined time intervals).
As expected, nitrogen limiting conditions, directed C. necator metabolic carbon flux
towards P(3HB) synthesis, leading to high values of P(3HB) content (Ng et al., 2010). To further
improve the bioprocess, it was needed to take into account the feed and pH control strategy and
also time of the inocula preparation.
4.4.2 – Fed-Batch bioreactor experiment with periodic pulse feeding
The second fed-batch strategy was based on supplying the culture with substrate
pulses at a predetermined time (2 h intervals) (Figure 4.14). NH4OH was used for pH control
throughout the entire experiment.
Figure 4.14 – Fed-batch bioreactor profile for cultivation of C. necator using margarine waste as carbon source. Concentration of active biomass (X), polymer (PHA) and substrate are shown. The substrate pulses was manual added every 2 h, after 19 h. The pH was control by NH4OH throughout the entire experiment.
0
5
10
15
20
25
30
35
40
45
50
55
60
0,0
5,0
10,0
15,0
20,0
25,0
30,0
35,0
40,0
45,0
50,0
0 10 20 30 40 50Time (h)

Results and Discussion
55
A lag phase similar to the previous fed-batch experiment was observed (less than 5 h).
The cells achieved a maximum specific growth rate of 0.17 h-1 (Figure 7.6, in section 7.3)(Table
4.7), which was higher than in batch culture (0.15 h-1) and the firs fed-batch (0.14 h-1) (Table 4.6
and 4.7, respectively). At this point, the decrease of the margarine waste concentration was
associated to the increase of cells (from an initial active biomass concentration of 1.5 to 10.3
g/L, within 19 h) (Figure 4.14). After this time, the additional amount of margarine waste was
intermittently added to culture broth and the active biomass concentration increased
significantly, as shown in Figure 4.14.
At the end of this experiment (42 h), 15.8% (wt/wt) of P(3HB) content and 57.5 g/L of
CDW were obtained, corresponding to 9.1 g/L of polymer concentration and 48.4 g/L of active
biomass concentration (Table 4.7). The volumetric productivity was 0.22 gPHA/L.h and the
specific productivity was 0.004 gPHA/gX.h. The storage and growth yields were 0.09 gPHA/gs and
0.48 gx/gs, respectively, and the global substrate uptake rate was 2.44 gs/L.h (Table 4.7).
In this second fed-batch culture, the cellular growth was the highest of all experiments
performed in this study with margarine waste (Table 4.7): CDW (57.5 g/L) and active biomass
concentration (48.4 g/L). This high cell density was a result of the substrate feeding strategy, but
also the maintenance of NH4OH as pH control which ensured enough nitrogen availability for
cell growth throughout the assay. The total amount of substrate added was similar for both fed-
batch experiments (between 443 – 456g). But in the second experiment, adding lower amounts
of substrate within shorter periods of time might have allowed for the culture to have a better
assimilation of margarine waste. Besides that, since the time of inocula was lower (24 h) than in
previous experiments (72 h), which might have contributed to the higher maximum specific
growth rate and higher active biomass concentration observed. However, a significantly lower
P(3HB) content was obtained (15.8%, wt/wt) when compared with the batch (55.8, wt/wt) (Table
4.6) and the first fed-batch (76.8, wt/wt) (Table 4.7) experiments, probably because no nitrogen
limitation was implemented. The strategy applied was not effective to achieve high polymer
accumulation, as shown by the low values of volumetric and specific productivities (0.22
gPHA/L.h and 0.004 gPHA/gX.h, respectively). Nevertheless, the results are in accordance with the
yields obtained, because the growth yield was higher (0.48 gx/gs) than the storage yield (0.09
gPHA/gs). Along the operation time, the substrate was never depleted after a new pulse (Figure
4.14). The margarine waste accumulation was observed, but after 39 h of cultivation, the
substrate consumption increased significantly, corresponding to the high increased of active
biomass concentration. Thus, the growth yield was slightly higher than obtained in batch culture
(0.37 gx/gs). In fact, the growth yield still lower, because culture had not capacity to consume all
the components of the margarine waste, as described in section 4.3.1.
Since a large amount of substrate was available and cellular growth was favoured, the
global substrate uptake rate was higher (2.44 gs/L.h) than in previous experiments (0.51 and
1.56 g/L.h for batch and first fed-batch, respectively). With this higher value it would be
expected again better yields than in batch culture which can be explain by cellular maintenance
or secondary metabolites (see section 4.4.1).

Results and Discussion
56
This fed-batch experiment demonstrated an efficient cellular growth compared with
Kahar and co-workers (2004) study (30.2 g/L of active biomass concentration) (Table 4.7).
However, these differences are related with metabolism of bacteria. Regarding to Kahar and co-
workers (2004), when phosphorus limitation was applied, the substrate was mainly diverted for
PHA production since they obtained a storage yield of 0.76 gPHA/gs (Table 4.7).
These results showed that this strategy was adequate to improve cells growth but not to
accumulate polymer. Further improvement of this process should involve the limitation of an
essential nutrient, such as nitrogen, that could increase PHA accumulation by C. necator.
4.5 – Thermal characterization of polymer
The thermal properties of the polymers obtained in all bioreactor experiments with each
bacterial culture have been determined by Differential Scanning Calorimetry (DSC). The results
are shown in Table 4.8. Due to the low amount of polymer extracted from cultivation with
P.oleovorans NRRL B-14683, it was not possible to analyse this polymer.
Table 4.8 – Thermal properties for the polymers produced by the different bacteria determined by DSC analysis, n.a.: data not available.
The P(3HB) polymers produced by C. necator DSM 428 had a Tm in the range 169.3–
173.4ºC, with ∆H of about 73.1–82.6 J/g (Table 4.8). These values can be regarded as values
typical for this type of PHA. Doi and co-workers (1995) reported a Tm of 177ºC, and ∆H of 97
J/g, while López-Cuellar and co-workers (2011) reported a Tm of 170ºC with ∆H about of 84.7
J/g. Rather differing Tg values were obtained for the polymers produced in the different
experiments (Table 4.8). The polymer produced in the batch experiment had a higher Tg (7.9ºC)
Bacteria Mode Polymer Tg
(ºC) Tm
(ºC) ∆H
(J/g) 𝟀c( %) Reference
C. necator DSM 428
Batch P(3HB) 7.9 173.4 82.6 56.6 This work
Fed-batch P(3HB) 1.1 169.3 71.1 48.7 This work
Fed-batch P(3HB) 0.5 169.9 73.1 50.1 This work
C. testosteroni NRRL B-2611
Batch P(3HB) 0.6 160.2 17.2 11.8 This work
A. caviae Batch P(3HB) 4.0 177.0 97 n.a. Doi et al. (1995)
C. necator DSM 428
Three stages
P(3HB) n.a. 170.0 84.7 n.a. López-
Cuellar et al. (2011)
P. citronellolis NRRL B-2504
Batch mcl-PHA (HO,HD)
-45.6 60.8 1.0 0.7 This work
P. citronellolis NRRL B-2504
Fed-batch
mcl-PHA (HHx, HHp,
HO, HN, HD,
HHD)
-43– -48
48–54
20 10-12 Muhr et al.
(2013)

Results and Discussion
57
compared to that obtained in the fed-batch experiments (0.5–1.1ºC). Nevertheless, the values
obtained in this study are in the range of the values reported in the literature (-4 to 9ºC) for
P(3HB) produced by C. necator (Doi et al., 1995; Laycock et al., 2012) . Based on the melting
enthalpies, the crystallinity of P(3HB) was in the range of 48.7–56.6%. The relatively high
crystallinity indicated that the polymer was a rigid and brittle material with poor impact strength,
limiting its used in some final applications that need a high impact resistance (Laycock et al.,
2012).
C. testosteroni NRRL B-2611 also produced a P(3HB) with similar Tg (0.6ºC) and Tm
(160.2ºC) values, but the ∆H decreased to 17.2 J/g, which led to a lower crystallinity (11.8%).
Differences in crystallization temperature or time (at a specific temperature) and annealing
treatment between samples can affect properties as well as processing conditions, which can
explain the different values for P(3HB) produced by C. testosteroni NRRL B-2611 (Laycock et
al., 2012).
As expected, the thermal properties of the mcl-PHA produced by P. citronellolis NRRL
B-2504 were significantly different. Lower Tg and Tm values, -45.6 and 60.9ºC, respectively,
were obtained (Table 4.8). The polymer also showed a ∆H of 1 J/g, with a crystallinity of 0.7%
(Table 4.8). Contrary to P(3HB), mcl-PHA have decreased brittleness and stiffness, and
increased flexibility, which makes this polymer practically an amorphous material (Laycock et
al., 2012). Similar values were reported for mcl-PHA produced by P. citronellolis, namely, Tg
varying in the range of -43 to -48ºC and Tm of 48 to 54ºC (Muhr et al., 2013). But the crystallinity
was in the range of 10–12% due the higer value of ∆H (about 20 J/g). This might be due to the
effect of microstructure and, in particular, the influence of compositional distribution/blending on
mechanical properties. In this study, only HO and HD monomers were detected in the mcl-PHA
produced by P. citronellolis, while Muhr and co-workers (2013) achieved HHx, HHp, HO, HN,
HD and HHD monomers (Table 4.8). Also the different monomers composition can contribute to
a different crystallization behaviour (Laycock et al., 2012).

58

Conclusion and outlook
59
5 Conclusion and outlook
One of the reasons why PHAs are not yet competitive against petrochemical-based
common polymers is the relatively high production costs of these biopolymers. As a practical
application, the use of renewable feedstock can be considered as a cost-effective way for PHA
production. This current research investigated the potential of fat wastes from margarine
production to produce PHA.
The three fat wastes (margarine and refinery wastes and sludge) presented different
physical and chemical properties. Margarine and refinery wastes are rich sources of FFAs (56-
76%) with a high fatty acid content. These fat wastes possessed a low pH (1.75–4.03) and
water contents (1.11–8.90), a density of about 0.9 g/cm3, as well as the great solubility in
hexane (values). In contrast, the sludge arising from the mixture of several effluents from the
manufacturing plant, showed a high water content (77.92–87.55) and consequently lower fatty
acids content, density and solubility. This waste was characterized by a high heterogeneity.
However, a similar fatty acid profile was determined for all fat wastes, containing high
percentage of oleic (37–54%), linoleic (4–27%), stearic (11–18%) and mystiric (4–14%) acids
and small amounts of other acids (palmitic and linolenic acid).
It was shown that the fat wastes can be used to synthesize both P(3HB) and mcl-PHA
depending on the bacterial strain used. The shake flask experiments demonstrated that C.
necator DSM 428 was able to assimilate all three fat wastes and convert them to P(3HB), but
the margarine waste presented the best results in terms of polymer production (69.4% (wt/wt)
P(3HB) content in the biomass). Several bacterial strains have been screened in shake flask
experiments and C. necator DSM 428, C. testosteroni NRRL B-2611, P. citronellolis NRRL B-
2504 and P. oleovorans NRRL B-14683 showed the best polymer producing performance using
margarine waste. The first two bacteria produced P(3HB), while both Pseudomonas species
were able to produced mcl-PHAs, consisting primarily of HO and HD monomers. Such strains
were selected for batch bioreactor cultivation experiments, in which the highest PHA cell content
was obtained for C. necator DSM 428 (55.8%, wt/wt), achieving a volumetric productivity and
storage yield of 0.33 gPHA/L.h and 0.50 gPHA/gs, respectively. C. testosteroni showed a weaker
performance compared to C. necator, since only 7.2% (wt/wt) PHA content in the biomass was
obtained. Regarding the tested Pseudomonas species, P. citronellolis NRRL B-2504 had the
highest active biomass (8 g/L) and polymer production (0.6 g/L).
Two fed-batch feeding strategies were evaluated, in order to improve both cell growth
and P(3HB) production by C. necator DSM 428, which showed the best performance in the
batch experiments. Pulse feeding based on DO increase and stirring rate drop, resulted in
higher PHA production (21.8 g/L) due to the higher availability in substrate (margarine waste)
supplied to the culture and the nitrogen limiting conditions. On the other hand, the periodic
substrate feeding, concomitant with nitrogen availability, resulted in increased biomass
production (48.4 g/L).

Conclusion and outlook
60
Considering the thermal characterization, the P(3HB) analyzed in this work presented
low Tg and a high melting point and crystallinity (11.8–56.6%), similarly to reported values for
P(3HB) polymers. The mcl-PHA produced by P. citronellolis NRRL B-2504 and P. oleovorans
NRRL B-14683, composed of HO and HD monomers, had -45.6ºC of Tg, 60.8ºC of Tm and 0.7%
of crystallinity.
Future studies have to be carried out to determine the effects of varying the culture
conditions on the rate of accumulation, as well as on the properties of the polyester formed.
When compared with other substrates, such as soybean oil or jatropha oil, margarine waste
demonstrated to be an interesting alternative as carbon source, because similar PHA content
(76%, wt/wt) were obtained from those oils (Kahar et al., 2004; Ng et al., 2010). Nevertheless,
the conditions for bacterial cultivation using this substrate still have to be optimized. Future
experiments on bioreactor scale have to focus not only the increase of intracellular PHA content
but also the high cell density. In this way, the following strategies should be implemented.
As future work, this process can be improved by different strategies, including:
- evaluate the influence of mineral medium composition on the margarine waste carbon
source, soapstock formation and its consumption by bacteria, as well as lipid and fatty
acid profile over time of cultivation. This knowledge is important to understand why the
tested bacteria were not able to consume all the supplied margarine waste as substrate.
- evaluate the ammonium concentration over time to determine the best nitrogen
concentration and avoid early cell growth limitation. A different nitrogen source could be
implemented such as urea, since it was proved as the most suitable nitrogen source for
C. necator, increasing significantly both cell biomass and PHA production (Ng et al.,
2010).
- implement two different feeding strategies in the one fed-batch cultivation. In the first
stage, a margarine waste and NH4OH feeding strategy should be employed during the
active growth phase without any nitrogen limitation, similar to which was used in section
4.4.2. To a high specific growth rate, the concentration of margarine waste in culture
broth could remained at around 20 g/l (Kahar et al., 2004). The cell concentration must
be high at the beginning of PHA accumulation phase. In a second stage, a continuous
carbon source feeding and nitrogen limitation should be introduced to enhance PHA
production, as in second phase of section 4.4.1.
- implement a fed-batch cultivation for C. testosteroni NRRL B-2611, P. citronellolis
NRRL B-2504 and P. oleovorans NRRL B-14683 with focus on high cell density and
high intracellular PHA content.
- implement a continuous culture strategy to achieve high productivity seems to be a
good alternative (Atlić et al., 2011). Although the high complexity of the technical set-up
and a higher risk for microbial contamination, this strategy could be used for a broad
range of potential applications of the products, due to the flexibility of the system by
triggering the polymer composition by co-substrate additions in each vessel.
- biopolymer characterization in terms of average molecular weight and polydisperisty.

References
61
6 References
Akaraonye, E., Keshavarz, T., Roy, I. (2010). Production of polyhydroxyalkanoates: the
future green materials of choice. Journal of Chemical Technology & Biotechnology, 85 (6), 732–743.
Akiyama, M., Tsuge, T., Doi, Y. (2003). Environmental life cycle comparison of polyhydroxyalkanoates produced from renewable carbon resources by bacterial fermentation. Polymer Degradation and Stability, 80 (1), 183–194.
Allen, A. D., Anderson, W. A., Ayorinde, F. O., Eribo, B. E. (2010). Biosynthesis and characterization of copolymer poly(3HB-co-3HV) from saponified Jatropha curcas oil by Pseudomonas oleovorans. Journal of Industrial Microbiology & Biotechnology, 37 (8), 849–856.
Ashby, R. D., Foglia, T. A. (1998). Poly(hydroxyalkanoate) biosynthesis from triglyceride substrates. Applied Microbiology and Biotechnology, 49 (4), 431–437.
Ashby, R. D., Solaiman, D. K. Y., Foglia, T. A. (2004). Bacterial poly (hydroxyalkanoate) polymer production from the biodiesel co-product stream. Journal of Polymers and the Environment, 12 (3), 105–112.
Atlić, A., Koller, M., Scherzer, D., Kutschera, C., Grillo-Fernandes, E., Horvat, P., Chiellini, E., Braunegg, G. (2011). Continuous production of poly([R]-3-hydroxybutyrate) by Cupriavidus necator in a multistage bioreactor cascade. Applied Microbiology and Biotechnology, 91 (2), 295–304.
Barham, P. J., Keller, A., Otun, E. L., Holmes, P. A. (1984). Crystallization and morphology of a bacterial thermoplastic : poly-3-hyd roxybutyrate. Journal of Materials Science, 19, 2781–2794.
Berger, E., Ramsay, B. A., Ramsay, J. A., Chavarie, C. (1989). PHB recovery by hypochlorite digestion of non-PHB biomass. Biotechnology Techniques, 3 (4), 227–232.
Bhubalan, K., Lee, W., Loo, C., Yamamoto, T., Tsuge, T., Doi, Y., Sudesh, K. (2008). Controlled biosynthesis and characterization of poly(3-hydroxybutyrate-co-3-hydroxyvalerate-co-3-hydroxyhexanoate) from mixtures of palm kernel oil and 3HV-precursors. Polymer Degradation and Stability, 93 (1), 17–23.
Bourbonnais, R., Marchessault, R. H. (2010). Application of polyhydroxyalkanoate granules for sizing of paper. Biomacromolecules, 11 (4), 989–993.
Braunegg, G., Sonnleimer, B., Lafferty, R. M. (1978). A rapid gas chromatographic method for the determination of poly-β hydroxybutyric acid in microbial biomass. Applied Microbiology and Biotechnology, 6 (1), 29–37.
Budde, C. F., Riedel, S. L., Hübner, F., Risch, S., Popović, M. K., Rha, C., Sinskey, A. J. (2011a). Growth and polyhydroxybutyrate production by Ralstonia eutropha in emulsified plant oil medium. Applied Microbiology and Biotechnology, 89 (5), 1611–1619.
Budde, C. F., Riedel, S. L., Willis, L. B., Rha, C., Sinskey, A. J. (2011b). Production of poly(3-hydroxybutyrate-co-3-hydroxyhexanoate) from plant oil by engineered Ralstonia eutropha strains. Applied and Environmental Microbiology, 77 (9), 2847–2854.
Caballerot, K. P., Karel, S. F., Register, R. A. (1995). Biosynthesis and characterization of hydroxybutyrate-hydroxycaproate copolymers. International Journal of Biological Macromolecules, 17 (2), 86–92.
Cammarota, M. C., Freire, D. M. G. (2006). A review on hydrolytic enzymes in the treatment of wastewater with high oil and grease content. Bioresource Technology, 97 (17), 2195–2210.
Castilho, L. R., Mitchell, D. A., Freire, D. M. G. (2009). Production of polyhydroxyalkanoates (PHAs) from waste materials and by-products by submerged and solid-state fermentation. Bioresource Technology, 100 (23), 5996–6009.
Chakraborty, P., Muthukumarappan, K., Gibbons, W. R. (2012). PHA productivity and yield of Ralstonia eutropha when intermittently or continuously fed a mixture of short chain fatty acids. Journal of Biomedicine & Biotechnology, 2012, 1–8.
Chee, J., Yoga, S., Lau, N., Ling, S., Abed, R. M. M. (2010). Bacterially produced polyhydroxyalkanoate (PHA): converting renewable resources into bioplastics. Technology and Education Topics in Applied Microbiology and Microbial Biotechnology, 1395–1404.
Chee, J.-Y., Tan, Y., Samian, M.-R., Sudesh, K. (2010). Isolation and characterization of a Burkholderia sp. USM (JCM15050) capable of producing polyhydroxyalkanoate (PHA) from

References
62
triglycerides, Fatty Acids and Glycerols. Journal of Polymers and the Environment, 18 (4), 584–592.
Chen, G. (2009). A microbial polyhydroxyalkanoates (PHA) based bio- and materials industry. Chemical Society Reviews, 38 (8), 2434–2446.
Chen, Y., Chen, J., Yu, C., Du, G., Lun, S. (1999). Recovery of poly-3-hydroxybutyrate from Alcaligenes eutrophus by surfactant–chelate aqueous system. Process Biochemistry, 34 (2), 153–157.
Choi, J., Lee, S. Y. (1997). Process analysis and economic evaluation for Poly (3-hydroxybutyrate) production by fermentation. Bioprocess Engineering, 17 (6), 335–342.
Choi, J., Lee, S. Y. (1999). Factors affecting the economics of polyhydroxyalkanoate production by bacterial fermentation. Applied Microbiology and Biotechnology, 51 (1), 13–21.
Cromwick, A. M., Foglia, T., Lenz, R. W. (1996). The microbial production of poly(hydroxyalkanoates) from tallow. Applied Microbiology and Biotechnology, 46 (5-6), 464–469.
Doi, Y., Kitamura, S., Abe, H. (1995). Microbial synthesis and characterization of Poly (3-hydroxybutyrate-co-3-hydroxyhexanoate). Macromolecules, 28 (14), 4822–4828.
Doran, P. M. (1995). Bioprocess Engineering Principles. Academic Press, San Diego, 1–455
Du, C., Sabirova, J., Soetaert, W., Lin, S. K. C. (2012). Polyhydroxyalkanoates production from low-cost sustainable raw materials. Current Chemical Biology, 6 (1), 14–25.
Durner, R., Zinn, M., Witholt, B., & Egli, T. (2001). Accumulation of poly[(R)-3-hydroxyalkanoates] in Pseudomonas oleovorans during growth in batch and chemostat culture with different carbon sources. Biotechnology and Bioengineering, 72 (3), 278–288.
Fiorese, M. L., Freitas, F., Pais, J., Ramos, A. M., de Aragão, G. M. F., & Reis, M. A. M. (2009). Recovery of polyhydroxybutyrate (PHB) from Cupriavidus necator biomass by solvent extraction with 1,2-propylene carbonate. Engineering in Life Sciences, 9 (6), 454–461.
Fukui, T., Doi, Y. (1998). Efficient production of polyhydroxyalkanoates from plant oils by Alcaligenes eutrophus and its recombinant strain. Applied Microbiology and Biotechnology, 49 (3), 333–336.
Gironi, F., Piemonte, V. (2011). Bioplastics and petroleum-based blastics: strengths and weaknesses. Energy Sources, Part A: Recovery, Utilization, and Environmental Effects, 33 (21), 1949–1959.
Gomez, J., Méndez, B. S., Nikel, P. I., Pettinari, M. J., Prieto, M. A., Silva, L. F. (2012). Making green polymers even greener: towards sustainable production of polyhydroxyalkanoates from agroindustrial by-products. Advances in Applied Biotechnology , 41–62.
Hassan, M. A., Yee, L., Yee, P. L., Ariffin, H., Raha, A. R., Shirai, Y., Sudesh, K. (2012). Sustainable production of polyhydroxyalkanoates from renewable oil-palm biomass. Biomass and Bioenergy, 50, 1–9.
He, W., Tian, W., Zhang, G., Guo-Qiang, C., Zhang, Z. (1998). Production of novel polyhydroxyalkanoates by Pseudomonas stutzeri 1317 from glucose and soybean oil. Microbiology Letters, 169 (1), 45–49.
Hee, P. Van, Elumbaring, A. C. M. R., Lans, R. G. J. M. Van Der, Wielen, L. A. M. Van Der. (2006). Selective recovery of polyhydroxyalkanoate inclusion bodies from fermentation broth by dissolved-air flotation. Journal of Colloid and Interface Science, 297, 595–606.
Hejazi, P., Vasheghani-Farahani, E., Yamini, Y. (2003). Supercritical fluid disruption of Ralstonia eutropha for poly(beta-hydroxybutyrate) recovery. Biotechnology Progress, 19 (5), 1519–1523.
Höfer, P., Vermette, P., Groleau, D. (2011). Production and characterization of polyhydroxyalkanoates by recombinant Methylobacterium extorquens: combining desirable thermal properties with functionality. Biochemical Engineering Journal, 54 (1), 26–33.
Huisman, G. W., Leeuw, O., Eggink, G., Witholt, B. (1989). Synthesis of poly-3-hydroxyalkanoates is a common feature of fluorescent pseudomonads. Applied and Environmental Microbiology, 55 (8), 1949–1954.
Jacquel, N., Lo, C., Wei, Y., Wu, H., Wang, S. S. (2008). Isolation and purification of bacterial poly(3-hydroxyalkanoates). Biochemical Engineering Journal, 39 (1), 15–27.
Johnson, L. A., Lusas, E. W. (1983). Comparison of alternative solvents for oils extraction. Journal of the American Oil Chemists’ Society, 60 (2), 229–242.
Kahar, P., Tsuge, T., Taguchi, K., Doi, Y. (2004). High yield production of polyhydroxyalkanoates from soybean oil by Ralstonia eutropha and its recombinant strain. Polymer Degradation and Stability, 83 (1), 79–86.

References
63
Kamilah, H., Tsuge, T., Yang, T. A., Sudesh, K. (2013). Waste cooking oil as substrate for biosynthesis of poly(3-hydroxybutyrate) and poly(3-hydroxybutyrate-co-3-hydroxyhexanoate): turning waste into a value-added product. Malaysian Journal of Microbiology, 9 (1), 51–59.
Kapritchkoff, F. M., Viotti, A. P., Alli, R. C., Zuccolo, M., Pradella, J. G., Maiorano, A. E., Miranda, E.A., Bonomi, A.Bonomi, A. (2006). Enzymatic recovery and purification of polyhydroxybutyrate produced by Ralstonia eutropha. Journal of Biotechnology, 122 (4), 453–462.
Karasulu, H. Y., Karasulu, E., Büyükhelvacıgil, M., Yıldız, M., Ertugrul, A., Büyükhelvacıgil, K., Zeliha, U., Gazel, N. (2011). Soybean oil: production process , benefits and uses in pharmaceutical dosage form. InTech, 13, 283–310.
Khanna, S., Srivastava, A. K. (2005). Recent advances in microbial polyhydroxyalkanoates. Process Biochemistry, 40 (2), 607–619.
Kim, B. S. (2002). Production of medium chain length polyhydroxyalkanoates by fed-batch culture of Pseudomonas oleovorans. Biotechnology Letters, 24 (2), 125–130.
Kim, B. S. (2000). Production of poly (3-hydroxybutyrate) from inexpensive substrates. Enzyme and Microbial Technology, 27 (10), 774–777.
Kocer, H., Borcakli, M., Demirel, S. (2003). Production of bacterial polyesters from some various new substrates by Alcaligenes eutrophus and Pseudomonas oleovorans. Turkish Journal of Chemistry, 27, 365–373.
Koller, M., Salerno, A., Dias, M., Reiterer, A., Braunegg, G. (2010). Modern biotechnological polymer synthesis: a review. Food Technology and Biotechnology, 48 (3), 255–269.
Kosior, E., Bragança, R., Fowler, P. (2006). Lightweight compostable packaging: literature review. The Waste & Resource Action Program, INN003/26, 1–48.
Lageveen, R. G., Huisman, G. W., Preusting, H., Ketelaar, P., Eggink, G., Witholt, B. (1988). Formation of polyesters by Pseudomonas oleovorans: effect of substrates on formation and composition of poly-(R)-3-hydroxyalkanoates and poly-(R)-3-hydroxyalkenoates. Applied and Environmental Microbiology, 54 (12), 2924–2932.
Laycock, B., Halley, P., Pratt, S., Werker, A., Lant, P. (2012). The chemomechanical properties of microbial polyhydroxyalkanoates. Progress in Polymer Science, 38 (3-4), 536–583.
Lee, K. M., Chang, H. N., Chang, Y. K., Kim, B. S., Hahn, S. K. (1993). The lysis of gram-negative A. eutrophus and A. latus by palmitoyl carnitine. Biotechnology Techniques, 7 (4), 295–300.
Lee, S. Y. (1996a). Rewiew bacterial polyhydroxyalkanoates. Biotechnology and Bioengineering, 49 (1), 1–14.
Lee, S. Y. (1996b). Plastic bacteria? Progress and prospects for polyhydroxyalkanoate production in bacteria. Trends in Biotechnology, 14 (11), 431–438.
Lee, S. Y., Choi, J. (1998). Effect of fermentation performance on the economics of poly (3-hydroxybutyrate) production by Alcaligenes latus. Polymer Degradation and Stability, 59 (1), 387–393.
Lee, W.-H., Loo, C.-Y., Nomura, C. T., Sudesh, K. (2008). Biosynthesis of polyhydroxyalkanoate copolymers from mixtures of plant oils and 3-hydroxyvalerate precursors. Bioresource technology, 99 (15), 6844–6851.
Lepri, F. G., Chaves, E. S., Vieira, M. A., Ribeiro, A. S., Curtius, A. J., Oliveira, L. C. C., Campos, R. C. (2011). Determination of trace elements in vegetable oils and biodiesel by atomic spectrometric techniques — a review. Taylor & Francis, 46 (3), 175–206.
López-Cuellar, M. R., Alba-Flores, J., Rodríguez, J. N. G., Pérez-Guevara, F. (2011). Production of polyhydroxyalkanoates (PHAs) with canola oil as carbon source. International Journal of Biological Macromolecules, 48 (1), 74–80.
Muhr, A., Rechberger, E. M., Salerno, A., Reiterer, A., Schiller, M., Kwiecień, M., Adamus, G., Kowalczuk, M., Strohmeier, K., Schober, S., Mittelbach, M., Koller, M. (2013). Biodegradable latexes from animal-derived waste: biosynthesis and characterization of mcl-PHA accumulated by Ps. citronellolis. Reactive and Functional Polymers, 73 (10), 1391–1398.
Ng, K.-S., Ooi, W.-Y., Goh, L.-K., Shenbagarathai, R., Sudesh, K. (2010). Evaluation of jatropha oil to produce poly(3-hydroxybutyrate) by Cupriavidus necator H16. Polymer Degradation and Stability, 95 (8), 1365–1369.
Ojumo, T. V., Yu, J., Solomon, B. O. (2004). Production of polyhydroxyalkanoates, a bacterial biodegradable polymer. African Journal of Biotechnology, 3, 18–24.

References
64
Paasimaa, S. (2005). Factors affecting water solubility in oils. Vaisala News, 169, 24–25.
Park, D. H., Kim, B. S. (2011). Production of poly(3-hydroxybutyrate) and poly(3-hydroxybutyrate-co-4-hydroxybutyrate) by Ralstonia eutropha from soybean oil. New Biotechnology, 28 (6), 719–24.
Ramsay, J. A., Berger, E., Ramsay, B. A., Chavarie, C. (1990). Recovery of poly-3-hydroxyalkanoic acid granules by surfactant-hypochlorite treatment. Biotechnology Techniques, 4 (4), 221–226.
Ramsay, J. A., Berger, E., Voyer, R., Chavarie, C., Ramsay, B. A. (1994). Extraction of poly-3-hydroxybutyrate using chloronated solvents. Biotechnology Techniques, 8 (8), 589–594.
Rao, U., Sridhar, R., Sehgal, P. K. (2010). Biosynthesis and biocompatibility of poly(3-hydroxybutyrate-co-4-hydroxybutyrate) produced by Cupriavidus necator from spent palm oil. Biochemical Engineering Journal, 49 (1), 13–20.
Reda, S. Y., Carneiro, P. I. B. (2007). Óleos e gorduras: aplicações e implicações. Revista Analytica, 27, 60–67.
Reddy, C. S. K., Ghai, R., Rashmi, Kalia, V. C. (2003). Polyhydroxyalkanoates: an overview. Bioresource Technology, 87 (2), 137–146.
Riedel, S. L., Bader, J., Brigham, C. J., Budde, C. F., Yusof, Z. A. M., Rha, C., Sinskey, A. J. (2012). Production of poly(3-hydroxybutyrate-co-3-hydroxyhexanoate) by Ralstonia eutropha in high cell density palm oil fermentations. Biotechnology and Bioengineering, 109 (1), 74–83.
Sivarao, S., Kumar, N., Widodo, W. S., Sihombing, H. (2012). Hexane economization in palm kernel oil plant: a study after process design improvement. Global and Engineers & Technologists Rewiew, 2 (12), 7–14.
Steinbuchel, A. (2001). Perspectives for biotechnological broduction and utilization of biopolymers: metabolic engineering of polyhydroxyalkanoate biosynthesis pathways as a successful example. Macromolecular Bioscience, 1 (1), 1–24.
Strayer, D., Belcher, M., Dawson, T., Delaney, B., Fine, J., Flickinger, B., Friedman, P., Heckel, C., Hughes, J., Kincs, F., Liu, L., McBrayer, T., McCaskill, D., McNeill, G., Nugent, M., Paladini, E., Rosegrant, P., Tiffany, T., Wainwright, B., Wilken, J. (2006). Food fats and oils. American Oil Chemists’ Society, 222, 335–356.
Sudesh, K., Abe, H., Doi, Y. (2000). Synthesis, structure and properties of polyhydroxyalkanoates: biological polyesters. Progress in Polymer Science, 25 (10), 1503–1555.
Sudesh, K., Bhubalan, K., Chuah, J., Kek, Y., Kamilah, H., Sridewi, N., Lee, Y. (2011). Synthesis of polyhydroxyalkanoate from palm oil and some new applications. Applied Microbiology and Biotechnology, 89 (5), 1373–1386.
Sun, Z., Ramsay, J. A., Guay, M., Ramsay, B. A. (2007). Fermentation process development for the production of medium-chain-length poly-3-hyroxyalkanoates. Applied Microbiology and Biotechnology, 75, 475–485.
Tamer, I. M., Moo-Young, M. (1998). Disruption of Alcaligenes latus for recovery of poly (β-hydroxybutyric acid ): comparison of high-pressure homogenization, bead milling, and chemically induced lysis. Industrial & Engineering Chemistry Research, 37 (5), 1807–1814.
Tamilvanan, S. (2004). Progress in lipid research oil-in-water lipid emulsions : implications for parenteral and ocular delivering systems. Progress in Lipid Research, 43 (6), 489–533.
Tan, I. K. P., Sudesh, K., Theanmalar, M., Gan, S. N., Gordon III, B. (1997). Saponified palm kernel oil and its major free fatty acids as carbon substrates for the production of polyhydroxyalkanoates in Pseudomonas putida PGA1. Applied Microbiology and Biotechnology, 47 (3), 207–211.
Taniguchi, I., Kagotani, K., Kimura, Y. (2003). Microbial production of poly(hydroxyalkanoate)s from waste edible oils. The Royal Society of Chemistry, 5, 545–548.
Thakor, N., Trivedi, U., Patel, K. C. (2005). Biosynthesis of medium chain length poly(3-hydroxyalkanoates) (mcl-PHAs) by Comamonas testosteroni during cultivation on vegetable oils. Bioresource Technology, 96 (17), 1843–1850.
Valappil, S., Misra, S. K., Boccaccini, A. R., Roy, I. (2006). Biomedical applications of polyhydroxyalkanoates, an overview of animal testing and invivo responses. Expert Review of Medical Devices, 3 (6), 853–868

References
65
Verlinden, R. A., Hill, D. J., Kenward, M. A., Williams, C. D., Piotrowska-Seget, Z., Radecka, I. K. (2011). Production of polyhydroxyalkanoates from waste frying oil by Cupriavidus necator. AMB Express, 1 (1), 1–8.
Yu, J., Chen, L. X. L. (2006). Cost-effective recovery and purification of polyhydroxyalkanoates by selective dissolution of cell mass. Biotechnology Progress, 22 (2), 547–553.
Zambiazi, R. C., Przybylski, R., Zambiazi, M. W., Mendonça, C. B. (2007). Fatty acid composition of vegetable oils and fats. B. CEPPA, 25 (1), 111–120.
Zinn, M., Weilenmann, H., Hany, R., Schmid, M., Egli, T. (2003). Tailored synthesis of poly ([R]-3-hydroxybutyrate-co-3-hydroxyvalerate) (PHB/HV) in Ralstonia eutropha DSM 428. Acta Biotechnologica, 23 (2-3), 309–316.

66

Appendix
67
7. Appendix
7.1 Fat wastes characterization
Table 7.1 – Calibration solutions using in lipid profile analysis. Each component concentration is expressed in μg/mL.
7.2 – Batch bioreactor cultivation experiments
Figure 7.1 – Maximum specific growth rate determination for C. necator DSM 428 in batch cultivation using margarine waste as carbon source.
y = 0,148x - 0,8812R² = 0,9446
-1,0
-0,5
0,0
0,5
1,0
1,5
2,0
2,5
0 5 10 15 20
Ln (
X)
Time (h)
Standard solution
Butanetriol
1.3-Dilolein
Glicerol Mono olein
Tricaprin Triolein
1 80 50 5 250 800 50
2 80 200 20 600 800 150
3 80 350 35 950 800 300
4 80 500 50 1250 800 400

Appendix
68
Figure 7.2 – Maximum specific growth rate determination for C. testosteroni NRRL B-2611 in batch
cultivation using margarine waste as carbon source.
Figure 7.3 – Maximum specific growth rate determination for P. citronellolis NRRL B-2504 in batch
cultivation using margarine waste as carbon source.
y = 0,4015x - 2,7875R² = 0,9942
-1,0
-0,5
0,0
0,5
1,0
1,5
2,0
2,5
3,0
0 5 10 15 20
Ln (
X)
Time (h)
y = 0,3912x - 0,3209R² = 0,8972
-0,5
0,0
0,5
1,0
1,5
2,0
2,5
3,0
0 5 10 15 20
Ln (
X)
Time (h)

Appendix
69
Figure 7.4 – Maximum specific growth rate determination for P. oleovorans NRRL B-14683 in batch
cultivation using margarine waste as carbon source.
7.3 – Fed-batch bioreactor cultivation experiments
Figure 7.5 – Maximum specific growth rate determination for C. necator DSM 428 in first fed-batch cultivation using margarine waste as carbon source.
y = 0,3701x - 2,7205R² = 0,9289
-3,0
-2,5
-2,0
-1,5
-1,0
-0,5
0,0
0,5
1,0
1,5
2,0
0 5 10 15 20 25
Ln (
X)
Time (h)
y = 0,143x - 0,8369R² = 0,9621
-1,0
-0,5
0,0
0,5
1,0
1,5
2,0
2,5
0 10 20 30 40
Ln (
X)
Time (h)

Appendix
70
Figure 7.6 – Maximum specific growth rate determination for C. necator DSM 428 in second fed-batch cultivation using margarine waste as carbon source.
y = 0,167x - 0,7607R² = 0,9664
-2,0
-1,0
0,0
1,0
2,0
3,0
4,0
5,0
0 10 20 30 40 50
Ln (
X)
Time (h)


