
P R O D U C T D ATA
Hand‐held Analyzer Types 2250‐W and 2270‐W for Vibration Measurementsusing FFT Analysis Software BZ‐7230 and Enhanced Vibration and Low Frequency Option BZ‐7234
Types 2250‐W and 2270‐W are the easy, safe and cleverapproach to machinery noise and vibration assessment,diagnostics and quality control. The analyzers combine advancedanalysis techniques, tap‐and‐drag operation and a wide dynamicrange to become the perfect on‐location machine vibration tool.
Acceleration, velocity, and displacement are parameterstraditionally used to assess a machine's health when initiallyinstalled or after maintenance, repair or overhaul (MRO). TheCrest Factor is used to detect and diagnose defects in rollerelement bearings.
Frequency analysis based on the fast Fourier transform (FFT)algorithm is an advanced tool for measurement and diagnosticsof machinery noise and vibration. The frequency “profile” of amachine is its fingerprint, revealing its sources of noise andvibration and their paths to the measurement position.
Uses and Features
Uses• Machinery troubleshooting• Product development• Quality control and inspection• Maintenance, repair and overhaul (MRO)• Single‐channel FFT analysis of sound or vibration
Features• Wide dynamic range• PC software for analysis, reporting and archiving included • User‐defined metadata to aid documentation
Enhanced Vibration• Time domain integration to velocity and displacement• RMS and true peak in acceleration, velocity and displacement• Peak‐to‐peak in displacement• Optional 1/3‐octave spectra in acceleration or velocity• Crest factor with 1 kHz high‐pass filter
FFT Spectra• Up to 6400 lines of analysis• Spans from 100 Hz to 20 kHz in a traditional 1‐2‐5 sequence• Improved frequency resolution: down to 16 mHz, broadband
or zoom
• Dual‐overlay spectrum display• Compare spectrum to reference spectrum• Max. hold spectrum• Capture transient events with signal level triggers, including
pre‐trigger
Measurements• Transducer database• CCLD input for accelerometers• Relate noise or vibration to rotational speed with simultaneous
tachometer• Measurements in SI (metric) and UK/US units• Unit scaling (RMS, Pwr, PSD, ESD, Peak, P‐P)
Quality Control• Tolerance windows with check against preset limits• Quality Check template for quick and clear results• TTL output for control of external devices
Signal Recording (optional)• Record input signal, one channel for Types 2250‐W and two
channels with Type 2270‐W, for later playback or analysis, 16‐or 24‐bit

Types 2250-W and 2270-W
Hand‐held Analyzer Types 2250‐W and 2270‐W are both innovative, 4th generation analyzers fromBrüel & Kjær with an award‐winning design based on extensive research amongst sound and vibrationtechnicians, engineers and consultants from around the world.
Type 2270‐W, with its dual‐channel measurement capability, and the single‐channel Type 2250‐W, canhost many of the same measurement application modules.
Two such modules are FFT Analysis Software BZ‐7230 and Enhanced Vibration and Low Frequency OptionBZ‐7234. FFT Analysis Software is a single‐channel application that can be used one channel at a time onType 2270‐W. Enhanced Vibration and Low Frequency Option BZ‐7234 allows single‐channelmeasurements on Type 2250‐W and dual‐channel measurements on Type 2270‐W. The measurementprocedures and functionality are the same regardless of the analyzer.
See Ordering Information on page 16 for all available application modules.
Fig. 1 Optional accessory KE‐0459, is a shoulder bag for storage and transport
Once you have taken your measurements, you need to dosomething with them. Your hand‐held analyzer offers threestorage options: internal disk, secure device (SD) memory cardsor USB stick. From there, the included USB or LAN cable makesdata transfer to an archive on your PC, or network location, easy.Alternatively, if you have used a memory card, just insert it intothe computer’s card reader.
Enhanced Vibration and Low Frequency Option BZ-7234
Fig. 2 Enhanced vibration allows velocity and displacement measurement
Vibration is often measured in units of velocity (in/s or mm/s) ordisplacement (Mil and mm). This is especially common in themaintenance, repair and overhaul (MRO) of valuable machines such asgas turbines and compressors.
Enhanced Vibration and Low Frequency Option BZ‐7234 transforms theacceleration, measured by an accelerometer, to velocity anddisplacement. BZ‐7234 uses time domain filters so that the actual peakvalues can be measured in acceleration, velocity and displacement andpeak‐to‐peak values in displacement. Peak, peak‐to‐peak and RMSvalues are used to assess a machine’s health, for example the ISO 10816series of standards. It is also common to measure velocity anddisplacement in a limited frequency range. Enhanced Vibration and LowFrequency Option BZ‐7234 also includes band‐limiting filters, also in thetime domain.
FFT Analysis Software BZ-7230
The fast Fourier transformation (FFT) is a digital signal processing technique that converts a time recordinto a narrow‐band constant bandwidth filtered spectrum. The measurement is defined by specifying afrequency span and a number of lines (or filters). A zoom facility allows you to focus on any part of thefrequency range by specifying the centre frequency for the analysis span. FFT Analysis Software BZ‐7230allows resolutions down to 1/64 Hz, when you use a 100 Hz frequency span and 6400 lines of analysis.
2
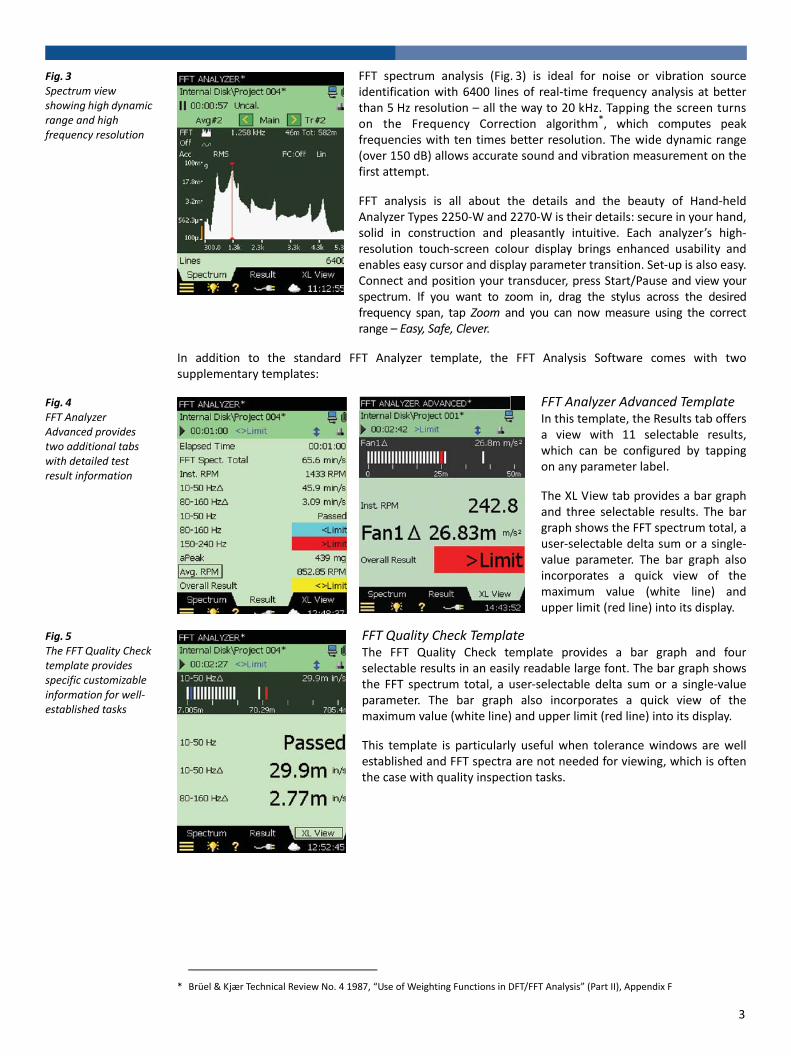
Fig. 3 Spectrum view showing high dynamic range and high frequency resolution
FFT spectrum analysis (Fig. 3) is ideal for noise or vibration sourceidentification with 6400 lines of real‐time frequency analysis at betterthan 5 Hz resolution – all the way to 20 kHz. Tapping the screen turnson the Frequency Correction algorithm*, which computes peakfrequencies with ten times better resolution. The wide dynamic range(over 150 dB) allows accurate sound and vibration measurement on thefirst attempt.
FFT analysis is all about the details and the beauty of Hand‐heldAnalyzer Types 2250‐W and 2270‐W is their details: secure in your hand,solid in construction and pleasantly intuitive. Each analyzer’s high‐resolution touch‐screen colour display brings enhanced usability andenables easy cursor and display parameter transition. Set‐up is also easy.Connect and position your transducer, press Start/Pause and view yourspectrum. If you want to zoom in, drag the stylus across the desiredfrequency span, tap Zoom and you can now measure using the correctrange – Easy, Safe, Clever.
In addition to the standard FFT Analyzer template, the FFT Analysis Software comes with twosupplementary templates:
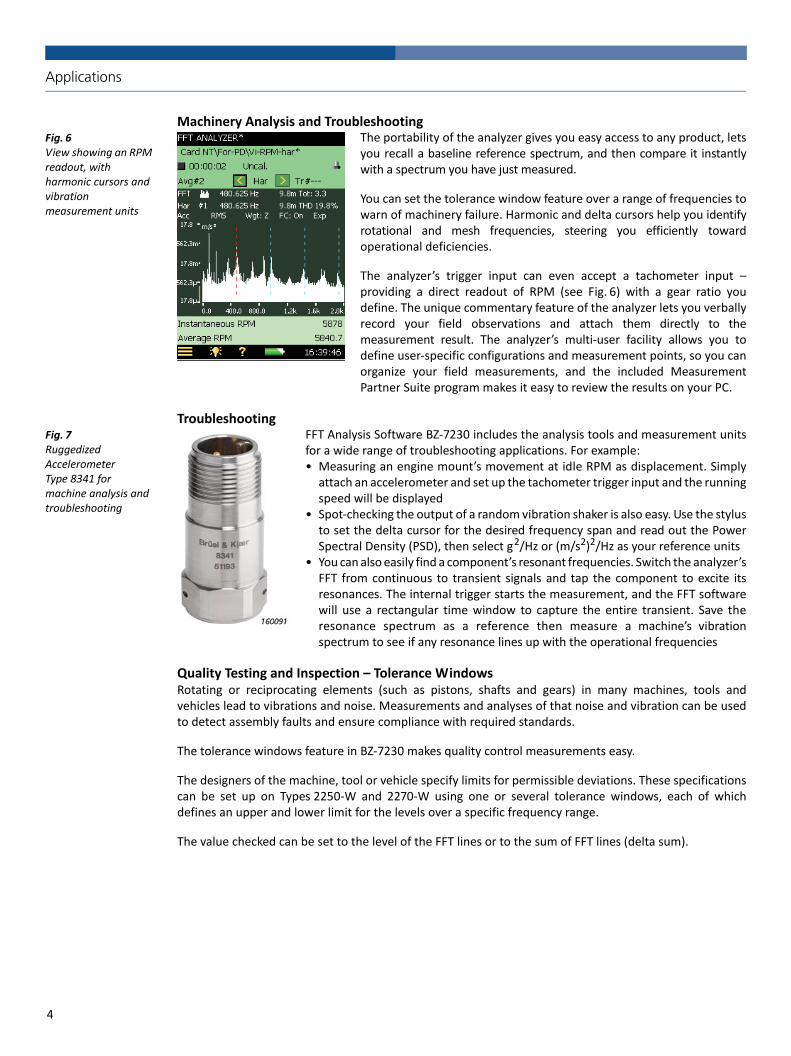
Fig. 4 FFT Analyzer Advanced provides two additional tabs with detailed test result information
FFT Analyzer Advanced TemplateIn this template, the Results tab offersa view with 11 selectable results,which can be configured by tappingon any parameter label.
The XL View tab provides a bar graphand three selectable results. The bargraph shows the FFT spectrum total, auser‐selectable delta sum or a single‐value parameter. The bar graph alsoincorporates a quick view of themaximum value (white line) andupper limit (red line) into its display.
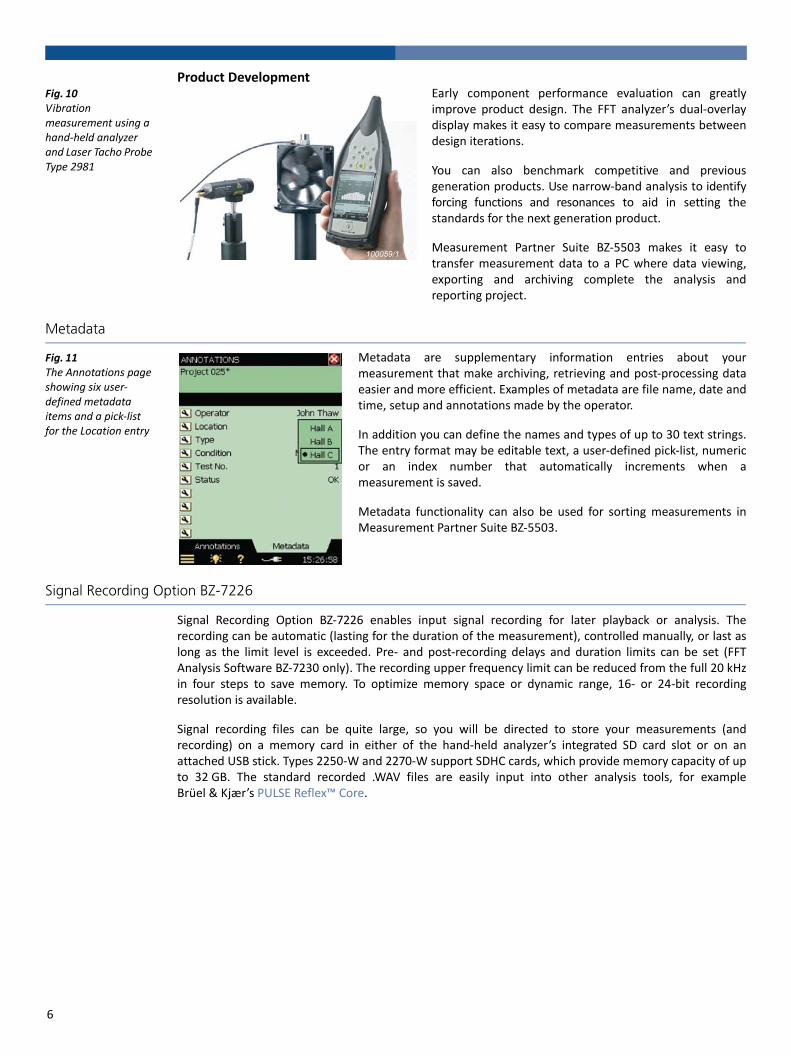
Fig. 5 The FFT Quality Check template provides specific customizable information for well‐established tasks
FFT Quality Check TemplateThe FFT Quality Check template provides a bar graph and fourselectable results in an easily readable large font. The bar graph showsthe FFT spectrum total, a user‐selectable delta sum or a single‐valueparameter. The bar graph also incorporates a quick view of themaximum value (white line) and upper limit (red line) into its display.
This template is particularly useful when tolerance windows are wellestablished and FFT spectra are not needed for viewing, which is oftenthe case with quality inspection tasks.
* Brüel & Kjær Technical Review No. 4 1987, “Use of Weighting Functions in DFT/FFT Analysis” (Part II), Appendix F
3
Applications
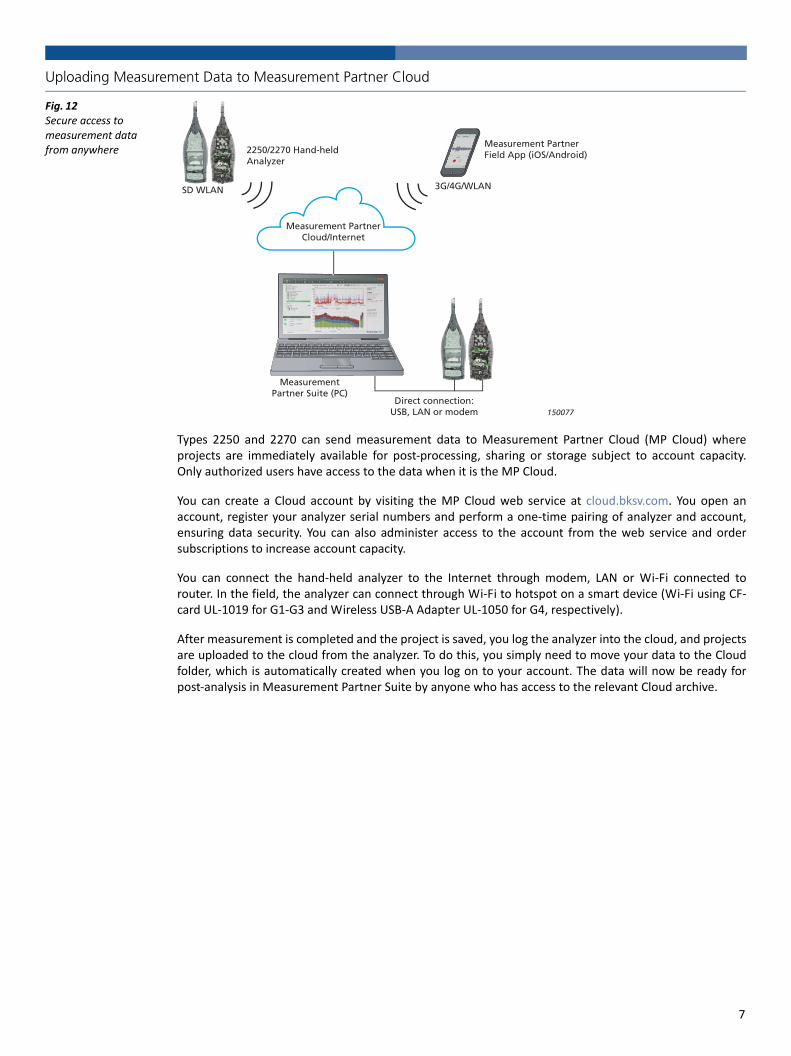
Machinery Analysis and TroubleshootingFig. 6 View showing an RPM readout, with harmonic cursors and vibration measurement units
The portability of the analyzer gives you easy access to any product, letsyou recall a baseline reference spectrum, and then compare it instantlywith a spectrum you have just measured.
You can set the tolerance window feature over a range of frequencies towarn of machinery failure. Harmonic and delta cursors help you identifyrotational and mesh frequencies, steering you efficiently towardoperational deficiencies.
The analyzer’s trigger input can even accept a tachometer input –providing a direct readout of RPM (see Fig. 6) with a gear ratio youdefine. The unique commentary feature of the analyzer lets you verballyrecord your field observations and attach them directly to themeasurement result. The analyzer’s multi‐user facility allows you todefine user‐specific configurations and measurement points, so you canorganize your field measurements, and the included MeasurementPartner Suite program makes it easy to review the results on your PC.
TroubleshootingFig. 7 Ruggedized Accelerometer Type 8341 for machine analysis and troubleshooting
FFT Analysis Software BZ‐7230 includes the analysis tools and measurement unitsfor a wide range of troubleshooting applications. For example:• Measuring an engine mount’s movement at idle RPM as displacement. Simply
attach an accelerometer and set up the tachometer trigger input and the runningspeed will be displayed
• Spot‐checking the output of a random vibration shaker is also easy. Use the stylusto set the delta cursor for the desired frequency span and read out the PowerSpectral Density (PSD), then select g2/Hz or (m/s2)2/Hz as your reference units
• You can also easily find a component’s resonant frequencies. Switch the analyzer’sFFT from continuous to transient signals and tap the component to excite itsresonances. The internal trigger starts the measurement, and the FFT softwarewill use a rectangular time window to capture the entire transient. Save theresonance spectrum as a reference then measure a machine’s vibrationspectrum to see if any resonance lines up with the operational frequencies
Quality Testing and Inspection – Tolerance WindowsRotating or reciprocating elements (such as pistons, shafts and gears) in many machines, tools andvehicles lead to vibrations and noise. Measurements and analyses of that noise and vibration can be usedto detect assembly faults and ensure compliance with required standards.
The tolerance windows feature in BZ‐7230 makes quality control measurements easy.
The designers of the machine, tool or vehicle specify limits for permissible deviations. These specificationscan be set up on Types 2250‐W and 2270‐W using one or several tolerance windows, each of whichdefines an upper and lower limit for the levels over a specific frequency range.
The value checked can be set to the level of the FFT lines or to the sum of FFT lines (delta sum).
4

Fig. 8 Left: Drawing the tolerance window by dragging the stylusCentre: Resulting tolerance window (set to check FFT lines)Right: Additional tolerance windows (set to delta sum) – up to 10 windows can be active and may overlap
Settings and preferences for a particular application can be saved collectively in templates. By recalling atemplate, Type 2250‐W/2270‐W is ready for specific measurements in just seconds, including thespecification of tolerances. Up to 10 tolerance windows per template can be active at the same time,making it possible to test different tolerances for different frequency ranges in one measurement. Inaddition, it is possible to test for two limit ranges over the same frequency range, which is as easy asoverlapping tolerance windows. In addition you can define tolerances for four non‐FFT values; forexample, two instantaneous parameters (LAF and Instantaneous RPM) and two average parameters (LAeqand Average RPM).
During measurement, the FFT spectrum and single values are compared to set limits (indicating ‘aboveupper limit’, ‘within limits’, ‘below lower limit’, ‘above and below limits’). The test is performed andindicated for each window. An overall result is also indicated. It will indicate ‘failed’ if the spectrum orsingle parameters crossed the upper or lower tolerances for any window or ‘passed’ if within thetolerances for all windows.
Fig. 9 BZ‐7230 provides comprehensive indication of the test result
The pass/fail indication is alsoavailable as an electrical signalat the analyzer’s output socket.A 3.3 V DC output indicates anexceeded upper limit, a–3.3 V DC indicates levels belowthe lower limit, and analternating ±3.3 V indicatesviolation of both limits. Thisfeature makes it easy to utilizeTypes 2250‐W and 2270‐W inproduction control systemswhere the output signal cantrigger warnings or start specificactions for the failed item. Beingable to listen to the signal makes
it easier to identify the problem source. You can therefore configure the analyzer to start recordingautomatically when data exceed tolerances (license for Signal Recording Option BZ‐7226 is required). Theinput signal, which will be attached to the specific project, can be played back or exported to a PC forfurther analysis. For more information on BZ‐7226, see page 6.
Quality Testing and Inspection – Programmable Automation2250 REST: Using REST interface for the Type 2250/2270 platform, you can connect to an analyzer, set upand control it, and read out single values from the current measurement (but not complete projects). Thisinterface uses HTTP and only requires the IP address of the instrument. This interface can be used fromany platform (Windows®, Mac®, iOS, Android®, Linux, etc.).
Overall result
Choose which FFT spectra to show
Window overlaid on FFT spectrum for easy identification
Two selectable rows
Text and colour coding:Red (exceeded)Blue (below)Yellow (both)Light green (within tolerance)
Measured FFT Spectrum
Latched Result: Exceeded Below Both
5
Product DevelopmentFig. 10 Vibration measurement using a hand‐held analyzer and Laser Tacho Probe Type 2981
Early component performance evaluation can greatlyimprove product design. The FFT analyzer’s dual‐overlaydisplay makes it easy to compare measurements betweendesign iterations.
You can also benchmark competitive and previousgeneration products. Use narrow‐band analysis to identifyforcing functions and resonances to aid in setting thestandards for the next generation product.
Measurement Partner Suite BZ‐5503 makes it easy totransfer measurement data to a PC where data viewing,exporting and archiving complete the analysis andreporting project.
Metadata
Fig. 11 The Annotations page showing six user‐defined metadata items and a pick‐list for the Location entry
Metadata are supplementary information entries about yourmeasurement that make archiving, retrieving and post‐processing dataeasier and more efficient. Examples of metadata are file name, date andtime, setup and annotations made by the operator.
In addition you can define the names and types of up to 30 text strings.The entry format may be editable text, a user‐defined pick‐list, numericor an index number that automatically increments when ameasurement is saved.
Metadata functionality can also be used for sorting measurements inMeasurement Partner Suite BZ‐5503.
Signal Recording Option BZ-7226
Signal Recording Option BZ‐7226 enables input signal recording for later playback or analysis. Therecording can be automatic (lasting for the duration of the measurement), controlled manually, or last aslong as the limit level is exceeded. Pre‐ and post‐recording delays and duration limits can be set (FFTAnalysis Software BZ‐7230 only). The recording upper frequency limit can be reduced from the full 20 kHzin four steps to save memory. To optimize memory space or dynamic range, 16‐ or 24‐bit recordingresolution is available.
Signal recording files can be quite large, so you will be directed to store your measurements (andrecording) on a memory card in either of the hand‐held analyzer’s integrated SD card slot or on anattached USB stick. Types 2250‐W and 2270‐W support SDHC cards, which provide memory capacity of upto 32 GB. The standard recorded .WAV files are easily input into other analysis tools, for exampleBrüel & Kjær’s PULSE Reflex™ Core.
100059/1100059/1
6
Uploading Measurement Data to Measurement Partner Cloud
Fig. 12 Secure access to measurement data from anywhere
Types 2250 and 2270 can send measurement data to Measurement Partner Cloud (MP Cloud) whereprojects are immediately available for post‐processing, sharing or storage subject to account capacity.Only authorized users have access to the data when it is the MP Cloud.
You can create a Cloud account by visiting the MP Cloud web service at cloud.bksv.com. You open anaccount, register your analyzer serial numbers and perform a one‐time pairing of analyzer and account,ensuring data security. You can also administer access to the account from the web service and ordersubscriptions to increase account capacity.
You can connect the hand‐held analyzer to the Internet through modem, LAN or Wi‐Fi connected torouter. In the field, the analyzer can connect through Wi‐Fi to hotspot on a smart device (Wi‐Fi using CF‐card UL‐1019 for G1‐G3 and Wireless USB‐A Adapter UL‐1050 for G4, respectively).
After measurement is completed and the project is saved, you log the analyzer into the cloud, and projectsare uploaded to the cloud from the analyzer. To do this, you simply need to move your data to the Cloudfolder, which is automatically created when you log on to your account. The data will now be ready forpost‐analysis in Measurement Partner Suite by anyone who has access to the relevant Cloud archive.
Measurement PartnerField App (iOS/Android)
SD WLAN 3G/4G/WLAN
2250/2270 Hand-heldAnalyzer
Direct connection:USB, LAN or modem
MeasurementPartner Suite (PC)
Measurement PartnerCloud/Internet
150077
7
Post-processing Software
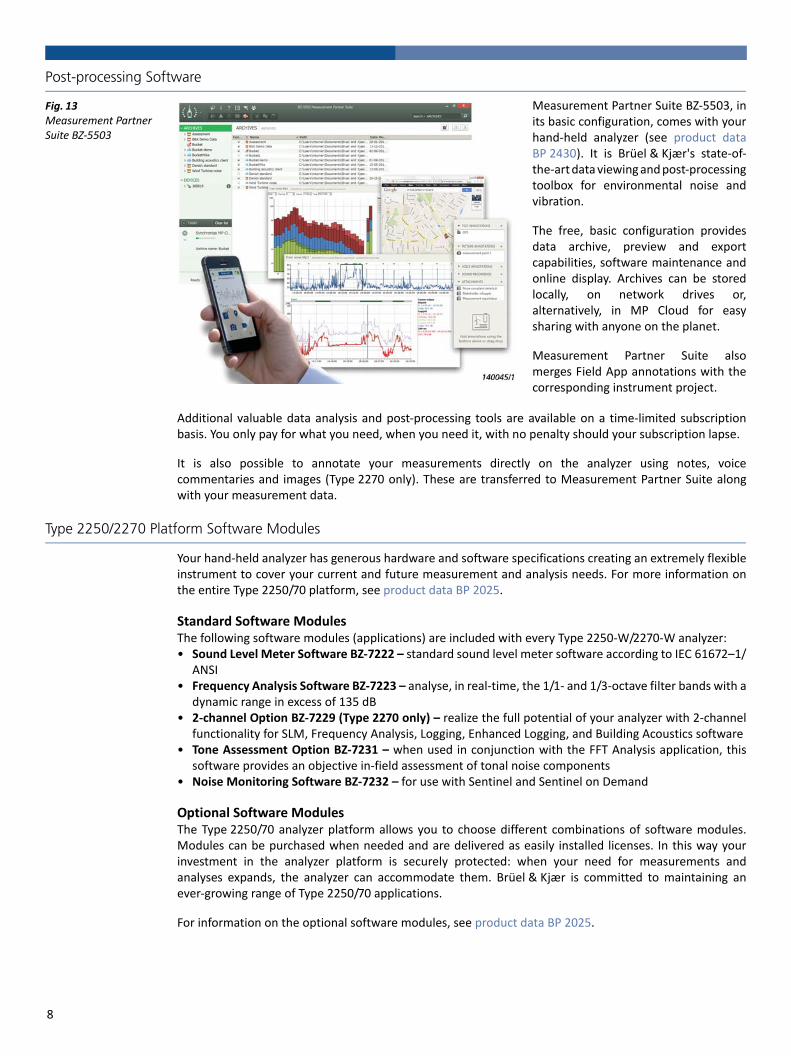
Fig. 13 Measurement Partner Suite BZ‐5503
Measurement Partner Suite BZ‐5503, inits basic configuration, comes with yourhand‐held analyzer (see product dataBP 2430). It is Brüel & Kjær's state‐of‐the‐art data viewing and post‐processingtoolbox for environmental noise andvibration.
The free, basic configuration providesdata archive, preview and exportcapabilities, software maintenance andonline display. Archives can be storedlocally, on network drives or,alternatively, in MP Cloud for easysharing with anyone on the planet.
Measurement Partner Suite alsomerges Field App annotations with thecorresponding instrument project.
Additional valuable data analysis and post‐processing tools are available on a time‐limited subscriptionbasis. You only pay for what you need, when you need it, with no penalty should your subscription lapse.
It is also possible to annotate your measurements directly on the analyzer using notes, voicecommentaries and images (Type 2270 only). These are transferred to Measurement Partner Suite alongwith your measurement data.
Type 2250/2270 Platform Software Modules
Your hand‐held analyzer has generous hardware and software specifications creating an extremely flexibleinstrument to cover your current and future measurement and analysis needs. For more information onthe entire Type 2250/70 platform, see product data BP 2025.
Standard Software ModulesThe following software modules (applications) are included with every Type 2250‐W/2270‐W analyzer:• Sound Level Meter Software BZ‐7222 – standard sound level meter software according to IEC 61672–1/
ANSI• Frequency Analysis Software BZ‐7223 – analyse, in real‐time, the 1/1‐ and 1/3‐octave filter bands with a
dynamic range in excess of 135 dB• 2‐channel Option BZ‐7229 (Type 2270 only) – realize the full potential of your analyzer with 2‐channel
functionality for SLM, Frequency Analysis, Logging, Enhanced Logging, and Building Acoustics software• Tone Assessment Option BZ‐7231 – when used in conjunction with the FFT Analysis application, this
software provides an objective in‐field assessment of tonal noise components • Noise Monitoring Software BZ‐7232 – for use with Sentinel and Sentinel on Demand
Optional Software ModulesThe Type 2250/70 analyzer platform allows you to choose different combinations of software modules.Modules can be purchased when needed and are delivered as easily installed licenses. In this way yourinvestment in the analyzer platform is securely protected: when your need for measurements andanalyses expands, the analyzer can accommodate them. Brüel & Kjær is committed to maintaining anever‐growing range of Type 2250/70 applications.
For information on the optional software modules, see product data BP 2025.
8
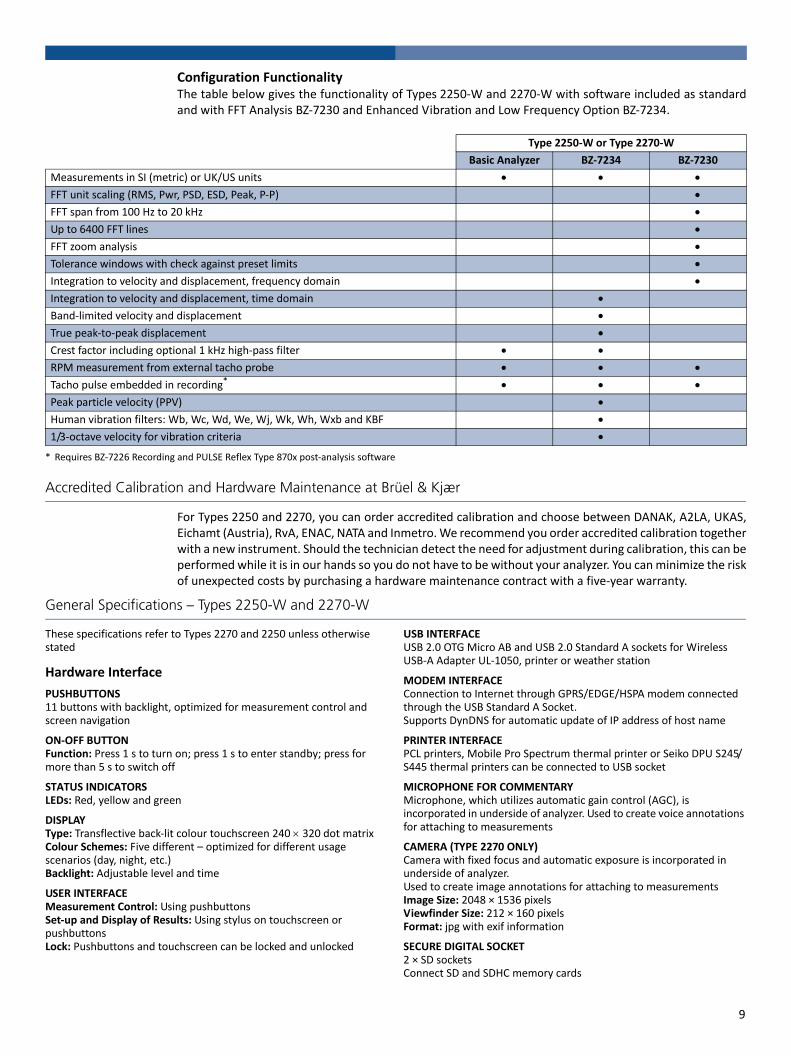
Configuration FunctionalityThe table below gives the functionality of Types 2250‐W and 2270‐W with software included as standardand with FFT Analysis BZ‐7230 and Enhanced Vibration and Low Frequency Option BZ‐7234.
Accredited Calibration and Hardware Maintenance at Brüel & Kjær
For Types 2250 and 2270, you can order accredited calibration and choose between DANAK, A2LA, UKAS,Eichamt (Austria), RvA, ENAC, NATA and Inmetro. We recommend you order accredited calibration togetherwith a new instrument. Should the technician detect the need for adjustment during calibration, this can beperformed while it is in our hands so you do not have to be without your analyzer. You can minimize the riskof unexpected costs by purchasing a hardware maintenance contract with a five‐year warranty.
Type 2250‐W or Type 2270‐W
Basic Analyzer BZ‐7234 BZ‐7230
Measurements in SI (metric) or UK/US units FFT unit scaling (RMS, Pwr, PSD, ESD, Peak, P‐P) FFT span from 100 Hz to 20 kHz Up to 6400 FFT lines FFT zoom analysis Tolerance windows with check against preset limits Integration to velocity and displacement, frequency domain Integration to velocity and displacement, time domain Band‐limited velocity and displacement True peak‐to‐peak displacement Crest factor including optional 1 kHz high‐pass filter RPM measurement from external tacho probe Tacho pulse embedded in recording* Peak particle velocity (PPV) Human vibration filters: Wb, Wc, Wd, We, Wj, Wk, Wh, Wxb and KBF 1/3‐octave velocity for vibration criteria
* Requires BZ‐7226 Recording and PULSE Reflex Type 870x post‐analysis software
General Specifications – Types 2250-W and 2270-W
These specifications refer to Types 2270 and 2250 unless otherwise stated
Hardware Interface
PUSHBUTTONS11 buttons with backlight, optimized for measurement control and screen navigation
ON‐OFF BUTTONFunction: Press 1 s to turn on; press 1 s to enter standby; press for more than 5 s to switch off
STATUS INDICATORSLEDs: Red, yellow and green
DISPLAYType: Transflective back‐lit colour touchscreen 240 320 dot matrixColour Schemes: Five different – optimized for different usage scenarios (day, night, etc.)Backlight: Adjustable level and time
USER INTERFACEMeasurement Control: Using pushbuttons Set‐up and Display of Results: Using stylus on touchscreen or pushbuttonsLock: Pushbuttons and touchscreen can be locked and unlocked
USB INTERFACEUSB 2.0 OTG Micro AB and USB 2.0 Standard A sockets for Wireless USB‐A Adapter UL‐1050, printer or weather station
MODEM INTERFACEConnection to Internet through GPRS/EDGE/HSPA modem connected through the USB Standard A Socket. Supports DynDNS for automatic update of IP address of host name
PRINTER INTERFACEPCL printers, Mobile Pro Spectrum thermal printer or Seiko DPU S245/S445 thermal printers can be connected to USB socket
MICROPHONE FOR COMMENTARYMicrophone, which utilizes automatic gain control (AGC), is incorporated in underside of analyzer. Used to create voice annotations for attaching to measurements
CAMERA (TYPE 2270 ONLY)Camera with fixed focus and automatic exposure is incorporated in underside of analyzer.Used to create image annotations for attaching to measurementsImage Size: 2048 × 1536 pixelsViewfinder Size: 212 × 160 pixelsFormat: jpg with exif information
SECURE DIGITAL SOCKET 2 × SD sockets Connect SD and SDHC memory cards
9
LAN INTERFACE SOCKET • Connector: RJ45 Auto‐MDIX• Speed: 100 Mbps• Protocol: TCP/IP
INPUT SOCKET One socket with Type 2250; two with Type 2270Connector: Triaxial LEMO. Used for Direct input as well as input with constant current line drive (CCLD) power supplyInput Impedance: 1 MDirect Input: Max. input voltage: ±14.14 Vpeak, 10 VRMS for sinusoidal input signals, no damage for signals up to ±20 Vpeak, Source impedance 1 k CCLD Input: Max. input voltage: ±7.07 Vpeak, (no indication for violation of this level), no damage for signals in the range –10 to +25 Vpeak CCLD Current/voltage: 4 mA/25 VCCLD Cable Break/Short Indication: Checked before and after measurements
TRIGGER SOCKETConnector: Triaxial LEMOMax. Input Voltage: ±20 Vpeak, no damage for signals up to +50 Vpeak Input Impedance: >47 kCCLD Current/Voltage: 4 mA/25 V
OUTPUT SOCKETConnector: Triaxial LEMOMax. Peak Output Level: ±4.46 VOutput Impedance: 50
HEADPHONE SOCKETConnector: 3.5 mm Minijack stereo socketMax. Peak Output Level: ±1.4 VOutput Impedance: 32 in each channel, short‐circuit proof without affecting the measurement results Sources: Input conditioned (gain adjustment –60 to +60 dB), playback of voice annotations and signal recordings (gain adjustment –60 to 0 dB) and playback of recordings (gain adjustment –60 to +60 dB); however, max. gain is 0 dB for 16‐bit wave files
Storage
INTERNAL FLASH‐RAM (NON‐VOLATILE) 512 MB for user set‐ups and measurement data
EXTERNAL MEMORY CARD SD and SDHC Card: For store/recall of measurement data
USB MEMORY STICK For store/recall of measurement data
Power
EXTERNAL DC POWER SUPPLY REQUIREMENTSUsed to charge the battery pack in the analyzerVoltage: 8 – 24 V DC, ripple voltage <20 mVCurrent Requirement: min. 1.5 APower Consumption: <2.5 W, without battery charging, <10 W when chargingCable Connector: LEMO Type FFA.00, positive at centre pin
EXTERNAL AC MAIN SUPPLY ADAPTORPart No.: ZG‐0426Supply Voltage: 100 – 120/200 – 240 V AC; 47 – 63 HzConnector: 2‐pin IEC 320
BATTERY PACKRechargeable Li‐Ion batteryPart No.: QB‐0061Voltage: 3.7 VCapacity: 5200 mAh nominalTypical Operating Time:
Single‐channel: >11 h (screen backlight dimmed); >10 h (full screen backlight)Dual‐channel: >7.5 h(full screen backlight)Battery Cycle Life: >500 complete charge/discharge cyclesBattery Aging: Approximately 20% loss in capacity per yearBattery Indicator: Remaining battery capacity and expected working time may be read out in % and in timeBattery Fuel Gauge: The battery is equipped with a built‐in fuel gauge, which continuously measures and stores the actual battery capacity in the battery unitCharge Time: In analyzer, typically 10 hours from empty at ambient temperatures below 30 °C (86 °F). To protect the battery, charging will be terminated completely at ambient temperatures above 40 °C (104 °F). At 30 to 40 °C, charging time will be prolonged. With External Charger ZG‐0444 (optional accessory), typically 5 hoursNote: It is not recommended to charge the battery at temperatures below 0 °C (32 °F) or over 50 °C (122 °F). Doing this will reduce battery lifetime
CLOCKBack‐up battery powered clock. Drift <0.45 s per 24‐hour period
Environmental
WARM‐UP TIMEFrom Power Off: <2 minFrom Standby: <10 s for prepolarized microphones
WEIGHT AND DIMENSIONS650 g (23 oz) including rechargeable battery300 93 50 mm (11.8 3.7 1.9) including preamplifier and microphone
Wireless Connection to Mobile DeviceSpecifications apply to Wireless USB‐A Adapter UL‐1050Operating Frequency: 2.4 GHzData Rate: • IEEE 802.11n: up to 150 Mbps• IEEE 802.11g: up to 54 Mbps• IEEE 802.11b: up to 11 MbpsEncryption/Authentication:• 64/128‐bit WEP• WPA‐PSK• WPA2‐PSKRange: The range is similar to a standard WLAN unit, typically from 10 to 50 m (33 to 164), depending on the environment and the number of other WLAN transmitters in the area (smartphones, Wi‐Fi, etc.)Power Requirements: Power Consumption: <1 W
Software Interface
USERSMulti‐user concept with login. Users can have their own settings with jobs and projects totally independent of other users
PREFERENCESDate, time and number formats can be specified per user
LANGUAGEUser interface in Catalan, Chinese (People’s Republic of China), Chinese (Taiwan), Croatian, Czech, Danish, English, Flemish, French, German, Hungarian, Japanese, Italian, Korean, Polish, Portuguese, Romanian, Russian, Serbian, Slovenian, Spanish, Swedish, Turkish and Ukrainian
HELPConcise context‐sensitive help in Chinese (People’s Republic of China), English, French, German, Italian, Japanese, Polish, Romanian, Serbian, Slovenian, Spanish and Ukrainian
UPDATE OF SOFTWAREUpdate to any version using BZ‐5503 through USB or update via Internet
10
REMOTE ACCESSConnect to the analyzer using: • Measurement Partner Suite BZ‐5503• Measurement Partner Field App (iOS or Android smartphone app)• the 2250/2270 SDK (software development kit)• a REST interface through HTTP• an Internet browser supporting JavaScriptThe connection is password protected with two levels of protection: • Guest level: for viewing only• Administrator level: for viewing and full control of the analyzer
CLOUDConnect to Measurement Partner Cloud on cloud.bksv.com for transferring data to an archive in the cloud for storage or easy synchronization with Measurement Partner Suite BZ‐5503
Input
DUAL CHANNELS (Type 2270 only)All measurements are made from either Ch.1 or Ch.2 Two independent measurement channels are available on Type 2270 to enable you to measure various parameters, subject to having a dual‐channel application license
TRANSDUCER DATABASETransducers are described in a transducer database with information on Serial Number, Preamplifier ID, Nominal Sensitivity, CCLD Required and Weight. The analogue hardware is set up automatically in accordance with the selected transducer
CalibrationInitial calibration is stored for comparison with later calibrations. For accelerometer Types 4397‐A, 8341, 4533‐B, 4533‐B‐001, 4533‐B‐002, 4534‐B, 4534‐B‐001, 4534‐B‐002, 8344, 8347‐C, and 8324, the lower frequency limit will be optimized to match the specifications for the accelerometer.Initial calibrations for each transducer are stored for comparison with later calibrations
ELECTRICALUses internally generated electrical signal combined with a typed‐in value of microphone sensitivity
MECHANICAL Using Calibrator Exciter Type 4294 or custom calibrator
DIRECT ELECTRICAL Using an external voltage reference
CALIBRATION HISTORYUp to 20 of the last calibrations made are listed and can be viewed on the analyzer
Data Management
METADATAUp to 30 metadata annotations can be set per project (text from keyboard or text from pick list, number from keyboard or auto‐generated number)
PROJECT TEMPLATEDefines the display and measurement set‐ups. Set‐ups can be locked and password‐protected
PROJECTMeasurement data stored with the project template
JOBProjects are organized in jobs.Explorer facilities for easy management of data (copy, cut, paste, delete, rename, open project, create job, set default project name)
Measurement Control
MANUAL CONTROLS Reset, Start, Pause, Back‐erase, Continue and Store the measurement manually
AUTO‐START A total of 10 timers allow set up of measurement start times up to a month in advance. Each timer can be repeated. Measurements are automatically stored when completed
BACK‐ERASEThe last 5 s of data can be erased without resetting the measurement
Measurement Status
ON SCREENInformation such as overload and running/paused are displayed on screen as icons
TRAFFIC LIGHTSRed, yellow and green LEDs show measurement status and instantaneous overload as follows:• Yellow LED flashing every 5 s = stopped, ready to measure• Green LED flashing slowly = awaiting calibration signal• Green LED on constantly = measuring• Yellow LED flashing slowly = paused, measurement not stored• Red LED flashing quickly = intermittent overload, calibration failed
NOTIFICATIONSSends an SMS or email daily at a specified time or if an alarm condition is fulfilledAlarm Conditions:• Disk Space below set value• Trig. Input Voltage below set value• Internal Battery enters set state• Change in Measurement State• Reboot of analyzer
Annotations
VOICE ANNOTATIONSVoice annotations can be attached to measurements so that verbal comments can be stored together with the measurementPlayback: Playback of voice annotations can be listened to using an earphone/headphones connected to the headphone socketGain Adjustment: –60 dB to +60 dB
TEXT ANNOTATIONSText annotations can be attached to measurements so that written comments can be stored with the measurement
GPS ANNOTATIONSA text annotation with GPS information can be attached (Latitude, Longitude, Altitude and position error). Requires connection to a GPS receiver
IMAGE ANNOTATIONS (TYPE 2270 ONLY)Image annotations can be attached to measurements. Images can be viewed on the screen
Measurements
DUAL‐CHANNEL MEASUREMENTS (TYPE 2270 ONLY)Two independent measurement channels are available on Type 2270 to enable you to measure various parameters, subject to having a dual‐channel application license
REFERENCE ENVIRONMENTAL CONDITIONSAir Temperature: 23 CStatic Pressure: 101.325 kPaRelative Humidity: 50%
11

Broadband Analysis
DETECTORSParallel detectors on every measurement:• Detector 1: Broadband detector with two exponential time weightings (Fast, Slow)
• Detector 2: Broadband detector (1 k – 20 kHz) with two exponential time weightings (Fast, Slow)
• One peak detector• Overload Detector: Monitors the overload outputs of all the frequency weighted channels
MEASUREMENTS
RPM MEASUREMENTRPM is measured on the signal connected to Trigger input when Tacho is set to OnRange: 1 to 6 000 000 RPMGear Ratio: 10–5 to 1038. The displayed RPM is the measured RPM divided by the RPM gear ratio
MEASUREMENT DISPLAYSSLM: Measurement data displayed as numbers of various sizes and one quasi‐analog barMeasured sound data are displayed as dB values, vibration data as dB values or in physical units (SI units (m/s2) or US/UK units (g)), direct data as voltage in dB or V, housekeeping data as numbers in relevant format.Instantaneous measurement LXF or Fast Inst is displayed as a quasi‐analog bar
Frequency Analysis
STANDARDSConforms with the following national and international standards:• IEC 61260–1 (2014), 1/1‐octave Bands and 1/3‐octave Bands, Class 1• IEC 61260 (1995–07) plus Amendment 1 (2001–09), 1/1‐octave Bands and 1/3‐octave Bands, Class 0
• ANSI S1.11–1986, 1/1‐octave Bands and 1/3‐octave Bands, Order 3, Type 0 –C
• ANSI S1.11–2004, 1/1‐octave Bands and 1/3‐octave Bands, Class 0• ANSI/ASA S1.11–2014 Part 1, 1/1‐octave Bands and 1/3‐octave Bands, Class 1
CENTRE FREQUENCIES1/1‐oct. Band Centre Frequencies: 8 Hz to 16 kHz1/3‐oct. Band Centre Frequencies: 6.3 Hz to 20 kHz
Software Specifications – FFT Analysis Software BZ-7230
Specifications for FFT analysis are given for the analyzer with software BZ‐7230 installed and fitted with one of the recommended transducers (see table below)
FFT ANALYSISSampling Frequency: Downsampling from 51.2 kHzFrequency Span: 100 Hz, 200 Hz, 500 Hz, 1 kHz, 2 kHz, 5 kHz, 10 kHz, 20 kHzLines: 100, 200, 400, 800, 1600, 3200, 6400*
Zoom Centre Frequency: Can be set so that the Frequency Span is placed in the range 0 to 20 kHzSpectrum: Averaged and MaximumPre‐weighting: Z (none), A, B or C (microphone input only)
MeasuringMeasurements can be manually started and stopped using a pushbutton or an external signal
EXPONENTIAL AVERAGING With an averaging time of up to 999 spectra, measured with Hanning window and 67% overlap
LINEAR AVERAGING Up to 8388607 spectra measured with Hanning window and 67% overlapTriggered Start
TRANSIENT SIGNAL TYPELinear averaging of up to 32767 triggered spectra measured with rectangular window and 0% overlap
CONTINUOUS SIGNAL TYPE Linear averaging of up to 32767 spectra measured with Hanning window and 67% overlap. Up to 32767 spectra are averaged on each trigger
TRIGGERSDelay: From 16383 samples before the trigger time to 300 seconds afterHold Off: 0 to 300 sInternal Trigger: Uses the time signal from the measurement transducer. The Internal Level is set in the relevant measurement unitsExternal Trigger: Uses the Trigger Input. The External Level is set in the range –20 to 20 VOffset at Trigger Input: Typically between –70 mV and 200 mVHysteresis (only for External Trigger): 0 to 10 VSlope (only for External Trigger): Rising, Falling
MEASUREMENT RANGE(See table below)The lower limit of the measurement range is influenced by self‐generated random noise and self‐generated tones called spurious signals. The influence of the random part can be reduced to a level below the spurious signals by selecting a small analysis bandwidth (small span and many lines). Therefore, the lower limit is specified as the maximum Peak level of the spurious signal lines
BZ‐7230 has only one measuring range but the spurious level depends on the peak level of the signal. Therefore, two specifications are given.
One for high levels, where the upper limit is the overload limit, and one for low levels
For Display and Storage:
Start Time Stop Time Overload %
Elapsed Time Time Remaining
aLinear aLin(1k–20kHz)
aFast max aF max(1k–20kHz)
aSlow max aS max(1k–20kHz)
aFast min aF min(1k–20kHz)
aPeak aTPeakCrest Factor Avg. RPM
Linear (f1 – f2)*
* where f1 and f2 are frequency bands in the spectrum
Spectra:
Linear Fast max. Slow max.
Fast min. Slow min.
Only for Display as Numbers or Quasi‐analog Bars:
aFast Inst aF Inst(1k–20kHz)
aSlow Inst aS Inst(1k–20kHz)
Inst RPM Trig. Input Voltage
Instantaneous GPS Data:
Latitude Longitude
* The actual number of lines is one more than stated, to provide symmetry around the centre frequency.
12

The Typical Frequency Response shows the ±1 dB limits for Direct Input and microphones, and the ±10% limits for accelerometers
RPM MEASUREMENTRPM is measured on the signal connected to Trigger input when Tacho is set to On Range: 1 to 6000000 RPMInstantaneous RPM: Instantaneous RPM is only displayed (and not stored)Average RPM: Displayed and stored together with each Spectrum result. In Linear Averaging it is an average over the same time as the spectrum. In Exponential averaging it is the last measured RPMGear Ratio: 10–5 to 1038. The displayed RPM are the measured RPM divided by the RPM Gear Ratio
OVERLOADInstantaneous Overload: Instantaneous overload is displayed as an icon on the display and is also indicated by the traffic lightSpectrum Overload: Displayed and stored together with each spectrum result
DISPLAY SPECTRATwo spectra superimposedScaling: RMS, Peak, Peak‐to‐Peak, Power, PSD, ESDReference Spectrum: Compare spectrum to stored (measured) referenceAxis: Logarithmic or linear Y‐axis; Logarithmic or linear X‐axisX‐axis: Display full frequency range or expand the X‐axis until only 20 FFT lines are displayed. Scroll availableY‐axis Display Range: 5, 10, 20, 40, 60, 80, 100, 120, 140, 160, 180 or 200 dB. Auto‐zoom or Auto‐scale availableDigital Post‐weighting: Z (none) or A‐weighting*
DISPLAY PARAMETERSSound: Sound pressure level in dBVibration: Acceleration, velocity or displacement in dB or physical units. SI units (m/s2, m/s or m) or US/UK units (g, m/s or Mil)Direct: Voltage in dB or V
CURSORSReadings: Total level within the spectrumFrequency Correction: For spectra measured with a Hanning window, spectral peaks are interpolated to a higher precisionMain: Reads level versus frequencySymmetrical Delta and Delta: Defines lower and upper frequency limit for any part of the spectrum and calculates the level sum within that frequency rangeHarmonic: Identifies fundamental frequency and harmonics in the spectrum and calculates the Total Harmonic Distortion† (THD)
Reference: Reads the difference between the main cursor Y‐value and the reference cursor Y‐value
TOLERANCE CHECKTolerance Window: Determines the upper and lower levels and the top and bottom frequency at which the spectrum is checked. The check can either be made on all the FFT Lines within the specified range or on the Delta Sum of the lines.The following parameters are measured for check on Delta Sum with exponential averaging: • Delta Sum• Max Delta Sum• RPM at time for Max Delta Sum• LAF at time for Max Delta Sum• FFT Spectrum at time for Max Delta SumUp to 10 tolerance windows can be specified per template.Single Values Check: Tolerances can be set for the parameters: LAF, Instantaneous RPM, LAeq and Average RPMIndication: Results for each tolerance window and for the four single values can be displayed. An Overall Result (combination of all results) and a Latched Result (latched during measurement) can be displayed and are indicated in the status panel.When tolerance limits are violated, a recording can be started (license for BZ‐7226 required) and a 3.3 V DC signal (above upper limit), a –3.3 V DC (below lower limit) or a signal alternating between 3.3 V and –3.3 V (both above and below limits) can be output to the Output Socket
BAR GRAPHLAF, LZF, Total of Spectrum and Delta Sum can be displayed on a bar graph with indication of Max Delta Sum and Upper and Lower Limits.For engineering units, the axis on bar graph can be logarithmic or linear and can be zoomed
Broadband ParametersBroadband parameters are measured simultaneously with the FFT parameters, however, their measurement starts when the Start/Pause pushbutton is pressed and it ends at the nearest whole second after the end of the FFT measurement.When Type 2250/2270 is fitted with an accelerometer, the following broadband parameters can be displayed in engineering units:• LXeq• LYeq• LXFmax• LYFmax• LXFmin• LYFmin
Measurement ranges with the recommended transducers
TransducerNominalSensitivity
Spurious Free DynamicRange for High Levels
Spurious Free DynamicRange for Low Levels
Typical FrequencyResponse
Low Frequency: Extended/Normal
4397‐A 1 mV/(m/s2) 3 mm/s2 – 5 km/s2Peak 300 μm/s2 – 75 m/s2Peak 1.25/6.3 Hz – 20 kHz
4533‐B4534‐B
1 mV/(m/s2) 3 mm/s2 – 5 km/s2Peak 300 μm/s2 – 75 m/s2Peak 0.2/6.3 Hz – 12.8 kHz
4533‐B‐0014534‐B‐001
10 mV/(m/s2) 300 μm/s2 – 500 m/s2Peak 30 μm/s2 – 7.5 m/s2Peak 0.2/6.3 Hz – 12.8 kHz
4533‐B‐0024534‐B‐002
50 mV/(m/s2) 60 μm/s2 – 100 m/s2Peak 6 μm/s2 – 1.5 m/s2Peak 0.2/6.3 Hz – 12.8 kHz
8341 10 mV/(m/s2) 300 μm/s2 – 500 m/s2Peak 30 μm/s2 – 7.5 m/s2Peak 0.7/6.3 Hz – 10 kHz
8344 250 mV/(m/s2) 12 μm/s2 – 20 m/s2Peak 1.2 μm/s2 – 300 mm/s2Peak 0.2/6.3 Hz – 3 kHz
8347‐C + 2647‐D 1 mV/(m/s2) 3 mm/s2 – 7 km/s2Peak 300 μm/s2 – 75 m/s2Peak 1.25/6.3 Hz – 12.8 kHz
* Microphone input only.† Total Harmonic Distortion (THD) is the sum (in %) of all the harmonics relative
to the sum of the fundamental and all the harmonics.
13
• LVpeak• LXF• LYF
Software Specifications – Enhanced Vibration and Low Frequency Option BZ-7234
Enhanced Vibration and Low Frequency Option BZ‐7234 is enabled with a separate license. It adds human vibration parameters, and integration and double integration of the acceleration signal for vibration and displacement parameters to Sound Level Meter, Frequency Analysis, Logging and Enhanced Logging Software and adds low frequency 1/1‐ and 1/3‐octave analysis to Frequency Analysis, Logging and Enhanced Logging Software
General Vibration
Specifications for general vibration parameters apply to Type 2250/2270 fitted with an accelerometer
AnalysisConforms with the following International standards:• ISO 2954• ISO 10816 series
Analysis
DETECTORSAddition to the Acc Linear and Acc 1k – 20 kHz settings for the two broadband detectors:
The weighting for the peak detector can be set to one of the settings chosen for the broadband detectors or Acc LinearThe weighting for the spectrum detectors can be set to Acc Linear or Vel 3 – 20000 Hz, Vel 0.3 – 1000 Hz, Vel 10 – 1000 Hz or Vel 1 – 100 HzSingle Values for Display and Storage: Peak‐Peak for displacement
Human Vibration
Specifications for Human Vibration parameters apply to Type 2250/2270 fitted with an accelerometer.
StandardsConforms with the following International Standards:• ISO 8041:2005 • ISO 5349–1 • ISO 2631 series • DIN 45669‐1:2010–09
Analysis
DETECTORSTwo broadband detectors can each be set to one of the weightings:
Wmb is the band limiting part of Wm. Whb is the band limiting part of Wh and Wxb is the band limiting part of Wb, Wc, Wd, We, Wj and WkThe weighting for the peak detector can be set to one of the settings chosen for the broadband detectors or Acc Linear.The weighting for the spectrum detectors can be set to Acc Linear or Vel 0.3 – 1000 Hz or Vel 1 – 100 Hz
MEASUREMENTS
Low Frequency 1/1- and 1/3-octave Analysis
Frequency Analysis
CENTRE FREQUENCIES1/1‐oct. Band Centre Frequencies: 1 Hz to 16 kHz1/3‐oct. Band Centre Frequencies: 0.8 Hz to 20 kHz
StandardsConforms with the following National and International Standards:• IEC 61260–1 (2014), 1/1‐octave Bands and 1/3‐octave Bands, Class 1• IEC 61260 (1995–07) plus Amendment 1 (2001–09), 1/1‐octave Bands and 1/3‐octave Bands, Class 0
• ANSI S1.11–1986, 1/1‐octave Bands and 1/3‐octave Bands, Order 3, Type 0–C
• ANSI S1.11–2004, 1/1‐octave Bands and 1/3‐octave Bands, Class 0• ANSI/ASA S1.11–2014 Part 1, 1/1‐octave Bands and 1/3‐octave Bands, Class 1
Vibration MeasurementsBrüel & Kjær recommends Low‐level Accelerometer Type 8344 for low‐frequency vibration measurements
Vel 3 – 20 000 Hz Vel 0.3 – 1000 Hz Vel 10 – 1000 Hz
Vel 1 – 100 Hz Dis 10 – 1000 Hz Dis 30 – 300 Hz
Dis 1 – 100 Hz
Acc Linear Vel 0.3 – 1000 Hz Vel 1 – 100 Hz
Wb Wc Wd
We Wj Wh
Wk Wm Wxb
Whb Wmb
Single Values for Display and Storage:
MTVV KBFmax KBFTmPeak‐Peak
Single Values for Display Only:
aW,1s KBF
14
Software Specifications – Signal Recording Option BZ-7226
Signal Recording Option BZ‐7226 is enabled with a separate license. For data storage, signal recording requires:• SD Card• USB Memory Stick
RECORDED SIGNALA‐, B‐, C‐ or Z‐weighted sound signal from the microphone or acceleration signal from the accelerometer
AUTOMATIC GAIN CONTROLThe average level of the signal is kept within a 40 dB range, or the gain can be fixed
SAMPLING RATE AND PRE‐RECORDINGThe signal is buffered for the pre‐recording of the signal. This allows the beginning of events to be recorded even if they are only detected later.
PLAYBACKPlayback of signal recordings can be listened to using the earphone/headphones connected to the headphone socket
RECORDING FORMATThe recording format is either 24‐ or 16‐bit wave files (extension .wav) attached to the data in the project, easily played back afterwards on a PC using BZ‐5503, Type 7820 or 7825. Calibration information and possible tacho trigger information are stored in the .wav file allowing BZ‐5503 and PULSE to analyse the recordings
FunctionsManual Control of Recording: Recording can be manually started and stopped during a measurement using a pushbutton or an external signalAutomatic Control of Recording: Start of recording when measurement is started. Minimum and Maximum recording time can be preset
Specifications – Measurement Partner Suite BZ-5503
BZ‐5503 is included with Types 2250 and 2270 for easy synchronization of setups and data between the PC and hand‐held analyzer. BZ‐5503 is supplied on ENV DVD BZ‐5298
PC REQUIREMENTSOperating System: Windows® 7, 8.1 or 10 (all in 32‐bit or 64‐bit versions) Recommended PC: • Intel® Core™ i3• Microsoft®.NET 4.5• 2 GB of memory• Sound card• DVD drive• At least one available USB port• Solid State Drive
ONLINE DISPLAY OF TYPE 2250/2270 DATAMeasurements on the analyzer can be controlled from the PC and displayed online with the PC, using the same user interface on the PC as on the analyzerDisplay: 1024 × 768 (1280 × 800 recommended)
DATA MANAGEMENTExplorer: Facilities for easy management of analyzers, users, jobs, projects and project templates (copy, cut, paste, delete, rename, create)Data Viewer: View measurement data (content of projects)Synchronization: Project templates and projects for a specific user can be synchronized between PC and analyzer and between local and cloud archives. Measurement Partner Suite BZ‐5503 merges Measurement Partner Field App annotations with the corresponding analyzer project
USERSUsers of Type 2250/2270 can be created or deleted
EXPORT FACILITIESExcel®: Projects (or user‐specified parts) can be exported to Microsoft® Excel® (Excel 2003 – 2016 supported)
Brüel & Kjær Software: Projects can be exported* to PULSE Reflex
POST‐PROCESSINGMeasurement Partner Suite is a suite of modules, including post‐processing tools for data acquired with Type2250/2270. The following post‐processing modules are available:• Logging Module BZ‐5503‐A• Spectrum Module BZ‐5503‐B• WAV File Analysis Module BZ‐5503‐CThese modules help to assess logging data and measured spectra, such as calculating contribution from markers on a logging profile or correcting spectra for background noise
HAND‐HELD ANALYZER SOFTWARE UPGRADES AND LICENSESThe software controls analyzer software upgrades and licensing of the analyzer applications
INTERFACE TO HAND‐HELD ANALYZERUSB, LAN or Internet connection
LICENSE MOVERTo move a license from one analyzer to another use BZ‐5503 together with License Mover VP‐0647
LANGUAGEUser Interface in Chinese (People’s Republic of China), Chinese (Taiwan), Croatian, Czech, Danish, English, Flemish, French, German, Hungarian, Japanese, Italian, Korean, Polish, Portuguese, Romanian, Russian, Serbian, Slovenian, Spanish, Swedish, Turkish and Ukrainian
HELPConcise context‐sensitive help in English
Sampling Rate (kHz) 8 16 24 48
Maximum Pre‐recording (s)
16‐bit
470 230 150 70
Maximum Pre‐recording (s)
24‐bit
310 150 96 43
Memory (KB/s) 16‐bit 16 32 48 96
Memory (KB/s) 24‐bit 24 48 72 144
* Not all data are available in all exports. The data exported are dependent on the type and target of the export.
15

Ordering Information
To measure vibration, order these analyzer and software module combinations:
Single‐Channel MeasurementsType 2250‐W Hand‐held Analyzer with one or both of:BZ‐7230 FFT Analysis SoftwareBZ‐7234 Enhanced Vibration and Low Frequency Option
Dual‐Channel MeasurementsType 2270‐W Hand‐held Analyzer (two‐channel)with one or both of:BZ‐7230 FFT Analysis Software BZ‐7234 Enhanced Vibration and Low Frequency Option
Both Types 2250‐W and 2270‐W include the following as standard:Software:• BZ‐7222: Sound Level Meter Software• BZ‐7223: Frequency Analysis Software• BZ‐7231: Tone Assessment Option• BZ‐7232: Noise Monitoring Software• BZ‐7229: 2‐channel Option (Type 2270‐W only)
Accessories:• FB‐0679: Hinged Cover (Type 2250 only)• FB‐0699: Hinged Cover (Type 2270 only)• QB‐0061: Battery Pack• ZG‐0426: Mains Power Supply• Accessory Kit UA‐1710‐D01 including:– KE‐0441: Protective Cover for Hand‐held Analyzer– UL‐1050:Wireless USB‐A (M) Adaptor– UA‐1651: Tripod Extension for Hand‐held Analyzer– UA‐1654: 5 Extra Styli– UA‐1673: Adaptor for Standard Tripod Mount– DH‐0696: Wrist Strap– DD‐0594: Protection Plug for Hand‐held Analyzer without Preamplifier
– AO‐1494: Cable, USB 2.0, USB‐A (M) to USB‐micro‐B (M) black, 1.8 m (5.9 ft), max. +70 °C (158 °F)
– BZ‐5298: Software, Environmental Software DVD
These accessories are also available separately
Software and Accessories Available Separately
SOFTWARE MODULESBZ‐7224 Logging SoftwareBZ‐7225 Enhanced Logging SoftwareBZ‐7225‐UPG Upgrade from Logging Software BZ‐7224 to
Enhanced Logging Software BZ‐7225 (does not include memory card)
BZ‐7226 Signal Recording OptionBZ‐7229 2‐channel Option (Type 2270 only)
PC SOFTWAREBZ‐5503‐A Measurement Partner, Logging ModuleBZ‐5503‐B Measurement Partner, Spectrum ModuleBZ‐5503‐C Measurement Partner, WAV File Analysis ModuleBZ‐5503‐D Measurement Partner Field App for iOS and
Android (free download at App Store® and Google Play™)
BZ‐5503‐E Measurement Partner Cloud Entry Level, free cloud storage
BZ‐5503‐F‐012 Measurement Partner Cloud Basic, basic cloud storage subscription for one year
BZ‐5503‐G‐012 Measurement Partner Cloud Professional, enterprise cloud storage subscription for one year
Type 7825 Protector™ – calculation software of personal noise exposure
MEASUREMENT ACCESSORIESType 4397‐A Accelerometer, with 1 mV/ms–2 sensitivity, suitable
for high‐frequency and high‐level measurement, with M3 connection
Type 4533‐B Accelerometer, general purpose, with 1 mV/ms–2 sensitivity and 10–32 UNF, side connection
Type 4533‐B‐001 Accelerometer, suitable for low‐level measurement, 10 mV/ms–2 and 10–32 UNF, side connection
Type 4533‐B‐002 Accelerometer, suitable for very low‐level measurement, 50 mV/ms–2 and 10–32 UNF, side connection
Type 4534‐B Accelerometer, general purpose, with 1 mV/ms–2 sensitivity and 10–32 UNF, top connection
Type 4534‐B‐001 Accelerometer, suitable for low‐level measurement, 10 mV/ms–2 and 10–32 UNF, top connection
Type 4534‐B‐002 Accelerometer, suitable for very low‐level measurement, 50 mV/ms–2 and 10–32 UNF, top connection
Type 8324 Piezoelectric Charge Accelerometer, industrial, with 1 pC/ms–2 sensitivity and 2‐pin 7/16‐27 UNS connection
Type 8341 Accelerometer, industrial, with 10.2 mV/ms–2 sensitivity and MIL‐C‐5015 top connection
Type 8344 High‐sensitivity Accelerometer, with 250 mV/ms–2 sensitivity and 10–32 UNF side connection
Type 2647‐D‐004 Charge‐to‐CCLD Converter with integrated cable and connectors for Accelerometer Type 8324 and Type 2250/2270; 80 Hz – 10 kHz
MISCELLANEOUSType 2981 Laser Tachometer ProbeType 4294 Calibration ExciterUA‐0588 Tripod Adaptor for ½ Microphone/Preamplifier
AssembliesUA‐0801 Small TripodUL‐1009 SD Memory CardUL‐1017 SDHC Memory CardZG‐0444 Charger for QB‐0061 Battery PackQS‐0007 Tube of Cyanoacrylate AdhesiveUA‐0642 Mounting Magnet for accelerometer 10–32 UNF
mountingUA‐1077 Mounting Magnet for accelerometer M3 mountingYJ‐0216 Beeswax for mounting accelerometerKE‐0440 Travel Bag KE‐0459 Shoulder Bag
CABLESAO‐0440‐D‐015 Signal Cable, LEMO to BNC, 1.5 m (5 ft)AO‐0701‐D‐030 Accelerometer Cable, LEMO to M3, 3 m (10 ft)AO‐0702‐D‐030 Accelerometer Cable, LEMO to 10–32 UNF, 3 m
(10 ft)AO‐0722‐D‐050 Accelerometer Cable, LEMO to MIL‐C‐5015, 5 m
(16 ft)AO‐0726‐D‐030 Cable for Laser Tachometer Probe, LEMO to SMB,
3 m (10 ft)AO‐0726‐D‐050 Cable for Laser Tachometer Probe, LEMO to SMB,
5 m (16 ft)AO‐0727‐D‐015 Signal Cable, LEMO to BNC Female, 1.5 m (5 ft)
16

Service Products
2270‐CAI Accredited Initial Calibration of Type 22702270‐CAF Accredited Calibration of Type 22702270‐CTF Traceable Calibration of Type 22702270‐TCF Conformance Test of Type 2270, with certificate2250‐CAI Accredited Initial Calibration of Type 22502250‐CAF Accredited Calibration of Type 2250
2250‐CTF Traceable Calibration of Type 22502250‐TCF Conformance Test of Type 2250, with certificate4533‐CAF IEPE Accelerometer, Accredited Calibration4533‐CTF IEPE Accelerometer, Traceable Calibration
17

BP-2183---;Î
BP2183–19
2016‐11
© Brüel&Kjæ
r. All righ
ts reserved.
Brüel & Kjær Sound & Vibration Measurement A/SDK‐2850 Nærum ∙ Denmark ∙ Telephone: +45 77 41 20 00 ∙ Fax: +45 45 80 14 05www.bksv.com ∙ [email protected] representatives and service organizations worldwideAlthough reasonable care has been taken to ensure the information in this document is accurate, nothingherein can be construed to imply representation or warranty as to its accuracy, currency or completeness, noris it intended to form the basis of any contract. Content is subject to change without notice – contactBrüel & Kjær for the latest version of this document.
Brüel & Kjær and all other trademarks, service marks, trade names, logos and product names are the property of Brüel & Kjær or a third‐party company.
Ë


![[Spanish]Características técnicas:Analizador portátil ... · CARACTERÍSTICAS TÉCNICAS Analizador portátil Tipos2250‐W y 2270‐W para mediciones de vibraciones utilizando](https://cdn.vdocuments.site/doc/165x107/5ac22e407f8b9a5a4e8dfc11/spanishcaractersticas-tcnicasanalizador-porttil-tcnicas-analizador-porttil.jpg)


![[French] Documentation Technique : Logiciels Analyse … · Le module BZ-7223 pour 2250/2270 est un exemple d’analyseur d’octave ou de tiers d’oc-tave temps réel avec moyennages](https://cdn.vdocuments.site/doc/165x107/5b99c2ff09d3f2cb468c5a6c/french-documentation-technique-logiciels-analyse-le-module-bz-7223-pour.jpg)