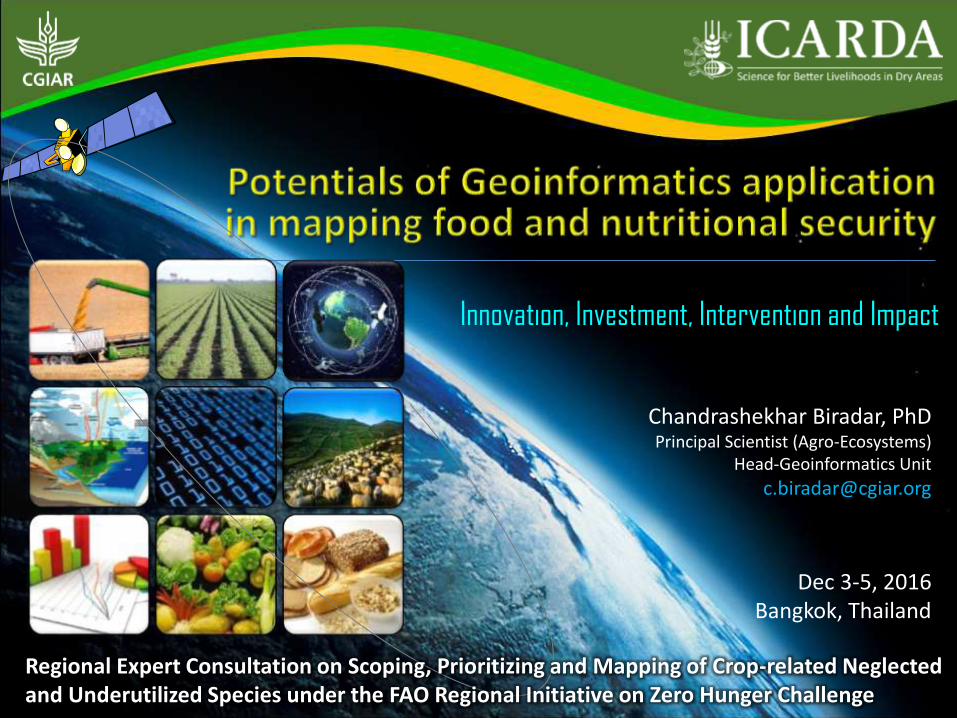
Dec 3-5, 2016Bangkok, Thailand
Innovation, Investment, Intervention and Impact
Chandrashekhar Biradar, PhDPrincipal Scientist (Agro-Ecosystems)
Head-Geoinformatics Unit
Regional Expert Consultation on Scoping, Prioritizing and Mapping of Crop-related Neglected and Underutilized Species under the FAO Regional Initiative on Zero Hunger Challenge
Gender
Nutrition
Youth
Address social inequities,
greater roles and priorities
Engaging and empowering young
gen. by creating opportunities
Changing diet patterns,
nutrition and health
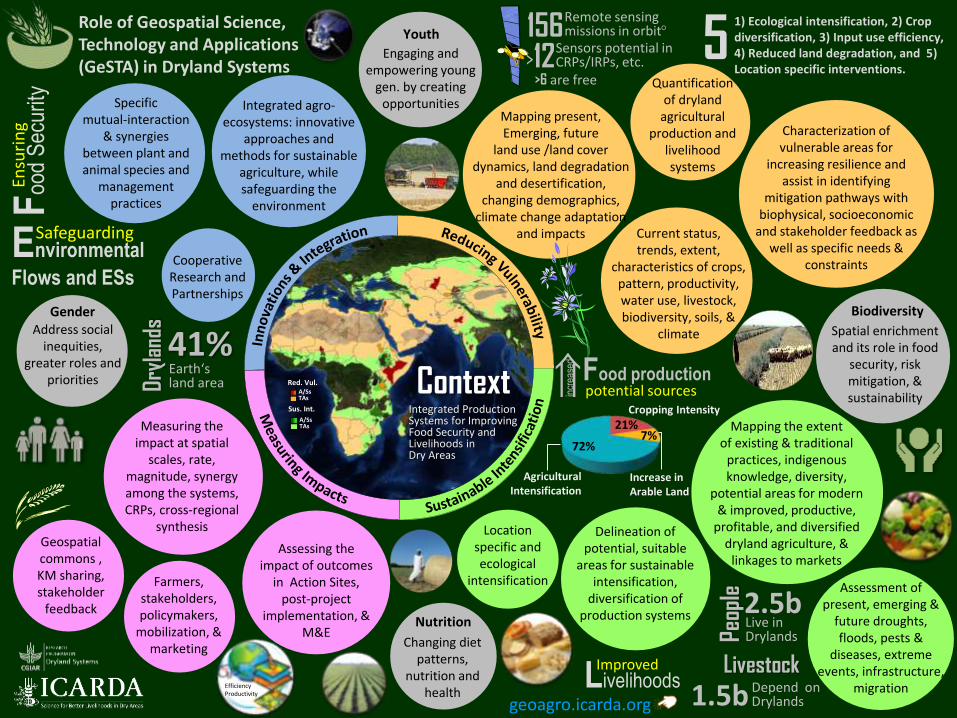
156Remote sensingmissions in orbit
Sensors potential in CRPs/IRPs, etc.
41%
Dryl
ands
Earth‘s land area
2.5bLive in Drylands
Quantificationof dryland
agricultural production and
livelihood systems
Delineation of potential, suitable
areas for sustainable intensification,
diversification of production systems
Characterization of vulnerable areas for
increasing resilience and assist in identifying
mitigation pathways with biophysical, socioeconomic
and stakeholder feedback as well as specific needs &
constraints
Mapping present, Emerging, future
land use /land cover dynamics, land degradation
and desertification, changing demographics,
climate change adaptation and impacts
Location specific and ecological
intensification
Peop
le
Integrated agro-ecosystems: innovative
approaches and methods for sustainable
agriculture, while safeguarding the
environment
Assessing the impact of outcomes
in Action Sites, post-project
implementation, & M&E
Measuring the impact at spatial
scales, rate, magnitude, synergy among the systems, CRPs, cross-regional
synthesisGeospatial commons ,KM sharing, stakeholder
feedback
Current status, trends, extent,
characteristics of crops, pattern, productivity, water use, livestock, biodiversity, soils, &
climate
Cooperative Research andPartnerships
Farmers, stakeholders, policymakers,
mobilization, &marketing
LivelihoodsImproved
Assessment of present, emerging &
future droughts, floods, pests &
diseases, extreme events, infrastructure,
migration
Specific mutual-interaction
& synergies between plant and animal species and
management practices
Mapping the extent of existing & traditional
practices, indigenous knowledge, diversity,
potential areas for modern & improved, productive,
profitable, and diversified dryland agriculture, &
linkages to markets in
crea
sed
Livestock
5
Depend on Drylands1.5b
Red. Vul.
Sus. Int.
A/SsTAs
A/SsTAs
Spatial enrichment and its role in food
security, risk mitigation, & sustainability Food production
potential sources
Agricultural Intensification
Cropping Intensity
Increase in Arable Land
72%
21%7%
Context
>12>6 are free
Biodiversity
Integrated Production Systems for Improving Food Security and Livelihoods inDry Areas
Role of Geospatial Science, Technology and Applications (GeSTA) in Dryland Systems
EfficiencyProductivity
Foo
d S
ecur
ity
Environmental
Flows and ESs
Safeguarding
Ensu
rin
g1) Ecological intensification, 2) Crop diversification, 3) Input use efficiency, 4) Reduced land degradation, and 5) Location specific interventions.
geoagro.icarda.org
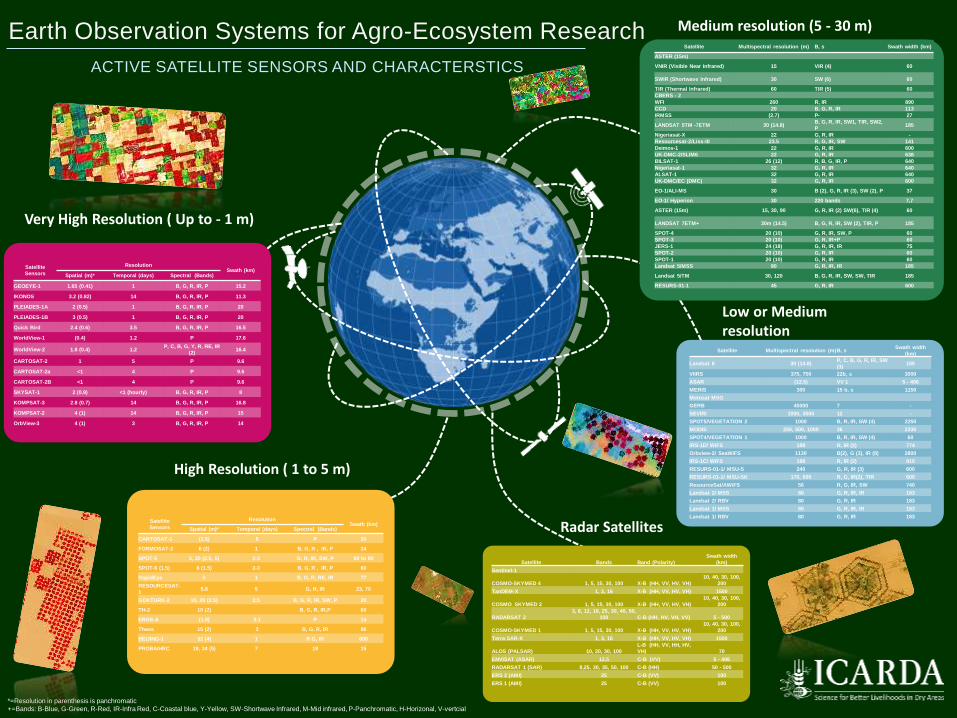
Earth Observation Systems for Agro-Ecosystem Research
ACTIVE SATELLITE SENSORS AND CHARACTERSTICS
Very High Resolution ( Up to - 1 m)
High Resolution ( 1 to 5 m)
Radar Satellites
Medium resolution (5 - 30 m)
Low or Medium resolution
Satellite Bands Band (Polarity)
Swath width
(km)
Sentinel-1
COSMO-SKYMED 4 1, 5, 15, 30, 100 X-B (HH, VV, HV, VH)
10, 40, 30, 100,
200
TanDEM-X 1, 3, 16 X-B (HH, VV, HV, VH) 1500
COSMO_SKYMED 2 1, 5, 15, 30, 100 X-B (HH, VV, HV, VH)
10, 40, 30, 100,
200
RADARSAT 2
3, 8, 12, 18, 25, 30, 40, 50,
100 C-B (HH, HV, VH, VV) 5 - 500
COSMO-SKYMED 1 1, 5, 15, 30, 100 X-B (HH, VV, HV, VH)
10, 40, 30, 100,
200
Terra SAR-X 1, 3, 16 X-B (HH, VV, HV, VH) 1500
ALOS (PALSAR) 10, 20, 30, 100
L-B (HH, VV, HH, HV,
VH) 70
ENVISAT (ASAR) 12.5 C-B (VV) 5 - 406
RADARSAT 1 (SAR) 8,25, 30, 35, 50, 100 C-B (HH) 50 - 500
ERS 2 (AMI) 25 C-B (VV) 100
ERS 1 (AMI) 25 C-B (VV) 100
Satellite Multispectral resolution (m)B, sSwath width
(km)
Landsat 8 30 (14.8)P, C, B, G, R, IR, SW
(3)185
VIIRS 375, 750 22b, s 3000
ASAR (12.5) VV 1 5 - 406
MERIS 300 15 b, s 1150
Metosat MSG
GERB 40000 7 -
SEVIRI 1000, 3000 12 -
SPOT5/VEGETATION 2 1000 B, R, IR, SW (4) 2250
MODIS 250, 500, 1000 36 2330
SPOT4/VEGETATION 1 1000 B, R, IR, SW (4) 60
IRS-1D/ WiFS 188 R, IR (2) 774
Orbview-2/ SeaWiFS 1130 B(2), G (3), IR (8) 2800
IRS-1C/ WiFS 188 R, IR (2) 810
RESURS-01-1/ MSU-S 240 G, R, IR (3) 600
RESURS-01-1/ MSU-SK 170, 600 R, G, IR(2), TIR 600
ResourceSat/AWiFS 56 R, G, IR, SW 740
Landsat 2/ MSS 80 G, R, IR, IR 183
Landsat 2/ RBV 80 G, R, IR 183
Landsat 1/ MSS 80 G, R, IR, IR 183
Landsat 1/ RBV 80 G, R, IR 183
Satellite Multispectral resolution (m) B, s Swath width (km)
ASTER (15m)
VNIR (Visible Near Infrared) 15 VIR (4) 60
SWIR (Shortwave Infrared) 30 SW (6) 60
TIR (Thermal Infrared) 60 TIR (5) 60
CBERS - 2
WFI 260 R, IR 890
CCD 20 B, G, R, IR 113
IRMSS (2.7) P- 27
LANDSAT 5TM -7ETM 30 (14.8)B, G, R, IR, SW1, TIR, SW2,
P185
Nigeriasat-X 22 G, R, IR -
Resourcesat-2/Liss-III 23.5 R, G, IR, SW 141
Deimos-1 22 G, R, IR 600
UK-DMC-2/SLIM6 22 G, R, IR 638
BILSAT-1 26 (12) R, B, G, IR, P 640
Nigeriasat-1 32 G, R, IR 640
ALSAT-1 32 G, R, IR 640
UK-DMC/EC (DMC) 32 G, R, IR 600
EO-1/ALI-MS 30 B (2), G, R, IR (3), SW (2), P 37
EO-1/ Hyperion 30 220 bands 7,7
ASTER (15m) 15, 30, 90 G, R, IR (2) SW(6), TIR (4) 60
LANDSAT 7ETM+ 30m (14.5) B, G, R, IR, SW (2), TIR, P 185
SPOT-4 20 (10) G, R, IR, SW, P 60
SPOT-3 20 (10) G, R, IR+P 60
JERS-1 24 (18) G, R, IR, IR 75
SPOT-2 20 (10) G, R, IR 60
SPOT-1 20 (10) G, R, IR 60
Landsat 5/MSS 80 G, R, IR, IR 185
Landsat 5/TM 30, 120 B, G, R, IR, SW, SW, TIR 185
RESURS-01-1 45 G, R, IR 600
*=Resolution in parenthesis is panchromatic
+=Bands: B-Blue, G-Green, R-Red, IR-Infra Red, C-Coastal blue, Y-Yellow, SW-Shortwave Infrared, M-Mid infrared, P-Panchromatic, H-Horizonal, V-vertcial
Satellite
Sensors
ResolutionSwath (km)
Spatial (m)* Temporal (days) Spectral (Bands)
GEOEYE-1 1.65 (0.41) 1 B, G, R, IR, P 15.2
IKONOS 3.2 (0.82) 14 B, G, R, IR, P 11.3
PLEIADES-1A 2 (0.5) 1 B, G, R, IR, P 20
PLEIADES-1B 3 (0.5) 1 B, G, R, IR, P 20
Quick Bird 2.4 (0.6) 3.5 B, G, R, IR, P 16.5
WorldView-1 (0.4) 1.2 P 17.6
WorldView-2 1.8 (0.4) 1.2P, C, B, G, Y, R, RE, IR
(2)16.4
CARTOSAT-2 1 5 P 9.6
CARTOSAT-2a <1 4 P 9.6
CARTOSAT-2B <1 4 P 9.6
SKYSAT-1 2 (0.9) <1 (hourly) B, G, R, IR, P 8
KOMPSAT-3 2.8 (0.7) 14 B, G, R, IR, P 16.8
KOMPSAT-2 4 (1) 14 B, G, R, IR, P 15
OrbView-3 4 (1) 3 B, G, R, IR, P 14
Satellite
Sensors
ResolutionSwath (km)
Spatial (m)* Temporal (days) Spectral (Bands)
CARTOSAT-1 (2.5) 5 P 30
FORMOSAT-2 8 (2) 1 B, G, R , IR, P 24
SPOT-5 5, 20 (2.5, 5) 2-3 G, R, IR, SW, P 60 to 80
SPOT-6 (1.5) 6 (1.5) 2-3 B, G, R , IR, P 60
RapidEye 5 1 B, G, R, RE, IR 77
RESOURCESAT-
15.8 5 G, R, IR 23, 70
GOKTURK-2 10, 20 (2.5) 2.5 B, G, R, IR, SW, P 20
TH-2 10 (2) B, G, R, IR,P 60
EROS-A (1.8) 2.1 P 14
Theos 15 (2) 3 B, G, R, IR 96
BEIJING-1 32 (4) 1 R G, IR 600
PROBA/HRC 18, 34 (5) 7 18 15
4
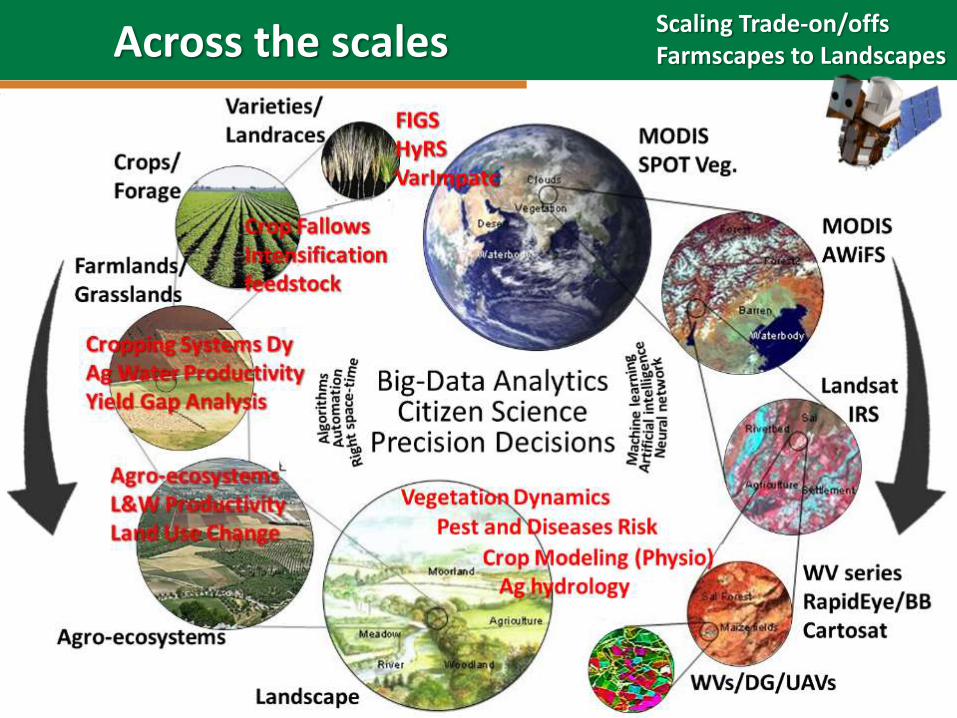
Across the scales Scaling Trade-on/offsFarmscapes to Landscapes
5
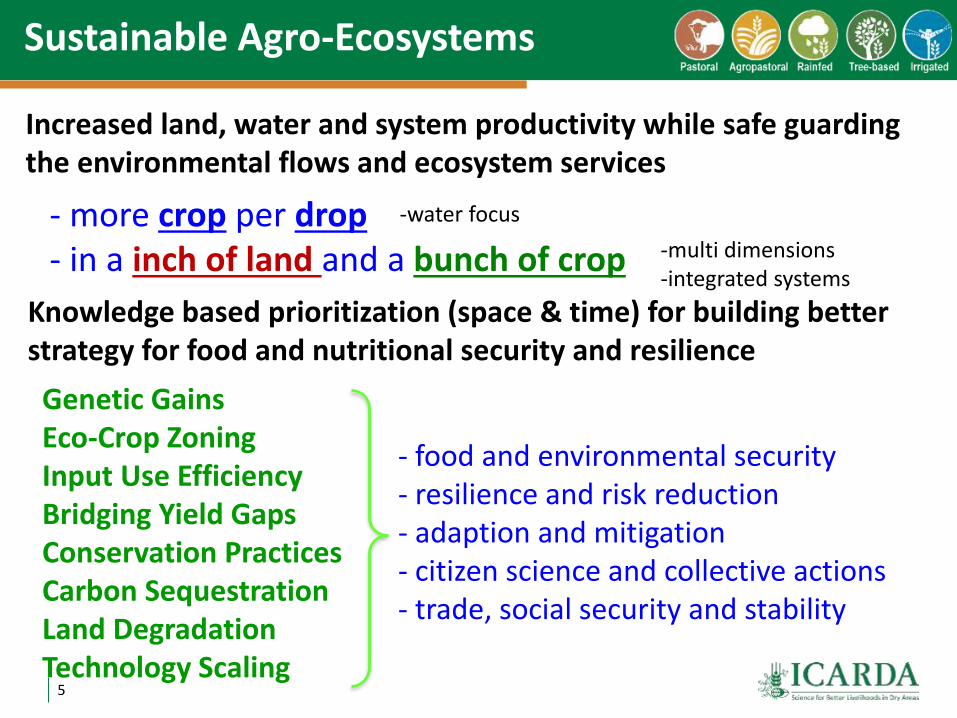
- more crop per drop- in a inch of land and a bunch of crop
Sustainable Agro-Ecosystems
Increased land, water and system productivity while safe guarding the environmental flows and ecosystem services
Knowledge based prioritization (space & time) for building better strategy for food and nutritional security and resilience
- food and environmental security - resilience and risk reduction - adaption and mitigation- citizen science and collective actions- trade, social security and stability
-water focus
-multi dimensions-integrated systems
Genetic Gains Eco-Crop ZoningInput Use EfficiencyBridging Yield GapsConservation PracticesCarbon SequestrationLand Degradation Technology Scaling
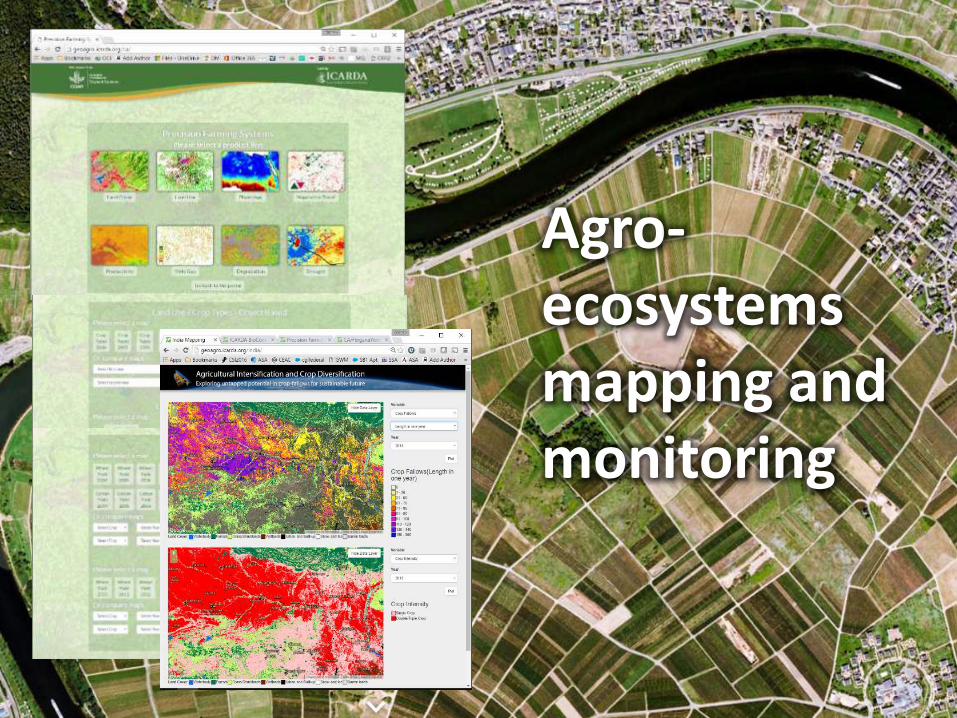
Agro-ecosystemsmapping and monitoring
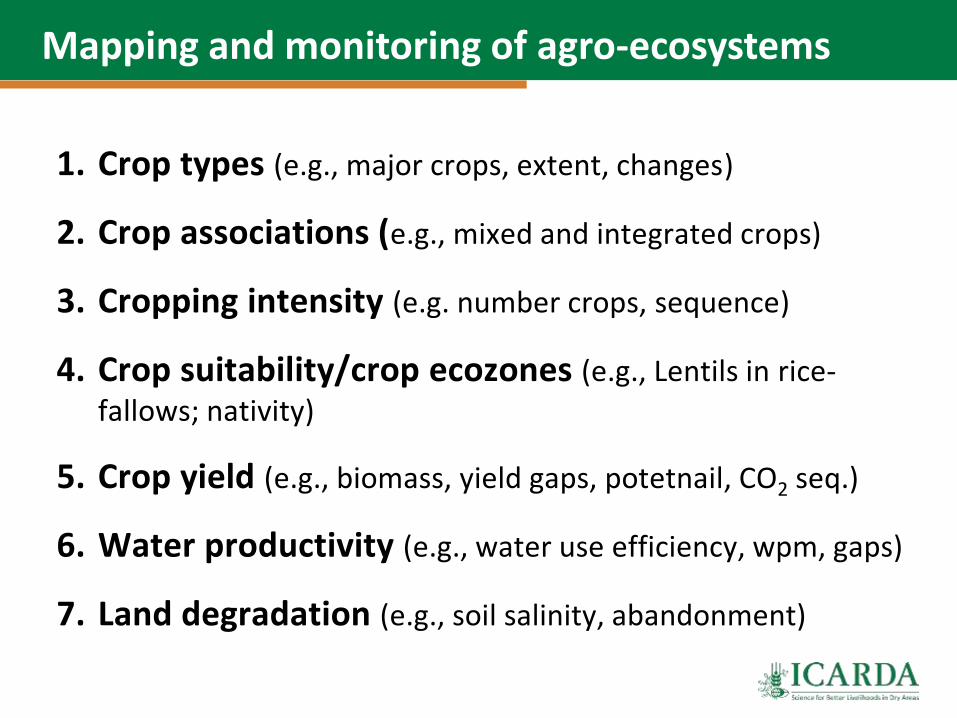
Mapping and monitoring of agro-ecosystems
1. Crop types (e.g., major crops, extent, changes)
2. Crop associations (e.g., mixed and integrated crops)
3. Cropping intensity (e.g. number crops, sequence)
4. Crop suitability/crop ecozones (e.g., Lentils in rice-fallows; nativity)
5. Crop yield (e.g., biomass, yield gaps, potetnail, CO2 seq.)
6. Water productivity (e.g., water use efficiency, wpm, gaps)
7. Land degradation (e.g., soil salinity, abandonment)
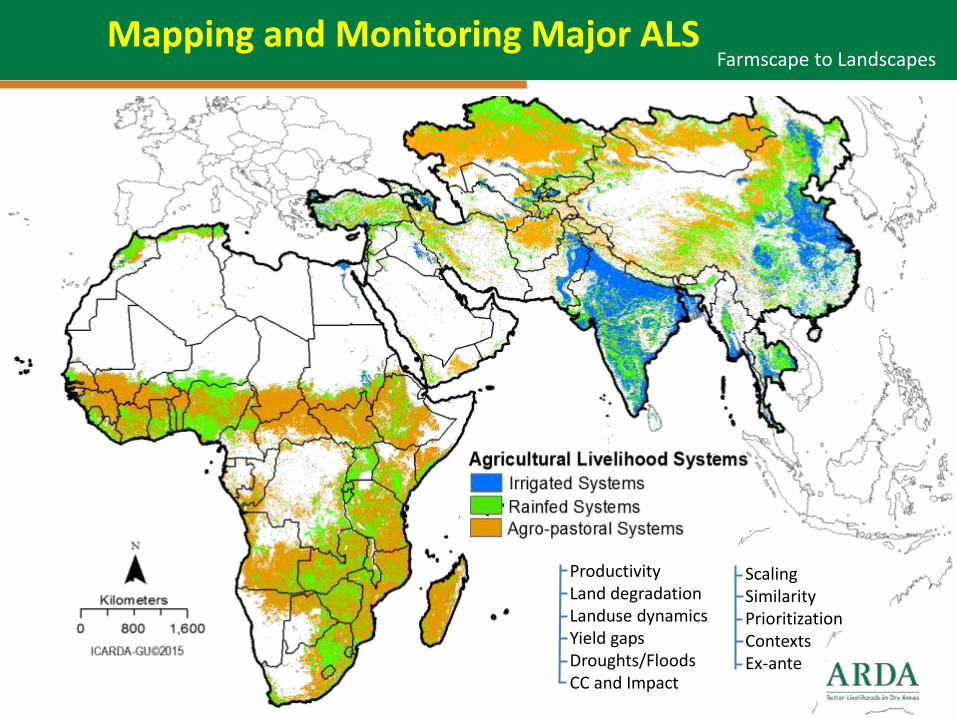
ProductivityLand degradationLanduse dynamicsYield gapsDroughts/FloodsCC and Impact
Mapping and Monitoring Major ALS
ScalingSimilarityPrioritizationContextsEx-ante
Farmscape to Landscapes
9
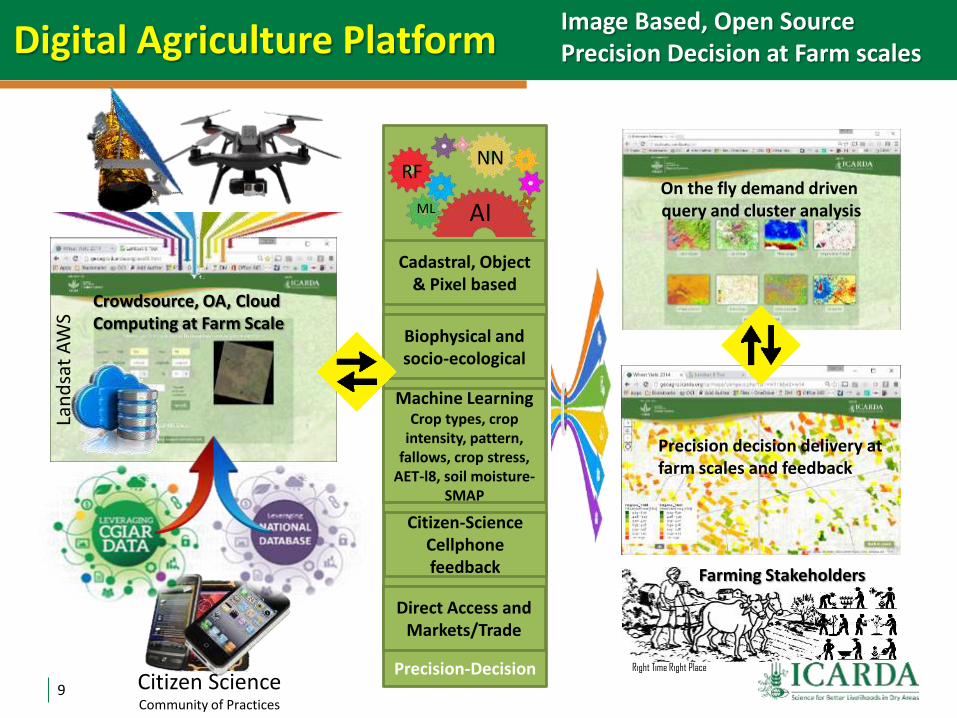
Digital Agriculture Platform
On the fly demand drivenquery and cluster analysis
Cadastral, Object & Pixel based
Biophysical and socio-ecological
Machine LearningCrop types, crop
intensity, pattern, fallows, crop stress,
AET-l8, soil moisture-SMAP
Citizen-ScienceCellphone feedback
Direct Access and Markets/Trade
Precision decision delivery at farm scales and feedback
Crowdsource, OA, CloudComputing at Farm Scale
Precision-Decision
Image Based, Open Source Precision Decision at Farm scales
Citizen ScienceCommunity of Practices
Farming Stakeholders
Lan
dsa
t A
WS
AI
NNRF
ML
Right Time Right Place
#/km2
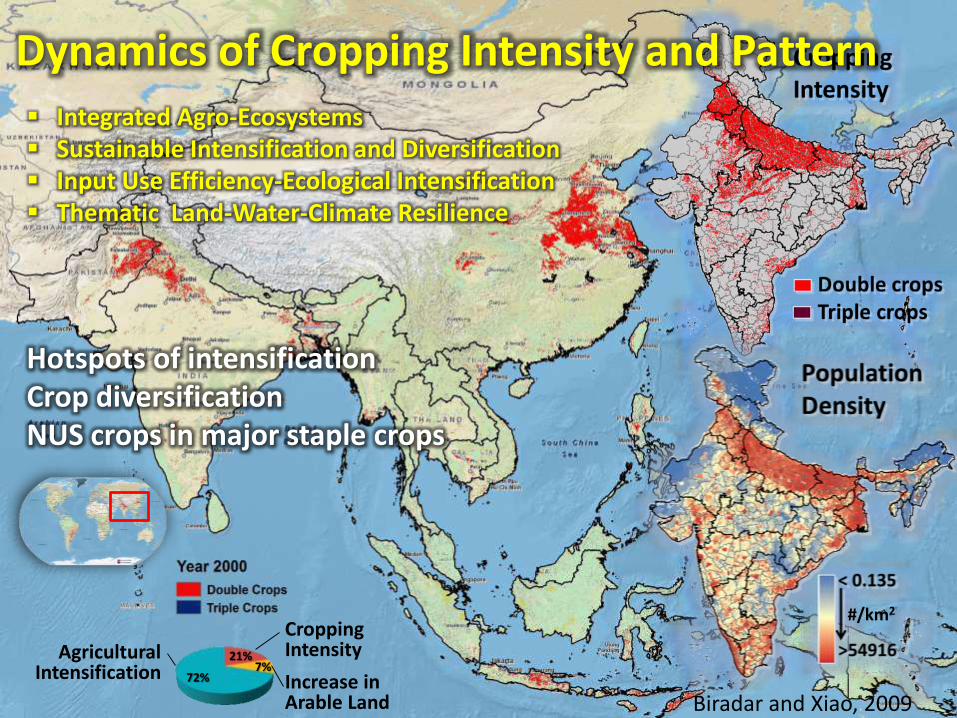
Dynamics of Cropping Intensity and Pattern Integrated Agro-Ecosystems Sustainable Intensification and Diversification Input Use Efficiency-Ecological Intensification Thematic Land-Water-Climate Resilience
Agricultural Intensification
Cropping Intensity
Increase in Arable Land
72%
21%7%
Biradar and Xiao, 2009
Hotspots of intensification Crop diversificationNUS crops in major staple crops
11
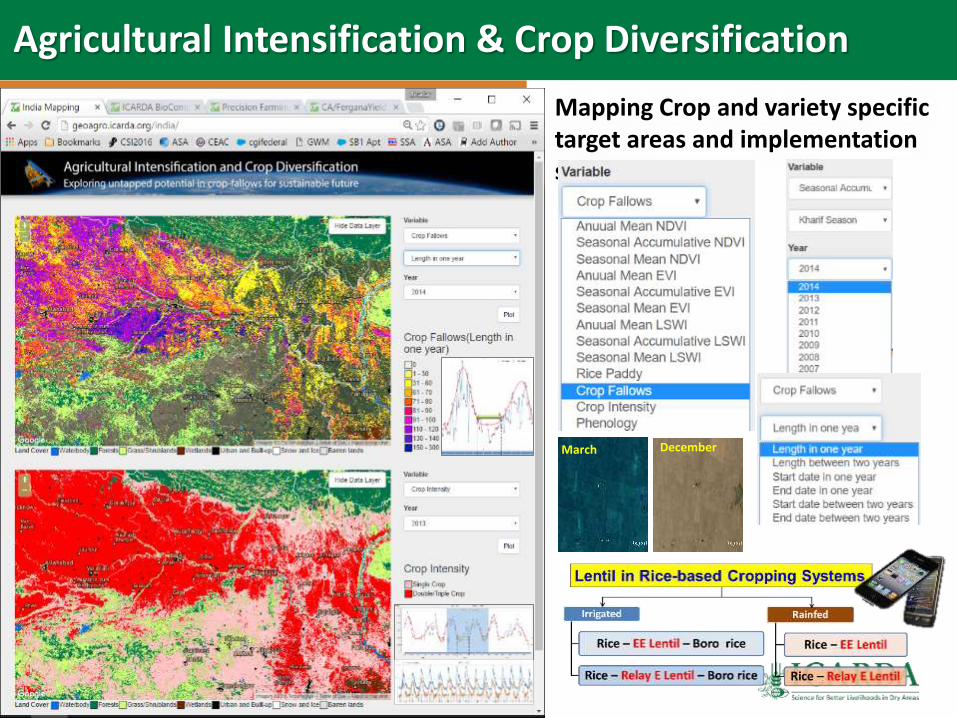
Mapping Crop and variety specific target areas and implementation strategy
March December
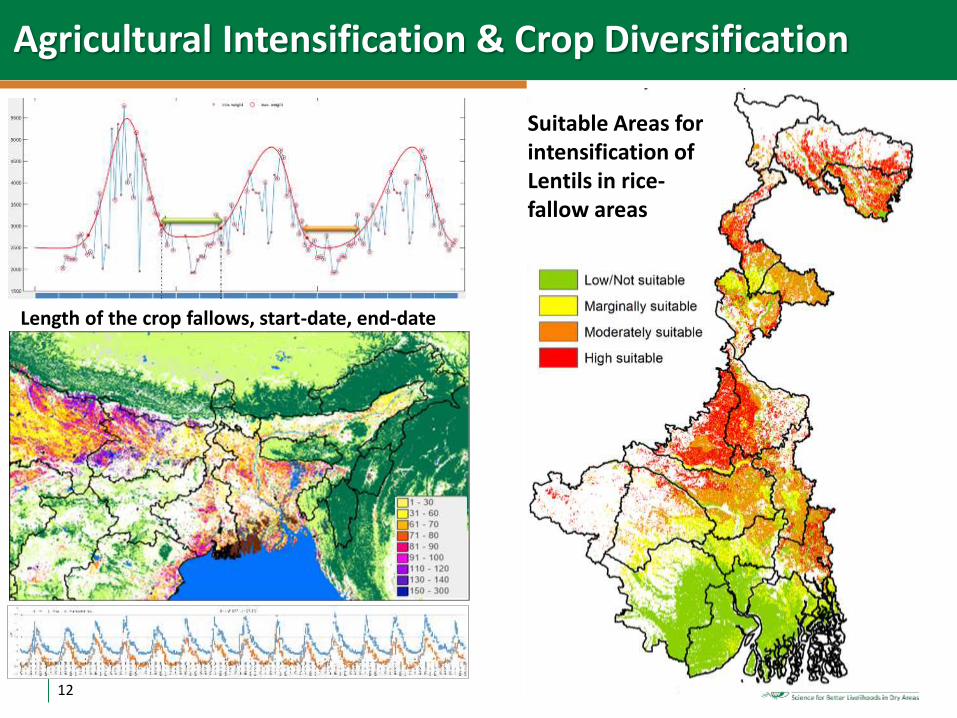
Agricultural Intensification & Crop Diversification
12
Length of the crop fallows, start-date, end-date
Suitable Areas for intensification of Lentils in rice-fallow areas
Agricultural Intensification & Crop Diversification
13
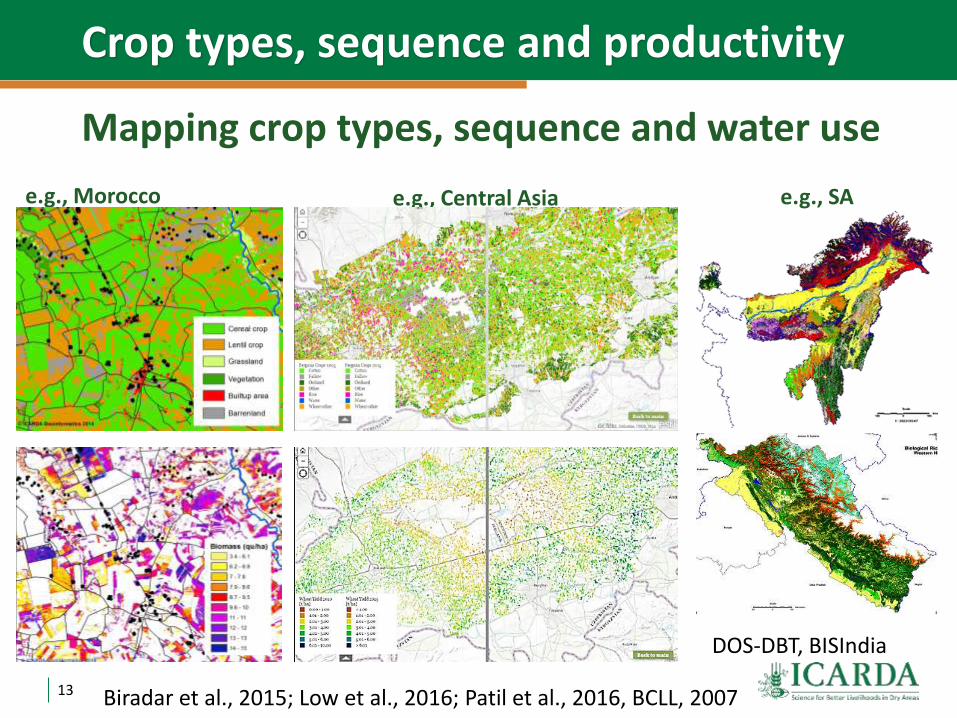
Mapping crop types, sequence and water use
e.g., SAe.g., Morocco
Biradar et al., 2015; Low et al., 2016; Patil et al., 2016, BCLL, 2007
Crop types, sequence and productivity
e.g., Central Asia
DOS-DBT, BISIndia
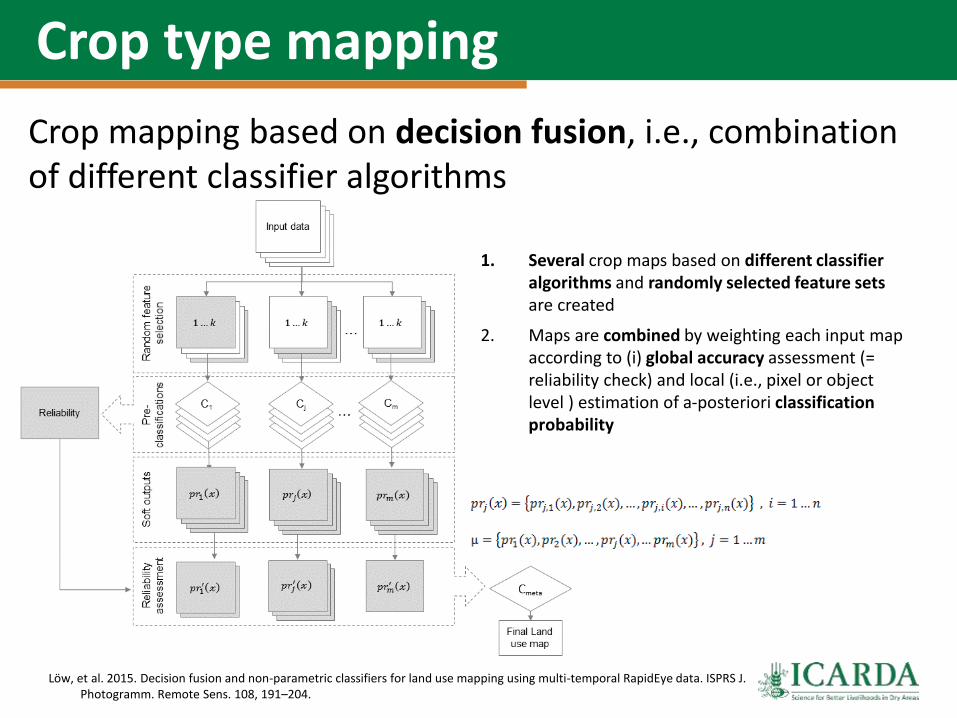
1. Several crop maps based on different classifier algorithms and randomly selected feature setsare created
2. Maps are combined by weighting each input map according to (i) global accuracy assessment (= reliability check) and local (i.e., pixel or object level ) estimation of a-posteriori classification probability
Crop mapping based on decision fusion, i.e., combination of different classifier algorithms
Löw, et al. 2015. Decision fusion and non-parametric classifiers for land use mapping using multi-temporal RapidEye data. ISPRS J. Photogramm. Remote Sens. 108, 191–204.
Crop type mapping
15
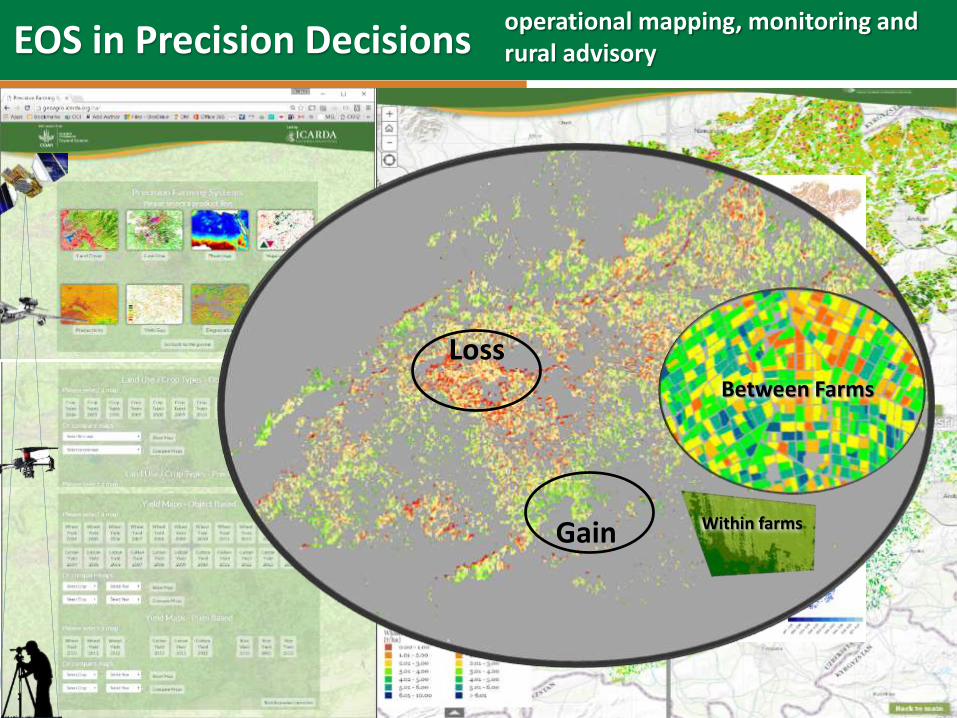
EOS in Precision Decisionsoperational mapping, monitoring and rural advisory
Yield Gaps, ET, WUE, WPMat basin, WUA, farm and within farms
Inter and intra annual dynamics of cropping systems –pattern, rotation, shift
products of crop productivity, WUE, ET, etc.
Products of land use, land cover, crop type, etc.
Loss
Gain
Between Farms
Within farms
16
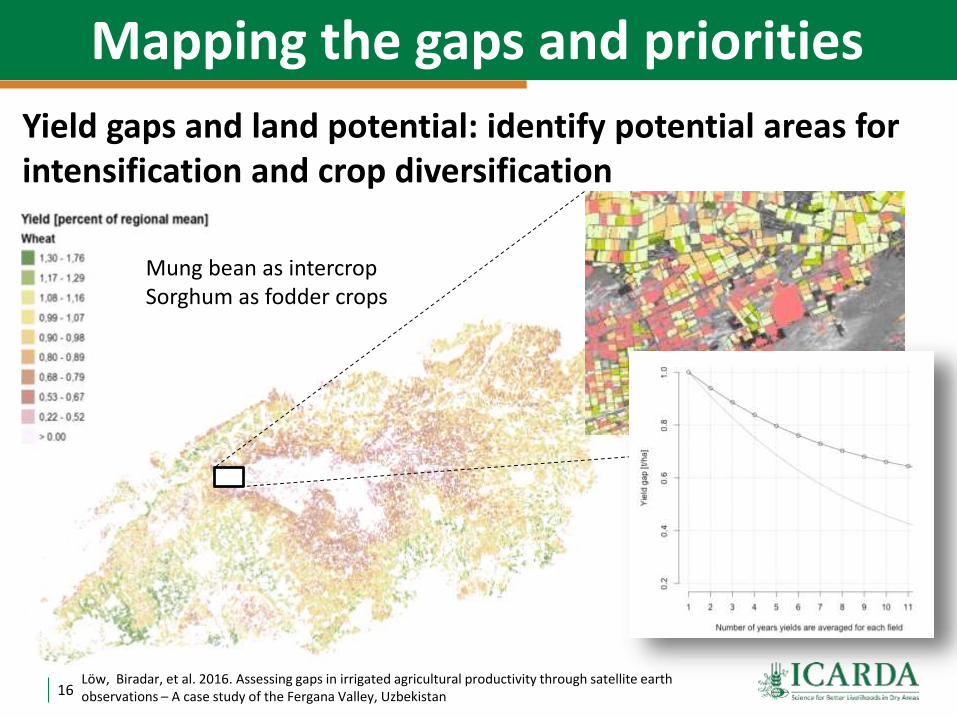
Yield gaps and land potential: identify potential areas for intensification and crop diversification
Löw, Biradar, et al. 2016. Assessing gaps in irrigated agricultural productivity through satellite earth observations – A case study of the Fergana Valley, Uzbekistan
Mapping the gaps and priorities
Mung bean as intercropSorghum as fodder crops
17
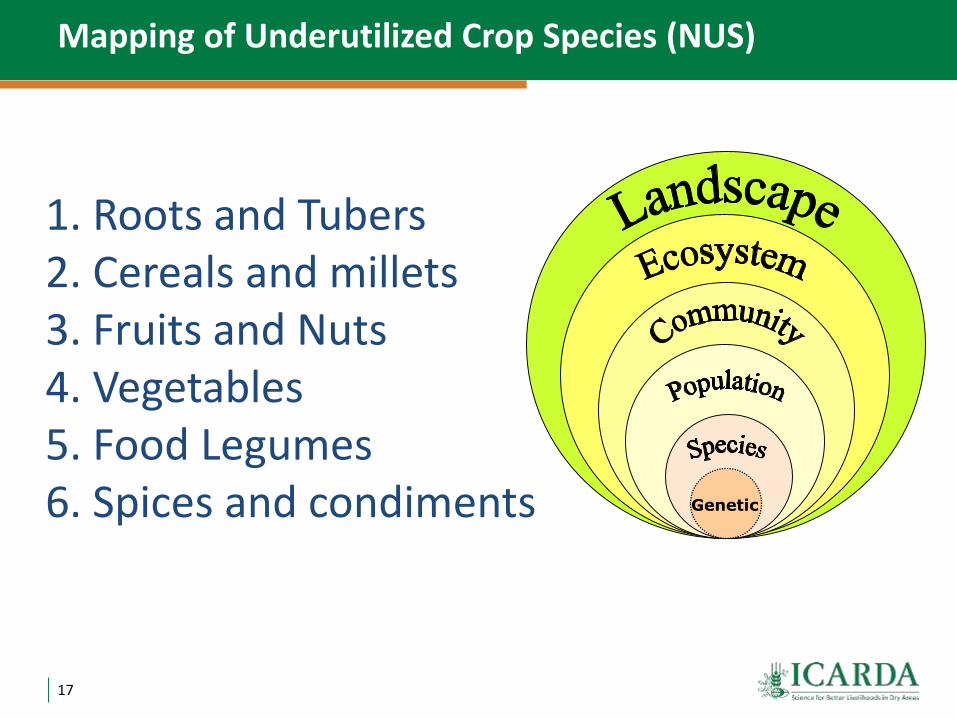
1. Roots and Tubers2. Cereals and millets3. Fruits and Nuts4. Vegetables5. Food Legumes6. Spices and condiments
Mapping of Underutilized Crop Species (NUS)
Genetic
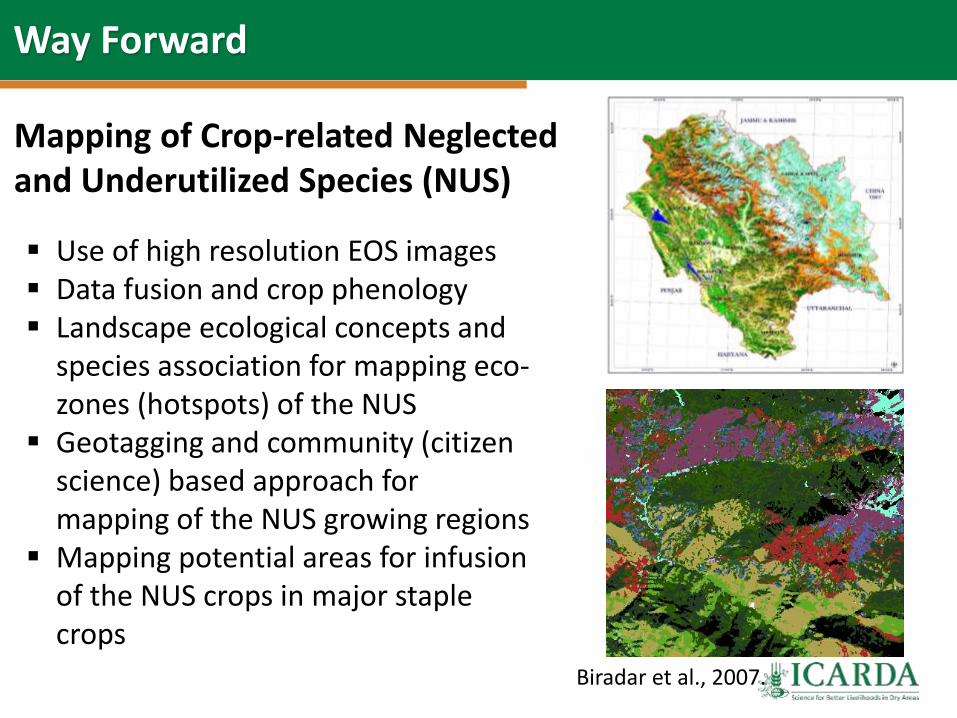
Mapping of Crop-related Neglected and Underutilized Species (NUS)
Way Forward
Use of high resolution EOS images Data fusion and crop phenology Landscape ecological concepts and
species association for mapping eco-zones (hotspots) of the NUS
Geotagging and community (citizen science) based approach for mapping of the NUS growing regions
Mapping potential areas for infusion of the NUS crops in major staple crops
Biradar et al., 2007.
19
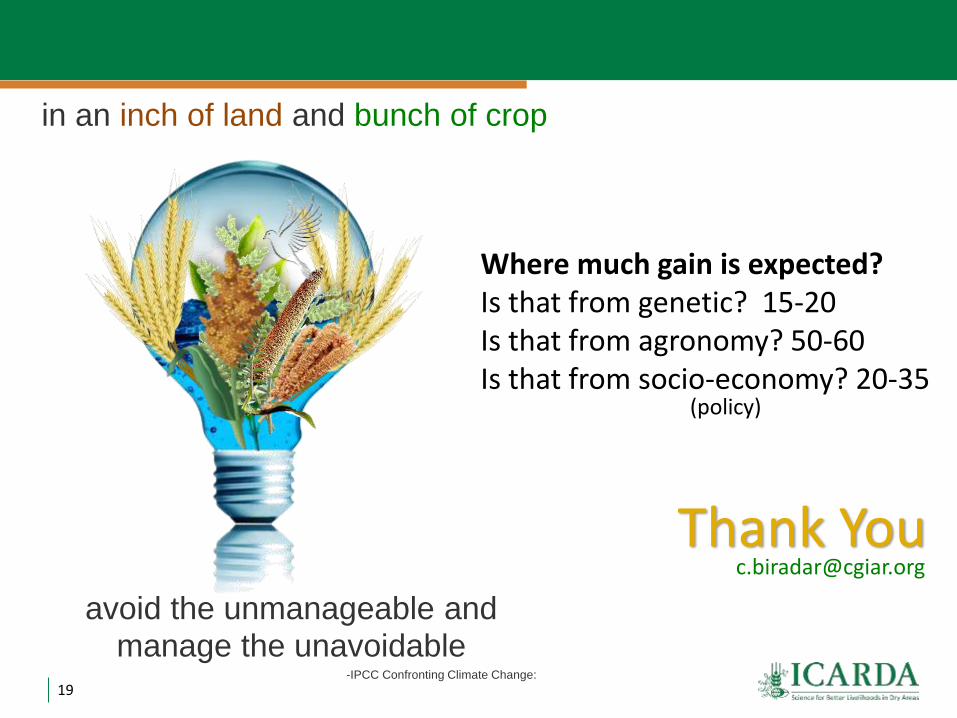
Thank [email protected]
avoid the unmanageable and manage the unavoidable
-IPCC Confronting Climate Change:
in an inch of land and bunch of crop
Where much gain is expected?Is that from genetic? 15-20Is that from agronomy? 50-60Is that from socio-economy? 20-35
(policy)


