October 2017 Economic Insight Ltd
PRICE TRANSPARENCY IN THE CONVEYANCING MARKET
A report for the Solicitors Regulation Authority
Price transparency in the conveyancing market | January 2018
1
ECONOMIC INSIGHT
CONTENTS 1. Executive summary 3
The background to our research and its objectives 3
Results relating to search and comparison behaviour 5
Conclusions and recommendations 7
Structure of this report 8
2. Background and research objectives 9
Background and context for this research 10
Our research objectives 11
3. Methodology 13
The reasons for using an online survey and online trial 14
The online survey of house buyers in England and Wales 16
The online trial involving a representative sample of consumers 17
A discussion of the trial methodology 25
The structure of the rest of this report 26

Price transparency in the conveyancing market | January 2018
2
ECONOMIC INSIGHT
4. Results relating to search and comparison behaviour 27
Finding a provider 28
Finding price information 32
5. Results relating to the choices made 36
The effects of different pricing models on choice 37
The effects of different pricing frames on choice 40
The reasons given for the choices made 41
6. Results relating to the quality of the choices made 45
Overall results 46
The effect of different pricing models on the quality of decisions 50
The effect of different pricing frames on the quality of decisions 54
7. Results relating to the reflections on the choices made 57
Respondents’ satisfaction with the choices they made 58
Participants’ confidence in the choices they made 62
Additional information that participants would have liked 63
8. Conclusions and recommendations 64
Conclusions 64
Recommendations 65

Price transparency in the conveyancing market | January 2018
3
ECONOMIC INSIGHT
1. Executive summary
The background to our research and its objectives
This report sets out the results of a programme of research commissioned by
the Solicitors Regulation Authority (SRA). The results of the research will help
inform the SRA’s approach to setting minimum disclosure requirements for
price transparency, following the conclusions of the market study conducted
by the Competition and Markets Authority (CMA) last year.
The research, which was undertaken between August and September 2017
and involved over 5,000 participants, focuses on better understanding of:
• how consumers make purchasing decisions in relation to conveyancing
services; and
• how such decisions vary by both the availability and presentation of price-
related information, as well as how consumers approach the task of
finding a conveyancing provider.
The research involved an online survey of 1,001 recent house buyers in
England and Wales and an online behavioural trial involving 4,001 participants
in England and Wales.
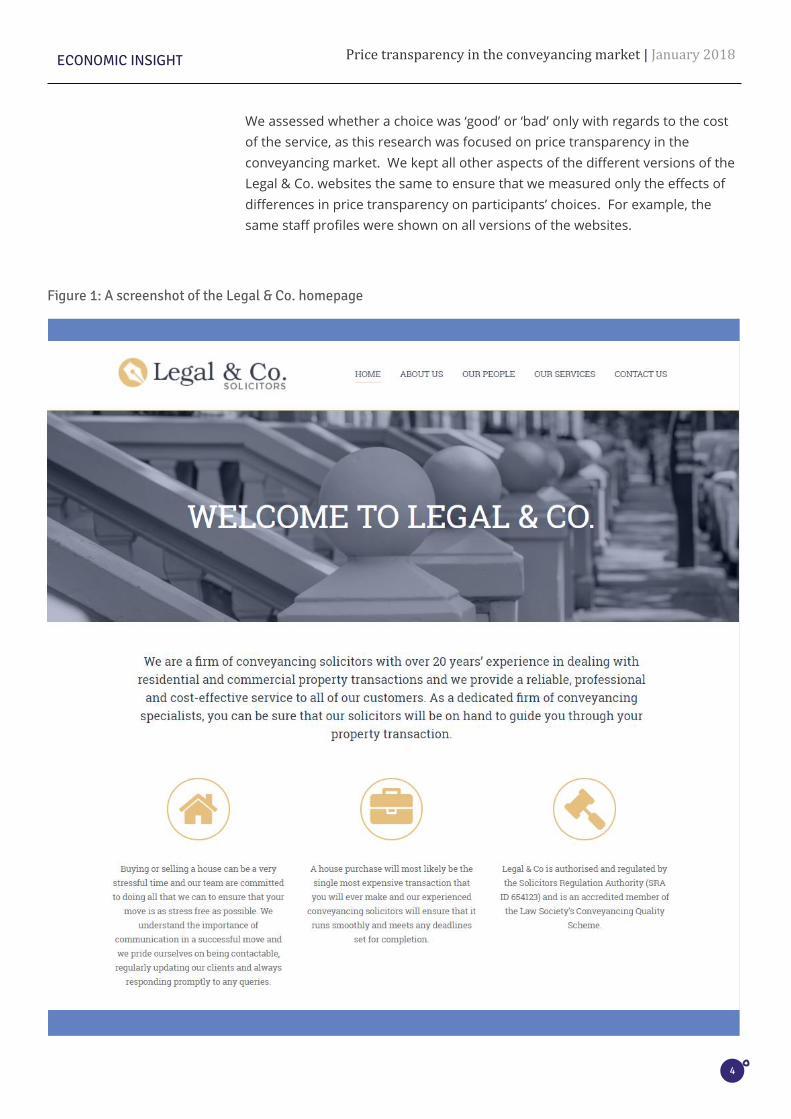
The online behavioural trial was based on a fictional conveyancing firm called
Legal & Co. which was designed to replicate examples of websites seen during
a web sweep. Participants were presented with a hypothetical situation where
they had a specific conveyancing need. They were asked to review six versions
of the Legal & Co. website (its homepage is shown in the figure overleaf), and
choose the version that they thought would best meet their needs. Three of
the versions were low cost and three of the versions were high cost, which
created the opportunity for people to make a ‘good’ or a ‘bad’ choice based on
the cost of the service.
Price transparency in the conveyancing market | January 2018
4
ECONOMIC INSIGHT
We assessed whether a choice was ‘good’ or ‘bad’ only with regards to the cost
of the service, as this research was focused on price transparency in the
conveyancing market. We kept all other aspects of the different versions of the
Legal & Co. websites the same to ensure that we measured only the effects of
differences in price transparency on participants’ choices. For example, the
same staff profiles were shown on all versions of the websites.
Figure 1: A screenshot of the Legal & Co. homepage
Price transparency in the conveyancing market | January 2018
5
ECONOMIC INSIGHT
Results relating to search and comparison behaviour
The main results of our research are as follows.
In relation to search behaviour, we found:
• House buyers have an appetite for shopping around, but they have
mixed experiences of finding the price-related information they need
to make sound decisions. 66% of respondents stated that they
considered more than one solicitor before instructing one, and 71% of
respondents stated that they spent more than one hour searching for a
solicitor online in our survey. However, 11% of respondents said that the
information was difficult or very difficult to find, and over 60% of
respondents had to contact the solicitor to find price information.
• House buyers rely heavily on the recommendations of others. Despite
the appetite and effort associated with shopping around, 72% of
respondents ultimately followed a recommendation they were given by
friends and family, or an intermediary. This is consistent with previous
research.
In relation to the choices made, we found:
• Participants found it difficult to make good price-related choices, all
other factors being equal. Only 58% of participants chose one of the
three cheapest options out of a choice of six options in our online trial.
This means that over 40% selected an option that would result in them
paying more than they had to. Though there is some evidence that women
and older groups are somewhat better at making such choices than the
average participant, all demographic groups found it difficult to choose one
of the cheapest options.
• Both the survey and the trial strongly suggest that although
consumers care about price, they do not “focus” on it when making
choices. Only 6% of respondents to the survey said that they chose a
provider because it was the cheapest and only 25% of participants in the
online trial said that they chose a website because it was the cheapest.
• When participants did focus on price they tended to choose one of the
cheaper options. Those that said they chose a website because it was the
cheapest option were around 14% more likely to choose a low cost website
compared to those that chose for another reason. Similarly, those that
could exactly recall the price of the cheapest option were nearly 60% more
likely to choose a low cost website. However, 34% of participants that said
they chose a website because it was cheapest actually chose one of the

Price transparency in the conveyancing market | January 2018
6
ECONOMIC INSIGHT
high cost websites, indicating even those participants with “price focus”
experienced difficulties.
In relation to the availability and presentation of price information, we
found:
• “One size does not fit all” in relation to pricing models. When given the
opportunity to choose in the online trial, some participants picked a fixed
fee pricing model and others opted for hourly rates or process-related
fees. This means that we did not see a strong preference for a particular
pricing model in the online trial. The house buyers in our online survey
selected both fixed fee (57%), estimated fee (29%) and hourly rate (5%)
pricing models.
• Consumers tend to make better decisions when presented with fixed-
fee pricing models compared to hourly rates, but the differences are
small and are not statistically significant. Evidence from the online trial
shows that 58% of participants made good choices when they were
presented with prices as a fixed fee, compared to 57% of participants who
were presented with hourly rates and 56% of participants who were
presented with staged / process fees. Participants who spent more than
10 minutes doing the trial tended to choose slightly more often the low
cost options under a fixed fee pricing model (62%), followed by those
presented with a staged / process fee (58%) and then the ones with hourly
rates (57%). Evidence from the online survey shows that there is a net
overpayment rate of 13% across all pricing models. This is significantly
higher under non-fixed fee pricing models (26%) compared to 12% of
respondents who said they paid a fixed fee (and overpaid).
• Rather, the pricing frame – which influenced how much effort
participants had to expend to find price information – affects the
quality of decisions. 62% of participants made good choices when prices
were readily available on the homepage of the website, compared to 57%
of participants when prices had to be sought by filling out an online form (a
9% improvement). This difference is statistically significant.

Price transparency in the conveyancing market | January 2018
7
ECONOMIC INSIGHT
Conclusions and recommendations
We suggest that the research points to the following conclusions:
• This research supports the view that increasing the availability of price-
related information is likely to improve consumer decision-making in
relation to conveyancing services, as previously concluded by the CMA for
legal services more generally.
• The research additionally suggests that increasing consumers’ “price focus”
– which itself may be influenced by increasing the availability of price-
related information – will also contribute to improvements in consumer
decision-making. Legal services providers therefore will have a part to play
in being upfront with pricing information to help consumers to make
decisions.
• The research is not clear cut on the effect of different pricing models on
the quality of consumer decision-making.
• The research suggests that, all other factors being equal, consumers make
better decisions when prices are “easier to access”. We found that the best
decisions in the online trial were made when prices were available on the
home page of the Legal & Co. website, compared to prices being ‘two clicks’
away or obtainable via an online form.
• Further, this research suggests that intermediaries, such as estate agents
and financial advisors, could play an important role in helping to increase
the availability of price-related information and consumers’ “price focus”,
as a large proportion of consumers appears to follow their
recommendations.
In relation to the first and second conclusions above, we suggest that the SRA
considers exploring the following recommendations.
• There is a good case for considering whether there are ways of increasing
“price focus” amongst consumers, alongside increasing price transparency
amongst legal services providers. This is not a straightforward thing to do.
The Legal Choices website, run by frontline regulators, provides consumers
with information on important matters when they have to make choices
regarding legal issues and lawyers. One possibility would be to ensure that
the Legal Choices website makes clear that consumers have a choice of
price, as well as a choice of provider.
• Some consumers pay more than they expected to. This raises various
questions, for example why does it happen and what could be done about
it? One way of addressing this issue for consumers paying under a fixed
fee pricing model would be to have a common definition of a what an “all-

Price transparency in the conveyancing market | January 2018
8
ECONOMIC INSIGHT
inclusive fixed fee” pricing model is. That is, if a legal services provider
adopts such a pricing model, consumers should expect to pay no more
than the fixed fee quoted – otherwise is it right to advertise it as a “fixed
fee”?
• Regarding minimum disclosure price requirements, we note that the SRA is
consulting on asking those it regulates to publish more price-related
information on their websites. This research is supportive of this approach
and additionally suggests that the SRA might usefully consider providing
guidance on how and when price-related information is provided (which
influences the effort that consumers must expend to find it) as well as
what price-related information is provided.
Structure of this report
The rest of this report is split into the following sections.
• Section 2 sets out the background to this research and its main objectives.
• Section 3 sets out our methodology, including details of the online survey
and online trial.
• Sections 4 to 7 set out the key results of our research, organised by the
stages of a customer journey.
• Section 8 sets out our conclusions and recommendations.
• Appendices contain a copy of the online survey and equivalent
information for the online trial. They also contain results referred to in the
main body of the report.

Price transparency in the conveyancing market | January 2018
9
ECONOMIC INSIGHT
2. Background and research objectives
This section briefly sets out the background and context for this research
and our research objectives.
• Previous studies concluded that there is a lack of price transparency in the
supply of legal services, including conveyancing. Research undertaken for
the Legal Services Board (LSB) found that only a small proportion of
conveyancing firms advertise prices online, but that those who do advertise
tend to be cheaper than those who do not. This could result in consumers
being less able to compare between different providers and potentially
paying a higher price than they would need to.
• Consequently, the Competition and Markets Authority (CMA) recommended
that frontline regulators, including the SRA, should set new minimum
standards for price transparency to help consumers navigate their options.
• To help decide what the minimum standards should be, the CMA also
recommended that frontline regulators undertake consumer testing to
better understand how consumers make decisions in the legal services
market.
• The objective of this research is to advance our understanding of: (a) how
consumers make decisions in relation to conveyancing; and (b) how
decisions are affected by the way prices are communicated and presented.
The SRA asked us to study the conveyancing market primarily because
many consumers are likely to face a conveyancing need in their life time.

Price transparency in the conveyancing market | January 2018
10
ECONOMIC INSIGHT
Background and context for this research
2.1.1 Previous studies have shown that there is a lack of price transparency
Several previous studies have shown that there is a lack of price transparency
in the supply of legal services, including conveyancing. This includes previous
research undertaken by the Legal Services Board (LSB), the SRA and the CMA.
• Research undertaken for the LSB found that only a small proportion of
conveyancing firms advertise prices online (10%). It also found that firms
that do advertise prices online tend to be cheaper than those that do not,
though none of these apparent differences were statistically significant, as
shown in the table below.1
Table 1: Conveyancing prices summary, by whether prices are advertised on website
Mean price Display prices on website
Yes No / No website
Sale (freehold) £595 (50) £645 (450)
Sale (leasehold) £672 (50) £736 (450)
Purchase (freehold) £708 (50) £725 (450)
Purchase (leasehold) £799 (50) £817 (450)
Sale & purchase (freehold)
£1,220 (50) £1,291 (450)
Source: OMB Research (2016), “Prices of Individual Consumer Legal Services: Research Report”, p. 15. The numbers in brackets represent the number of respondents that answered in that category.
• Research undertaken for the SRA found that 91% of people paid for their
conveyancing service via fixed fee, but one in nine said the final cost was
higher than quoted. The majority of respondents felt the costs in their
transaction were affordable but just over a quarter found they were more
than they expected.2
• Similarly, research undertaken by the CMA found that 45% of consumers
had “no idea what cost would be involved in their legal work before they
made direct contact with a legal services provider”.3
1 OMB Research (2016), “Prices of Individual Consumer Legal Services: Research Report”, p. 15. 2 IFF Research (2017), “Understanding the experiences of conveyancing legal services”, p. 3. 3 CMA (2016), “Legal services market study: Final report”, p.61.

Price transparency in the conveyancing market | January 2018
11
ECONOMIC INSIGHT
2.1.2 The CMA recommended that regulators should set new minimum standards
In view of the difficulties that consumers face in finding information in
relation to legal services, the CMA concluded in December 2016 that “the legal
services sector is not working well” because there is “very little transparency
about price, service and quality.”4
The CMA called on regulators, including the SRA, to set new minimum
standards for price transparency. In doing so, the CMA set out its views on
what the “minimum disclosure requirements” for price transparency should
be. These included:
- the pricing and charging model;
- hourly fees (where charged) by grade of staff;
- (where offered) indicative fixed fees and factors that may affect these
and the circumstances where additional fees may be charged;
- typical range of costs for different stages of cases (where appropriate);
- scale of likely disbursements (e.g. searches, court fees); and
- key factors that determine price (including disbursements).5
Importantly, the CMA noted that “one size does not fit all” and it is for the
individual regulators to “assess their own regulatory requirements and the
relevance of our recommendations to the services that their regulated
professionals offer”.6
Our research objectives
To help work out what the appropriate minimum standards should be, the
CMA also recommended that work – including consumer testing – should be
undertaken to identify how consumers make decisions in the legal services
market.
The overarching objective of this research is to meet this recommendation in
relation to conveyancing and, in doing so, advance our understanding of both:
- how consumers make decisions in relation to conveyancing; and
- how decisions are affected by the way prices are communicated and
presented.
Our study’s focus is on the conveyancing market primarily because many
consumers are likely to face a conveyancing need in their life time.
4 CMA (2016), “Legal services market study: Final report”, p.4. 5 CMA (2016), “Legal services market study: Final report”, p.228. 6 Ibid.
Price transparency in the conveyancing market | January 2018
12
ECONOMIC INSIGHT
As part of this, we set out to better understand the following issues:
• How consumers searched for conveyancing services, including where
they looked and how long they spent on the task.
• What price and non-price factors influenced their choice of conveyancing
solicitor.
• The extent to which consumers’ expectations were met in terms of the
service they received and what they paid for it.
• The extent to which consumers made good decisions in relation to the
price of conveyancing services along with the internal and external factors
that affect their ability to do so.
• Finally, and relatedly, the extent to which different pricing models (such
as fixed fees versus hourly rates) and pricing frames or presentations
(such as how easily consumers can find price information) affect the
quality of decisions they made.
To achieve these objectives, we undertook an online survey of 1,001 recent
house buyers in England and Wales and an online trial involving 4,001
consumers in England and Wales. The next section sets out the details of our
methodology.
Price transparency in the conveyancing market | January 2018
13
ECONOMIC INSIGHT
3. Methodology
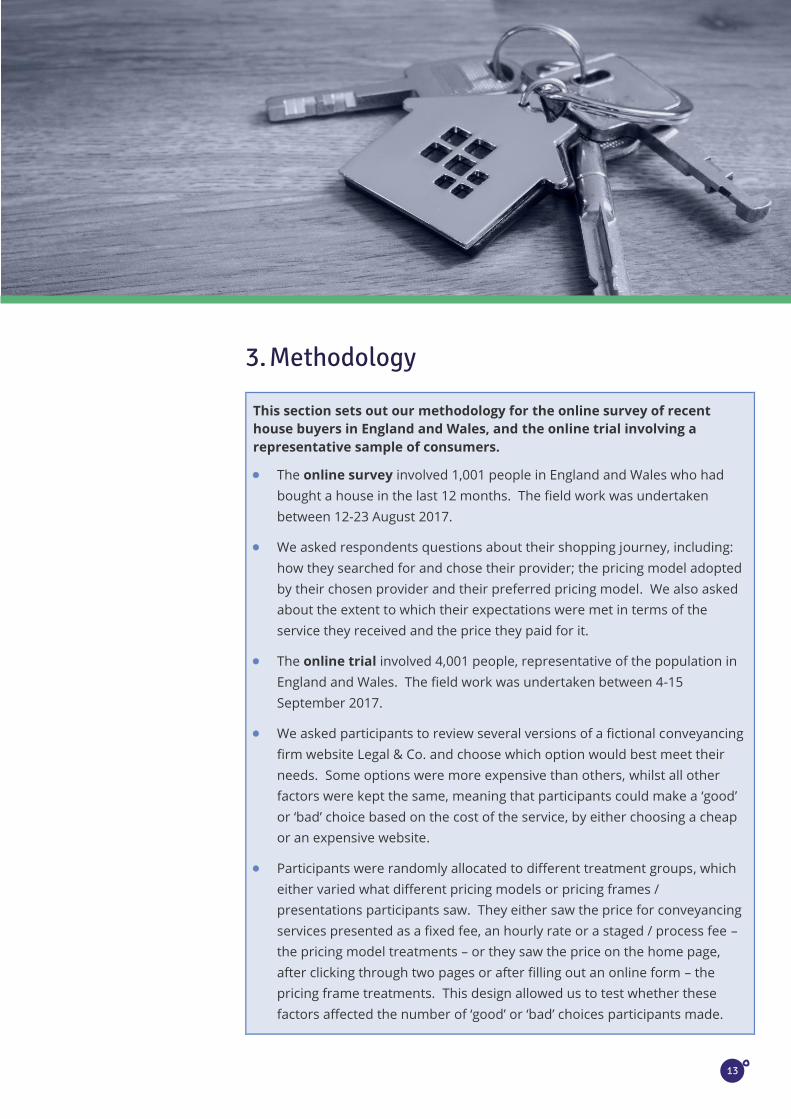
This section sets out our methodology for the online survey of recent
house buyers in England and Wales, and the online trial involving a
representative sample of consumers.
• The online survey involved 1,001 people in England and Wales who had
bought a house in the last 12 months. The field work was undertaken
between 12-23 August 2017.
• We asked respondents questions about their shopping journey, including:
how they searched for and chose their provider; the pricing model adopted
by their chosen provider and their preferred pricing model. We also asked
about the extent to which their expectations were met in terms of the
service they received and the price they paid for it.
• The online trial involved 4,001 people, representative of the population in
England and Wales. The field work was undertaken between 4-15
September 2017.
• We asked participants to review several versions of a fictional conveyancing
firm website Legal & Co. and choose which option would best meet their
needs. Some options were more expensive than others, whilst all other
factors were kept the same, meaning that participants could make a ‘good’
or ‘bad’ choice based on the cost of the service, by either choosing a cheap
or an expensive website.
• Participants were randomly allocated to different treatment groups, which
either varied what different pricing models or pricing frames /
presentations participants saw. They either saw the price for conveyancing
services presented as a fixed fee, an hourly rate or a staged / process fee –
the pricing model treatments – or they saw the price on the home page,
after clicking through two pages or after filling out an online form – the
pricing frame treatments. This design allowed us to test whether these
factors affected the number of ‘good’ or ‘bad’ choices participants made.

Price transparency in the conveyancing market | January 2018
14
ECONOMIC INSIGHT
The reasons for using an online survey and online trial
Before describing the online survey and online trial in detail, we comment
briefly here on their advantages and limitations. We also set out in more
detail what a trial is.
The methods complement each other because they help measure different
things and have different strengths and weaknesses. We provide a more
detailed discussion of these in section 3.4.
• The main advantage of the online survey is that it helps us to better
understand the search and choice behaviour of actual house buyers based
on their recollections of what they did and why they did it.
• The main limitations of the online survey are that it relies on accurate
recall and that “behavioural biases” may lead to consumers answering
questions in a way that does not reflect how they would actually behave in
certain situations.
• The main advantage of the online trial is that it allows us to test how
consumers’ decisions would change with different price-related
information in a controlled environment. We set out in more detail what a
trial is below and discuss the merits of this methodology at the end of this
chapter.
3.1.1 Randomised controlled trials
Randomised controlled trials (RCTs), used interchangeably throughout this
report with “trials”, are another research method in the regulator’s toolkit.
One of the main advantages of a trial is that it allows us to observe how
consumers actually respond to a potential policy intervention or market
change in a controlled environment.
The simplest trial is to divide a target population into two groups: the control
group, who receives no intervention (i.e. no changes from the status quo) and
the treatment group, who faces changes (i.e. policy intervention). The key
step in trials is to ensure that the individuals in the two groups are as closely
matched as possible, so that the two groups are equivalent with respect to all
key factors such as socioeconomic status and gender. This is achieved by
randomly allocating individuals to the control and treatment groups. After the
policy has been introduced and implemented in the treatment group, the
change in the outcome variable between the control and treatment group can
be solely assigned to the policy intervention.
The following figure shows an example of an image of an RCT. Here, the
effectiveness of a new “smoking cessation” programme, assisting people who
are trying to stop smoking, is being tested. The target population is randomly
divided into two groups of the same size, where the control group receives the
current intervention while the treatment group is provided with the new
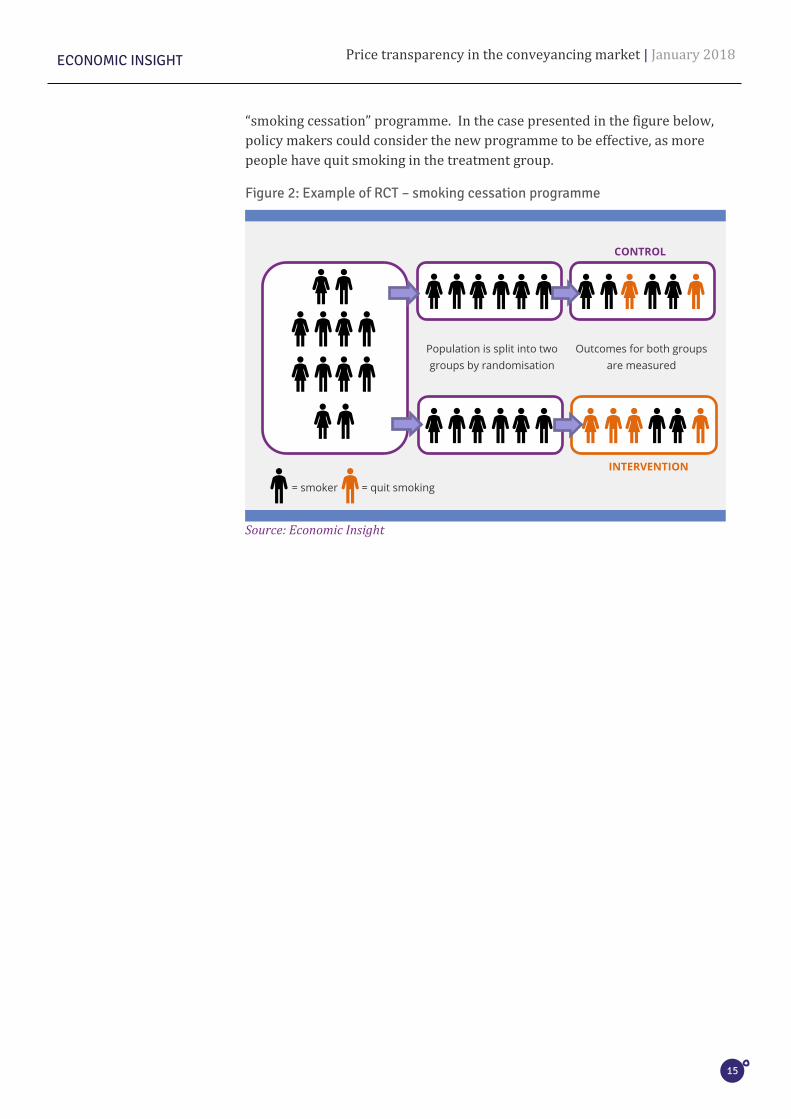
Price transparency in the conveyancing market | January 2018
15
ECONOMIC INSIGHT
“smoking cessation” programme. In the case presented in the figure below,
policy makers could consider the new programme to be effective, as more
people have quit smoking in the treatment group.
Figure 2: Example of RCT – smoking cessation programme
Source: Economic Insight
Population is split into two
groups by randomisation
Outcomes for both groups
are measured
= smoker = quit smoking
CONTROL
INTERVENTION
Price transparency in the conveyancing market | January 2018
16
ECONOMIC INSIGHT
The online survey of house buyers in England and Wales
We conducted an online survey on consumers’ experiences of conveyancing,
specifically on the pricing aspect thereof, to gather information providing
invaluable insights on:
- the consumer search and shopping journey in relation to
conveyancing;
- consumer preferences on pricing models; and
- to inform our online consumer trial.
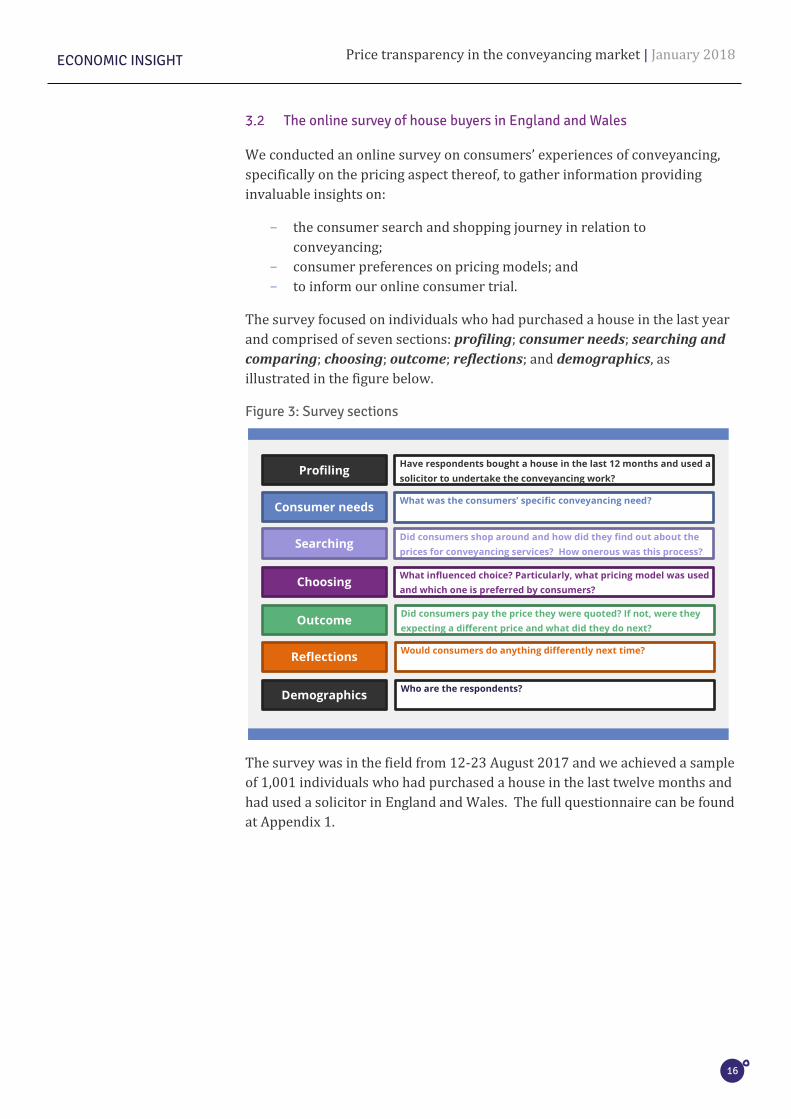
The survey focused on individuals who had purchased a house in the last year
and comprised of seven sections: profiling; consumer needs; searching and
comparing; choosing; outcome; reflections; and demographics, as
illustrated in the figure below.
Figure 3: Survey sections
The survey was in the field from 12-23 August 2017 and we achieved a sample
of 1,001 individuals who had purchased a house in the last twelve months and
had used a solicitor in England and Wales. The full questionnaire can be found
at Appendix 1.
Profiling
Consumer needs
Searching
Choosing
Outcome
Reflections
Demographics
Have respondents bought a house in the last 12 months and used a
solicitor to undertake the conveyancing work?
What was the consumers’ specific conveyancing need?
Did consumers shop around and how did they find out about the
prices for conveyancing services? How onerous was this process?
What influenced choice? Particularly, what pricing model was used
and which one is preferred by consumers?
Did consumers pay the price they were quoted? If not, were they
expecting a different price and what did they do next?
Would consumers do anything differently next time?
Who are the respondents?

Price transparency in the conveyancing market | January 2018
17
ECONOMIC INSIGHT
The online trial involving a representative sample of consumers
Here, we set out the methodology for our online trial, including:
- the objectives of the trial;
- key features of the trial design, including considerations relating to
sample and incentive design; and
- activities undertaken by participants before, during and after the trial.
3.3.1 Objectives of the trial
Our online trial was designed to mimic a search and shopping experience that
most consumers are familiar with: comparing offers on suppliers’ websites.7
We opted for this approach (as opposed to a lab-based or field trial) for
practical and external validity reasons:
• An online trial was the most practical option for this study. Properly
engaging with price comparison websites and / or firms for a field trial
was not possible in the time available for this research and due to the
recommendations of the CMA.
• An online trial offers external validity. It allowed us to contact a wide
range of relevant consumers, whereas lab experiments tend to use
students. Moreover, it reflects how (at least in future) it is expected that
consumers will, in fact, search and choose conveyancing services.
Previous research suggested that it is important to distinguish between the
effects of different:
- pricing models – fixed fees, hourly rates etc.; and
- frames – i.e. how price information is presented, focusing on how easy
it is to find it.
Therefore, we undertook two “sub-trials” to examine this: a pricing model trial
looking at the effect of pricing models on consumer decision making and a
frames trial looking at the how the presentation of pricing information affect
consumer choice. Each trial had three treatment groups, set out in the figure
overleaf. Participants were randomly assigned to one of the six treatment
groups.
7 One difference between our online trial and a real search and shopping experience, is that the online trial involved comparing different “offers” from the same firm, rather than comparing different offers from different firms. The reasons for this difference are discussed later in this section.

Price transparency in the conveyancing market | January 2018
18
ECONOMIC INSIGHT
Figure 4: Summary of sub-trials and treatments
The different treatment groups allowed us to test the following specific
hypotheses:
• Hypothesis 1: Consumers will make better choices when presented with a
fixed fee pricing model, compared to an hourly rate or a fees by process
stage model.
• Hypothesis 2: Consumers will make better choices when presented with a
fees by process stage pricing model, compared to an hourly rate.
• Hypothesis 3: Consumers will make better choices in a ‘no clicks’ frame,
compared to a ‘two clicks’ frame or an ‘online form’ frame.
3.3.2 Key features of the trial design
The key features of the trial design are as follows:
• Participants in each treatment group saw six versions of a Legal & Co.
website, which we created for this research. For example, participants in
the pricing model trial in the fixed fee treatment would see six different
versions of a fixed fee pricing model and consumers in the hourly rate
treatment would see six different versions of an hourly rate pricing model.
The following figure shows a screenshot of the website and Appendix 2.2
contains screenshots of the websites for each of the different treatments.
Pri
cin
g m
od
el
tria
l F
ram
es
tria
l
Fixed fee. A single fixed fee in £s is presented for the legal advice for conveyancing.
No clicks. The pricing information is available on the ‘home’ page.
Hourly rate. An hourly fee rate in £s is presented for the legal advice required for
conveyancing, alongside the estimated amount of hours it would take to complete the
matter.
Two clicks. The pricing information is only available after two clicks – from the ‘home’
page to the ‘our services’ page, and from there to the ‘our prices’ page.
Process fee. The conveyancing process is split into three main stages: (i) pre-exchange;
(ii) pre-completion; and (iii) post-completion. A single fixed fee in £s is given for the
legal advice at each stage in the process.
Online form. The pricing information is available on the ‘home’ page after the
respondent has filled out an online form requesting personal details.
Treatments
Price transparency in the conveyancing market | January 2018
19
ECONOMIC INSIGHT
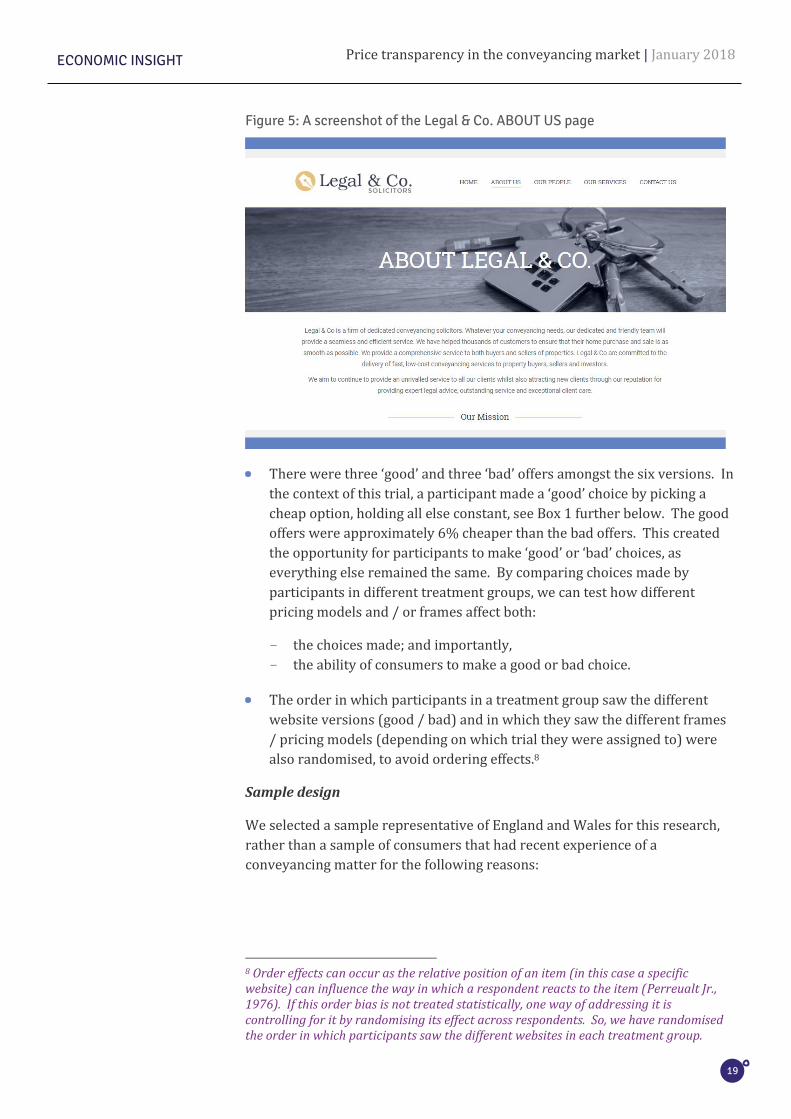
Figure 5: A screenshot of the Legal & Co. ABOUT US page
• There were three ‘good’ and three ‘bad’ offers amongst the six versions. In
the context of this trial, a participant made a ‘good’ choice by picking a
cheap option, holding all else constant, see Box 1 further below. The good
offers were approximately 6% cheaper than the bad offers. This created
the opportunity for participants to make ‘good’ or ‘bad’ choices, as
everything else remained the same. By comparing choices made by
participants in different treatment groups, we can test how different
pricing models and / or frames affect both:
- the choices made; and importantly,
- the ability of consumers to make a good or bad choice.
• The order in which participants in a treatment group saw the different
website versions (good / bad) and in which they saw the different frames
/ pricing models (depending on which trial they were assigned to) were
also randomised, to avoid ordering effects.8
Sample design
We selected a sample representative of England and Wales for this research,
rather than a sample of consumers that had recent experience of a
conveyancing matter for the following reasons:
8 Order effects can occur as the relative position of an item (in this case a specific website) can influence the way in which a respondent reacts to the item (Perreualt Jr., 1976). If this order bias is not treated statistically, one way of addressing it is controlling for it by randomising its effect across respondents. So, we have randomised the order in which participants saw the different websites in each treatment group.

Price transparency in the conveyancing market | January 2018
20
ECONOMIC INSIGHT
• Most importantly, it eliminates a risk that the answers given by those with
recent experience will be influenced by the choices they recently made
(e.g. status quo and anchoring biases).
• Any change in regulation in this area is more likely to affect those
consumers that have not recently bought a house.
• The sample representative of England and Wales allows us to include
more consumers in the trial.
• Information was given to participants at the start of the trial to help them
understand what conveyancing is and profiling questions were added at
the end of the trial to help understand whether different groups behave
differently (e.g. those that have recently bought a house versus those that
have no immediate intention of buying a house).
Again, as with our online house buyer survey, this sample is somewhat self-
selected and as such not totally representative of the population of England
and Wales, but rather of the population of England and Wales that is online
literate.
Incentives
We further considered whether and what type of incentives to provide in this
trial. Incentives are given to participants for two reasons:
- first, to help mimic the different financial and non-financial
consequences that different actions have in real-life; and
- second, to ensure that participants take the task “seriously” (as
opposed to randomly choosing any option to complete the survey
quickly).
Our view is that the main reason for providing an incentive in this trial is to
ensure that participants take the task seriously. We doubt that an incentive
could mimic the financial and non-financial incentives at play in the context of
conveyancing.
With this in mind, we told participants that they would be entered into a prize
draw for an iPad mini if they made a “good” choice.
3.3.3 Activities undertaken by participants before, during and after the trial
The trial was administered online between 4-15 September 2017 and was
framed as an online searching and shopping exercise. The figure overleaf
shows the main activities undertaken by participants before, during and after
the trial.

Price transparency in the conveyancing market | January 2018
21
ECONOMIC INSIGHT
Figure 6: Main features of our methodology
Information (pre-trial)
At the beginning of the online trial, each participant was given information
about what conveyancing is. This was necessary because some participants
may not have been familiar with this service, if they had not bought or sold a
property.
Participants were also given information about the conveyancing scenario
they are in (i.e. the purchase of a house worth £235k) for the purpose of the
trial. This information was necessary to allow participants to work out which
offer was best for them during the website review. We chose this value based
on the average price for a house in England and Wales of £232,478 in May
2017. 9
The nature of the task was also described to them and they were told the
consequences of making a good or bad choice (with the consequence of a
good choice being an entry into a prize draw), as well as being re-assured that
any personal details that they entered into the websites during the trial would
not be stored or used in any other way.
Website review (trial)
Participants in each treatment group reviewed six websites that “mimicked”
solicitors’ websites under the Legal & Co. brand.
• In the pricing model trial, different treatment groups saw different pricing
models, with common frames.
9 HM Land Registry (2017), “UK House Price Index May 2017”.
1. Information
(pre-trial)
2. Website review (trial)
3. Choice (trial)
4. Questions (post-trial)
Price transparency in the conveyancing market | January 2018
22
ECONOMIC INSIGHT
• In the frames trial, different treatment groups saw different frames, with
common pricing models.
They also shared the same firm name, branding and overall look. This was to
ensure that the trial tests the effects of changing pricing models / frames, not
changes in the way the website looks. This involved some sacrifice of external
validity, but we believe it was worthwhile to avoid capturing the effect of
changes in website design.
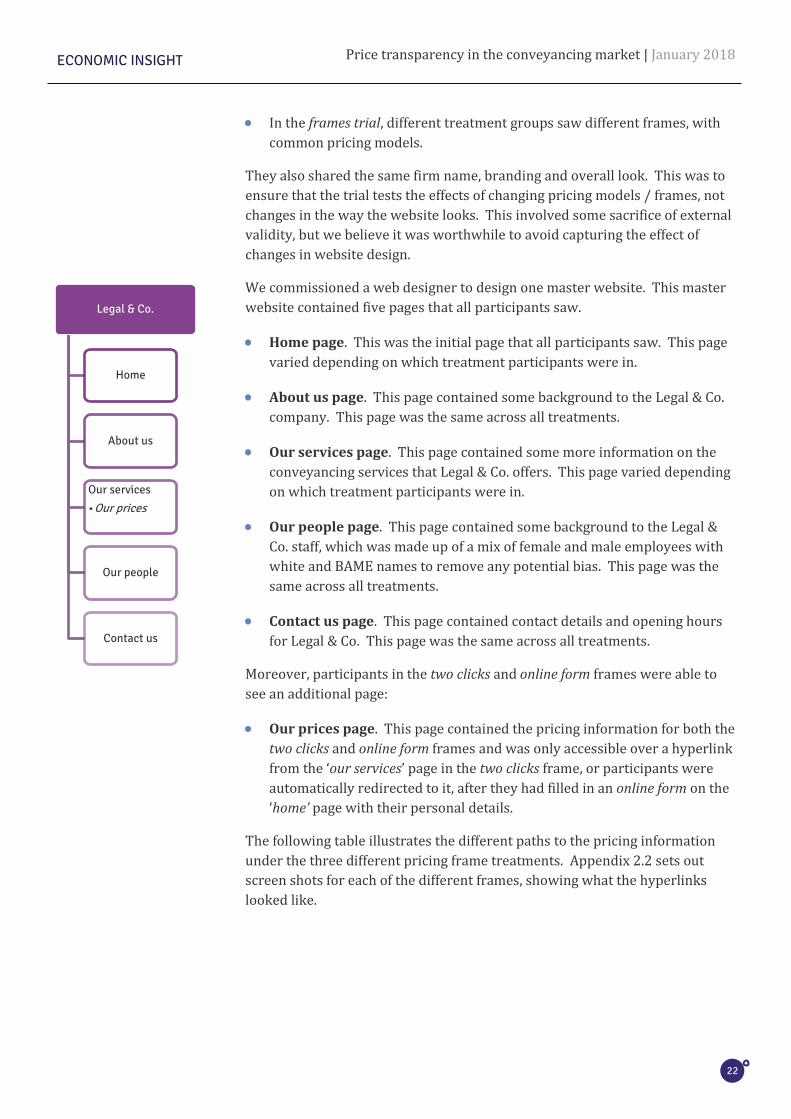
We commissioned a web designer to design one master website. This master
website contained five pages that all participants saw.
• Home page. This was the initial page that all participants saw. This page
varied depending on which treatment participants were in.
• About us page. This page contained some background to the Legal & Co.
company. This page was the same across all treatments.
• Our services page. This page contained some more information on the
conveyancing services that Legal & Co. offers. This page varied depending
on which treatment participants were in.
• Our people page. This page contained some background to the Legal &
Co. staff, which was made up of a mix of female and male employees with
white and BAME names to remove any potential bias. This page was the
same across all treatments.
• Contact us page. This page contained contact details and opening hours
for Legal & Co. This page was the same across all treatments.
Moreover, participants in the two clicks and online form frames were able to
see an additional page:
• Our prices page. This page contained the pricing information for both the
two clicks and online form frames and was only accessible over a hyperlink
from the ‘our services’ page in the two clicks frame, or participants were
automatically redirected to it, after they had filled in an online form on the
‘home’ page with their personal details.
The following table illustrates the different paths to the pricing information
under the three different pricing frame treatments. Appendix 2.2 sets out
screen shots for each of the different frames, showing what the hyperlinks
looked like.
Legal & Co.
Home
About us
Our services
•Our prices
Our people
Contact us
Price transparency in the conveyancing market | January 2018
23
ECONOMIC INSIGHT
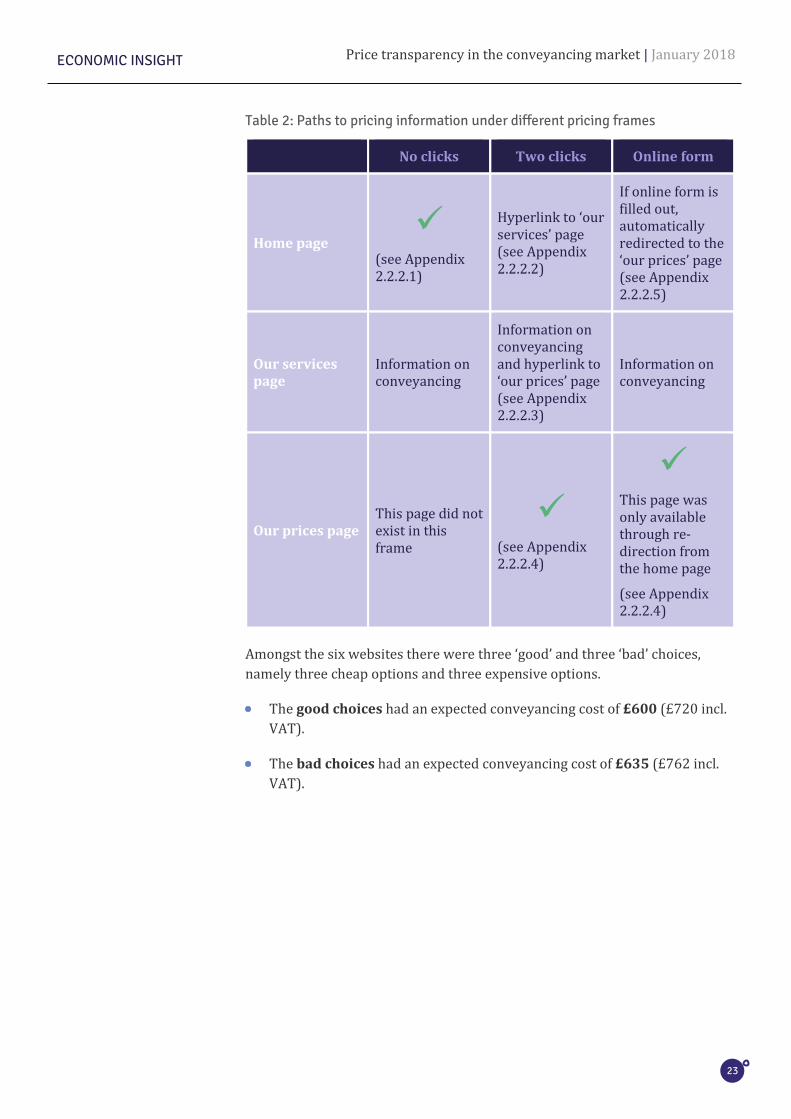
Table 2: Paths to pricing information under different pricing frames
No clicks Two clicks Online form
Home page ✓
(see Appendix 2.2.2.1)
Hyperlink to ‘our services’ page (see Appendix 2.2.2.2)
If online form is filled out, automatically redirected to the ‘our prices’ page (see Appendix 2.2.2.5)
Our services page
Information on conveyancing
Information on conveyancing and hyperlink to ‘our prices’ page (see Appendix 2.2.2.3)
Information on conveyancing
Our prices page This page did not exist in this frame
✓ (see Appendix 2.2.2.4)
✓ This page was only available through re-direction from the home page
(see Appendix 2.2.2.4)
Amongst the six websites there were three ‘good’ and three ‘bad’ choices,
namely three cheap options and three expensive options.
• The good choices had an expected conveyancing cost of £600 (£720 incl.
VAT).
• The bad choices had an expected conveyancing cost of £635 (£762 incl.
VAT).

Price transparency in the conveyancing market | January 2018
24
ECONOMIC INSIGHT
Box 1: A brief note on good and bad choices in the context of this trial
The focus of this research was on price transparency in the conveyancing
market and on the merits – or otherwise – of different pricing models for
conveyancing services.
As such, we have adopted a very narrow definition of ‘good’ and ‘bad’
choices in the context of this trial. A ‘good’ choice was simply opting for one
of the cheap websites, whereas a ‘bad’ choice was opting for one of the
expensive ones. It was not in the remit of this research to assesses the
quality of legal choices more broadly, especially as we recognise that in
practice, making a “good” legal decision will involve many other aspects
apart from price, such as quality, convenience and so on.
That is why we kept all aspects of the different Legal & Co. websites that
participants saw the same, except for varying either the pricing models or
frames, as well as the price levels (cheap and expensive websites). We
sought to keep the “quality” aspect of the different websites the same, for
example by having the same staff on all websites. However, as discussed in
section 5, there are some interesting questions regarding as to what
participants indeed perceived as “quality” in the online trial.
All pricing models also showed all disbursements, which are required for the
conveyancing process, but which do not constitute the solicitors’ fees (such as
Stamp Duty). See the following figure for an example of the price presentation
for a good choice with a fixed fee pricing model.
Figure 7: Illustration of fixed fee pricing model, good version
Choice (trial)
Once the participants in each treatment group had reviewed the six websites,
they were asked to pick the website / offer they thought would best meet their
needs, given the conveyancing scenario they were in.
Legal fees
Solicitors’ fees £600.00
VAT £120.00
Total fees inc. VAT £720.00
Disbursements
Bankruptcy search (VAT n/a) £3.00
Local authority search (inc. VAT) £150.00
Land registry office copies (VAT n/a) £6.50
Environmental searches (inc. VAT) £30.00
Drainage searches (inc. VAT) £35.00
Local searches (inc. VAT) £145.00
Telegraphic transfer fee (inc. VAT) £42.00
Land registration fee (VAT n/a) £135.00
Stamp Duty (VAT n/a) £2,200.00

Price transparency in the conveyancing market | January 2018
25
ECONOMIC INSIGHT
By comparing the choices made by participants in different treatment groups,
we can test how different pricing models and/or frames both:
- affect the choices made; and
- affect the ability of consumers to make a good or bad choice.
Questions (post-trial)
Finally, once the participant had completed the main decision task, we
followed up with questions about:
- the reasons for the choice made;
- confidence in the choice;
- extra information they may have wanted; and
- demographic information, including whether they had recently
purchased a house etc.
In addition to helping us understand the results of the trial better, this also
allowed us to compare the participants’ actual behaviour with their
perceptions of their behaviour (e.g. whether those with higher levels of
reported confidence have a lesser or greater tendency to make ‘good’ choices).
A discussion of the trial methodology
As the previous section sets out, the online trial involved real choices by
participants and ensured that the effects of the different interventions /
treatments were controlled for.
RCTs have been used for over 60 years to compare the effectiveness of new
medicines and have recently become more commonplace in international
development to compare the cost effectiveness of different interventions for
tackling poverty.10 In the UK, the Financial Conduct Authority (FCA) has
increasingly used trials and other methods, such as experiments, in
developing interventions, and other regulators (Ofgem, SRA) have started
using them, too.
One of the main appeals of this method for this research is that it overcomes
limitations of survey-based approaches, as it does allow us to see how
consumers’ decisions would change with different price-related information
in a controlled environment.
However, in the context of this online trial, we still need to be mindful of other
limitations that arise. For example, making a choice in an online trial is not
the same as making a choice in real life for several reasons, including:
- the costs and benefits involved in the trial are smaller than in real life;
10 Haynes et al. (2012), “Test, Learn, Adapt: Developing Public Policy with Randomised Controlled Trials”.
Price transparency in the conveyancing market | January 2018
26
ECONOMIC INSIGHT
- the trial participant is likely to be in a different frame of mind
compared to a house buyer;
- the extent to which a trial can “mimic” real life is influenced by the
time and costs associated with the research.
In our view, the advantages and disadvantages of both methods mean that the
results of them should inform regulatory decision-making alongside other
evidence, and that for this research question – i.e. price transparency - they
nicely complement each other.
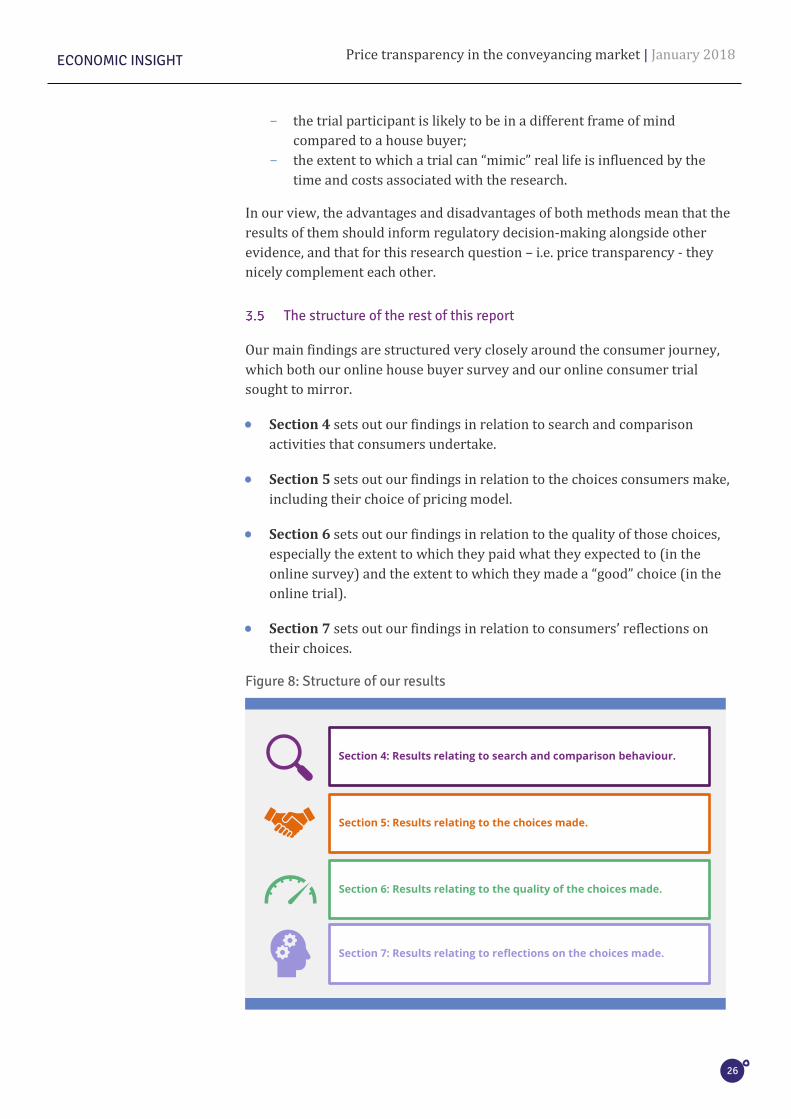
The structure of the rest of this report
Our main findings are structured very closely around the consumer journey,
which both our online house buyer survey and our online consumer trial
sought to mirror.
• Section 4 sets out our findings in relation to search and comparison
activities that consumers undertake.
• Section 5 sets out our findings in relation to the choices consumers make,
including their choice of pricing model.
• Section 6 sets out our findings in relation to the quality of those choices,
especially the extent to which they paid what they expected to (in the
online survey) and the extent to which they made a “good” choice (in the
online trial).
• Section 7 sets out our findings in relation to consumers’ reflections on
their choices.
Figure 8: Structure of our results
Section 4: Results relating to search and comparison behaviour.
Section 5: Results relating to the choices made.
Section 6: Results relating to the quality of the choices made.
Section 7: Results relating to reflections on the choices made.

Price transparency in the conveyancing market | January 2018
27
ECONOMIC INSIGHT
4. Results relating to search and comparison behaviour
This section sets out the search and comparison behaviour of the recent
house buyers included in our online survey. It is split into two main
sections: the first covers the results relating to respondents’ search
behaviour; and the second covers the availability and presentation of
price information.
• The results in this chapter show that the house buyers have an appetite for
shopping around. For example, 66% of respondents stated that they
considered more than one solicitor before instructing one, whereas 30%
only considered one. 71% of respondents stated that they spent more than
one hour searching for a solicitor.
• The results show the importance of recommendations, with 61% of
respondents using recommendations to find a solicitor. This is consistent
with findings in section 5, which show that 72% of respondents instructed a
solicitor based on someone’s recommendation.
• In fact, 35% used recommendations from estate agents and financial
advisors to find a solicitor in the first place.
• Respondents reported mixed experiences of finding prices:
- 11% of respondents said that price information was difficult or very
difficult to find, 89% said otherwise;
- 63% of respondents had to contact the solicitor to obtain a quote; and
- 53% required clarifications on pricing matters.

Price transparency in the conveyancing market | January 2018
28
ECONOMIC INSIGHT
Finding a provider
Here we set out:
- the types of providers considered by respondents;
- how they found a solicitor;
- how long they spent searching for a solicitor; and
- the number of solicitors they considered.
4.1.1 Types of providers considered
The following chart shows the types of providers that the online survey
respondents considered.11
Figure 9: Types of providers considered by all respondents
Source: Economic Insight house buyer survey (N=1,001)
As can be seen, around half (49%) of respondents considered only solicitors,
whereas the other half considered solicitors and others – either other types of
providers or doing it themselves / their partner doing the conveyancing.
Of those that considered both solicitors and others, around 90% considered
using licensed conveyancers, whereas around a quarter considered either
using solicitors or doing it themselves / their partner doing it. Licensed
conveyancers are specialist property lawyers, who can deal with all the legal,
administrative and financial requirements involved in buying or selling
property or re-mortgaging a property. They are regulated by the Council for
Licensed Conveyancers in England and Wales and were not the subjects of this
research. All of the following results relate to solicitors only.
11 Respondents had to have considered solicitors, as this was part of the profiling.
49%51%
I only considered solicitiors I considered both solicitors and others

Price transparency in the conveyancing market | January 2018
29
ECONOMIC INSIGHT
4.1.2 How solicitors were found
The next table illustrates how respondents found the different solicitors.
Table 3: How solicitor was found, multiple choice answer
% N
Internet search 38% 382
Recommendation from a family member / friend / work colleague
33% 330
Recommendation from an estate agent 19% 191
Recommendation from bank / building society / mortgage lender
12% 116
Recommendation from financial advisor / mortgage broker
11% 108
Walked past their offices 8% 83
Advertisement in newspaper / magazine 7% 68
Already knew the solicitor, but had not used
7% 66
Yellow Pages 6% 63
Leaflet 5% 55
Previous experience of using solicitor 5% 54
Advertisement on radio / television 5% 51
I was approached by the solicitor 1% 12
Other 1% 11
Don’t know / can’t remember 0% 5
Source: Economic Insight house buyer survey (each row is out of N=1,001)
Due to the nature of this survey (i.e. it being online) a high proportion (38%)
of respondents found solicitors through an online search. A high proportion of
respondents also followed recommendations, be these from family and friends
or other advisors, such as their financial or mortgage advisor or bank and
building society.
Respondents could pick more than one of the above answers to the question
as to how they found a solicitor. Looking at those that considered solicitors
that had been recommended to them, 61% said that they considered one that

Price transparency in the conveyancing market | January 2018
30
ECONOMIC INSIGHT
was recommended to them be this from family and friends or other advisors.
35% considered a solicitor that had been recommended to them by an estate
agent or financial advisor / bank.
4.1.3 Time spent searching
The following figure illustrates roughly how long respondents stated that they
spent searching for a conveyancing solicitor.
Figure 10: Hours spent searching
Source: Economic Insight house buyer survey (N=1,001)
Again, the results are consistent with respondents shopping around for
conveyancing solicitors, with around 70% of respondents spending up to four
hours searching for solicitors. Just under a quarter of respondents (24%)
spent over four hours searching for solicitors.
24%
23%
23%
13%
5%
7%1% 4%
less than 1 hour
between 1-2 hours
between 2-4 hours
between 4-6 hours
between 6-8 hours
more than 8 hours
Other
Don't know/can't remember

Price transparency in the conveyancing market | January 2018
31
ECONOMIC INSIGHT
4.1.4 Number of solicitors considered
The following chart illustrates how many solicitors were considered by
respondents before instructing one.
Figure 11: Number of solicitors considered
Source: Economic Insight house buyer survey (N=1,001)
Around 66% of respondents considered more than one solicitor, whereas 30%
of respondents only considered one solicitor. This indicates that respondents
appear to “shop around” for conveyancing solicitors to some extent. Most
respondents who considered more than one solicitor tended to consider up to
four, with a small minority of consumers considering five or six different
solicitors.
This result is different to the Legal Services Consumer Panel (LSCP) Tracker
Survey (2017), which found that the proportion of consumers who shop
around for legal services was at around 27%, but chimes with recent findings
from the SRA’s conveyancing research, that of those house buyers who used
comparison websites, 51% had used one to compare conveyancing
providers.12 The difference could be due to the LSCP survey covering all legal
services, whereas the SRA’s recent and the current research is focused on
conveyancing. When looking at the LSCP results by respondents who had a
conveyancing need in the last two years, the proportion of those shopping
around increases to 39%.
12 IFF Research (2017), “Understanding the experiences of conveyancing legal services”.
30%
26%
25%
11%
3% 1% 1% 3%
1 2 3 4 5 6 Other Don't know/can't remember

Price transparency in the conveyancing market | January 2018
32
ECONOMIC INSIGHT
Finding price information
The following figure illustrates how easy respondents found it to find the
prices of the conveyancing services.
Figure 12: Ease of finding prices
Source: Economic Insight house buyer survey (N=1,001)
59% of respondents found that prices were easy or very easy to find,
compared to 10% who found it difficult or very difficult.
The following chart sets out the reasons why those that found it difficult or
very difficult to find the prices for conveyancing did so.
20%
39%
27%
9%
1% 2% 1%
Very easy
Easy
Neither easy nor difficult
Difficult
Very difficult
It varied a lot by solicitor
Don't know/ can't remember
Price transparency in the conveyancing market | January 2018
33
ECONOMIC INSIGHT
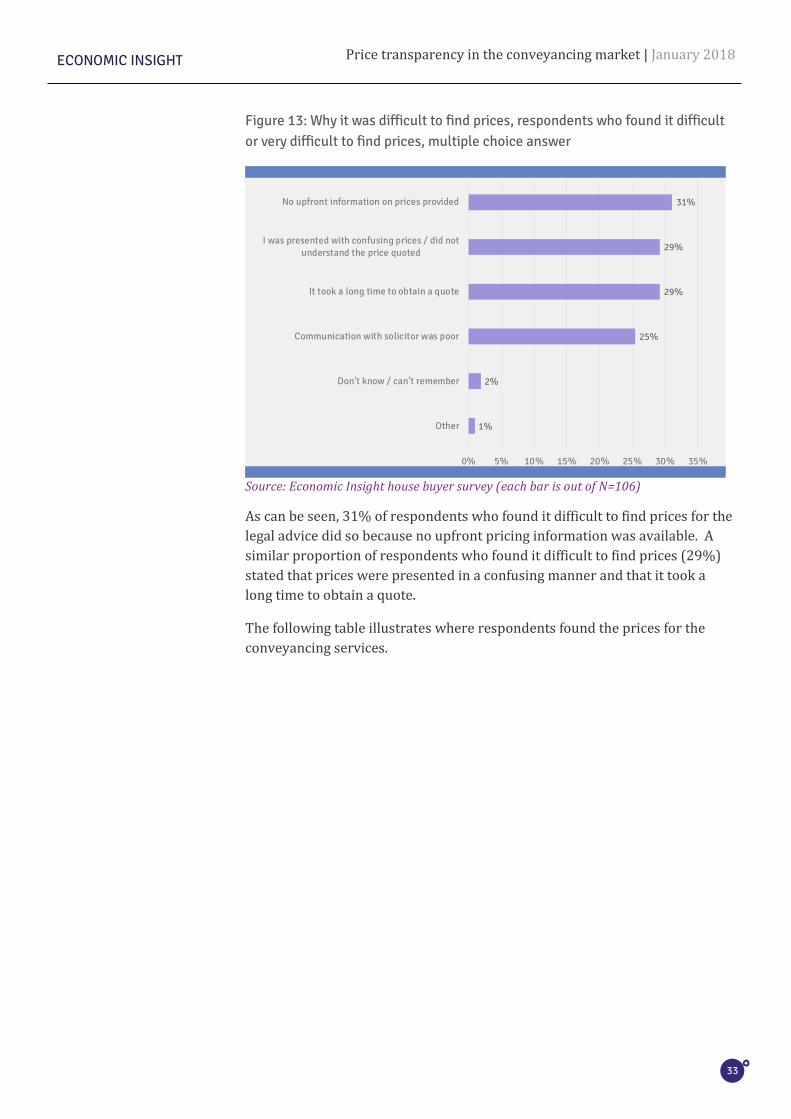
Figure 13: Why it was difficult to find prices, respondents who found it difficult or very difficult to find prices, multiple choice answer
Source: Economic Insight house buyer survey (each bar is out of N=106)
As can be seen, 31% of respondents who found it difficult to find prices for the
legal advice did so because no upfront pricing information was available. A
similar proportion of respondents who found it difficult to find prices (29%)
stated that prices were presented in a confusing manner and that it took a
long time to obtain a quote.
The following table illustrates where respondents found the prices for the
conveyancing services.
1%
2%
25%
29%
29%
31%
0% 5% 10% 15% 20% 25% 30% 35%
Other
Don't know / can't remember
Communication with solicitor was poor
It took a long time to obtain a quote
I was presented with confusing prices / did notunderstand the price quoted
No upfront information on prices provided

Price transparency in the conveyancing market | January 2018
34
ECONOMIC INSIGHT
Table 4: How respondents found out about the price
% N
Had to email to obtain written quote 21% 212
Had to call to obtain verbal quote 18% 178
Prices were readily available on the website
15% 151
Had to fill out form on website to obtain instant quote
11% 112
Had to arrange face to face meeting to obtain verbal quote
7% 75
A family member / friend / work colleague said how much it would cost (roughly)
7% 69
Had to arrange face to face meeting to obtain written quote
5% 53
A financial advisor / mortgage broker lender said how much it would cost (roughly)
4% 44
A bank / building society / mortgage lender said how much it would cost (roughly)
2% 25
Don't know/can't remember 2% 21
Other 1% 7
Source: Economic Insight house buyer survey (N=1,001)
The table illustrates that in 63% of cases, respondents had to contact the
solicitor in some form to obtain a quote. This includes 11% who had to fill out
an online form to obtain a quote. 15% of respondents stated that the prices
were readily available on the solicitor’s website. Overall, 26% of respondents
found prices online, albeit only 15%, e.g. those not having to fill out the online
form, were able to access them without having to contact the solicitor.
The next chart illustrates the proportion of respondents to the online survey
that required clarifications on pricing matters.

Price transparency in the conveyancing market | January 2018
35
ECONOMIC INSIGHT
Figure 14: Clarification on pricing required
Source: Economic Insight house buyer survey (N=1,001)
As can be seen, just over half (53%) of respondents required clarifications on
pricing matters, with 38% requiring no pricing clarifications.
53%
38%
6%4%
Yes, I required clarifications onpricing matters.
No, I did not require anyclarification on pricing matters.
It varied a lot by solicitor.
Don't know / can't remember.
Price transparency in the conveyancing market | January 2018
36
ECONOMIC INSIGHT
5. Results relating to the choices made
This section summarises the choices that respondents made in both the
online survey and the online trial. It is split into three parts covering: the
effects of different pricing models on choice; the effects of different
pricing frames; and the reasons for the choices made.
• The results from the online survey and online trial suggest that, when given
the choice, respondents choose a range of pricing models from fixed fees
to hourly rates. One size does not fit all.
- In the online survey, 57% of respondents stated they chose a solicitor
offering a fixed fee pricing model, with the rest choosing a solicitor
offering estimated fees or hourly rates. In the online trial, participants’
choices were spread across fixed fee, hourly rates and a process /
staged fee.
- There is some limited qualitative evidence that some respondents like
the certainty of a fixed fee, whereas others like the ability not to pay for
work that may not be needed.
• The online trial strongly suggests that “small” changes in the ease with
which price information can be accessed could have a large effect on
consumers’ ability and willingness to find and use it. When given the choice
of pricing frame, participants strongly preferred the websites where price
information was “no clicks” or “two clicks” away (86%) compared to
completing an online form (14%).
• Though respondents care about price, they appear to lack focus on price
when making choices. Only 6% of respondents to the house buyer survey
stated that they chose the solicitor because it was the cheapest and only 25%
of participants in the online trial said that they chose a website because it
was the cheapest.

Price transparency in the conveyancing market | January 2018
37
ECONOMIC INSIGHT
The effects of different pricing models on choice
The following table shows how the prices for the conveyancing services were
presented to respondents in the online survey by the solicitor that they
instructed to undertake the conveyancing work for them.
Table 5: How the price was presented
% N
Fixed fee for legal advice, including all expenses and additional fees
40% 399
Estimate of total costs for legal advice, including all expenses and additional fees
22% 217
Fixed fee for legal advice, excluding all expenses and additional fees
17% 166
Estimate of total costs for legal advice, excluding all expenses and additional fees
7% 70
I was given a breakdown of costs (including disbursements and VAT)
4% 43
I was given a rate card / pricing structure
4% 36
Hourly fees, and I was told how many hours would be required
3% 32
Don’t know / can’t remember 3% 30
Hourly fees, and I was not given an estimate of the hours required
1% 7
Other 0% 1
Source: Economic Insight house buyer survey (N=1,001)
As can be seen, 57% chose a solicitor that presented them with a fixed fee for
the legal advice. Only 5% of respondents instructed a solicitor that presented
them with hourly rates. Around 29% of respondents instructed a solicitor that
presented them with an estimate of the total cost. Arguably, if this estimate
was based on an hourly fee rate, approximately 33% of respondents picked a
solicitor with an hourly rate.

Price transparency in the conveyancing market | January 2018
38
ECONOMIC INSIGHT
This is consistent with previous research undertaken by the LSB, which shows
that the majority of solicitors charge on a fixed fee basis for conveyancing.13
Figure 15: Charging approach for conveyancing
Source: OMB Research (2016), “Prices of Individual Consumer Legal Services: Research Report”, p. 10.
The consumer legal needs survey undertaken for both the Law Society and the
LSB also showed that fixed price quotations were common for conveyancing.14
It also found that using a solicitor for conveyancing matters was seen as “the
norm” by consumers, even though it is possible not to use a solicitor.15 38% of
respondents mentioned the need for a solicitor for conveyancing.16
Interestingly, most respondents (70%) stated that, given the choice, they
would prefer conveyancing services to be presented as a fixed fee, whereas
only 3% stated that they would prefer them to be presented as hourly fees.
This suggests that what respondents do not always do what they say, as only
57% actually chose a solicitor with a fixed fee.
The “most preferred” pricing model varies between the online survey and the
online trial. This could be for various reasons, not only because the two were
asking slightly different questions. The former was assessing what the pricing
model of the instructed solicitor was, whereas the latter was much narrower –
instructing respondents to review solicitor’s websites and choose solely based
on that information. Moreover, the samples were also different. Respondents
to the online survey had by nature of the survey been through a conveyancing
experience and were (at least to some extent) familiar with the market,
13 OMB Research (2016), “Prices of Individual Consumer Legal Services: Research Report”, p. 10. 14 Ipsos MORI (2016), “Online survey of individuals’ handling of legal issues in England and Wales 2015”, p.7. 15 Ibid., p. 86. 16 Ibid., p.108.
19% 19% 20% 20% 20%
80% 79% 78% 78% 78%
1% 1% 1% 1% 1%
0%
10%
20%
30%
40%
50%
60%
70%
80%
90%
100%
Sale (Freehold) Sale (Leasehold) Purchase(Freehold)
Purchase(Leasehold)
Sale & Purchase(Freehold)
In w
hat w
ay w
ould
you
typi
cally
cha
rge
for t
his
conv
eyan
cing
ser
vice
? (%
)
Estimate of total cost Fixed fee Hourly rate
Price transparency in the conveyancing market | January 2018
39
ECONOMIC INSIGHT
potentially also being anchored towards the decision they had taken.
Respondents to the online trial did not necessarily have the experience or
familiarity with the conveyancing market.
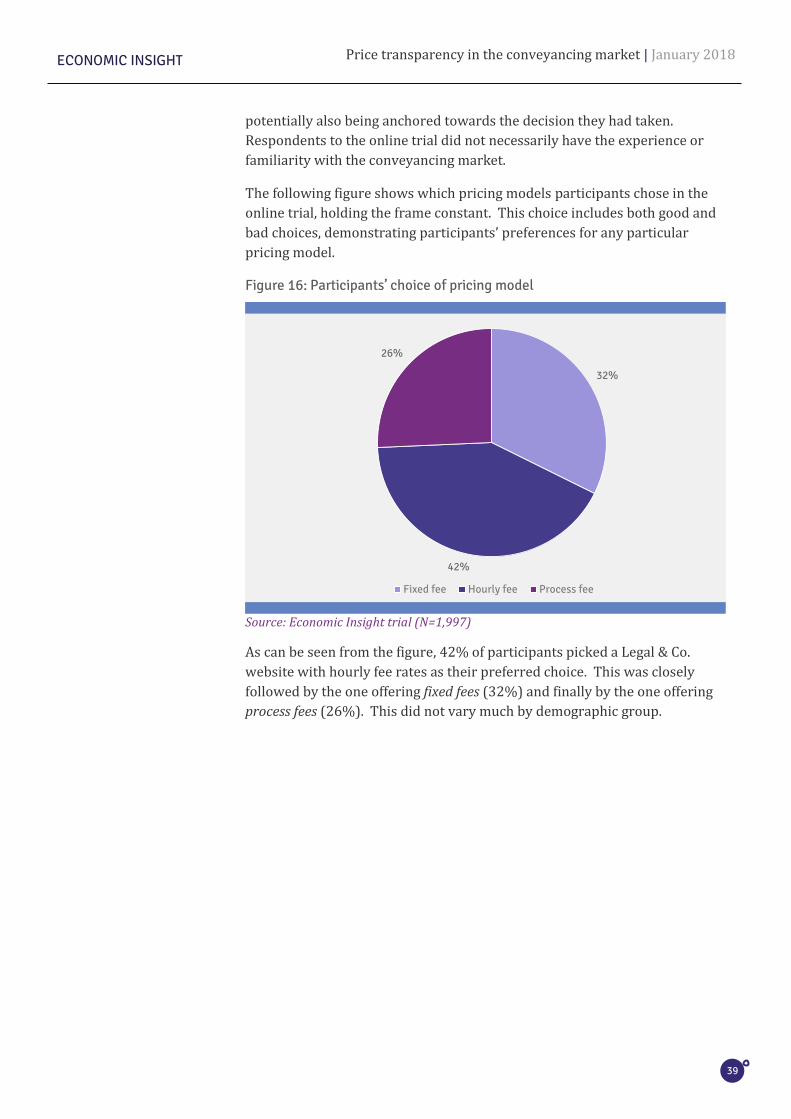
The following figure shows which pricing models participants chose in the
online trial, holding the frame constant. This choice includes both good and
bad choices, demonstrating participants’ preferences for any particular
pricing model.
Figure 16: Participants’ choice of pricing model
Source: Economic Insight trial (N=1,997)
As can be seen from the figure, 42% of participants picked a Legal & Co.
website with hourly fee rates as their preferred choice. This was closely
followed by the one offering fixed fees (32%) and finally by the one offering
process fees (26%). This did not vary much by demographic group.
32%
42%
26%
Fixed fee Hourly fee Process fee

Price transparency in the conveyancing market | January 2018
40
ECONOMIC INSIGHT
The effects of different pricing frames on choice
The online trial further allowed us to explore participants’ preferences
regarding the positioning or the effort required to obtain the pricing
information.
The following figure shows which frames participants chose, holding the
pricing models constant. As above, this choice includes both good and bad
choices, demonstrating participants’ preferences for any particular frame.
Figure 17: Participants’ choice of pricing frame
Source: Economic Insight trial (N=2,004)
Participants appear to mildly prefer the ‘no clicks’ frame, whereby the pricing
information is presented on the home page, closely followed by the ‘two clicks’
frame. In the latter, the pricing information is two clicks away from the home
page. Finally, only around 14% of participants chose the Legal & Co. websites
where the pricing information was “hidden” behind an ‘online form’. This low
uptake of the online form could be explained by the “effort” associated with it
offsetting the benefit of “personalisation”.
46%
40%
14%
No clicks Two clicks Online form
“Transparency -
prices on home page
whereas the other
websites were a few
clicks navigation
away.” – online trial
respondent
“The prices were
straightforward not
hidden.” – online trial
respondent
Price transparency in the conveyancing market | January 2018
41
ECONOMIC INSIGHT
The reasons given for the choices made
5.3.1 Reasons given for choice made in the online survey
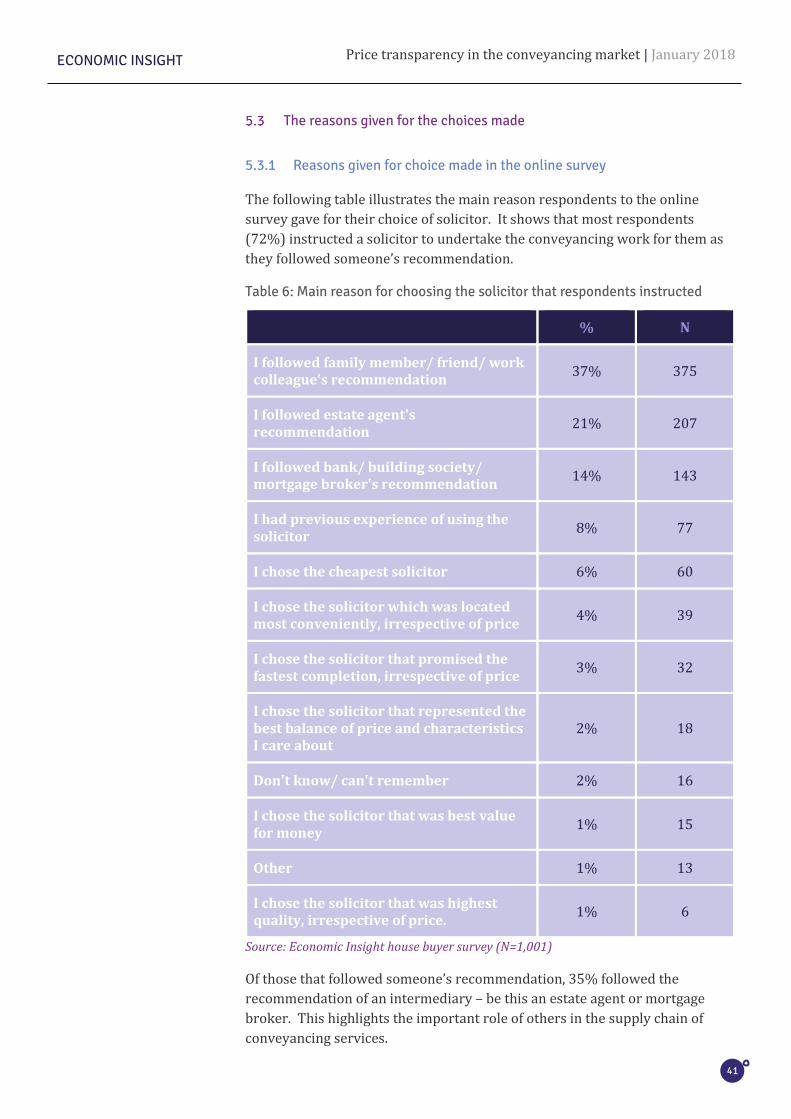
The following table illustrates the main reason respondents to the online
survey gave for their choice of solicitor. It shows that most respondents
(72%) instructed a solicitor to undertake the conveyancing work for them as
they followed someone’s recommendation.
Table 6: Main reason for choosing the solicitor that respondents instructed
% N
I followed family member/ friend/ work colleague's recommendation
37% 375
I followed estate agent's recommendation
21% 207
I followed bank/ building society/ mortgage broker's recommendation
14% 143
I had previous experience of using the solicitor
8% 77
I chose the cheapest solicitor 6% 60
I chose the solicitor which was located most conveniently, irrespective of price
4% 39
I chose the solicitor that promised the fastest completion, irrespective of price
3% 32
I chose the solicitor that represented the best balance of price and characteristics I care about
2% 18
Don't know/ can't remember 2% 16
I chose the solicitor that was best value for money
1% 15
Other 1% 13
I chose the solicitor that was highest quality, irrespective of price.
1% 6
Source: Economic Insight house buyer survey (N=1,001)
Of those that followed someone’s recommendation, 35% followed the
recommendation of an intermediary – be this an estate agent or mortgage
broker. This highlights the important role of others in the supply chain of
conveyancing services.
Price transparency in the conveyancing market | January 2018
42
ECONOMIC INSIGHT
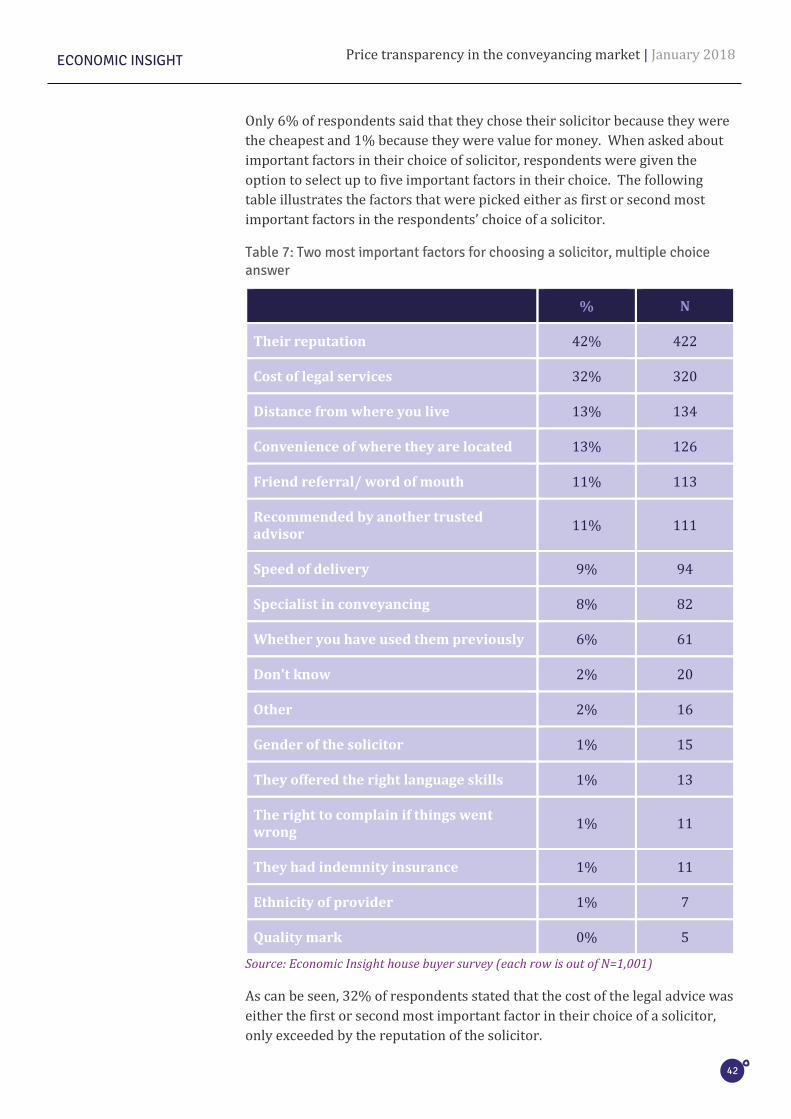
Only 6% of respondents said that they chose their solicitor because they were
the cheapest and 1% because they were value for money. When asked about
important factors in their choice of solicitor, respondents were given the
option to select up to five important factors in their choice. The following
table illustrates the factors that were picked either as first or second most
important factors in the respondents’ choice of a solicitor.
Table 7: Two most important factors for choosing a solicitor, multiple choice answer
% N
Their reputation 42% 422
Cost of legal services 32% 320
Distance from where you live 13% 134
Convenience of where they are located 13% 126
Friend referral/ word of mouth 11% 113
Recommended by another trusted advisor
11% 111
Speed of delivery 9% 94
Specialist in conveyancing 8% 82
Whether you have used them previously 6% 61
Don't know 2% 20
Other 2% 16
Gender of the solicitor 1% 15
They offered the right language skills 1% 13
The right to complain if things went wrong
1% 11
They had indemnity insurance 1% 11
Ethnicity of provider 1% 7
Quality mark 0% 5
Source: Economic Insight house buyer survey (each row is out of N=1,001)
As can be seen, 32% of respondents stated that the cost of the legal advice was
either the first or second most important factor in their choice of a solicitor,
only exceeded by the reputation of the solicitor.

Price transparency in the conveyancing market | January 2018
43
ECONOMIC INSIGHT
5.3.2 Reasons for choice in online trial
The following table illustrates the reasons for choosing any given Legal & Co.
website.
Table 8: Reason for choosing Legal & Co. website
% N
I found the prices easier to understand 45% 1,799
The prices were easy to find 32% 1,287
The price for the legal advice (and disbursements) was cheapest
25% 1,005
The solicitors appeared to offer better quality
25% 984
Don’t know 10% 391
Other 7% 262
Source: Economic Insight online consumer trial (N=4,001)
As can be seen, 25% of participants chose on the basis that the price for the
legal advice was the cheapest. A similar proportion of participants (25%)
chose because the solicitors appeared to offer better quality. Almost half of
the participants chose because prices were easier to understand, and 32%
because prices were easy to find.
“I liked the
information spread
over a few pages, and
not having to provide
personal information
so soon” – online trial
respondent

Price transparency in the conveyancing market | January 2018
44
ECONOMIC INSIGHT
Box 2: A brief note on quality
We sought to keep quality constant in our trial design, yet a quarter of
participants still quoted differences in quality as reasons for their choice.
But the Legal & Co. websites that participants saw were the same, except for
varying either the pricing models or frames, as well as the price levels (cheap
and expensive websites). This raises interesting questions regarding as to what
participants perceived as “quality” in the online trial.
One of the aspects that did vary, however, was how prices were presented.
Indeed, some participants attributed “quality” to the fact that some Legal & Co.
websites presented prices split by the stages in the process, which they
particularly liked.
“I liked the details of the process. More information means I am better informed.”
“Prices were split between the stages. Since a large majority of sales fall through,
you could save some money.”
Whereas others may have attributed “quality” to where they could find the
prices.
“All the information was in separate, easy to find places. So, you didn’t get
overwhelmed with information when looking, but everything you would need to
know was there for you to find.”
This suggests that the distinction between “quality” and “price” is not
clear cut – that is, from the perspective of consumers, good price
information is one dimension of good quality.
Price transparency in the conveyancing market | January 2018
45
ECONOMIC INSIGHT
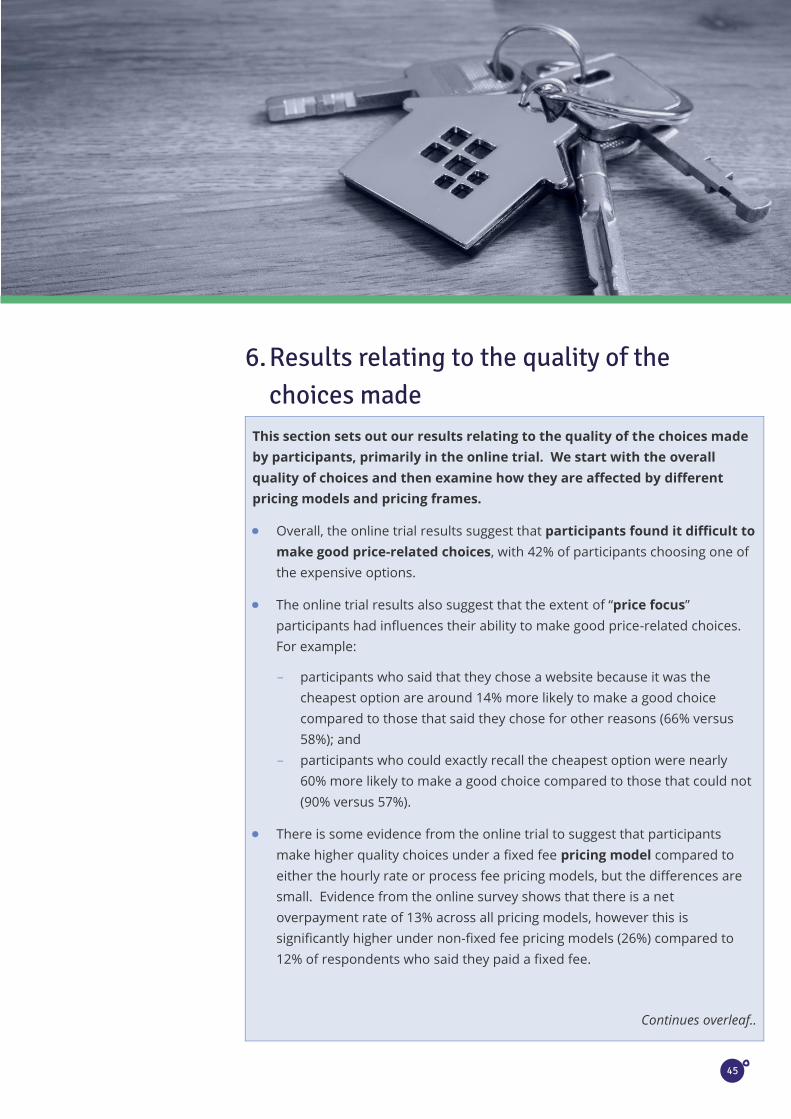
6. Results relating to the quality of the choices made
This section sets out our results relating to the quality of the choices made
by participants, primarily in the online trial. We start with the overall
quality of choices and then examine how they are affected by different
pricing models and pricing frames.
• Overall, the online trial results suggest that participants found it difficult to
make good price-related choices, with 42% of participants choosing one of
the expensive options.
• The online trial results also suggest that the extent of “price focus”
participants had influences their ability to make good price-related choices.
For example:
- participants who said that they chose a website because it was the
cheapest option are around 14% more likely to make a good choice
compared to those that said they chose for other reasons (66% versus
58%); and
- participants who could exactly recall the cheapest option were nearly
60% more likely to make a good choice compared to those that could not
(90% versus 57%).
• There is some evidence from the online trial to suggest that participants
make higher quality choices under a fixed fee pricing model compared to
either the hourly rate or process fee pricing models, but the differences are
small. Evidence from the online survey shows that there is a net
overpayment rate of 13% across all pricing models, however this is
significantly higher under non-fixed fee pricing models (26%) compared to
12% of respondents who said they paid a fixed fee.
Continues overleaf..
Price transparency in the conveyancing market | January 2018
46
ECONOMIC INSIGHT
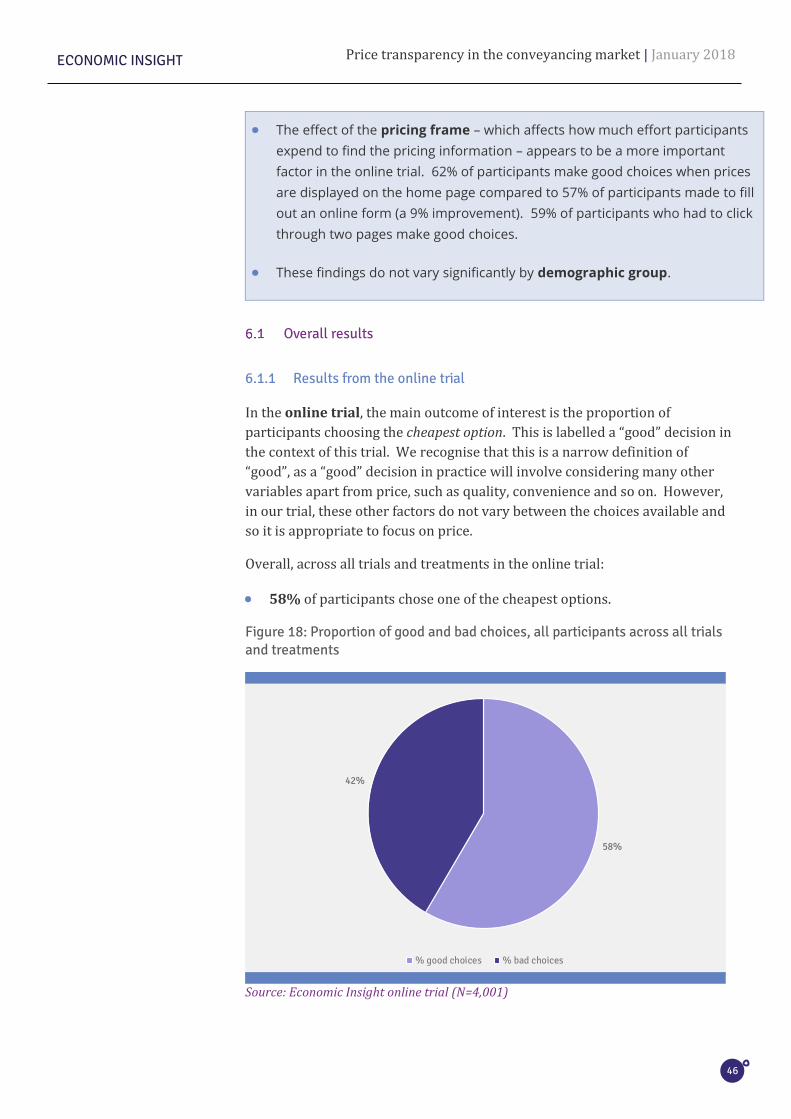
• The effect of the pricing frame – which affects how much effort participants
expend to find the pricing information – appears to be a more important
factor in the online trial. 62% of participants make good choices when prices
are displayed on the home page compared to 57% of participants made to fill
out an online form (a 9% improvement). 59% of participants who had to click
through two pages make good choices.
• These findings do not vary significantly by demographic group.
Overall results
6.1.1 Results from the online trial
In the online trial, the main outcome of interest is the proportion of
participants choosing the cheapest option. This is labelled a “good” decision in
the context of this trial. We recognise that this is a narrow definition of
“good”, as a “good” decision in practice will involve considering many other
variables apart from price, such as quality, convenience and so on. However,
in our trial, these other factors do not vary between the choices available and
so it is appropriate to focus on price.
Overall, across all trials and treatments in the online trial:
• 58% of participants chose one of the cheapest options.
Figure 18: Proportion of good and bad choices, all participants across all trials and treatments
Source: Economic Insight online trial (N=4,001)
58%
42%
% good choices % bad choices

Price transparency in the conveyancing market | January 2018
47
ECONOMIC INSIGHT
• As mentioned in the previous section, 25% of participants said that they
chose because price was cheapest, with a similar proportion (25%) of
participants saying that they chose because of better quality.
- 66% of participants who said they chose a Legal & Co. website
because the price was cheapest made a good decision, compared to
56% of participants who chose a Legal & Co. website for other
reasons, such as quality or ease of understanding and finding prices.
- As to the 34% of respondents that picked a Legal & Co. website
because it was cheapest, but chose an expensive one, they did so
across all pricing models and pricing frames equally. Again, a higher
rate made these “mistakes” in the ‘two clicks’ and ‘online form’ frames.
See also sections 6.2.1 and 6.3 below for the results relating to those
that were price focused.
• 7% of participants could recall the price of their chosen option exactly,
whereas 27% of participants could recall the price of their chosen option
roughly.
- 90% of participants with exact price recall chose the cheapest option,
compared to 57% who did not recall the price exactly.
- 63% of participants with approximate price recall made a “good”
decision, compared to 58% of participants who did not recall the price
approximately.
Box 3: A brief note on exact and approximate recall
To better understand the degree of price focus, we asked participants to state
the price of the conveyancing services for the website that they chose. This
could be interpreted by participants as either (i) the price for the legal advice
(inc. VAT); the price for the legal advice (excl. VAT); or (iii) the price for the legal
advice (inc. VAT) plus the sum of all disbursements.
Using these responses, we have defined two groups – those with “exact price
recall” and those with “approximate price recall” (where the latter had a range
of £600 to £800 and of £3,000 to £4,000 for the different potential
interpretations of price).
Arguably, participants who remembered the price of their preferred option
either exactly or approximately were at least, to some extent, price focused,
too.
• 60% of participants who spent over 10 minutes on the trial chose one of
the cheapest options, compared to 56% of participants who spent less
than 10 minutes on the trial.
Price transparency in the conveyancing market | January 2018
48
ECONOMIC INSIGHT
Box 4: A brief note on time spent answering the online trial
Another aspect that could be driving “good” or “bad” decision-making could be
the amount of time spent undertaking the task. Arguably, participants who
“rush” through the task (and relatedly the different websites) may not be in the
best position to make “good” decisions. However, some participants may just
make decisions fast – be this in the trial context or the real world.
Nonetheless, we have further separately assessed the choices of participants
who took more than 10 minutes to complete the online trial. Around half of
participants did take this amount of time and it would have provided for
sufficient time to read the instructions carefully.
• There were no demographic groups that were particularly more likely
than others to make good decisions. There is some evidence that older
participants and those that previously bought a house made better
choices. For example, 62% of those aged between 55-64 made good
decisions, as did 64% of those aged 65-74. Similarly, 60% of those that
had bought a house made good decisions. This is possibly linked to the
point above, as 60% of those aged 55-64 spent over 10 minutes on the
trial as did over 63% of those aged 65-74, for example.
6.1.2 Results from the online survey
In the online survey, the main outcome of interest is whether the
respondents paid the price they were quoted. This again, is a very simple
outcome measure, as for example there could have been many legitimate
reasons for which the final price and the quoted one were not the same.
In the online survey, most (69%) respondents paid the price they were
quoted, with around a quarter of respondents paying a price different to the
one they were quoted. The following chart illustrates whether respondents
paid the price they were expecting to pay, or whether they paid a higher or
lower one.

Price transparency in the conveyancing market | January 2018
49
ECONOMIC INSIGHT
Figure 19: Correspondence of quoted price and price paid, all respondents
Source: Economic Insight house buyer survey (N=971)
As can be seen, 69% of respondents to the online survey paid the price they
expected to pay. 19% paid a price higher than they expected to and 6% paid a
price lower than they expected to. So overall, subtracting those that paid less
than they expected from those that paid more, there was a net “overpayment
rate” of 13%.
69%
19%
6%
5%
Just as I expected
Higher than I expected
Lower than I expected
Don't know

Price transparency in the conveyancing market | January 2018
50
ECONOMIC INSIGHT
The effect of different pricing models on the quality of decisions
6.2.1 Results from the online trial
The following table illustrates the proportion of participants choosing the
cheapest option, holding the pricing model constant. That is, where
participants were presented with a fixed fee pricing model, 58% chose the
cheapest option (regardless of whether this was ‘no clicks’ or ‘two clicks’ away,
or behind an ‘online form’).
Table 9: Proportion of participants making good choices, holding the pricing model constant – all participants
Trial % good choices N
Fixed fee 58% 667
Hourly fee 57% 667
Process fee 56% 670
Source: Economic Insight trial (N=2,004)
This confirms our hypothesis 1 that participants will make better choices
when presented with a fixed fee pricing model, compared to an hourly rate or a
fees by process stage model, although this difference is not statistically
significant.
Consistency with hypothesis 2 – that participants will make better choices
when presented with a fees by process stage pricing model, compared to an
hourly rate – is contingent on the time spent on the trial. That is, we cannot
confirm this hypothesis for all participants, whereas we can confirm it for
participants who spent over 10 minutes on the trial.
The following table sets out the results for participants that spent more than
10 minutes on the trial.
Table 10: Proportion of participants making good choices, holding the pricing model constant – all participants spending at least 10 min
Trial % good choices N
Fixed fee 62% 300
Hourly fee 57% 312
Process fee 58% 320
Source: Economic Insight trial (N=932)
As can be seen, the proportion of participants making ‘good’ choices under a
fixed fee model increased slightly by 4 percentage points, whereas the

Price transparency in the conveyancing market | January 2018
51
ECONOMIC INSIGHT
proportion of participants choosing the cheapest option under a process fee
model is slightly above that for those facing an hourly rate.
By price focus
The following table sets out the proportion of participants who are price
focused making good choices under each different trial.
Table 11: Proportion of participants who are price focused making good choices
Trial % good choices N
Fixed fee 69% 175
Hourly fee 69% 162
Process fee 72% 138
Source: Economic Insight trial (N=475)
As can be seen, those that are more price focused appear to make more ‘good’
choices when they are presented with a process fee model.
By exact and approximate price recall
The following table illustrates the proportion of good choices given different
pricing models for those with exact price recall.
Table 12: Proportion of participants with exact price recall making good choices
Trial % good choices N
Fixed fee 88% 78
Hourly fee 88% 25
Process fee 100% 13
Source: Economic Insight trial (N=116)
As can be seen, 100% of participants who were presented with process fees
made good choices, compared to 88% of those who were presented with fixed
fees or hourly rates.
The following table illustrates the proportion of good choices for those with
approximate price recall.

Price transparency in the conveyancing market | January 2018
52
ECONOMIC INSIGHT
Table 13: Proportion of participants with approximate price recall making good choices
Trial % good choices N
Fixed fee 62% 204
Hourly fee 60% 131
Process fee 61% 100
Source: Economic Insight trial (N=435)
Here, 62% of participants who were presented with a fixed fee made a good
choice, compared to 61% of respondents who were presented with a process
fee and 60% who were presented with an hourly rate.
By demographics
We did not identify specific demographic groups that responded particularly
well to certain pricing models, compared to others. See Appendix 3.2.
6.2.2 Results from the online survey
The following chart shows whether respondents paid the fixed fee for the legal
advice that they had been quoted by the solicitor.
Figure 20: Correspondence of quoted price and price paid, those that paid a fixed fee
Source: Economic Insight house buyer survey (N=895)
As can be seen, for most (70%) respondents the quoted price was equal to the
final price paid, whereas around 24% paid a different price. 18% of
respondents paid a higher price than they expected to, whereas 6% paid a
70%
18%
6%
6%
Yes, this was the final cost
No, final cost was higher
No, final cost was lower
Don't know/can't remember

Price transparency in the conveyancing market | January 2018
53
ECONOMIC INSIGHT
price lower than they expected to. This leaves a “net overpayment rate” of
12%.
This did not vary much depending on the time spent searching or the number
of solicitors considered – see Appendix 3.1.
The following chart illustrates whether respondents’ expectations were met
for those that were quoted hourly rates or were shown rate cards.
Figure 21: Correspondence of quoted price and price paid, those that paid hourly rates
Source: Economic Insight house buyer survey (N=76)
For respondents who were quoted hourly rates or given estimates of the total
costs expectations were met less frequently than for those that were quoted
fixed fees. More than half (55%) of respondents paid a price they expected to
pay, with roughly 42% paying a price that did not meet their expectations. In
34% of the cases respondents paid higher prices than they expected to,
whereas in 8% of cases they paid a lesser amount than they expected to.
Again, the “net overpayment rate” for respondents who were not quoted fixed
fees was at around 26%, which is 14 percentage points higher than under a
fixed fee pricing model.
55%34%
8%3%
Just as I expected
Higher than I expected
Lower than I expected
Don't know / can't remember

Price transparency in the conveyancing market | January 2018
54
ECONOMIC INSIGHT
The effect of different pricing frames on the quality of decisions
The following table illustrates the proportion of participants choosing the
cheapest option, holding the frame constant. That is, where participants were
presented with the pricing information on the home page (no clicks), 62%
chose the cheapest option (regardless of whether price was presented as a
fixed fee, hourly rate, or process fee).
Table 14: Proportion of participants making good choices, holding the frame constant – all participants
Trial % good choices N
No clicks 62% 664
Two clicks 59% 667
Online form 57% 666
Source: Economic Insight trial (N=1,997)
This confirms our hypothesis 3 that respondents will make better choices
when presented with a ‘no clicks’ frame, compared to a ‘two clicks’ or an ‘online
form’ frame. The difference between the ‘no clicks’ and ‘two clicks’ frame is not
statistically significant, whereas the difference between the ‘no clicks’ and
‘online form’ frame is statistically significant at the 10% level (p=0.06).
Looking at participants who spent longer on the trial, the following table
illustrates the proportion of good decision for those spending more than 10
minutes on the trial.
Table 15: Proportion of participants making good choices, holding the frame constant – all participants spending at least 10 min
Trial % good choices N
No clicks 65% 340
Two clicks 60% 331
Online form 56% 302
Source: Economic Insight trial (N=973)
‘Good’ decision-making increased by a couple of percentage points for both
participants in the ‘no clicks’ and ‘two clicks’ frames, whereas it decreased
slightly for those who only saw ‘online forms’.
By price focus
The following table sets out the proportion of participants who are price
focused making good choices under each different frame trial.

Price transparency in the conveyancing market | January 2018
55
ECONOMIC INSIGHT
Table 16: Proportion of participants who are price focused making good choices
Trial % good choices N
No clicks 70% 218
Two clicks 59% 173
Online form 58% 139
Source: Economic Insight trial (N=530)
As can be seen, even those that chose a Legal & Co. website because of its price
made better choices when prices were ‘no clicks’ away.
Similar results are found when looking at those that spent at least 10 minutes
on the trial.
By exact and approximate price recall
The following table illustrates the proportion of good choices given different
pricing frames for those with exact price recall.
Table 17: Proportion of participants with exact price recall making good choices
Trial % good choices N
No clicks 94% 49
Two clicks 84% 32
Online form 100% 7
Source: Economic Insight trial (N=88)
As can be seen, 100% of participants who were presented with the price after
filling out an online form made good choices, compared to 94% of those who
were presented with prices on the home page and 84% of those who had to
click twice to obtain the pricing information.
Looking at those with approximate price recall, the following table illustrates
the proportion of good choices under different price frames.
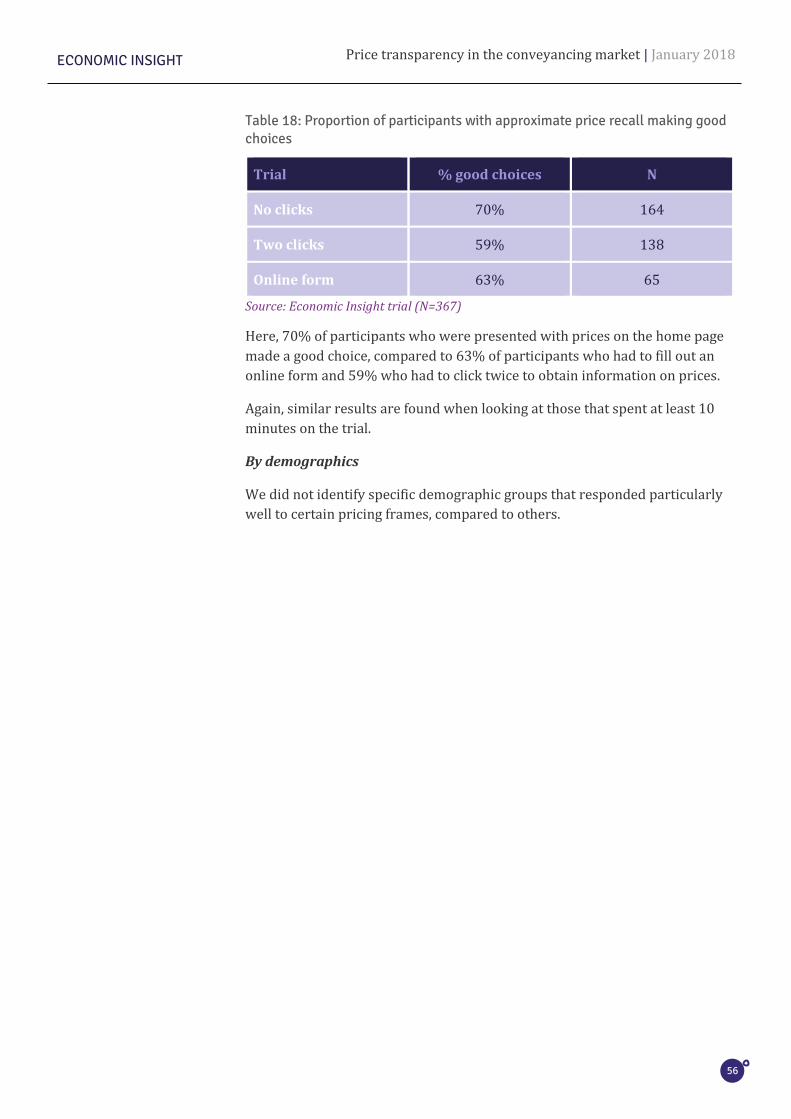
Price transparency in the conveyancing market | January 2018
56
ECONOMIC INSIGHT
Table 18: Proportion of participants with approximate price recall making good choices
Trial % good choices N
No clicks 70% 164
Two clicks 59% 138
Online form 63% 65
Source: Economic Insight trial (N=367)
Here, 70% of participants who were presented with prices on the home page
made a good choice, compared to 63% of participants who had to fill out an
online form and 59% who had to click twice to obtain information on prices.
Again, similar results are found when looking at those that spent at least 10
minutes on the trial.
By demographics
We did not identify specific demographic groups that responded particularly
well to certain pricing frames, compared to others.

Price transparency in the conveyancing market | January 2018
57
ECONOMIC INSIGHT
7. Results relating to the reflections on the choices made
This section sets out respondents’ reflections on the choices they made,
including how satisfied and confident they were in them.
• Most respondents to the online survey were satisfied or very satisfied with
the service they received (82%) and considered it to be value for money
(72%). Consistent with this, 61% of respondents said that they would make
the same choices again.
• Respondents paying more or less than they expected are more likely to say
that they would do things differently next time, highlighting the importance
of price-related outcomes to them.
• Most participants in the online trial (68%) were confident or very confident
in the choices they made. However, there is not a strong connection
between stated confidence and the quality of choices participants made.
• Around 30% of participants said that they would like the opportunity to
speak to someone from Legal & Co. to help them make their choice, again
indicating that “one size does not fit all” when it comes to information
provision.
The rest of this section is split into three parts: respondents’ satisfaction with
the choices they made; participants’’ confidence in the choices they made; and
additional information that participants would have liked.

Price transparency in the conveyancing market | January 2018
58
ECONOMIC INSIGHT
Respondents’ satisfaction with the choices they made
The following chart demonstrates respondents’ satisfaction with the solicitor’s
overall service. Most respondents (82%) were satisfied with the service they
received. This did not vary by how the prices were presented to the
respondents.
Figure 22: Satisfaction with solicitors’ service
Source: Economic Insight house buyer survey (N=1,001)
The next chart illustrates whether respondents to the online survey
considered the services they received to be value for money. Again, most
respondents (72%) agreed that the service they received had been value for
money.
35%
47%
9%
5%2%1%
Very satisfied
Fairly satisfied
Neither satisfied nor dissatisfied
Fairly dissatisfied
Very dissatisfied
Don't know/can't remember
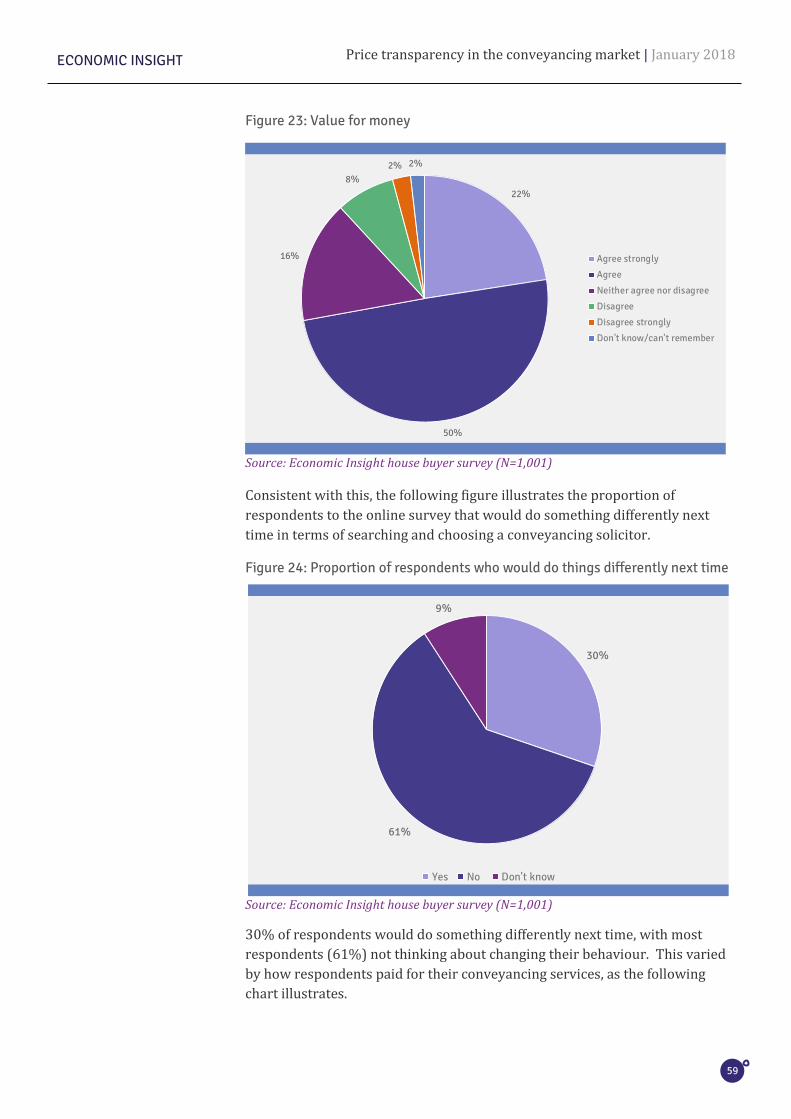
Price transparency in the conveyancing market | January 2018
59
ECONOMIC INSIGHT
Figure 23: Value for money
Source: Economic Insight house buyer survey (N=1,001)
Consistent with this, the following figure illustrates the proportion of
respondents to the online survey that would do something differently next
time in terms of searching and choosing a conveyancing solicitor.
Figure 24: Proportion of respondents who would do things differently next time
Source: Economic Insight house buyer survey (N=1,001)
30% of respondents would do something differently next time, with most
respondents (61%) not thinking about changing their behaviour. This varied
by how respondents paid for their conveyancing services, as the following
chart illustrates.
30%
61%
9%
Yes No Don't know
22%
50%
16%
8%2% 2%
Agree strongly
Agree
Neither agree nor disagree
Disagree
Disagree strongly
Don't know/can't remember

Price transparency in the conveyancing market | January 2018
60
ECONOMIC INSIGHT
Figure 25: Proportion of respondents who would do things differently, by price paid
Source: Economic Insight house buyer survey (fixed fee, N=565; estimate of total cost, N=287, hourly fees, N=75)
Respondents who paid using a rate card or based on hourly rates were more
likely to state that they would do things differently next time – 43% of
respondents, compared to 29% of those paying using fixed fees and 32% of
those paying an estimate of the total cost. This could be because those that
paid under a non-fixed fee were more likely to have overpaid than those
paying under a fixed fee (26% versus 12%).
Moreover, respondents who paid a price higher than they expected were more
likely to say that they would do something differently next time, too. This is
illustrated in the chart overleaf.
29% 32%43%
62% 60%
53%
9% 8% 4%
0%
10%
20%
30%
40%
50%
60%
70%
80%
90%
100%
Fixed fee Estimate of total cost Hourly fees / rate card
Don't know
No, I would not dosomethingdifferently
Yes, I would dosomethingdifferently
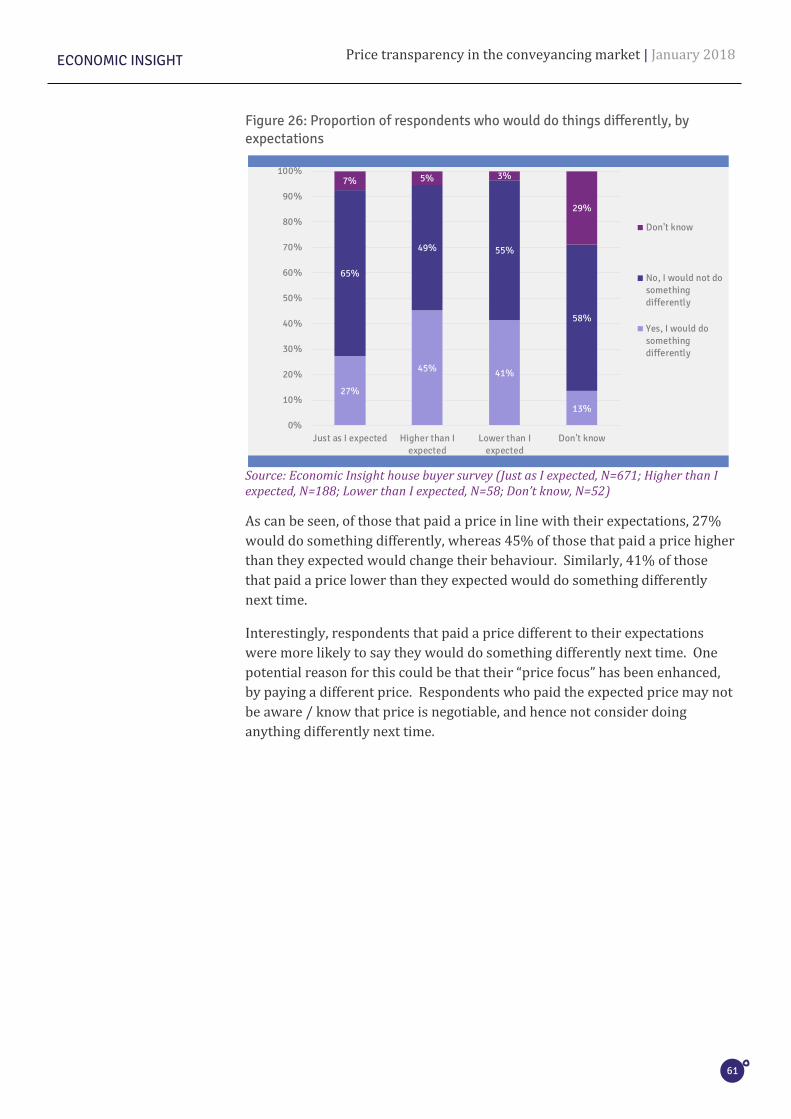
Price transparency in the conveyancing market | January 2018
61
ECONOMIC INSIGHT
Figure 26: Proportion of respondents who would do things differently, by expectations
Source: Economic Insight house buyer survey (Just as I expected, N=671; Higher than I expected, N=188; Lower than I expected, N=58; Don’t know, N=52)
As can be seen, of those that paid a price in line with their expectations, 27%
would do something differently, whereas 45% of those that paid a price higher
than they expected would change their behaviour. Similarly, 41% of those
that paid a price lower than they expected would do something differently
next time.
Interestingly, respondents that paid a price different to their expectations
were more likely to say they would do something differently next time. One
potential reason for this could be that their “price focus” has been enhanced,
by paying a different price. Respondents who paid the expected price may not
be aware / know that price is negotiable, and hence not consider doing
anything differently next time.
27%
45% 41%
13%
65%
49% 55%
58%
7% 5% 3%
29%
0%
10%
20%
30%
40%
50%
60%
70%
80%
90%
100%
Just as I expected Higher than Iexpected
Lower than Iexpected
Don't know
Don't know
No, I would not dosomethingdifferently
Yes, I would dosomethingdifferently

Price transparency in the conveyancing market | January 2018
62
ECONOMIC INSIGHT
Participants’ confidence in the choices they made
The following chart illustrates how confident participants to the online trial
were in their decision.
Figure 27: Proportion of participants who are confident in their choice
Source: Economic Insight trial (N=4,001)
62% of participants were confident in their choice and 12% were not
confident. Men and those aged 16-34 are more confident in their decision (see
Appendix 3.2), but tended to choose the higher priced options.
Overall, 59% of those that stated that they are confident or very confident
made a ‘good’ choice. This did not vary much by demographics or time spent
on the trial (of those spending more than 10 minutes and being confident or
very confident in their choices 60% made a ‘good’ choice).
13%
48%
20%
7%
5%4% 1%
Very confident
Confident
Neither / nor
Not confident
Not at all confident
Don't know
I'd prefer not to say
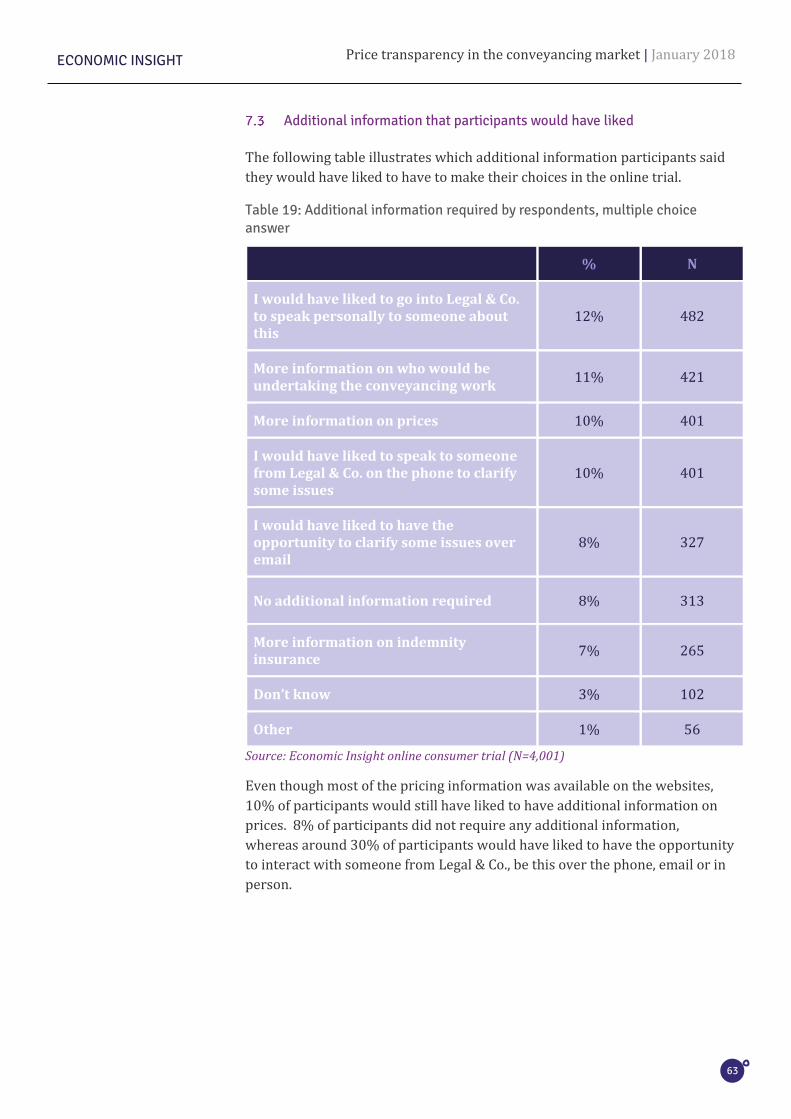
Price transparency in the conveyancing market | January 2018
63
ECONOMIC INSIGHT
Additional information that participants would have liked
The following table illustrates which additional information participants said
they would have liked to have to make their choices in the online trial.
Table 19: Additional information required by respondents, multiple choice answer
% N
I would have liked to go into Legal & Co. to speak personally to someone about this
12% 482
More information on who would be undertaking the conveyancing work
11% 421
More information on prices 10% 401
I would have liked to speak to someone from Legal & Co. on the phone to clarify some issues
10% 401
I would have liked to have the opportunity to clarify some issues over email
8% 327
No additional information required 8% 313
More information on indemnity insurance
7% 265
Don’t know 3% 102
Other 1% 56
Source: Economic Insight online consumer trial (N=4,001)
Even though most of the pricing information was available on the websites,
10% of participants would still have liked to have additional information on
prices. 8% of participants did not require any additional information,
whereas around 30% of participants would have liked to have the opportunity
to interact with someone from Legal & Co., be this over the phone, email or in
person.
Price transparency in the conveyancing market | January 2018
64
ECONOMIC INSIGHT
8. Conclusions and recommendations
Conclusions
We suggest that the research points to the following conclusions:
• It supports the view that increasing the availability of price-related
information is likely to improve consumer decision-making in relation to
conveyancing services, as previously concluded by the CMA for legal
services more generally.
• The research additionally suggests that increasing consumers’ “price
focus” – which itself may be influenced by increasing the availability of
price-related information – will also contribute to improvements in
consumer decision-making. The results of the online survey and online
trial suggest that a high proportion of consumers do not focus on price
when choosing a conveyancing provider, even though they say that price
matters to them.
• The research further shows that some consumers pay more than they
expected to, even under an “all-inclusive” fixed fee pricing model.
Although this is more likely to happen under an hourly rate pricing model,
there is evidence of it occurring under an all-inclusive fixed fee pricing
model, too. It is not clear from the survey whether this happens because
firms are quoting an all-inclusive fixed fee basis and then not departing
from it (an emerging form of “bait pricing”?) or because consumers
misunderstand the pricing model that they have signed up to or both.
• The research suggests that in relation to conveyancing, providers could
adopt a range of pricing models. Not all consumers want a fixed fee
pricing model, even when it would be possible to offer one – and the
evidence is not clear cut on the effect of different pricing models on the
quality of consumer decision-making. The results of the online survey and
the online trial suggest that consumers sometimes choose an hourly rate

Price transparency in the conveyancing market | January 2018
65
ECONOMIC INSIGHT
or process / staged pricing model, even when a fixed fee model is
available.
• The research suggests that consumers make better decisions when prices
are “easier to access”. We found that the best decisions in the online trial
were made when prices were available on the home page of the Legal &
Co. website, compared to prices being ‘two clicks’ away or obtainable via
an online form.
• Finally, this research suggests that intermediaries, such as estate agents
and financial advisors, appear to have a significant influence on consumer
choice and could play an important role in helping to increase the
availability of price-related information and consumers’ “price focus”, as a
large proportion of consumers appears to follow their recommendations.
Considering these conclusions, we set out several recommendations below.
Recommendations
In relation to the conclusions above, we would recommend that the SRA
considers exploring the following issues.
• The research suggests that there is a good case for considering whether
there are ways of increasing “price focus” amongst consumers, alongside
increasing price transparency amongst firms. This is not a
straightforward thing to do. The Legal Choices website, run by frontline
regulators, provides consumers with information on important matters
when they have to make choices regarding legal issues and lawyers. One
possibility would be to ensure that the Legal Choices website makes clear
that consumers have a choice of price, as well a choice of provider.
• The research further shows that some consumers pay more than they
expected to. This raises various questions, for example why does it
happen and what could be done about it? One way of addressing this issue
occurring for consumers paying under a fixed fee pricing model would be
to have a common definition of a what an “all-inclusive fixed fee” pricing
model is. That is, if a firm adopts such a pricing model, consumers should
expect to pay no more than the fixed fee quoted – otherwise is it right to
advertise it as a “fixed fee”?
• Regarding minimum disclosure price requirements, SRA might usefully
consider providing guidance on how and when price-related information
is provided (which influences the effort that consumers must expend to
find it) as well as what price-related information is provided.


67
Economic Insight Limited
125 Old Broad Street London
EC2N 1AR 0207 100 3746
www.economic-insight.com
WE MAKE ECONOMICS RELEVANT
Economic Insight Ltd is registered in England No. 7608279.
Whilst every effort has been made to ensure the accuracy of the material and analysis contained in this
document, the Company accepts no liability for any action taken on the basis of its contents. Economic Insight
is not licensed in the conduct of investment business as defined in the Financial Services and Markets Act 2000.
Any individual or firm considering a specific investment should consult their own broker or other investment
adviser. The Company accepts no liability for any specific investment decision, which must be at the investor’s
own risk.
© Economic Insight, 2018. All rights reserved. Other than the quotation of short passages for the purposes
of criticism or review, no part of this document may be used or reproduced without express permission.


