Price indexes for telecom market: An application to European market of leased lines
Price indexes for telecom market: An application to European market of leased lines
Authors Dimitris VAROUTAS 1 Konstantina DELIGIORGI
Christos MICHALAKELIS Thomas SPHICOPOULOS
(University of Athens)
Abstract
The development of telecommunication technology is in general highly correlated with
the evolution of prices for telecommunication services. This chapter deals with the study
of prices for telecommunication services and the construction of a price index by
hedonic approach. A description of the theoretical models and methodologies by
functional forms of both hedonic approach and matched model is given and application
of these models in European telecommunication market is performed. Evidence from
Central and Eastern Europe outlines telecom market behavior and contributes to better
understanding of Europe.
1 Corresponding author: Dimitris VAROUTAS, Department of Informatics and Telecommunications, University of Athens, Panepistimiopolis, Ilisia, GR15784 Tel: +302107275318, Fax: +302107275601, E-mail: [email protected]
Page 1 of 32

Price indexes for telecom market: An application to European market of leased lines
1 Introduction
1.1 An overview of the telecommunication sector in Central - Eastern
and Western Europe.
The telecommunication industry is one of the most rapidly growing sectors around the
world. The trigger that initiated the changing processes was mainly the transition from
monopolies to more competitive markets. However, this transition didn’t occur
simultaneously in all countries. In fact, some countries followed at a very late time, even
after year 2000, whereas some haven’t fully integrated their market structures yet so as
to converge to competitive markets. The above considerations evidently apply for the
Europe as well, regarding telecommunications. The most important affecting factors are
increasing investments in telecommunication networks, liberalization of markets and of
course the rapid technological change. Generally speaking, the globalization of the
economy in Europe provoked the necessity of a regulatory framework by the
commission of European countries.
The consequences of market liberization in telecommunications are related to social
changes recorded, as new products and services were issued and spread out to the
consumers who, in turn, faced a variety of new choices to maximize their perceived
utility. This triggered a shifting to the existent demand-supply equilibrium, which forced
telecommunication companies to heavily reconsider their strategic plans in order to
satisfy consumers’ new needs and demands. At that point the need for the existence of
national telecommunication regulators was apparent, for making the necessary
legislation establishments.
Following progress steps of Western European, Eastern European countries are moving,
noticeably fast, towards catching up with the Western Europe countries in investments
Page 2 of 32

Price indexes for telecom market: An application to European market of leased lines
dedicated to telecommunications. Although the level of existing investments in Eastern
European countries is quite lower than that of Western countries, the rate by which
Eastern countries are investing in telecommunications is remarkable. For example,
Estonia’s and Czech Republic’s investments in this area are higher than the Western
Europe’s average.
1.2 From monopoly to competition
Initially, a typical governmental approach was that telecommunications were so
important that it should be necessary to have governmental and monopolistic handle
and protection. The reason for this was for strategic purposes, as well as for military
security reasons. However, during the last two decades of the 20th century
reconsideration of the optimal strategy led to liberalization decisions, which happened
with an observable time lag for many countries in Europe. For example England adopted
liberization in telecommunications in 1991 whereas Greece in 2001. Moreover, Bulgaria,
Lithuania and Romania are expected to make their move to a competitive
telecommunications market in 2006.
Legislation alone doesn’t seem to be enough for the liberalization process as the
transition from a central planned economy into a competitive market is a quite
complicated procedure. This is possible to be counterbalanced if the customer is
adequately informed and able to react towards his surplus maximization, in order to
achieve better level of his utility. However, generally this is not the case. Within Europe
there is an obvious difference between North and South. In some European countries
Page 3 of 32

Price indexes for telecom market: An application to European market of leased lines
telecommunications achieved a great development, but this could have been driven by
European Community policies as this seemed a prosperous choice for attracting
investments and boosting competition.
Table 1 Year of telecom market liberization for countries of Europe
Country Telecom market liberalization
United Kingdom 1991 Sweden 1996 Nertherlands 1997 Italy 1997 Belgium 1998 Austria 1998 France 1998 Germany 1998 Spain 1998 Luxembourg 2000 Ireland 2000 Portugal 2000 Greece 2001 Czech Republic 2001 Estonia 2001 Polland 2001 Slovenia 2001 Hungary 2002 Latvia 2003 FYROM 2003 Bulgary 2006 Lithuania 2006 Romania 2006
Source: Yankee Group Europe, (1997)-Regulatory Developments, (2000)
Sweden could be considered as the example of a major telecom representative where
no monopolies exist. On the other hand, privatization raised other social problems, like
staff reduction
Page 4 of 32

Price indexes for telecom market: An application to European market of leased lines
1.2.1 Rapid technological change.
Rapid technological improvements turned out to be the main drivers for improving the
quality of the offered services. Innovations in electronics established telecommunications
industry as an international market. The main benefit is the international industrial
cooperation which made Research and Development sectors provide industry with better
products, as everyone contributed to the whole, instead of working within its strict
boundaries. An indicative example of this cooperation is the digitalization of the
telecommunication networks.
“if knowledge is increasing in a society and it is more than a sign for modern economy-it
will be the problem for organizational changes and integrative steps, it is necessary to
name this society “Knowledge society:”2
This is true and is already a fact, leading to a number of changes in countries’ and
companies’ profile. Companies needed resources, which is translated into people,
engineers and capitals. For example, a country like Austria would be very small to
achieve this. Switzerland was the last one that tried this development by its own.
Another reason for this international cooperation was derived from the manufacturing of
smaller and smaller parts. These parts are constructed in countries which have cheap
‘labor costs’. As a result companies were merged, because they could not afford
competition among each other. In Eastern Europe the quality of networks is generally
low, with digitalization in low levels especially in Ukraine, Moldova, Belarus and Bulgaria.
2 Günther J.‘Regulation of telecommunications in Europe ‘
Page 5 of 32
Price indexes for telecom market: An application to European market of leased lines
1.2.2 Operators and Carriers
“Operators” are used in the context of network operators that install, manage and
operate telecommunication transmission network to offer public services on telephony or
on network (leased lines). They are classified into local operators who offer services to
users who live in specific areas and into national operators who offer services no matter
where the user lives. Following the corresponding Commission’s legislation they have to
provide a minimum set of leased lines according to specific technical standards.
Across Member states a different number of operators can be found that have
license/authorization to offer network services with different entrance times in the
market. As a result, users and consumers continue to enjoy an increased number of
potential choices, accompanied by reduction in prices. This forces operators to
continuously develop new pricing plans and scenarios considering different prices for the
same service and different target groups.
In Eastern Europe a few operators are making much profit. Low Internet penetration
suppresses demand. The average Internet penetration rate in countries which have
recently joined the European Union (EU), was around one third lower than in the old
Member States of Europe, in the middle of 2004.
In addition to the above, carriers are promoted across Europe. Carriers are companies
that buy lines and are independent of technical changes so they can be more efficient.
Their activities include mainly buying big capacities at lower prices and renting them to
customers. This is expected to lead to a continuing reduction of prices in the competitive
market, since customers can choose among several carriers. Moreover, number
Page 6 of 32

Price indexes for telecom market: An application to European market of leased lines
portability is an important benefit for the customers as they are able to switch to
another operator retaining the same phone number
1.2.3 Delivery and repair times of telecommunication services.
The period between the time that a user makes a request for a leased line provision
until this request is fulfilled, is defined as delivery time. There is no straightforward way
for measuring it for each country, due to the number of existing operators and the
various estimation methods applied. However, it seems that serious delays still remain in
some countries. Germany, Austria, Ireland delivery periods vary from four to seven
months. On the contrary, Greece and Luxembourg have relatively quick response times.
This problem impacts the telecommunication sector and makes customers demand
better facilities and services.
As to repair time, it is defined as the period between the time that a failure message is
reported to the provider of the leased line, until it has been re-established and it is
notified back in operation to user. As in delivery time, repair times vary, sometimes
remarkably, across member states. They also depend on the type of the particular
leased line. In Sweden, for example, repair time for a 2 Mbits/s line is about one day,
whereas in Germany it is approximately 15 hours, while for 64Kbit/s is less than ten
hours. However, comparing each year’s services performance to the corresponding past,
major improvements in the quality of service provided and the response times are
observed. This of course is primarily driven by the continuous competition among
companies, a major consumer benefit of a competitive market.
Page 7 of 32

Price indexes for telecom market: An application to European market of leased lines
Once again, these aspects point out an important impact on the market, because the
quality of service and the response time for repairing it, in case any damage happens,
shows a continuing competition among companies, so as customers be satisfied and
prices declined.
2 Development of a price index methodology
2.1 Theoretical background
Econometric methods have been widely used to calculate price indexes since a long time
ago. Typical examples are price indexes for cars (Griliches, 1961), refrigerators (Triplett
and Mc Donald, 1977) and of course for computers (Cole 1986). Furthermore, regarding
information technology such indexes are met in (Cartwright and Smith, 1988) and
(Moreau, 1991). Statisticians use econometric methods in the U.S.A but the root of
hedonic approach, which is a part of economic research, goes back to (Waugh, 1928),
(Court, 1939) and (Stone, 1954, 1956).
Someone has to choose between two types of econometric methods: a) hedonic
methods and b) matched model methods, each of which has both advantages and
disadvantages to present.
One approach is to apply the ‘hedonic methods’, such as two - period method, single-
period method, two - period method with an indicator for new models, or single-
regression method. Such kinds of indexes are commonly used for products, which face
rapid technological changes.
Hedonic methods refer to regression models in which product or service prices are
related to product characteristics. In general, hedonic methods are based mainly on the
Page 8 of 32

Price indexes for telecom market: An application to European market of leased lines
idea that a service and its consequent observed price is a bundle of characteristics and
that consumers buy these characteristics, instead of the product itself. These methods
can be used to construct a quality-adjusted price index of a service. (Berndt, 1991) and
(Triplett, 2000) described an overview on hedonic price equations, whereas (Rosen,
1974) states that from a large amount of product varieties, consumer chooses without
influencing prices. Therefore, consumers maximize utility and producers maximize
profits. In hedonic studies it is possible to adjust the price of a service for its quality not
quantity. All of them are based on some estimated coefficients that are inflicted on the
characteristics of the products in both periods; m and m+1. The participating
coefficients can be estimated separately for each year, or can have observations of two
or all years together and estimate a common set of coefficients. The advantage of this
method is that calculations are easy and fast. Indeed hedonic methods are very fast to
apply but the disadvantage is that index price can change even if no new products are
existed, or all prices remain the same.
Another approach is to apply a matched model method such as chained Laspeyres
(LCPI), (LPI), chained Paashe (PCPI), (PPI), chained Fisher, chained Tornqvist or
chained geometric – mean (Okamoto and Sato 2001). A classic Laspeyres index cannot
deal with such complexity due to rapid technological changes or the introduction of new
products (services). In LPI method, an index shows how much the product would cost in
period m+1, relatively to what it cost in period m. Other price indexes function in the
same way, though with slight differences.
The hedonic price indexes are commonly used as approximations to the true cost-of-
living indexes (COLI) which indicate how much money a consumer would spend in
period m+1, as compared to the corresponding amount he needed in period m, in order
Page 9 of 32

Price indexes for telecom market: An application to European market of leased lines
to maintain the same level of his utility in period t as in period t0 (Jonker, 2001). The
solution to this is the determination of the consumer’s profile so as to react towards a
varied and fast-changing supply of products. But how can this profile be determined
when everyone has different needs and requirements? No matter what profile is
decided, it will be a hypothesis and an assumption that will correspond to a specific
model. Moreover, consumer’s desire is not stable and this is not unreasonable because
there is a great offer as the ‘goods’ of technology become more and more attractive.
However and according to this approach, the price index is constructed only using the
prices of products, which are available in two adjacent periods. Finally, with the matched
models approach products’ prices of identical quality are compared between two
periods.
2.2 Matched model method (Laspeyres method)
According to Laspeyres and in order to create a price index, the number of units sold in
a period m (for example a month) are observed and the average unit price in the period
m and m+1. These data are used as input to the following formula:
∑
∑
=
=+
+ = n
iimim
n
iimim
mm
qp
qpI
1
11
/1 (Eq. 1)
As aleady mentioned, price indexes’ construction is based on the matched model
method of Laspeyres with chaining average unit prices which refer to a previous period,
among units sold in the same period.
Page 10 of 32

Price indexes for telecom market: An application to European market of leased lines
The problem with such a price index is that a basket of products does not remain the
same over time. Furthermore, it is the case that some products disappear from the
market (especially in the telecom market) and some others are modified, so someone
has to introduce new products in order to preserve the same indifference basket of
customers’ preferences. If quality changes are ignored the resulting price index will be
biased.
2.3 Hedonic method
The term ‘hedonic methods’ refers a ‘hedonic function’ f(X) use in economic
measurement, where
(Eq. 2) i iP = f(X )
with Pi being the price of a variety i (or a model) of a product and Xi a vector of
characteristics associated with the variety. The hedonic function is applied on different
characteristics among varieties of the product, in order to calculate the price index.
As soon as the determination of the characteristics that should be considered is
achieved, then for a number of N telecommunication products in period m and in period
m+1 the following set of equations is calculated:
i,m 0 1 1,i 2 2,i i,mln (p ) = b +b *X + b *X + u i = 1,...,N (Eq. 3)
Page 11 of 32

Price indexes for telecom market: An application to European market of leased lines
i,m+1 0 1 1,i 2 2,i i,m+1ln (p ) = b +b *X + b *X + u (Eq. 4)
where bi are the participating coefficients that must be estimated.
2.3.1 True and candidate model by using the hedonic function
The main assumption of this approach is that there is a set of consumers having
preferences over some characteristics of a service. The construction of a price index is
complicated by product-pricing limits such as different charges for various
characteristics. Therefore the definition of a basket of services should come first and the
model that describes the attributes (characteristics) of a product and their prices is given
by the function:
(Eq. 5) iP =f(Xb)+u
where X =(x1,x2,……xn) is an nxp matrix of random regressors, xi and b are px1 vectors
and f(Xb) is an nx1 vector with i-th component f(xi΄b) (i=1,2,3,….n). Moreover, the
error term u, for a given X=x, is assumed to follow the N (0,σ2 I nxn) distribution, σ
being an unknown scalar. Another assumption is that f is an unknown function and b
estimators have unitary norm. The model described in (Eq. 5) constitutes the unknown
“true model” which generates the observed data. The candidate models are considered
in a way similar to the construction of the true model, by defining the characteristics
that are of importance to the construction of the price index. Following the above, the
main objective remains the estimation of the minimum distance between the true and
candidate models. The result of this procedure is the choice of the model from a pool of
candidate ones, that best fits to the data generated by the true one.. The above can be
Page 12 of 32

Price indexes for telecom market: An application to European market of leased lines
implemented using the single-index models regression analysis, which is presented in
the following sections.
2.3.2 Single- Index Model
Regression analysis is a common approach used for identifying the relationship between
a response variable, y, and a vector of regressors, x. Quite often, a linear regression
model of type E(y)=x’b is used for estimating the impact of the regressors to the
expected response, E(y). If more precise estimation are needed, single-index models
can be used which are of the type E(y)=f(x’b), where the link function f is unknown.
This approach is quite advantageous as the use of single-index models mitigates the risk
of misspecifying the link function and has the ability to overcome the curse of
dimensionality and the capability to extrapolate beyond the support of x.
Single-index models can be estimated by using iterative or direct methods. In the first
case, the goal is to obtain a consistent estimator of f, f , and solve the consequent
nonlinear optimization problems to obtain the consistent estimator for b, b .
On the other hand, direct methods are not iterative and provide a consistent estimator
of b without requiring estimation of f.
Whichever of the two methods is followed the result will be the same. However, in the
iterative method, computation is intensive, whereas the use of direct methods involves
easier computations, as the b relative weights are estimated by the SIR (Sliced Inverse
Regression) estimator, (SIR , Li 1991,JASA) which does not consider the estimation of
function f a prerequisite.
Page 13 of 32

Price indexes for telecom market: An application to European market of leased lines
Once the relative weights bi, , are estimated, an index z is constructed
and by applying LPR (Local Polynomial Regression) (Simonoff 1996) the estimation of
the nonlinear link can be achieved.
SIRb SIRbXz ˆ=
)(ˆ zfprice =
As soon as f, ˆ ˆf and b are estimated by iterative or direct method, covariance is
computed as in (Eq. 6)
nbXfYbXf )}ˆ(ˆ{})ˆ(ˆ{ˆ 2 −′−Υ
=σ (Eq. 6)
By using the most suitable model is determined from a variety of candidate
models by applying the Akaike Information Criterion (AICc criterion), which is a measure
of the discrepancy between the true and the candidate models (Naik and Tsai, 2001).
)ˆ,ˆ,ˆ( 2σbf
2.3.3 The AICc criterion
In order to find out what is the best model from a variety of candidate models that
describe a product with a set of characteristics the following equations are used:
(Eq. 7) 20d(f,b,σ )=E {-2*logf(Y)}
where f(Y) shows the possibility for the candidate model and E0 shows expectation
under the true model.
Because of the heavy computations involved in evaluating the above distance, due to
the unknown function f, without having great inclination the following assumptions
facilitate the computation of the AICc value.
Page 14 of 32

Price indexes for telecom market: An application to European market of leased lines
Assumption 1. There following equation holds YHXbf np≅*)(~. This has the meaning
that there exists a smoother matrix Hnp so that f is the projection of Y through that hat
matrix.
Assumption 2. Similarly, *)(*)}(~{ 00 XbfXbfE ≅
Assumption 3. In addition to the above,
*)}(ˆ{*)ˆ(~*)(~)ˆ(ˆ XbfYHbbVXbfbXf p −≅−≅− holds,
where XXbfbXbfVVVVVH bbp *).(~|/)(~~,~)~~(~*
1 =∂∂=′′= =− and .f is the derivative of
f
The Akaike Information Criterion (AIC) is then given by the formula of (Eq. 8)
nHHHHtrnHHHHtr
AICnppnpp
nppnppc /}2)ˆˆˆˆ({1
/)ˆˆˆˆ(1ˆlog 2
+−+−
−+++= σ (Eq. 8)
where is obtained by replacing b* and VVVVVH pˆ,ˆ)ˆˆ(ˆˆ 1 ′′= − Vinf ~.~
with estimators
, evaluated at and tr is the trace of the corresponding matrix. fandb ˆˆnpnp isHH bXXb ˆ=
The best fitting model is considered the one having the smaller AICc value.
Page 15 of 32

Price indexes for telecom market: An application to European market of leased lines
3 Model evaluation
3.1 Telecommunication services - National leased lines
A leased line is a permanent connection between two sites. By connecting to a Network
Access Point (NAP) via a leased line, someone has a permanent access to the Internet
for his whole network. Prices usually depend on the distances and on the speed rate of
transmission. A leased line offers guaranteed better access connections.
For the needs of the study of the present chapter, national leased line data from 1997
until 2003 have been used, covering three (3) categories of distances: 2 km (local
circuits), 50 km and 200 km.
In order to properly reflect the tariff structures used in some countries, the circuits may
be considered in one of two different ways, depending on tariff structure. It is important
to recognize that both of these are correct, and will depend on the tariff elements used
in the pricing.
Some operators apply termination charges per local end, without necessarily covering
the local tail circuit within that charge. This situation would correspond with the second
method above. Some carriers offer 2 Mb/s circuits as both structured and unstructured.
In this analysis only unstructured circuits are included. Also, some carriers offer different
types of leased lines, often in the form of “basic circuits” and circuits in a managed
network. Only “basic circuits” are included in this analysis, as the managed network
services are not comparable between carriers. Lately, a few carriers have decided not to
publish their prices for some or all types of leased lines, which consequently makes it
increasingly difficult to present a full overview of the prices and to compare the results
of the research.
Page 16 of 32
Price indexes for telecom market: An application to European market of leased lines
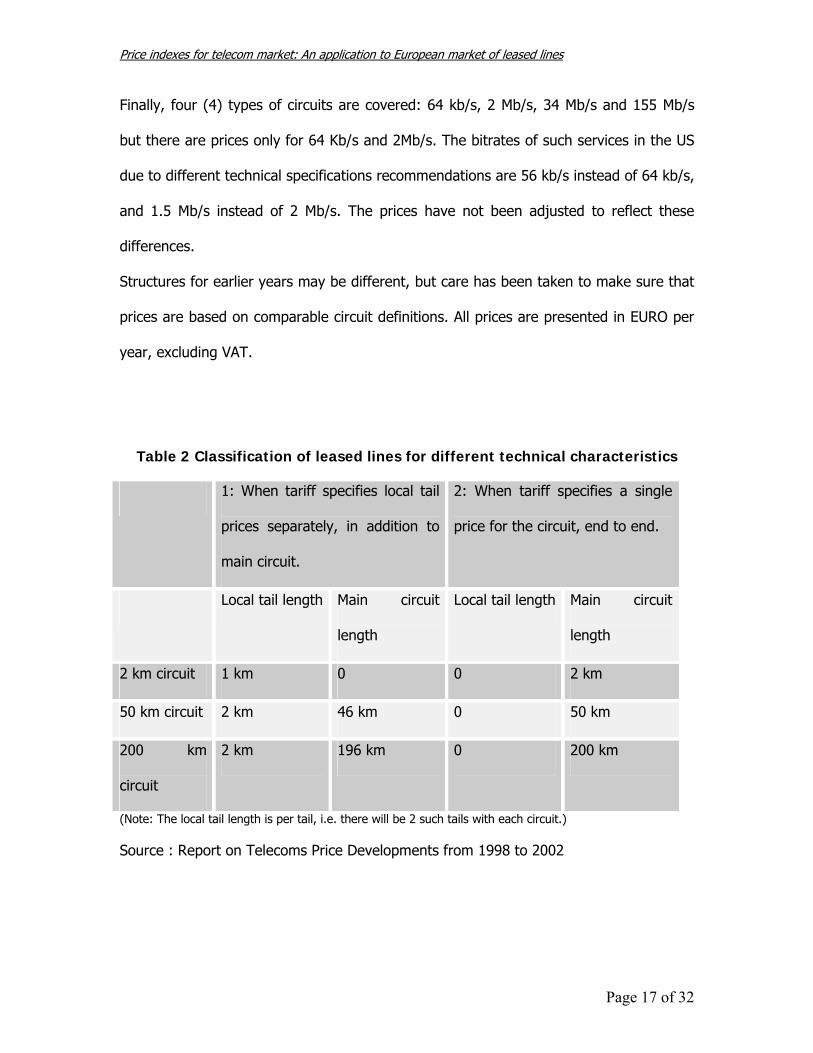
Finally, four (4) types of circuits are covered: 64 kb/s, 2 Mb/s, 34 Mb/s and 155 Mb/s
but there are prices only for 64 Kb/s and 2Mb/s. The bitrates of such services in the US
due to different technical specifications recommendations are 56 kb/s instead of 64 kb/s,
and 1.5 Mb/s instead of 2 Mb/s. The prices have not been adjusted to reflect these
differences.
Structures for earlier years may be different, but care has been taken to make sure that
prices are based on comparable circuit definitions. All prices are presented in EURO per
year, excluding VAT.
Table 2 Classification of leased lines for different technical characteristics
1: When tariff specifies local tail
prices separately, in addition to
main circuit.
2: When tariff specifies a single
price for the circuit, end to end.
Local tail length Main circuit
length
Local tail length Main circuit
length
2 km circuit 1 km 0 0 2 km
50 km circuit 2 km 46 km 0 50 km
200 km
circuit
2 km 196 km 0 200 km
(Note: The local tail length is per tail, i.e. there will be 2 such tails with each circuit.)
Source : Report on Telecoms Price Developments from 1998 to 2002
Page 17 of 32

Price indexes for telecom market: An application to European market of leased lines
For all these reasons prices for 64kb/s and 2Mb/s are compared for all countries of
Europe so as to reflect the same tariff structure. This overview about data prices and
circuits appears in ‘Report on Telecoms Price Developments from 1997 to 2000’ and
‘Report on Telecoms Price Developments from 1998 to 2002’ which are produced for
European Commission by Teligen Ltd [Teligen (2000), (2002)].
As it can be observed, national leased lines tariffs still show significant variations across
Member States.
However, from 1997 to 2003 there are significant reductions in many counties such as
Belgium, Spain, Italy and Luxembourg. For 64kbit/s lines in all circuits (2km, 50km and
200km) the most noticeable fact is that charges remained stable for two or three years
depending on the country. It seems as if companies imitate one another in setting
higher or lower prices. Greece appears to be offering the most expensive services
among Member States for local (2km), 50Km and 200Km in 64kbi/s circuits, whereas the
cheapest ones are provided by Germany. In addition, it is noticeable that in 2002, there
are slight increase in tariffs in Belgium and Austria. For 2Mbits/s lines the reduction is
larger than in 64kbit/s lines. Denmark is the cheapest country for local distances, but
Austria and Luxembourg present an important reduction between 1997 and 2002 while
the UK had an increase from 2001 to 2002. For 50km and 200km circuits, Sweden
presents a remarkable difference from most other countries, followed by Denmark.
On the contrary, in 2Mbit/s lines for 2km distances, Netherlands, Greece, Spain and
Portugal present the highest tariffs, but Greece and Spain moved towards a greater
price reduction than the others. Remarkable downward trend from year 1997 to 2002 is
recorded in Luxembourg, which corresponds to 30% per cent.
Page 18 of 32

Price indexes for telecom market: An application to European market of leased lines
In addition to the above, for the category of 2Mbit/s over 50km, the most expensive
services are provided in Spain and Netherlands followed by Italy and Greece though
Italy has the greatest reduction from 1997 to 2002 from all other countries in Europe.
Spain also presents highest service prices for 2Mbits /s circuits over 200km followed by
Greece and Portugal with a significant price lag from Sweden.
3.2 Models with non linear functions
As described above, a price index for telecommunications can be calculated after
suitably defining a basket of products.
Table 3 European countries leased lines data
BELGIUM LUXEMBOURG DENMARK AUSTRIA GERMANY PORTUGAL GREECE NETHERLANDS SPAIN UNITED FRANCE SWEDEN IRELAND ITALY
The following paragraphs present an example of the above, in which the characteristics
of the product are determined, so as to show the quality of this product. As soon as the
characteristics of a product are determined, applying the hedonic method the product’s
price is estimated. Otherwise the price of a product is estimated “manually”, by
comparing the new product with the most similar old one.
It is assumed that telecommunication products have two characteristics: Distance (dist)
and Transmission rate per second (MB). These two characteristics are widely used from
telecom operators for valuating and selling leased lines across Europe. Table 3 presents
Page 19 of 32

Price indexes for telecom market: An application to European market of leased lines
the European countries participating in evaluation of the method and Table 4 presents
the average values for the two categories of leased lines.
Table 4 Leased lines average price evolution (€) in Europe (1997-2003).
”Rate, Distance”
/ Year
"64,2" "64,50" "64,200" "2048,2" "2048,50" "2048,200"
1997 2.871,93 6.907,29 9.261,07 11.264,64 41.912,93 69.998,07
1998 2.734,29 6.402,00 8.413,71 10.427,14 38.824,29 62.488,29 1999 2.256,00 5.240,57 6.832,29 9.279,43 32.476,29 52.024,29 2000 2.283,43 5.058,00 6.489,43 8.548,29 28.122,00 46.458,00
2001 2.086,29 4.558,29 5.915,14 6.843,43 22.652,57 37.056,86 2002 2.088,86 4.556,57 5.864,57 6.698,57 22.310,57 36.326,57 2003 1.993,71 4.128,86 5.352,00 6.109,71 18.359,14 31.285,71
(Source Teligen , 2002)
The first step regards estimation of, the single-index model. The data are sorted in
ascending order, according to their prices, Pi, and they are divided into a pertinent
number of slices, as equal as possible. For this study and according to the number of
observations (forty two) two slices are adequate, each containing twenty one
observations. Without needing to specify the unknown link function f(.) the SIR
estimators are derived as: )971898.0,235402.0(=SIRb
Page 20 of 32

Price indexes for telecom market: An application to European market of leased lines
SIR Directions
0,00
100,00200,00
300,00400,00
500,00
600,00700,00
800,00
1993
,71
2088
,86
2283
,43
2871
,93
4556
,57
5058
,00
5352
,00
5915
,14
6402
,00
6698
,57
6843
,43
8413
,71
9261
,07
1042
7,14
1835
9,14
2265
2,57
3128
5,71
3632
6,57
3882
4,29
4645
8,00
Prices
Est
imat
ed P
rice
s
Figure 1 Plot of Price (Pi) against SIR directions
Plot of Price versus b*Χ
0,00
10000,00
20000,00
30000,00
40000,00
50000,00
60000,00
70000,00
80000,00
17,0
1
17,0
1
17,0
1
17,0
1
63,6
6
63,6
6
209,
45
209,
45
63,6
6
484,
05
484,
05
209,
45
209,
45
484,
05
530,
70
530,
70
676,
48
676,
48
530,
70
676,
48
676,
48
Average
Figure 2 Plot of prices versus b*X
The SIR estimates are obtained (SIR dierections) (Figure 1) and the plot of prices versus
linear combination of b*X is plotted (Figure 2). Then, by applying local polynomial
Page 21 of 32

Price indexes for telecom market: An application to European market of leased lines
regression (LPR) with a Gaussian Kernel smoothing (Figure 3), an initial estimate of the
shape of the link function kf is acquired.
Figure 3 Local Polynomial Regression with Kernel Smoothing
Trying to examine the relationship between the price of a leased line and the distance
and the transmission rate several shapes of potential link functions are tested, as
candidate models, and the most suitable one that gives the smallest AICc value, is found
to be the one described by (Eq. 9):
(Eq. 9) 0 1 2ln (p) = b +b *dist + b *MB
Page 22 of 32
Price indexes for telecom market: An application to European market of leased lines
Even link functions such as hyperbolic sin or hyperbolic cosine give almost the same
results with the non linear functions.
Although linear model on logged price is not comparable with all the other models,
because of the AICc value, linear model on logged scale has an advantage.
Working in the logged scale using a linear model results shows better fitting
performance. In addition, because of the high R2 value (coefficient of determination),
which compares the variability of the residuals in the model to the variability of the
dependent measure, the model is expected to have a good predictive power.
3.3 Constructing the price index
Supposing that there are N telecommunication products in period m and m+1, the
proposed hedonic price index can be calculated by the following equation:
1/ 1 1 2 1 2ˆ ˆ ˆ ˆ ˆ ˆ( ) (m m m m )I f b Dist b MB f b Dist b MB+ += + − + (Eq. 10)
Using data such as those presented in Table 4, for selected European countries, it can
been observed (Figure 4 and Figure 5) that prices for different distances cannot be
directly compared across different capacities. However, there are similarities and
patterns that should be evaluated. Moreover and according to economic theory, it is
obvious that as the consumer’s demand shifts toward better services corresponding
prices are increased. Because of this behavior, there is no explicit pricing policy for both
characteristics (distance and transmission rate).
Page 23 of 32

Price indexes for telecom market: An application to European market of leased lines
Average annual pricing evolution across Western Europe (bandwidth, distance)
0
1000
2000
3000
4000
5000
6000
7000
8000
9000
10000
1997 1998 1999 2000 2001 2002 2003
Pric
e in
64,2 64,50 64,200
Figure 4 Evolution of prices for 64 Kbps leased lines in Western Europe (average
values)
Average annual pricing evolution across Western Europe (bandwidth, distance)
0
10000
20000
30000
40000
50000
60000
70000
80000
1997 1998 1999 2000 2001 2002 2003
Pric
e in
2048,2 2048,50 2048,200
Figure 5 Evolution of prices for 2048 Kbps leased lines in Western Europe (average
values)
Page 24 of 32
Price indexes for telecom market: An application to European market of leased lines
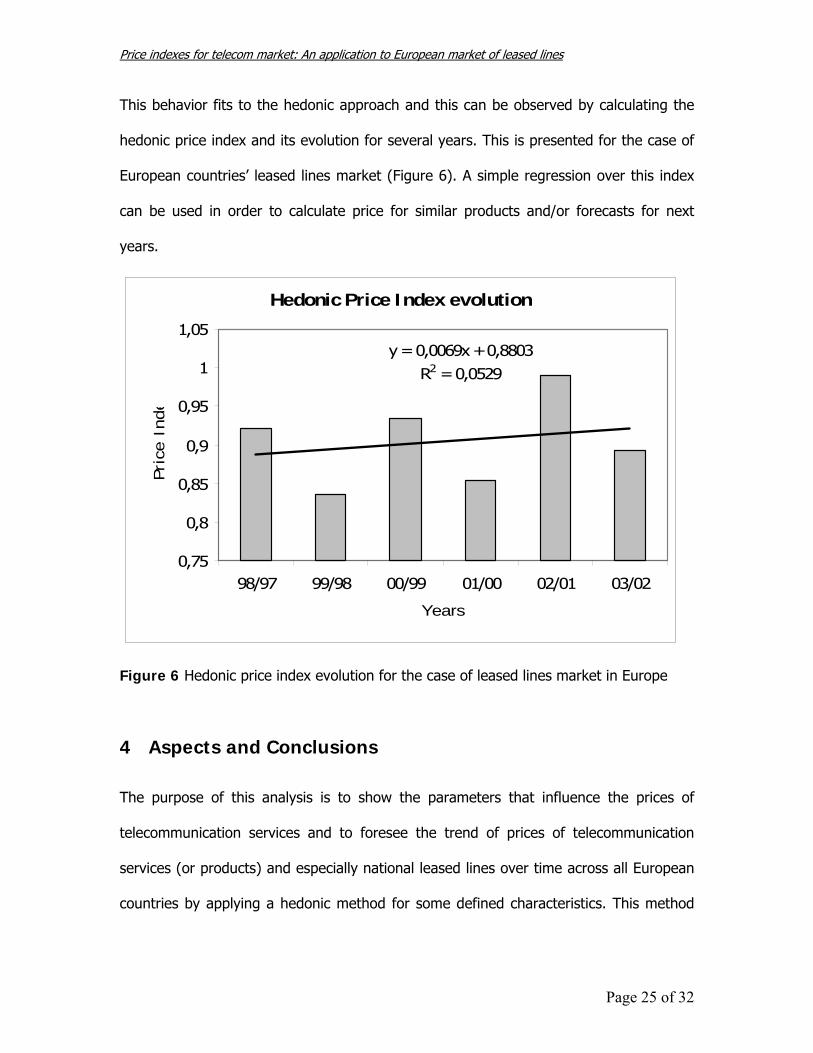
This behavior fits to the hedonic approach and this can be observed by calculating the
hedonic price index and its evolution for several years. This is presented for the case of
European countries’ leased lines market (Figure 6). A simple regression over this index
can be used in order to calculate price for similar products and/or forecasts for next
years.
Hedonic Price Index evolution
y = 0,0069x + 0,8803R2 = 0,0529
0,75
0,8
0,85
0,9
0,95
1
1,05
98/97 99/98 00/99 01/00 02/01 03/02
Years
Price
Inde
Figure 6 Hedonic price index evolution for the case of leased lines market in Europe
4 Aspects and Conclusions
The purpose of this analysis is to show the parameters that influence the prices of
telecommunication services and to foresee the trend of prices of telecommunication
services (or products) and especially national leased lines over time across all European
countries by applying a hedonic method for some defined characteristics. This method
Page 25 of 32

Price indexes for telecom market: An application to European market of leased lines
works better when there is a variety of important characteristics but less satisfactorily
when these change rapidly over time.
Leased lines have important and specific characteristics indeed and their prices vary
slowly over time. The results give a view of telecommunication prices over time and
show how the prices will be fluctuated the next year.
The application of these econometric methods, following the definition of products’
characteristics, provides a reliable and accurate method able to produce an exact
estimate of prices both for new products and over next years. The validity of the model
and the appropriate selection of the functional form that has been chosen to relate price
to characteristics can be validated over next years and more observations.
5 References
Baltas, G., Freeman, J., (2001). “Hedonic Price Methods and the Structure of High-
Technology Industrial Markets”, An Empirical Analysis. Industrial Marketing Management
30,599-607
Bonnetain P., (2003). “A hedonic price model for islands”. Journal of Urban Econ 54, pp
368-377
Buiter, (2004): “To purgatory and beyond”. Conference on challenges for central banks
in an enlarged emu in Vienna
Page 26 of 32

Price indexes for telecom market: An application to European market of leased lines
Budde P. (2004): “Eastern European Infrastructure, fixed voice and data market report”.
Communication Pty Ltd
Berndt, E.R. (1996). “The practice of econometrics: classic and contemporary”.
(Addison-Wesley Publishing).
Cartwright, D.W. and S.D. Smith (1988). “Deflators for Purchases of Computers in GNP:
Revised and Extended Estimates “,1983-88. Survey of Current Business, November
Central and eastern European countries Synthesis of Master Reports,(2000) ,’Regulatory
Developments’
Cole, R. (1986). “Quality –adjusted Price Indexes for Computer Processors and Selected
Peripheral Equipment”. Survey of Current Business, Bureau of Economic Analysis, US
Department of Commerce
Communications Committee: Working Document, ‘Final 2001 report on performance in
the supply of leased lines pursuant to Directive 92/44/EC’ European Commission
Communication from the Commission to the Council , the European Parliament,: The
Economic and Social Committee and the Committee of the Regions (Brussels ,2001),
‘Seventh Report on the Implementation of the Telecommunications Regulatory Package’
Commission of the European Communities
Page 27 of 32

Price indexes for telecom market: An application to European market of leased lines
Document as supplement information in the seventh Report: ‘Status of Licensing and
Fees for Fixed Networks and Services ‘ (August 2001)
Communication from the Commission to the Council , the European Parliament,: The
Economic and Social Committee and the Committee of the Regions (Brussels ,2002),
‘Eighth Report on the Implementation of the Telecommunications Regulatory Package’
Commission of the European Communities
Court, A.T. (1939). “Hedonic Price Indexes with Automotive Examples. The Dynamics of
Automobile Demand”, The General Motors Corporation, New York, 99-117.
Diewert (2003),: ‘Services and the New Economy : Data Needs and Challenges’,
University of British Columbia, Vancouver Canada
Edquist Harald (2005), ‘Do hedonic pricw indexes change history? The case of
electrification’ Stockholm School of Economics
Griliches, Z. (1961),’ Hedonic Price Indexes for Automobiles: An Econometric Analysis of
Quality Change’. In The Price of the Federal Government, General Series no. 73 ,
Columbia University Press for NBER, New York , 137-196
Dietmar, H. and Dietmar, M., (1997), Price indexes for PC database software and the
value of code compatibility, Research Policy 26, 509-520
Page 28 of 32

Price indexes for telecom market: An application to European market of leased lines
Fixler Dennis, Greenless John, Lane Walter, (April 2001), ‘Telecommunications Indexes
in the U.S. Consumer Price Index’, Sixth Meeting of the International Working Group on
Price Indices, Canberrra, Australia
Günther, J., (2001), ‘Regulation of telecommunications in Europe’,Danubue University
Krems ,Austria
Jonker, N. (2001). Constructing quality adjusted price indexes: a comparison of hedonic
and discrete choice methods. De Nederlandsche bank, Econometric Research and
Special Studies Department
Kam Yu, (2001). An elementary Price Index for Internet Service Providers in Canada: A
hedonic Study. Sixth Meeting of International Working Group on Price Indices,
Canberrra, Australia
Lee H.S., Park K., Kim S.Y., (2003). Estimation of information value on the Internet:
application of hedonic price model. Electronic Commerce Research and Applications 2,
73-80
Montella,,M., Mostacci, F., and Zanolini, G.,,(2001), ‘Consumer Price Indexes for
Telecommunication Services in Italy: Work in Progress’ Sixth Meeting of the
International Working Group on Price Indices, Canberrra, Australia
Page 29 of 32

Price indexes for telecom market: An application to European market of leased lines
Moreau, A. (1991a) , ‘A price Index for Microcomputers in France’ , Document de Travail
de la Direction des Statistiques Economiques 9109
Nicholson, J.L. (1967). “The measurement of quality changes”, The Economic Journal,
77, 512-530
Nerlove Marc (1995) : ‘Hedonic price functions and the measurement of preferences :
The case of Swedish wine consumers’, Eur. Econ. Rev. 39 (1995) 1697-1716
Okamoto M. and Sato, T., (2001) Comparison of hedonic method and matched models
method using scanner data : the case of PCs ,TVs and digital cameras. Sixth Meeting of
International Working Group on Price Indices , Canberra ,Australia
Rosen, S. (1974). “Hedonic Prices and Implicit Markets : Product Differentiation in Pure
Competition” , Journal of Political Economy , 92, 34-55
Stone, R. (1954). “The Measurement of Consumer Behaviour and Expenditure in the
United Kingdom, 1920-1938”, Studies in the National Income and Expenditure of the
United Kingdom , 1.
Stone, R. (1956). “Quantity and Price Indexes in National Accounts” Organisation for
European Economic Cooperation.
Page 30 of 32
Price indexes for telecom market: An application to European market of leased lines
Stiroh ,(2001) ‘ The Economic Impact of Information Technology” Federal Reserve Bank
of New York , Academic Press
Prasad A. Naik and Tsai C. L. (2001). “Single –index models selection”, Biometrica,
88,3,pp. 821-832
Li, K. C. (1991). Sliced inverse regression for dimension reduction (with Discussion).
J. Am. Statist. Assoc. 86, 316-42
Rosen, S., (1974). Hedonic Prices and Implicit Markets : Product Differentiation in Pure
Competition, Journal of Political Economy , 92, 34-55
Silver, M.,(1999). Hedonic regressions : an application to VCRs using scanner data,
Omega 28, 399-408
Simonoff, J. S. (1996), ‘Smoothing Methods in Statistics’ New York: Springer
Simonoff, J. S. & Tsai, C. L.. (1999). Semiparametric and additive model selection using
an improved Akaike information criterion. J. Comp. Graph . Statist. 8, 22-40
Stone, R.,(1954). The Measurement of Consumer Behaviour and Expenditure in the
United Kingtom, 1920-1938, Vol. 1, Studies in the National Income and Expenditure of
the United Kingtom , (assisted by D.R. Rowe , W.J. Corlett, R. Hurstfield ,and M. Potter),
Cambridge: University Press.
Page 31 of 32

Price indexes for telecom market: An application to European market of leased lines
Stone, R.,(1956). ‘Quantity and Price Indexes in National Accounts’. Paris : Organisation
for European Economic Cooperation.
Triplett, J.E. (2000) , ‘Draft copy Handbook on quality adjustment of price indexes for
information and communication technology products’ , OECD, Paris
Triplett, J.E. and R.J. McDonald (1977). “Assessing the Quality Error in Output
Measures: The Case of Refrigerators”, Review of Income and Wealth, pp. 137-176
Triplett, J.E. (2004) , ‘Hand book on hedonic indexes and quality adjustments in price
indexes’, OECD science ,technology and industry working papers, 2004/9, OECD
publishing
Teligen (2002), ‘Report on Telecoms Price Developments from 1998 to 2002’ European
Commission
Teligen (2000), ‘Report on Telecoms Price Developments from 1997 to 2000’ European
Commission
Waugh, F.V. (1928) “Quality Factors Influencing Vegetable Prices”, Journal of Farm
Economics, vol. 10(2), 185-196
Page 32 of 32


