Office of the Chief Actuary Bureau de l’actuaire en chef
Confidential Protected B
1
Living to 100…will the Canada Pension Plan be sustainable?
Jean-Claude Ménard, Chief Actuary
Office of the Chief Actuary
Office of the Superintendent of Financial Institutions Canada
27 October 2014, Orlando, United States
Office of the Chief Actuary Bureau de l’actuaire en chef
Confidential Protected B
Presentation Outline
2
• Results of the 26th Canada Pension Plan Actuarial Report
• Historical trends in Canadian mortality
• Mortality Projections Results
• Uncertainty of Results
• Can We Live Beyond 100 Years?
• Canadian Mortality Tables for Pension Plans

Office of the Chief Actuary Bureau de l’actuaire en chef
Confidential Protected B
3
Purpose of the Actuarial Report on the Canada
Pension Plan as at 31 December 2012
• Inform contributors and beneficiaries of the current
and projected future financial status of the Canada
Pension Plan
• Calculate the minimum contribution rate
• Actuarial report is based on “best-estimate”
assumptions over a long period of time (75 years).
– Although secondary, recent trends are also taken into
account.

Office of the Chief Actuary Bureau de l’actuaire en chef
Confidential Protected B
4
The legislated contribution rate of 9.9% is sufficient to
sustain the Plan over the projection period of 75 years
• With the legislated contribution rate of 9.9%, contributions are more
than sufficient to cover expenditures until 2023.
• Starting from 2023, a proportion of investment income is required to
pay the expenditures. In 2030, 22% of investment earnings is
required to pay for benefits.
• Results contained in this report confirm that the 9.9% contribution
rate is sufficient to financially sustain the Plan and to accumulate
assets of $300 billion in 2020.

Office of the Chief Actuary Bureau de l’actuaire en chef
Confidential Protected B
• Best-Estimate Mortality Assumptions of the 26th CPP Report as at 31
December 2012 include future mortality improvements
BUT executive summary of the CPP26 states:
If life expectancies continue to increase at the current rate, especially
for ages 75 to 89, the long-term mortality assumptions will need to be
adjusted.
• If by 2050 cohort life expectancy at age 65:
– increases by about 5 years compared to 2013: contribution rate increases to 10.2%
– is the same as in 2013: contribution rate falls to 9.5%.
5
So, what is about living to 100 and CPP?
Canadian Cohort Life Expectancy Males Females
• Age 65 in 2013 20.9 years 23.3 years
• Age 65 in 2050 23.0 years 25.3 years
+2 years

Office of the Chief Actuary Bureau de l’actuaire en chef
Confidential Protected B
Life Expectancy at Birth (Calendar)
6
Source : Canadian human Mortality Database, University of Montreal
0
2
4
6
8
10
12
14
45
50
55
60
65
70
75
80
85
1901 1911 1921 1931 1941 1951 1961 1971 1981 1991 2001 2006 2009
Difference
Males
Females
Life Expectancy Difference

Office of the Chief Actuary Bureau de l’actuaire en chef
Confidential Protected B
Contribution to increase in life expectancy at birth has gradually shifted to people over age 65
7
Males Females
Change attributable to
(in years) 1929-1969 1969-1989 1989-2009 1929-1969 1969-1989 1989-2009
Infant mortality (<1) 6.0 1.0 0.2 4.8 0.8 0.1
Child mortality (1-14) 2.9 0.4 0.1 2.9 0.3 0.1
Young adult mortality
(15-44) 2.3 0.7 0.7 4.0 0.5 0.2
Older adult mortality
(45-64) 0.5 1.5 1.4 2.2 0.9 0.6
Elderly mortality
(65+) 0.8 1.3 3.0 3.2 2.0 2.0
Estimated
Multivariate Effect -0.2 -0.1 -0.3 -0.4 -0.2 -0.1
Total Change in Life
Expectancy 12.4 4.7 5.1 16.7 4.4 3.0
Source: Canadian human Mortality Database, University of Montreal and Office of the Chief Actuary
calculations.
Office of the Chief Actuary Bureau de l’actuaire en chef
Confidential Protected B
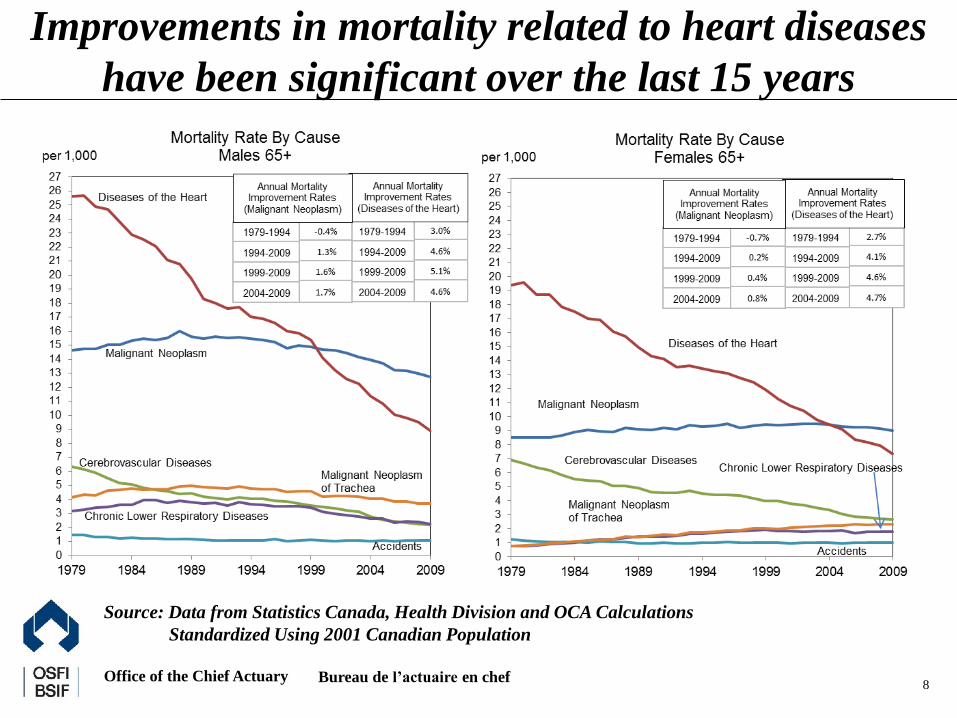
Improvements in mortality related to heart diseases
have been significant over the last 15 years
8
Source: Data from Statistics Canada, Health Division and OCA Calculations
Standardized Using 2001 Canadian Population

Office of the Chief Actuary Bureau de l’actuaire en chef
Confidential Protected B
Life Expectancy at Age 65 (Calendar)
9
Source : Canadian human Mortality Database, University of Montreal
0
2
4
6
8
10
12
14
10
12
14
16
18
20
22
24
1901 1911 1921 1931 1941 1951 1961 1971 1981 1991 2001 2006 2009
Difference
Males
Females
Life Expectancy Difference

Office of the Chief Actuary Bureau de l’actuaire en chef
Confidential Protected B
Heat map of historical and projected mortality
improvement rates for males
10
Deterioration due to
Accidents
Deterioration
due to AIDS
Cohort Effect

Office of the Chief Actuary Bureau de l’actuaire en chef
Confidential Protected B
Heat map of historical and projected mortality
improvement rates for females
11
Significant
Improvements
in mothers’
health

Office of the Chief Actuary Bureau de l’actuaire en chef
Confidential Protected B
12
Canadian mortality rates at ages 15 to 54 are significantly lower than US rates
Ages 15-54

Office of the Chief Actuary Bureau de l’actuaire en chef
Confidential Protected B
13
Mortality Rates for older age groups have decreased over the last 80 years, more so over the last 40 years for males
Ages 55-64

Office of the Chief Actuary Bureau de l’actuaire en chef
Confidential Protected B
14
For ages 65 to 74, 7 deaths per 1,000 are from cancer, while only 3 deaths per 1,000 are from heart diseases
Ages 65-74

Office of the Chief Actuary Bureau de l’actuaire en chef
Confidential Protected B
15
Male mortality rates for ages 75 to 84 for Canada are projected to become lower than US female mortality rates
Ages 75-84

Office of the Chief Actuary Bureau de l’actuaire en chef
Confidential Protected B
Elderly Mortality Rates have decreased over the last 80
years, more so over the last 10 years
16
Ages 85-89
Office of the Chief Actuary Bureau de l’actuaire en chef
Confidential Protected B
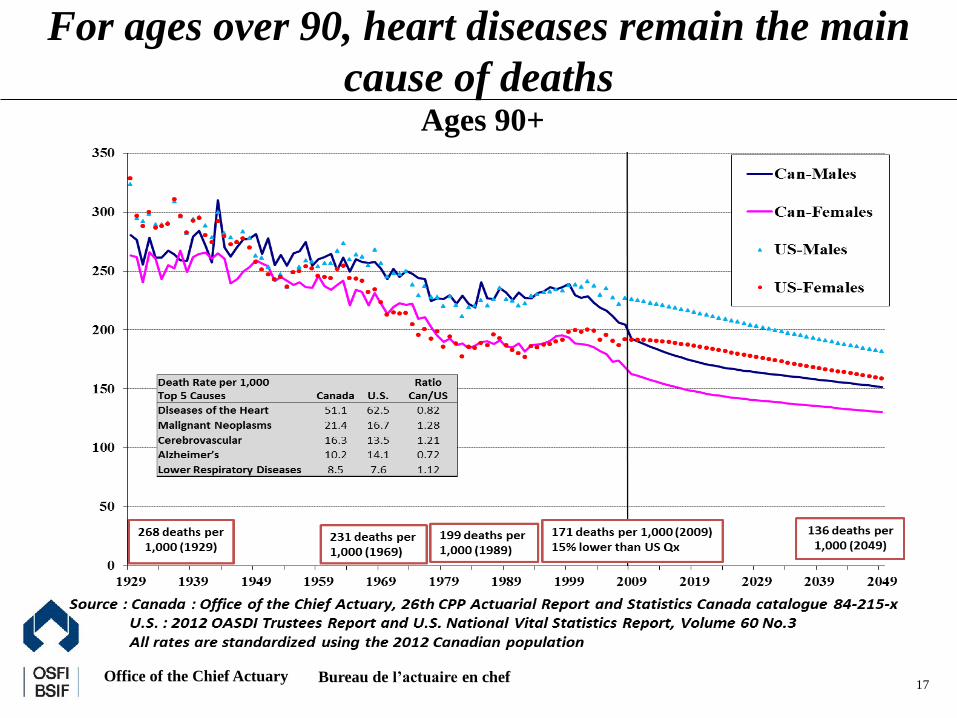
For ages over 90, heart diseases remain the main
cause of deaths
17
Ages 90+
Office of the Chief Actuary Bureau de l’actuaire en chef
Confidential Protected B
Currently, Canadian seniors are living longer than those in UK and US
18
• Current Canadian mortality rates for ages 65 and over
are lower than those in UK and US
• By 2049, the difference with US is projected to widen
further
• Due to the higher assumed ultimate mortality
improvement rates in UK, by 2049, UK mortality rates
for ages 65 and over are projected to become lower
than those in Canada.
Office of the Chief Actuary Bureau de l’actuaire en chef
Confidential Protected B
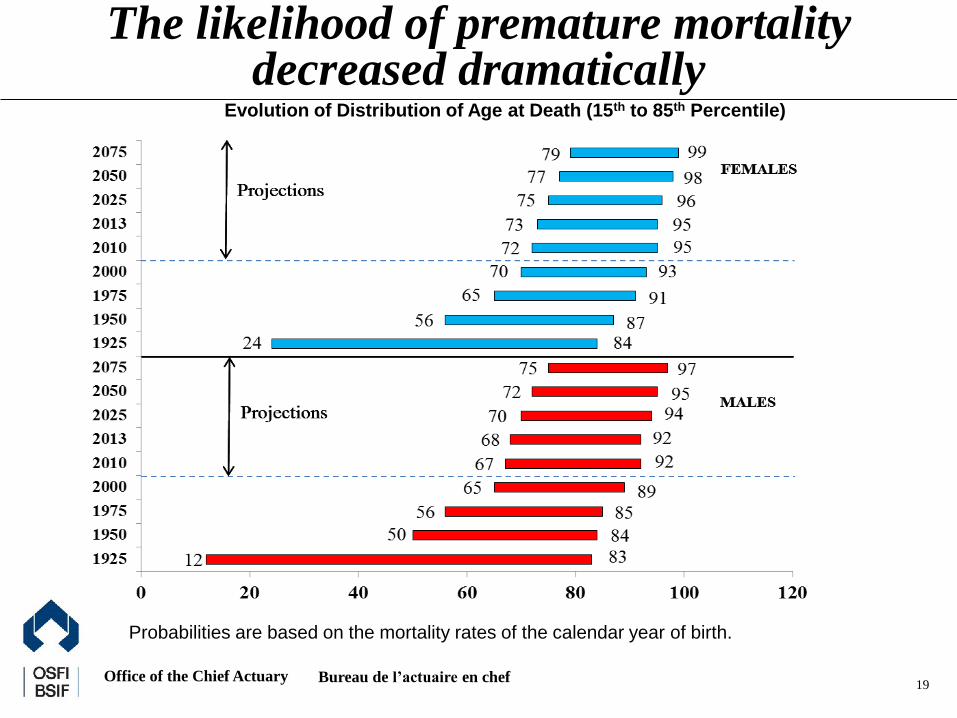
The likelihood of premature mortality decreased dramatically
19
Evolution of Distribution of Age at Death (15th to 85th Percentile)
Probabilities are based on the mortality rates of the calendar year of birth.

Office of the Chief Actuary Bureau de l’actuaire en chef
Confidential Protected B
20
Increase in Life Expectancy at 65
More contributors are expected to reach the retirement age of 65 (93% for someone age 18 in
2013). Retirement beneficiaries are expected to receive their benefits for a longer period.
0
1
2
3
4
5
6
7
8
9
10
11
12
13
12
13
14
15
16
17
18
19
20
21
22
23
24
25
26
1959 1969 1979 1989 1999 2009 2019 2029 2039 2049 2059
Difference
Males
Females
Males - Valuation Model
Females - Valuation Model
Life expectancy at 65 Difference

Office of the Chief Actuary Bureau de l’actuaire en chef
Confidential Protected B
Uncertainty of Results
Life Expectancies at age 65 if MIRs by cause are sustained
21
CPP26
Projections
Annual Improvement
Rates 2010+ Males Females
Diseases of the heart 4.6% 4.1%
Malignant Neoplasms 1.3% 0.2%
Other Causes 1.7% 0.7%

Office of the Chief Actuary Bureau de l’actuaire en chef
Confidential Protected B
22
Uncertainty of Results: Life Expectancies at 65 if heart
diseases and cancer gradually removed over 75 years
Annual
Improvement Rates
for other causes Males Females
2010 1.7% 0.7%
2030 + 0.35% 0.35%
CPP26
Projections

Office of the Chief Actuary Bureau de l’actuaire en chef
Confidential Protected B
23
Source: 2012 OASDI Trustees Report, UK Office for National Statistics, 26th CPP Actuarial Report
Current Canadians are expected to live to age 90
with probability of more than 40% Probability of living to 90 for Canada, the U.S. and the U.K.
Office of the Chief Actuary Bureau de l’actuaire en chef
Confidential Protected B
24
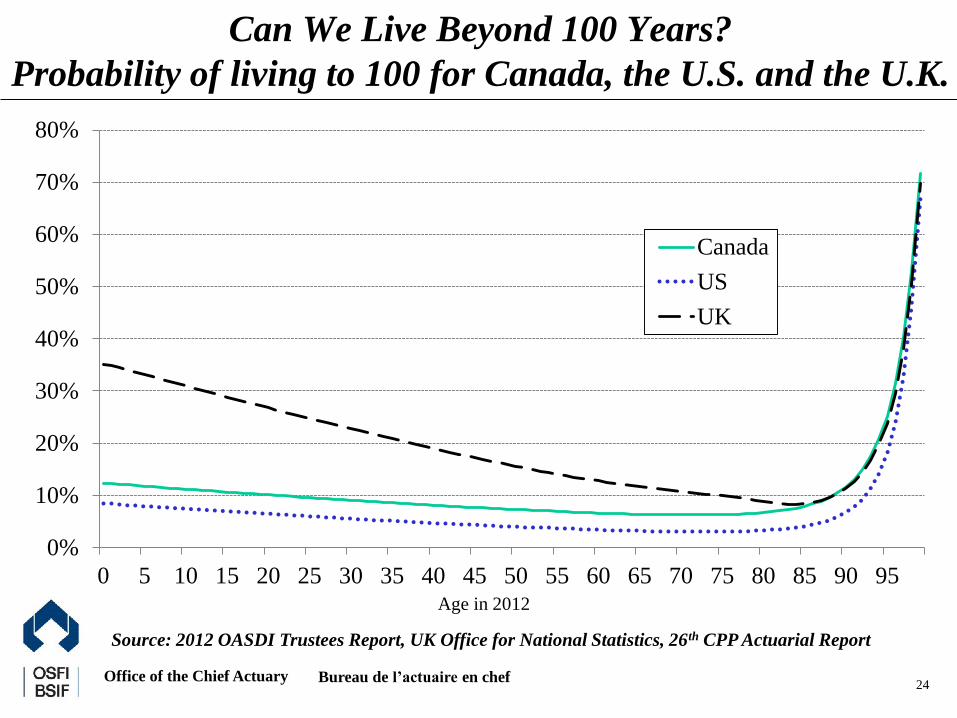
Source: 2012 OASDI Trustees Report, UK Office for National Statistics, 26th CPP Actuarial Report
0%
10%
20%
30%
40%
50%
60%
70%
80%
0 5 10 15 20 25 30 35 40 45 50 55 60 65 70 75 80 85 90 95Age in 2012
Canada
US
UK
Can We Live Beyond 100 Years?
Probability of living to 100 for Canada, the U.S. and the U.K.

Office of the Chief Actuary Bureau de l’actuaire en chef
Confidential Protected B
25
Survival Curves for a Life Expectancy of 100 (Males)
e0 = 80 e0 = 100
Office of the Chief Actuary Bureau de l’actuaire en chef
Confidential Protected B
Mortality rates of pension plans vary from those of the general population
26
• Mortality rates of a particular subgroup depend on its characteristics, such as level of education, level of income, industry of employment, etc.
• Large plans use their own experience for funding valuations
• In February 2014, the CIA has finalized the first ever Canadian Pensioners Mortality table (CPM2014) as well as a projection scale (scale B)
• Private/public pension plans
• Level of income
• In developing mortality assumptions for public sector pension plans (e.g. PSSA, RCMP, CFSA), mortality experience of each plan is analysed
• Mortality improvement rates are based on trends in Canadian mortality and OCA best-estimates. Usually the same as for the CPP actuarial reports.

Office of the Chief Actuary Bureau de l’actuaire en chef
Confidential Protected B
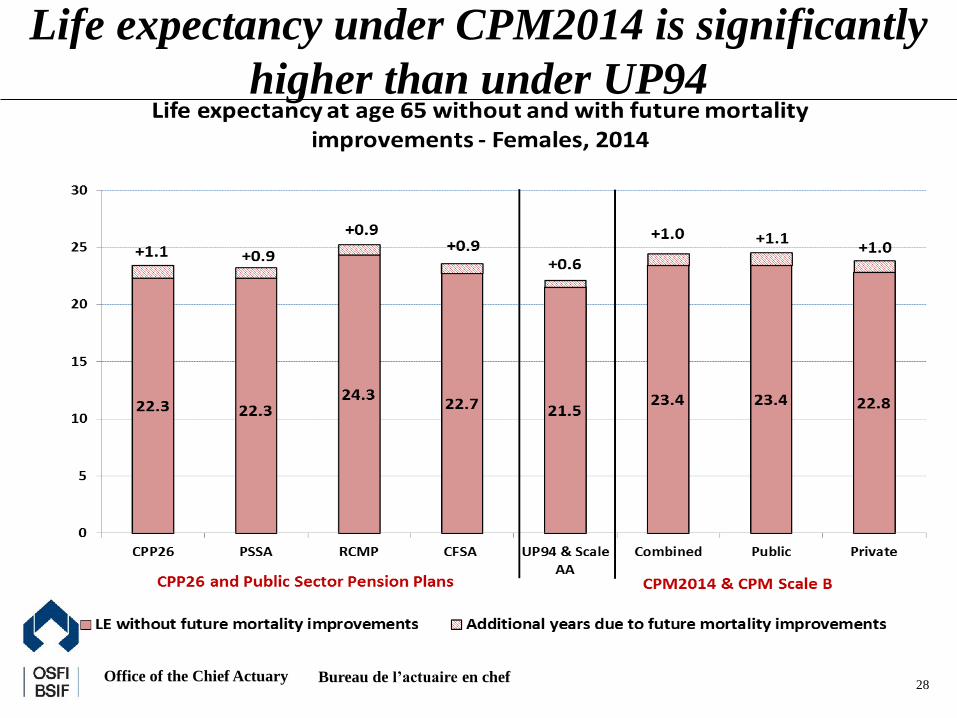
Life expectancy under CPM2014 is
significantly higher than under UP94
27
Office of the Chief Actuary Bureau de l’actuaire en chef
Confidential Protected B
Life expectancy under CPM2014 is significantly
higher than under UP94
28

Office of the Chief Actuary Bureau de l’actuaire en chef
Confidential Protected B
Conclusions
29
• Retirement is expensive and will become even more expensive in the future with improved longevity
• Projected mortality rates after 2030 are highly uncertain, especially for people older than age 90
• It is a professional duty of the actuary to examine all available information in order to develop best-estimate mortality assumptions.

Office of the Chief Actuary Bureau de l’actuaire en chef
Confidential Protected B
30
Appendix
Mortality Projections of Public Pension Plans in Canada and its
financial implications
27 October 2014, Orlando, United States

Office of the Chief Actuary Bureau de l’actuaire en chef
Confidential Protected B
Canadian historical annual mortality improvement rates are used as a starting point of projections
31
Source: Estimated by OCA based on data from Canadian Human Mortality Database, Dept. of Demography
of University of Montreal
0.0
0.5
1.0
1.5
2.0
2.5
3.0
1949-1979 1979-1994 1994-2009 2009-2024 1949-1979 1979-1994 1994-2009 2009-2024
15-64
65-89
MALES FEMALES
Office of the Chief Actuary Bureau de l’actuaire en chef
Confidential Protected B
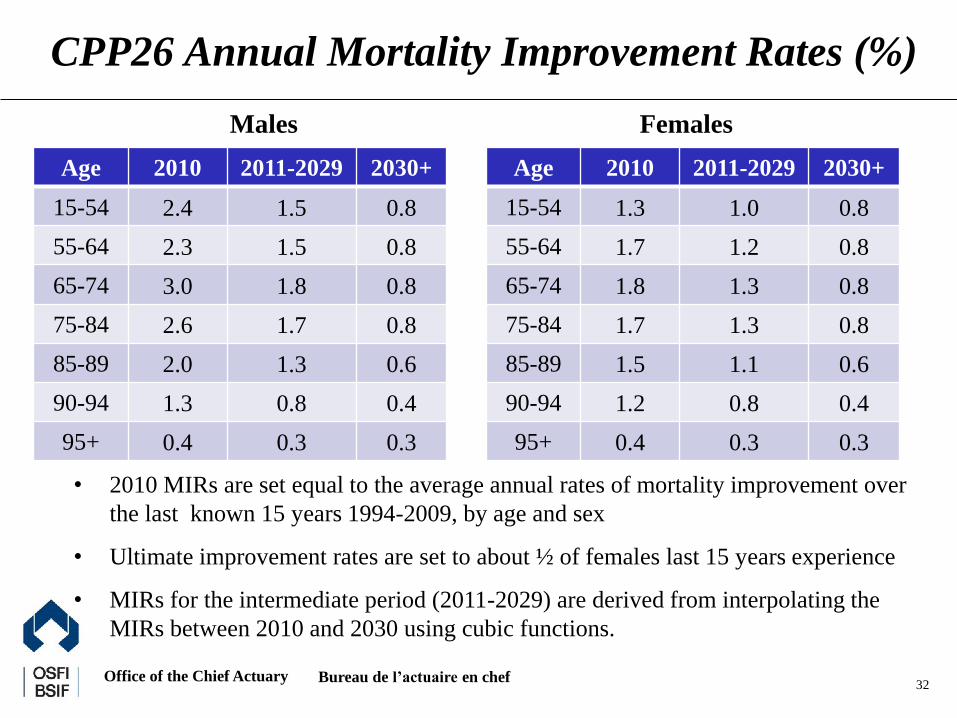
CPP26 Annual Mortality Improvement Rates (%)
32
Age 2010 2011-2029 2030+
15-54 2.4 1.5 0.8
55-64 2.3 1.5 0.8
65-74 3.0 1.8 0.8
75-84 2.6 1.7 0.8
85-89 2.0 1.3 0.6
90-94 1.3 0.8 0.4
95+ 0.4 0.3 0.3
Males
Age 2010 2011-2029 2030+
15-54 1.3 1.0 0.8
55-64 1.7 1.2 0.8
65-74 1.8 1.3 0.8
75-84 1.7 1.3 0.8
85-89 1.5 1.1 0.6
90-94 1.2 0.8 0.4
95+ 0.4 0.3 0.3
Females
• 2010 MIRs are set equal to the average annual rates of mortality improvement over
the last known 15 years 1994-2009, by age and sex
• Ultimate improvement rates are set to about ½ of females last 15 years experience
• MIRs for the intermediate period (2011-2029) are derived from interpolating the
MIRs between 2010 and 2030 using cubic functions.

Office of the Chief Actuary Bureau de l’actuaire en chef
Confidential Protected B
33
Infant Mortality Rates have decreased significantly over the last 80 years, less so over the last 20 years
Age less than 1
Office of the Chief Actuary Bureau de l’actuaire en chef
Confidential Protected B
34
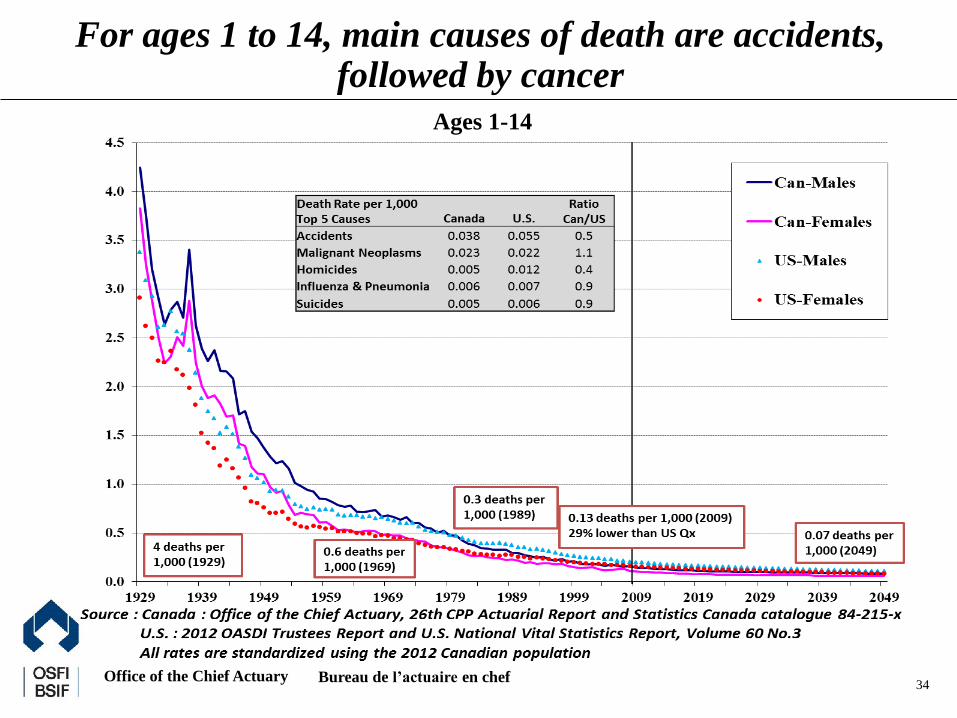
For ages 1 to 14, main causes of death are accidents, followed by cancer
Ages 1-14

Office of the Chief Actuary Bureau de l’actuaire en chef
Confidential Protected B
By 2030, Canada is projected to be behind UK and Switzerland for males
35
12 13 14 15 16 17 18 19 20 21 22 23
Canada
Japan
Finland
France
Germany
Netherland
Norway
Poland
Portugal
Quebec
Slovakia
South Korea
Sweden
Switzerland
UK
US
Life expectancy at age 65 - Males
2010
2020
2030
Source: 17th International Conference of Social Security Actuaries and Statisticians and Dept. of Population, Japan
Office of the Chief Actuary Bureau de l’actuaire en chef
Confidential Protected B
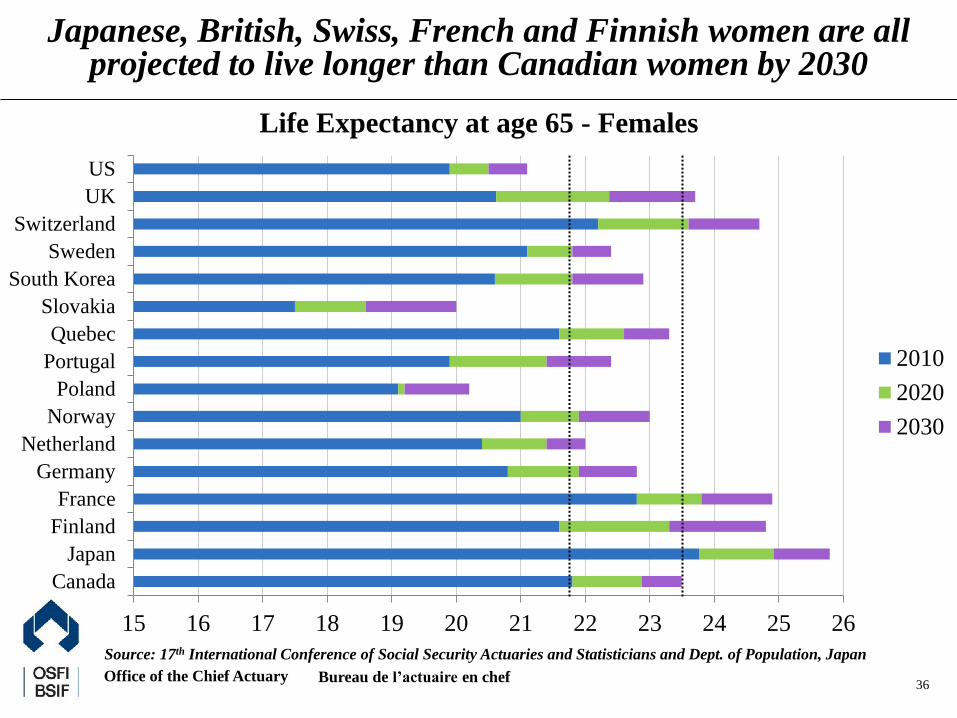
Japanese, British, Swiss, French and Finnish women are all projected to live longer than Canadian women by 2030
36
15 16 17 18 19 20 21 22 23 24 25 26
Canada
Japan
Finland
France
Germany
Netherland
Norway
Poland
Portugal
Quebec
Slovakia
South Korea
Sweden
Switzerland
UK
US
Life Expectancy at age 65 - Females
2010
2020
2030
Source: 17th International Conference of Social Security Actuaries and Statisticians and Dept. of Population, Japan

Office of the Chief Actuary Bureau de l’actuaire en chef
Confidential Protected B
Uncertainty of results: mixed stochastic/deterministic
approach produces wide range of life expectancies Mortality
Improvement
rates
Cohort Life Expectancy in 2050
Stochastic
10th Percentile
Deterministic
Expected
Stochastic
90th Percentile
Best Estimate Males 21.0 23.0 24.9
Females 23.4 25.3 27.1
Reducing
Alternative
(-0.2%/year)
Males 20.7 22.5 24.4
Females 22.9 24.8 26.7
Increasing
Alternative
(+0.2%/year)
Males 21.8 23.6 25.6
Females 24.0 25.9 27.7
37
Low cost: 10th percentile of stochastic
simulation centered over mortality rates
under lower MIRs
High cost: 90th percentile of stochastic
simulation centered over mortality rates
under higher MIRs
Minimum Contribution Rate
Low-Cost 9.46%
Best-Estimate 9.84%
High-Cost 10.22%

Office of the Chief Actuary Bureau de l’actuaire en chef
Confidential Protected B
Survival Curves for a Life Expectancy of 100 (Females)
38
e0 = 84 e0 = 100
Office of the Chief Actuary Bureau de l’actuaire en chef
Confidential Protected B
To live beyond 100…
39
• If mortality rates decrease at the same pace as observed over
the past 15 years (2.5%/year males, 1.5%/year females), a life
expectancy of 100 could be attained in 85 years (2094) for
males and in 112 years (2121) for females.
• A reduction of mortality rates at each age by 87% for males
and 82% for females results in a life expectancy of 100.
• Using the “age mapping” (a mathematical technique), life
expectancy of 100 is also achievable if the maximum life span
increases to 140 years for males and 132 years for females


