
Integrated Ecological Research
Pre- restoration biomonitoring of Six Mile Slough
Prepared for
BC Forest, Lands and Natural Resource Operations and Rural Development
and Creston Valley Wildlife Management Area
Prepared by:
Darcie Quamme, MSc., R.P.Bio., Integrated Ecological Research
Rhia MacKenzie, MSc. Candidate, BArch., BIT
And Ryan Durand, MSc., R.P.Bio., EcoLogic
July 10, 2020

Wetland Invertebrate Assessment Tool
1 | P a g e I N T E G R A T E D E C O L O G I C A L R E S E A R C H
Table of Contents 1 Introduction .......................................................................................................................................... 3
2 Methods ................................................................................................................................................ 5
2.1.1 Geospatial measures ............................................................................................................. 8
2.1.2 Macroinvertebrate collection and processing ...................................................................... 8
2.1.3 Water and sediment physiochemistry ................................................................................ 11
2.1.4 Quality Control .................................................................................................................... 11
2.2 Results ......................................................................................................................................... 12
2.2.1 Geospatial measures ........................................................................................................... 12
2.2.2 Comparisons to previously established reference sites ..................................................... 15
2.2.3 Physiochemistry of Six Mile Slough and Kootenay River .................................................... 20
2.2.4 Ecological productivity and diversity of Six Mile Slough ..................................................... 28
2.1 Conclusions and recommendations ............................................................................................ 36
3 Acknowledgements ............................................................................................................................. 39
4 References .......................................................................................................................................... 40
5 Appendices .......................................................................................................................................... 47
5.1 Mapping: Disturbance ................................................................................................................. 47
5.2 Physiochemistry .......................................................................................................................... 48
5.2.1 Water quality guidelines for BC and the Canadian Council of Ministers ............................ 48
5.2.2 Raw water quality data analyzed by CARO Analytical Services .......................................... 50
5.2.3 The number of water quality parameters exceeding at least one guideline ...................... 51
5.2.4 Sediment guidelines for British Columbia and the Canadian Council of Ministers ............ 52
5.2.5 Raw sediment quality data analyzed by CARO Analytical Services ..................................... 53
5.2.6 The number of sediment quality parameters greater than at least one guideline ............ 54
5.2.7 Cumulative toxic units in sediment including sites affected by historical mining .............. 55
5.2.8 Quality Assurance: water and sediment quality ................................................................. 55
5.3 Macroinvertebrates .................................................................................................................... 56
5.3.1 Quality assurance: morphology-based taxonomy .............................................................. 56
5.3.1 Outputs from morphology-based taxonomy ...................................................................... 58
5.3.2 Outputs from DNA meta-barcoding .................................................................................... 62

Pre-restoration Monitoring of Six Mile Slough
2 | P a g e
I N T E G R A T E D E C O L O G I C A L R E S E A R C H
SUMMARY
The goal of the current project was to establish baseline conditions and a monitoring design (pre and post
restoration) by which to evaluate large scale restoration and potential reestablishment of hydrological
connectivity of Six Mile Slough located within the Creston Valley Wildlife Management Area (CVWMA),
Creston, BC with the Kootenay River. The Six Mile Slough Wetland Restoration Project proposes to restore
up to 1260 hectares of wetlands for Northern Leopard frog, Lithobates pipiens, White sturgeon, Acipenser
transmontanus, burbot, Lota lota, other native fish species and migratory birds (Biebighauser and
Annschild 2016).
We plan to track the effects wetland restoration in Six Mile Slough potentially affected by varying levels
of hydrological change that may result from floodplain reconnection in pre- and post- restoration
scenarios. In the present 2019 study, we used quantitative measures such as biogeochemical parameters,
nutrient levels, and monitoring using methods embedded in the Canadian Aquatic Biomonitoring Network
(CABIN) for wetland protocols to examine the pre-restoration baseline. These indicators were also used
to characterize Northern Leopard Frog habitat near breeding locations within Six Mile Slough, a species of
highest priority and conservation concern in the Columbia Basin.
Floodplain reconnection could also re-establish off-channel rearing habitat for juvenile white sturgeon,
and burbot, British Columbia Ministry of Environment Red Listed species (MOE 2020, Biebighauser and
Annschild 2016) and provide improvements to ecosystem health of Kootenay River through seasonal
inundation and flooding (Statistical Consulting Services 2017). Thus, the mechanisms and the links
between wetland inundation and downstream transport of nutrients, carbon, and other physiochemical
parameters with associated implications to higher trophic levels are crucial to assess and understand. The
current monitoring complements pre-restoration fisheries assessments carried out of Six Mile Slough in
2020.
In 2019, our first year of data collection, we identified reference sites that can be used to compare to
trends following changes due to restoration activities in Six Mile Slough over time. Outputs from the
project include evaluations of water and sediment quality, nutrient status, habitat parameters,
macroinvertebrate enumeration, macroinvertebrate richness calculations, and wetland mapping and
classification.
The primary use of data collected in 2019 was to aid in the decision to move forward with reconnection
of Six Mile Slough to the Kootenay River. To this end, we focussed on evaluating the water and sediment
physiochemistry within Six Mile Slough to evaluate the nutrient status of the wetland but also to quantify
the production and biodiversity of macroinvertebrates within the wetland. Macroinvertebrates were
used to provide inference to wildlife populations and habitat which may be difficult to assess directly
because of appropriate scale and population movements. In addition, we identified potential projected
changes in ecological productivity, and nutrient/organic matter export. Recommendations from this

Pre-restoration Monitoring of Six Mile Slough
3 | P a g e
I N T E G R A T E D E C O L O G I C A L R E S E A R C H
project included actions that encourage the development of a diverse macroinvertebrate community
providing a base for higher trophic levels in wetland ecosystems.
1 Introduction This project used the Environment Canada’s Canadian Aquatic Monitoring Protocols (CABIN) for wetlands
(Env. Canada 2018) to carry out pre-restoration monitoring of Six Mile Slough in 2019. We collected
samples from six locations within the wetland for analyses of both traditional macroinvertebrate
taxonomic methods and DNA collection for metabarcoding to assess baseline conditions of the Six Mile
Slough. We plan to use quantitative indicators summarized from the data outputs to evaluate baseline
conditions prior to planned restoration of the wetland. Abiotic and biotic indicators developed from the
monitoring will serve as benchmarks and aid management decisions for the restoration work. These
indicators can then be used to assess trends at wetland sites over time following restoration and providing
a baseline for future comparisons.
The goals of the project are to (1) establish baseline conditions at Six Mile Slough to aid with decision
making around wetland restoration, (2) track wetland restoration over time using quantitative measures
of wetland stress and biological health (3) compare sites at Six Mile Slough to previously established sites
in the West Kootenays (n=58 samples), (4) evaluate the nutrient status of Six Mile Slough through water
quality monitoring, (5) and help to characterize Northern Leopard Frog habitat near breeding locations, a
species of highest priority and conservation concern in the Columbia Basin.
This project aligns with larger plans in the Columbia Region including the Columbia Basin Trust’s
Environmental Program including goals such as: (1) enhancing or conserving ecosystems and/or species
of conservation concern, (2) supporting the protection, enhancement or restoration of water resources
that are important for species and/or ecosystems of conservation concern and (3) carrying out water
quality and/or quantity research that is scientifically sound and will contribute knowledge to the
management of water resources for the benefit of ecosystems, communities and watershed stakeholders.
The project also addresses the FWCP Wetlands and Riparian Actions (FWCP 2019) including monitoring
and evaluation, species-based and habitat-based actions priorities in the Creston Valley described here.
• Monitoring and Evaluation: (Action 21, Priority 1) Monitor and evaluate the effectiveness of
previous FWCP wetland and riparian restoration. Include an approach for adaptive management,
documenting and assessing ecological conditions and parameters (pre- and post-restoration),
information sharing and collaboration among agencies and the public stakeholders to increase
the efficacy of conservation action.
• Species-based Actions: (Action 23, Priority 1.) Support strategies and initiatives outlined in the
BC Recovery Plan for Northern Leopard Frog that relate to compensation for dam impacts. Where
possible, link project work to the connectivity of this species across ecosystems and collaborate
with recovery team specialists.

Pre-restoration Monitoring of Six Mile Slough
4 | P a g e
I N T E G R A T E D E C O L O G I C A L R E S E A R C H
• Habitat-based Actions: (Action 16, Priority 2.) Implement habitat-based actions to
conserve/restore/enhance water levels and water quality in wetland habitats. Ensure alignment
with relevant actions in Rivers and Riparian Areas and Reservoirs and Large Lakes ecosystem
plans.
In addition, this work supports increased knowledge of the ecology of wetlands in the Columbia Basin
with important management outcomes for the community, funders, and supporters.
In 2019 this project was funded by the Creston Valley Wildlife Management Area, BC Ministry of Forests,
Lands, Natural Resource Operations and Rural Development. This work builds on past funding streams
from 2014 to 2020. Support for this work has been obtained from the Environment Canada’s National
Wetland Conservation Program (NWCF), the Columbia Basin Trust (CBT), the Columbia Basin Watershed
Network, BC Ministry of Forest Lands and Natural Resource Operations and Rural Development, Fish and
Wildlife Compensation Program (FWCP). The evaluation of Six Mile Slough is a collaborative project
because previously monitored sites from multiple funding sources will serve as reference sites for
comparison to Six Mile Slough and provide inference to current work.
Current Columbia Basin Trust funds are matched with a major in-kind contribution and/or support from
the Royal BC Museum (RBCM), as well as groups such as Slocan Solutions, Slocan River Streamkeepers
Society (SRSS), BC Wildlife Federation, and Integrated Ecological Research. Forty-two percent of matching
funds from 2014-2020 have come from provincial or federal agencies outside of the Columbia Basin. In
addition, the proposed project also overlaps with previously CBT-funded projects or candidates including:
Crooked Horn Farm Restoration, Meadow Creek conservation lands (FLNRO), Bonanza wetland (Valhalla
Wilderness Society) and the Goulden-Thurston Property (SRSS).
Adam Martens from Environment Canada has provided guidance with respect to the developing CABIN
for wetland protocols. Living Lakes, World Wildlife Fund and the provided in-kind funding for logistics,
shipping, and DNA laboratory support through the STREAM program centered in the Hajibabaei Lab at the
Center for Genomic Biodiversity at the University of Guelph. Chloe Robinson from the Hajibabaei Lab
authored a companion report that summarizes the DNA meta-barcoding work (STREAM 2019). The Royal
BC Museum in Victoria continues to provide support on the order of $10,000 per year to voucher and
house samples in their entomology and invertebrate collections, in perpetuity.

Pre-restoration Monitoring of Six Mile Slough
5 | P a g e
I N T E G R A T E D E C O L O G I C A L R E S E A R C H
2 Methods The primary goal of using CABIN for wetland protocols will be to document changes to physiochemistry,
macroinvertebrates and the diversity and complexity of plant species and habitat over time. CABIN
methods for wetlands (Environment Canada 2018) is a National Canadian protocol that has been tested
in Quebec (Tall et al. 2016 and 2008), the Yukon (Baily and Reynoldson 2009), and prairie provinces
including Saskatchewan and Alberta (pers com. Adam Martens 2019). Other similar protocols have used
macroinvertebrates to assess wetland health (Uzarski et al. 2017, Kovalenko 2014, Mazzacano 2011,
Adama et al. 2013 and Miller and Hawkes 2013, Archer et al. 2010, U.S EPA 2002 and Apfelbeck 2000) in
the U.S and Canada. In addition, CABIN for wetlands protocols have been successfully used to track
restoration success in the West Kootenays (Quamme et al. 2016, 2018 and 2019).
With respect to macroinvertebrate data, our main objective will be to examine biodiversity and
abundance of macroinvertebrates from Six Mile Slough before and after reconnection to the Kootenay
River. However, we will also examine these indicators relative to other reference sites previously
collected from 2014-2018 in the West Kootenays.
Pre-restoration monitoring will take place in 2019 and 2020 and post restoration monitoring will occur
following floodplain reconnection - onward. We will have at least two years of pre-restoration monitoring
to compare to post restoration monitoring. We plan to have a balanced design with some of the sites
affected by changes in hydrology and other sites serving as reference sites from compartments with
stabilized hydrology within the slough.
In 2019, the focus of our fieldwork was to initiate the collection of pre-restoration data so as to review
water and sediment chemistry within the wetland and assess the potential for entrainment of nutrients
at peak flows with delivery to the Kootenay River. As well, monitoring will help to characterize two
possible Northern Leopard frog breeding locations. We also collected macroinvertebrates from twelve
quadrats to capture the variance of the abundance/biodiversity of macroinvertebrates within the wetland
and assess the range of taxonomic composition of the slough in Compartments 2-5 (Figure 1). We selected
sites at six locations with paired samples for DNA and taxonomy at each location for a total of twelve
samples. In the current report, we reported the biodiversity and abundance of macroinvertebrates within
Six Mile Slough relative to other wetlands in the West Kootenays to provide greater inference to the 2019
monitoring.

Pre-restoration Monitoring of Six Mile Slough
6 | P a g e
I N T E G R A T E D E C O L O G I C A L R E S E A R C H
Clockwise. (1) Dragonfly on quadrat stake.(2) Burweed. (3) Katherine McGlynn in kayak (4) jars with sample sediment.
(4) Darcie Quamme collecting a samlple
Photo 1: Sampling equipment used at Six Mile Slough.
Clockwise. (1) Darcie Quamme with CABIN collection net.(2) Canoeing to site wit Rhia MacKenzie. (3 and 4) Canoe and sampling jars and other
equipment.
Photo 2: Sampling equipment used at Six Mile Slough.

Pre-restoration Monitoring of Six Mile Slough
7 | P a g e
I N T E G R A T E D E C O L O G I C A L R E S E A R C H
Figure 1: Location of monitoring of monitoring sites at Six Mile Slough. Red stars indicate CABIN for wetland. Blue stars indicate water
quality monitoring only. Yellow circles indicate Northern Leopard frog (LIPI) observations and green circles indicate LIPI egg masses found
in 2019. Comp = Compartments separated by dikes. Yellow dots indicate observations of Northern Leopard Frogs. Large green dot indicates
egg mass. Breeding sites are in Compartments 4 and 5. Two biomonitoring sites were placed near breeding sites.

Pre-restoration Monitoring of Six Mile Slough
8 | P a g e
I N T E G R A T E D E C O L O G I C A L R E S E A R C H
Clockwise. (1) Northern Leopard frog (LIPI) in sampling net, (2) CABIN sampling near breeding location at SMS003 (3) LIPI near SMS001 and breeding
location within Compartment 5, (4) Marc-André Beaucher at NLF breeding location in Compartment 4 adjacent to SMS003.
Photo 3: Sampling of Northern Leopard frog habitat within Six Mile Slough.
2.1.1 Geospatial measures
Base orthophotos were collected from DataBC Imagery Web Map Service (DataBC 2019) with a resolution
of one-meter ranging of the Six Mile Slough area. Mapping was completed in ESRI ArcMap 9.3 using heads
up delineation adjusted to fit natural features as needed. Mapping procedures followed provincial
methods including Ecosystem Classification Methods (Province of BC 2016 and 2010), Terrestrial
Ecosystem Mapping (TEM) (RISC 1998), BC Ministry of Environment, Lands and Parks and Ministry of
Forests (1998), Standard for Mapping Ecosystems At Risk in British Columbia (RISC 2006), and Mackenzie
and Moran (2004). Other sources of information include the BC Vegetation Resources Inventory Mapping,
BC Bio geoclimatic Ecosystem Classification, Provincial base layers for lakes, streams, contours, and roads.
2.1.2 Macroinvertebrate collection and processing
CABIN for wetland protocols characterize the macroinvertebrate community that inhabit the emergent
and submergent zones of the wetlands where the macroinvertebrate diversity is greatest (De Szalay and
Resh 2000). The kick sampling procedure in wetlands involves a gentle disturbance of bottom sediments
and three-minute sweeps of the water column in a zig-zag pattern over a 5 m by 5 m quadrat. Thus,
macroinvertebrates are collected from the water column, bottom sediments and aquatic plants at each
site
Macroinvertebrates were sampled from the near shore of the emergent zone at a depth of approximately
0.5-1 m using a CABIN kick-net of length 45.7 cm, width 25.4 cm, and depth 25.4 cm with a 400 µm mesh

Pre-restoration Monitoring of Six Mile Slough
9 | P a g e
I N T E G R A T E D E C O L O G I C A L R E S E A R C H
net (Environment Canada 2007, Tall et al 2008). Emergent plants represented at least 50% of the plot
area.
The samples were collected from a 25 m2 area in a timed three-minute sweep sample (Environment
Canada 2018). This technique involves a gentle disturbance of bottom sediments and sweep in a zig-zag
pattern within the water column quadrat at each site. Sampling was timed for mid-July where possible to
coincide with optimal water levels prior to draw-down and the presence of mature macrophytes at
temporary, seasonal wetlands and permanent wetlands. Estimates of the relative proportion of
vegetation were made within the quadrat within the emergent zone. The 25 m2 quadrat was marked with
cedar stakes following water collection, assessments of percent composition of wetland plants were made
prior to macroinvertebrate collection so as not to disturb or damage emergent plants. Quadrats for
taxonomy and DNA collection were located side by side at each location.
Field sheets provided by Environment Canada’s CABIN program were used as a basis for field
measurements (Environment Canada 2018) including:(1) percent disturbance within a 50 m buffer around
the site, (2) percent zones of wetland based on a visual estimate, (3) percentage of marginal zone
vegetation, 50 m buffer zone around quadrat and (4) percent composition of plant type, periphyton, open
water and large woody debris within the 25 m2 sampling quadrat as well as other estimates.
2.1.2.1 Morphology-based taxonomy
In the case of sampling for macroinvertebrates for identification by taxonomy, the volume of
sediment/vegetative matter in each sample was reduced by gently washing the nets in water well away
from sampling area or sample can be taken back to the laboratory and further reduced. Material was
gently poured through a 400 µm sieve. The sampling net, cup and sieve were carefully check for
macroinvertebrates clinging to equipment. Large pieces of plant material were inspected and rinsed and
then removed from the net.
Sample material was transferred to one litre wide mouth Nalgene jars with 80% ethanol used as a
preservative as recommended by the Royal BC Museum. Sample material comprised no more than 50%
of the jar. Ethanol was replaced with fresh 80% ethanol at least once before shipping because water from
unsorted organics tends to dilute the preservative over time (Mazzacano 2011, Jepsen et al. 2007). Prior
to shipping for taxonomy large pieces of vegetation were inspected, rinse and removed in the laboratory
if necessary, to reduce samples. All samples were checked with a hydrometer to verify preservation at
80% ethanol prior to shipping and Rhithron Associates Inc. (taxonomist) reported that the samples were
well preserved when they arrived and reassessed with a hydrometer.
For shipping, all wide mouth Nalgene sample jars were sealed with electrical tape and ‘Glad Stretch and
Seal’. In addition, the samples were placed inside separate zip lock bags to prevent leaks and sample loss
in case of breakage.

Pre-restoration Monitoring of Six Mile Slough
10 | P a g e
I N T E G R A T E D E C O L O G I C A L R E S E A R C H
Samples were shipped in coolers with a Chain-of-Custody form to Rhithron Associates Inc, taxonomists
based in Missoula, Montana specializing in identifying wetland invertebrates. Rhithron invertebrate
taxonomists collectively hold 34 Level-II certifications from the Society for Freshwater Science.
Samples collected for the CABIN database were sent to a certified taxonomist that follow procedures
outlined in Environment Canada (2012) and follow Level 2 Standard Taxonomic Effort (STE) for Pacific
Northwest Freshwater Macroinvertebrate Samples (2013) also see Section 5.1.2 for Rhithron’s Technical
report. STE Level 2 is the lowest practical and cost-effective level of identification and is the target level
for harmonizing data sets across the region for comparison. Identifications are typically to genus for the
common and diagnostic taxa.
All laboratory techniques and quality control (Section 5.1.2) were carried out according to CABIN methods
(Environment Canada 2018 and 2012). Preservative levels within the sample were maintained at the
laboratory until sorting and samples were processed within a few months to prevent accidental
degradation of the sample.
In addition, voucher specimens were shipped to the Royal BC Museum in 80% ethanol following
identification by taxonomist to add to our understanding of wetlands in Interior BC where there are
currently knowledge gaps. All project methods met museum specifications for collection, taxonomic
identification, and storage of specimens (Environment Canada 2018, 2012 and 2007).
2.1.2.2 DNA meta-barcoding
New this year was sample collection for DNA analysis of macroinvertebrate species. Sample collection for
DNA was carried out as recommended by the Hajibabaei Lab, University of Guelph, Center for Genomic
Biodiversity STREAM protocols for DNA collection. Gloves were used so as not to contaminate the sample
and no attempt to reduce the sample was made to handle the sample as little as possible. Sample was
filled to under 50% of the jar to facilitate sample preservation. Thus, a greater number of jars was required
to contain the entire sample. No reduction of samples was carried out post-sampling to minimize handling
of the sample.
Samples were shipped to the University of Guelph and stored in freezers at -20°C in the lab until they
could be processed. Samples consisting of mud, vegetation and invertebrates were coarsely homogenized
in a sterile blender and DNA was extracted using a DNeasy® PowerSoil® kit (Qiagen, CA) kit. Extracted DNA
was then processed following the standard Hajibabaei Lab protocol for Next-Generation Sequencing
(NGS), using Illumina that allows sequencing billions of DNA strands in parallel. Methods and results from
DNA metabarcoding are reviewed in detail in the STREAM (2019) companion report from the University
of Guelph produced by project manager, Chloe Robinson.
In addition, we requested (1) species-level identifications from the Hajibabaei Lab to provide a deeper
understanding of the macroinvertebrate communities in Six Mile Slough and (2) that the raw data be
inspected for any trace of invasive invertebrate species.

Pre-restoration Monitoring of Six Mile Slough
11 | P a g e
I N T E G R A T E D E C O L O G I C A L R E S E A R C H
The raw output from NGS produced invertebrate and vertebrate sequences that were then reduced to
sequences that were of high enough quality to match reference sequences (STREAM 2019). Only species
taxonomically assigned with high confidence (bootstrap support >= 0.70) were included to indicate
species present in Six Mile Slough.
2.1.2.3 Amphibian protocols for safe handling
An inspection for amphibians at each site was made prior to sampling to avoid collection of amphibians.
Our protocol calls for quick removal of amphibians from the CABIN net following sampling according to
Ministry of Environment (2008) protocol for safe handling of amphibians. However, no amphibians were
collected in CABIN nets in 2019 at Six Mile Slough. At the time of sampling most Northern Leopard frogs
(LIPI) had transformed and were found in terrestrial areas.
2.1.3 Water and sediment physiochemistry
Prior to sampling for water and sediment quality, all jars were labeled, packed, and transported to sites
in a field cooler in Ziplock bags by site. At each site field personnel labeled all sample jars with site code,
time, and all other relevant information.
Field measurements of water quality and surface water samples were collected prior to other sampling
using methods of Environmental Canada (2018), Duncan and Duncan (2012), Clark (2013) and Cavanagh
et al (1997). Metering of water quality included: temperature, pH, conductivity, and dissolved oxygen
carried out using field meters.
Surface water and sediment were collected at each site. Samples were taken wearing latex gloves in a
non-disturbed area free of large amounts of vegetation prior to completing invertebrate sampling. Surface
water samples were collected immediately after field measurements for the following parameters
including, low level nutrients (total phosphorus, total Keldhal nitrogen, nitrate, nitrite, and ammonia),
alkalinity, major ions (Ca, Mg, Na, K), total suspended solids, sulfate, chlorine, and dissolved organic
carbon. A subset of these parameters was monitored in the 2014 pilot study when funding was limited.
Grab samples of surface sediment were collected following invertebrate sampling in an undisturbed
location using methods described in Environment Canada (2018), Duncan and Duncan (2012), Marvin-
DiPasquale (2009), and Clark (2013). Total metals were measured in sediment only in 2014 and in both
water and sediment from 2015-2018.
The sample jars were wrapped in bubble wrap and immediately put in a cooler with ice packs and sent to
laboratories within 24 hours of collection. CARO Analytical Services was used to analyse water and
sediment quality in 2019.
2.1.4 Quality Control
Duplicate sampling was carried out on one of the six biomonitoring sites (SMS005) for water and sediment
samples to CARO. All data was screened, and quality control measures were conducted to assess field
and laboratory data collection methods according to quality assurance and quality control field sampling
protocols in Clark (2013). Duplicate values that were greater than five times the method reporting limit

Pre-restoration Monitoring of Six Mile Slough
12 | P a g e
I N T E G R A T E D E C O L O G I C A L R E S E A R C H
(MRL) with RPD values of 20-50% (Clark 2013) were inspected and values of greater than 25% were further
considered as alerts on possible contamination or lack of representativeness. All internal quality control
for laboratory methods and results provided by the labs were reviewed and evaluated. The quality control
information on the macroinvertebrate sorting and subsampling is presented in the technical report by
Rhithron Associates Inc. (see Section 5.0).
2.2 Results
2.2.1 Geospatial measures
In the present study, the mapping of the entire wetland boundaries of Six Mile Slough and classification
was carried out by Ryan Durand (Figure 2). These products are available for other collaborative work
including: Northern Leopard Frog assessment, future biomonitoring, fish studies and vegetation
evaluations.
In addition, “buffer zones” of 100 m circular radii around biomonitoring site locations were selected as
the most relevant size to quantify disturbance affecting macroinvertebrates and physiochemistry at point
locations. We selected this scale to minimize the incorporation of areas of the Kootenay River which are
presently isolated from Six Mile Slough. Buffer zones of 100 m have also been used to evaluate landcover
in previous work by Environment Canada CABIN for wetlands (Tall et al. 2008 and 2016).
Recommendations for geospatial measures within the CABIN for wetlands protocol for quantifying
landcover are project specific (pers. com. Martens 2020).
We used the disturbance coding within the provincial Terrestrial Ecosystem Monitoring (TEM) protocols
and Sensitive Ecosystem Inventory methods (RISC 2006) to quantify landcover classes at a site level within
Six Mile Slough similar to Quamme and Durand (2019), Quamme et al. (2019). In previous work (Durand
2013, 2014, Quamme et al. 2018), the disturbance variables or stressors were simply categorized as “non-
sensitive” or coded as NS. However, this type of coding does not categorize the type of stressors which
has been shown to be more predictive of biotic indices than total disturbance (Rooney et al 2012). In
2019, we reviewed the disturbance codes in the Terrestrial Ecosystem mapping protocol (RISC 1998) in
collaboration with Amy Waterhouse and Deb MacKillop of FLNRO and determined that these codes could
function to quantify stressors (Quamme et al 2019, Section 5.1).
We used disturbance categories (TEM) to create additional variables to identify reference sites versus test
sites and other purposes similar to CABIN for streams protocols (see BCMOE 2012) that can be calculated
from Ecosystem Classification and TEM methods (Section 5.1). Additional notes for residential or urban
development or other needed codes (X. Miscellaneous) were suggested where required.

Pre-restoration Monitoring of Six Mile Slough
13 | P a g e
I N T E G R A T E D E C O L O G I C A L R E S E A R C H
Figure 2. Sensitive Ecosystem Inventory Mapping (SEI) of 500m buffer zones around plot centers of biomonitoring sites in Six
Mile Slough. SEI mapping was carried out for all wetland sites. Biomonitoring sites SMS001-SMS006. FW:pd = Open water >2m
deep and generally <50 ha, RI:fi=River and creeks including gravel bars, RI:fm =medium bench, flooded wetlands, WN:mo
=modified wetlands (Canary Reed grass), WN:ms = graminoid or forb dominated wetlands, WN:sw = shrub dominated wetlands.

Pre-restoration Monitoring of Six Mile Slough
14 | P a g e
I N T E G R A T E D E C O L O G I C A L R E S E A R C H
Scales of 100 m and 500 m have been shown to be predictive of biotic indices for plants and birds,
respectively by Rooney et al. (2012) who assessed scales of 100-3000 m radii. In contrast, the influences
of wetland cover and impervious cover on wetland quality and benthic invertebrates may also be
important at larger scales of 0.8–1.8 km (Patenaude et al. 2015). In other work, a 50 m buffer around
wetland areas was used to evaluate the presence of natural terrestrial vegetation on the perimeter of
wetland areas as a protection from external stressors in work on the St Lawrence River by Jean Martin
and collaborators with Environment and Climate Change Canada (pers. com Adam Martens 2020).
However, it may be that landscape variables are more predictive at different or varying scales. Herlihy et
al. 2019 modelled and tested scales of 200, 500 and 1000 m radii which were correlated in data collected
across the United States. They suggested that site level disturbance as well as landscape level disturbance
are both important in predicting wetland responses. To incorporate the importance of variables at varying
scales, multi-scale habitat models have been developed based on predictive power of each habitat layer.
For example, foraging bats were most strongly associated with variables measured at smaller spatial scales
of 100-500 m although variables were evaluated up to 6 km and some of these were incorporated into
the model to improve performance (Bellamy et al. 2012 and 2013). Perhaps, this could be a future
application of a large wetland database such as CABIN.
Table 1. Wetland classification of 100m buffer zones of biomonitoring sites in Six Mile Slough.
Wetland Name Sensitive Ecosystem Class: Subclass Description % Disturbance Class
SMS001 WN:ow OW-Open water 4
WN:ms Wm05-Typha 63
WN:ms Wm06-Bulrush 33
SMS002 RI:fm Mid-bench Floodplain 19 S.e/W.d= 18.9%
WN:ow OW-Open water 9
WN:ms Reed canary grass marsh 22 B.v =22%
WN:ms Wm05-Typha 50
SMS003 WN:ow OW-Open water 26 S.e/W.d = 24%
WN:ms Reed canary grass marsh 24 B.v =24%
WN:ms Wm05-Typha 50
SMS004 RI:fm Mid-bench Floodplain 9 S.e/W.d = 0.3
WN:ow OW-Open water 13
WN:ms Reed canary grass marsh 22 B.v = 22%
WN:ms Wm05-Typha 56
SMS005 WN:ms Wm05-Typha 95
WN:ms Wm06-Bulrush 5
SMS006 WN:ow OW-Open water 50
WN:ms Wm05-Typha 50 WN:ms = graminoid or forb dominated wetlands, WN:sw = shrub dominated wetlands, WN:ow permanently flooded shallow wetland, RI:fm
=medium bench flooded wetlands or dike, Wm05 = Cattail, Wm06 = Bulrush, S.e =Soil disturbance, excavation, W.d = dike, B.v = aggressive
vegetation , (Reed canary grass).

Pre-restoration Monitoring of Six Mile Slough
15 | P a g e
I N T E G R A T E D E C O L O G I C A L R E S E A R C H
2.2.2 Comparisons to previously established reference sites
We used data from previously sampled wetlands (CABIN for wetlands) in the West Kootenays (Slocan
Valley and Meadow Creek), monitored (2014-2018, Table 2), in order to compare to Six Mile Slough with
the goal of assessing the relative status of the slough to the range of wetlands in this area. This was carried
out in the first year of reporting to aid with management decisions. However, pre-restoration monitoring
(before restoration controls) as well as the sites not affected or less affected by changes to floodplain
restoration and changes in hydrology (post-restoration controls) will serve as reference sites to elucidate
the changes of floodplain reconnection and restoration in the future.
Six Mile Slough includes 1,260-hectares of wetlands within the CVWMA located on the floodplain of the
Kootenay River as it enters Kootenay Lake. The wetlands have been impacted by agriculture, draining,
flood control, channeling, and rail. Other disturbances to the wetland in the past, include historical grazing
of the area which was called Lewis Island and later became part of Six Mile Slough. There were as many
of 250 cows and calves grazed there, and a house and slaughterhouse owned by Ike Lewis (Biebighowser
and Annschild, 2016). In 1974-75 diking was carried out to stabilize water levels for wildlife purposes.
Currently, the water control structures are non-functioning.
Twelve samples were collected from Six Mile Slough wetland at n=6 locations, collected from 523-533 m
elevation. We found that Six Mile Slough was dominated by cattail (Typha latifolia) and cattail mats
(Wm05), reed canary grass and bulrush (Wm06) or shallow water (OW) (Table 1). The wetland also had a
compacted bottom overlain with organic soils (10-20 cm deep) that developed since 1975 when flooding
was stabilized by dikes. Diking is extensive and comprises 6.7-hectares of Six Mile Slough (Biebighowser
and Annschild 2016).
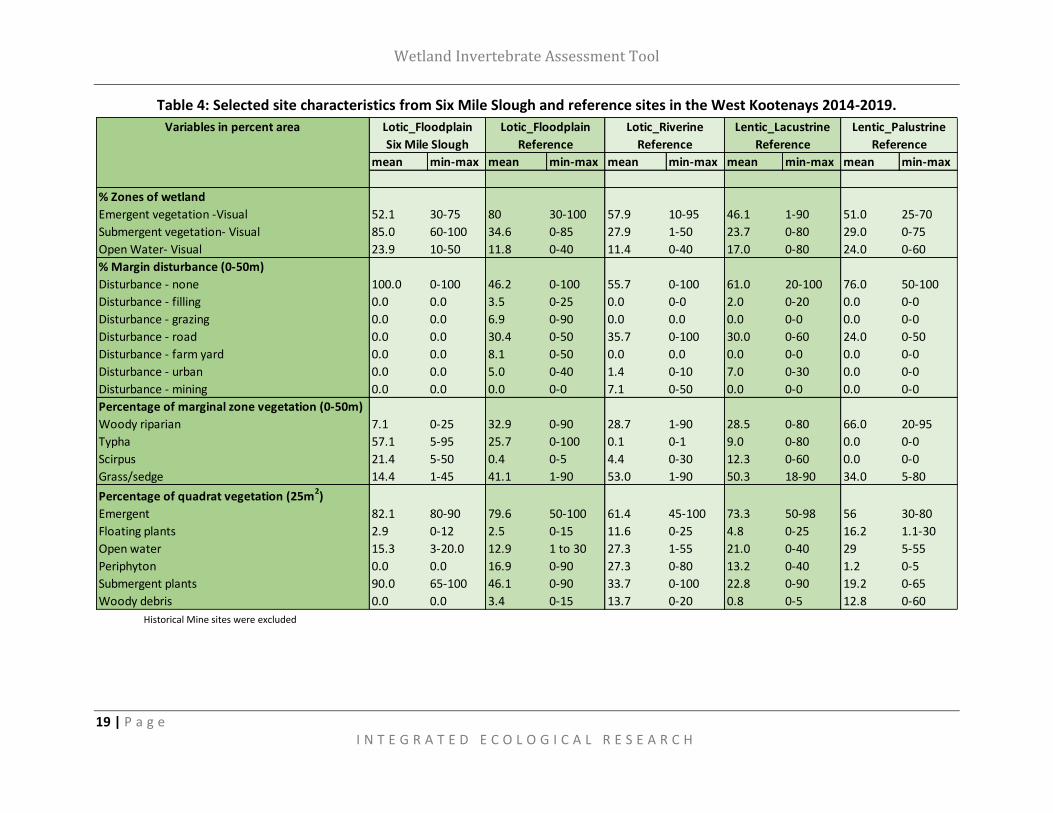
Mapping of 100m buffers zones around biomonitoring sites in our project demonstrated that Typha
comprised 50-95% of the circular areas (Table 1). Typha also dominated the emergent vegetation in
quadrats (median =50%) while submergent vegetation dominated bottom coverage of quadrats (90%)
with little development of periphyton (Table 4). The disconnection of the wetland from the natural
flooding regime allowed cattails to invade the wetland and resulted in the loss of plant diversity
(Biebighowser and Annschild, 2016).
Pre-restoration Monitoring of Six Mile Slough
16 | P a g e
I N T E G R A T E D E C O L O G I C A L R E S E A R C H
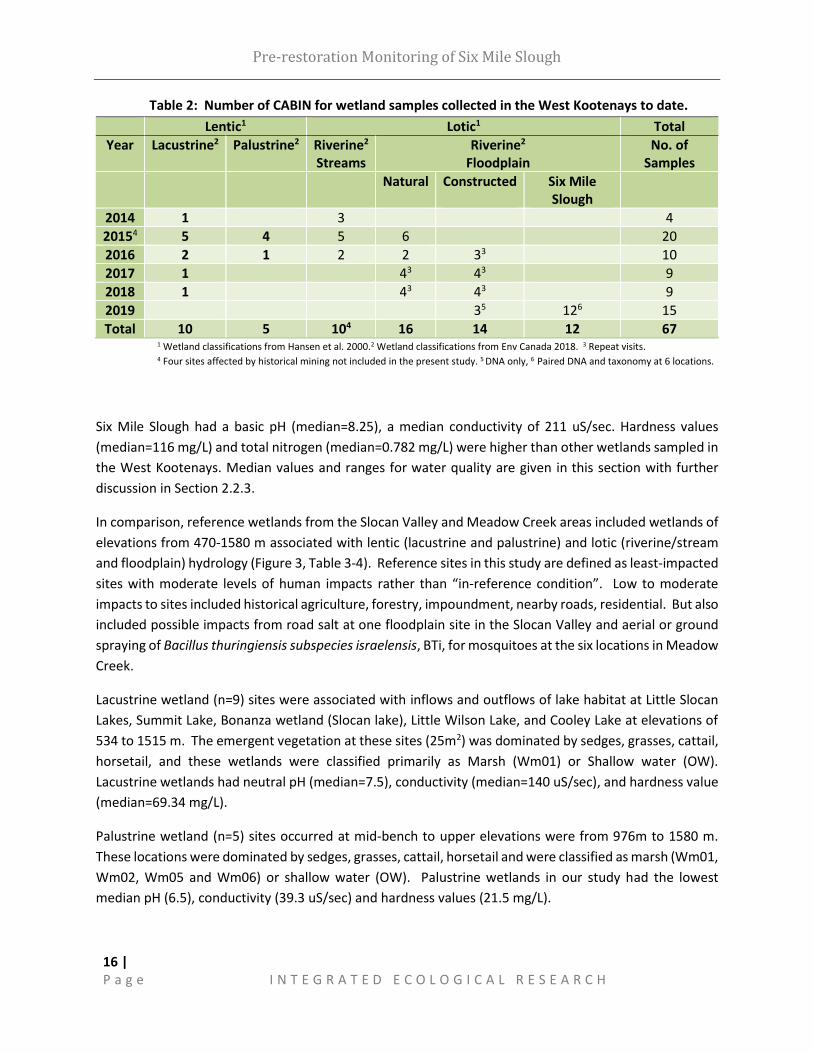
Table 2: Number of CABIN for wetland samples collected in the West Kootenays to date.
Lentic1 Lotic1 Total
Year Lacustrine2 Palustrine2 Riverine2
Streams Riverine2
Floodplain No. of
Samples
Natural Constructed
Six Mile Slough
2014 1 3 4
20154 5 4 5 6 20
2016 2 1 2 2 33 10
2017 1 43 43 9
2018 1 43 43 9
2019 35 126 15
Total 10 5 104 16 14 12 67 1 Wetland classifications from Hansen et al. 2000.2 Wetland classifications from Env Canada 2018. 3 Repeat visits. 4 Four sites affected by historical mining not included in the present study. 5 DNA only, 6 Paired DNA and taxonomy at 6 locations.
Six Mile Slough had a basic pH (median=8.25), a median conductivity of 211 uS/sec. Hardness values
(median=116 mg/L) and total nitrogen (median=0.782 mg/L) were higher than other wetlands sampled in
the West Kootenays. Median values and ranges for water quality are given in this section with further
discussion in Section 2.2.3.
In comparison, reference wetlands from the Slocan Valley and Meadow Creek areas included wetlands of
elevations from 470-1580 m associated with lentic (lacustrine and palustrine) and lotic (riverine/stream
and floodplain) hydrology (Figure 3, Table 3-4). Reference sites in this study are defined as least-impacted
sites with moderate levels of human impacts rather than “in-reference condition”. Low to moderate
impacts to sites included historical agriculture, forestry, impoundment, nearby roads, residential. But also
included possible impacts from road salt at one floodplain site in the Slocan Valley and aerial or ground
spraying of Bacillus thuringiensis subspecies israelensis, BTi, for mosquitoes at the six locations in Meadow
Creek.
Lacustrine wetland (n=9) sites were associated with inflows and outflows of lake habitat at Little Slocan
Lakes, Summit Lake, Bonanza wetland (Slocan lake), Little Wilson Lake, and Cooley Lake at elevations of
534 to 1515 m. The emergent vegetation at these sites (25m2) was dominated by sedges, grasses, cattail,
horsetail, and these wetlands were classified primarily as Marsh (Wm01) or Shallow water (OW).
Lacustrine wetlands had neutral pH (median=7.5), conductivity (median=140 uS/sec), and hardness value
(median=69.34 mg/L).
Palustrine wetland (n=5) sites occurred at mid-bench to upper elevations were from 976m to 1580 m.
These locations were dominated by sedges, grasses, cattail, horsetail and were classified as marsh (Wm01,
Wm02, Wm05 and Wm06) or shallow water (OW). Palustrine wetlands in our study had the lowest
median pH (6.5), conductivity (39.3 uS/sec) and hardness values (21.5 mg/L).

Pre-restoration Monitoring of Six Mile Slough
17 | P a g e
I N T E G R A T E D E C O L O G I C A L R E S E A R C H
Riverine wetlands (n=10) situated along streams or within river valleys were located at elevations of 567-
1080 m. These sites were dominated by sedges, cattails and grasses and were classified as marsh (Wm01,
Wm02) or shallow water (OW). Complexes of these types of habitats were typically associated with treed
swamp habitats (Durand 2016). Upper elevation riverine wetlands had neutral pH (median=7.5),
conductivity (median =75.3 uS/sec) and hardness values (median =29.7 mg/L).
Floodplain wetlands (n=16) included small ponds or side-channels located at low elevations (470-558 m)
on the floodplain of the Slocan or Duncan Rivers. Five of these sites were constructed wetlands. These
wetland sites (25m2) were dominated by sedges, cattails and grasses and were classified as marsh (Wm01,
Wm02, Wm05) or shallow water (OW). Floodplain habitats were frequently dominated by canary reed
grass and/or treed swamp habitats (Durand 2016).
Table 3: Description and classification of reference sites. n2 Elevation
(m) Dominant emergent Classification1 Locations
Lacustrine 10 534-1515 Sedges, grasses, cattail, horsetail
Marsh (Wm01, WM05), Shallow water (OW)
Little Slocan Lakes, Summit Lake, Snk’mip/Bonanza Marsh, Little Wilson Lake, Cooley Lake
Palustrine 5 976-1580 Sedges, grasses, cattail, horsetail
Marsh (Wm01, Wm02, Wm05 and Wm06) or Shallow water (OW).
Mid-bench wetlands in Winlaw Creek woodlot, private land Paradise Road, Goose Creek FSR above Cooley Lake
Riverine, Stream
10 567-1080 Sedges, cattails, and grasses
Marsh (Wm01, Wm02) or shallow water (OW)
Pass Creek wetland, Beaver Lakes complex, Bear Lake outflow
Riverine, Floodplain
30 470-558 Sedges, cattails, and grasses
Marsh (Wm01, Wm02, Wm05) or shallow water (OW)
Small ponds and side-channels on the floodplain of the Slocan or Duncan Rivers including natural (n=16 samples) and 5 constructed wetlands (n=14 samples)
Six Mile Slough
12 (6-paired)
523-533 Cattail, bulrush, and Reed canary grass dominated wetland (See Table 5)
Marsh (Wm05 and Wm06) or Shallow water (OW). Deep pool/small lake in Compartment 3 is >5m (Figure 1).
1,260-hectares of wetlands within the CVWMA historically impacted by agriculture, ditching/draining, flood control, channeling, and rail. Divided into 5 compartments in 1974 and 75 by diking for wildlife purposes. currently non-functioning water control structures.
1 Wetland classification, MacKenzie W. and J. Moran (2004), 2 n=number of samples

Pre-restoration Monitoring of Six Mile Slough
18 | P a g e
I N T E G R A T E D E C O L O G I C A L R E S E A R C H
Figure 3: Location of monitoring of CABIN sites in the West Kootenays by wetland type.
Wetland Invertebrate Assessment Tool
19 | P a g e I N T E G R A T E D E C O L O G I C A L R E S E A R C H
Table 4: Selected site characteristics from Six Mile Slough and reference sites in the West Kootenays 2014-2019.
Historical Mine sites were excluded
mean min-max mean min-max mean min-max mean min-max mean min-max
% Zones of wetland
Emergent vegetation -Visual 52.1 30-75 80 30-100 57.9 10-95 46.1 1-90 51.0 25-70
Submergent vegetation- Visual 85.0 60-100 34.6 0-85 27.9 1-50 23.7 0-80 29.0 0-75
Open Water- Visual 23.9 10-50 11.8 0-40 11.4 0-40 17.0 0-80 24.0 0-60
% Margin disturbance (0-50m)
Disturbance - none 100.0 0-100 46.2 0-100 55.7 0-100 61.0 20-100 76.0 50-100
Disturbance - filling 0.0 0.0 3.5 0-25 0.0 0-0 2.0 0-20 0.0 0-0
Disturbance - grazing 0.0 0.0 6.9 0-90 0.0 0.0 0.0 0-0 0.0 0-0
Disturbance - road 0.0 0.0 30.4 0-50 35.7 0-100 30.0 0-60 24.0 0-50
Disturbance - farm yard 0.0 0.0 8.1 0-50 0.0 0.0 0.0 0-0 0.0 0-0
Disturbance - urban 0.0 0.0 5.0 0-40 1.4 0-10 7.0 0-30 0.0 0-0
Disturbance - mining 0.0 0.0 0.0 0-0 7.1 0-50 0.0 0-0 0.0 0-0
Percentage of marginal zone vegetation (0-50m)
Woody riparian 7.1 0-25 32.9 0-90 28.7 1-90 28.5 0-80 66.0 20-95
Typha 57.1 5-95 25.7 0-100 0.1 0-1 9.0 0-80 0.0 0-0
Scirpus 21.4 5-50 0.4 0-5 4.4 0-30 12.3 0-60 0.0 0-0
Grass/sedge 14.4 1-45 41.1 1-90 53.0 1-90 50.3 18-90 34.0 5-80
Percentage of quadrat vegetation (25m2)
Emergent 82.1 80-90 79.6 50-100 61.4 45-100 73.3 50-98 56 30-80
Floating plants 2.9 0-12 2.5 0-15 11.6 0-25 4.8 0-25 16.2 1.1-30
Open water 15.3 3-20.0 12.9 1 to 30 27.3 1-55 21.0 0-40 29 5-55
Periphyton 0.0 0.0 16.9 0-90 27.3 0-80 13.2 0-40 1.2 0-5
Submergent plants 90.0 65-100 46.1 0-90 33.7 0-100 22.8 0-90 19.2 0-65
Woody debris 0.0 0.0 3.4 0-15 13.7 0-20 0.8 0-5 12.8 0-60
Variables in percent area
ReferenceSix Mile Slough Reference Reference Reference
Lotic_Floodplain Lotic_Floodplain Lotic_Riverine Lentic_Lacustrine Lentic_Palustrine

Pre-restoration Monitoring of Six Mile Slough
20 | P a g e
I N T E G R A T E D E C O L O G I C A L R E S E A R C H
2.2.3 Physiochemistry of Six Mile Slough and Kootenay River
2.2.3.1 Water quality: Nutrients
Analyses of nitrogen and phosphorus were undertaken to aid the evaluation of possible restoration
decisions regarding Six Mile Slough including reconnection of the wetland to the mainstem Kootenay River
(Figure 4). Aquatic organisms require nitrogen and phosphorus for basic metabolic processes. Nutrient
status is an important indicator in regard to the productivity of a wetland or body of water.
We also used water quality to help assess the results from the macroinvertebrate collection within Six
Mile Slough. Our priority in 2019 was the water quality of the wetland rather than a full assessment of
the restoration impacts on the Kootenay River. Thus, only two sites were collected from the Kootenay
River as a preliminary verification of work done in other monitoring (Hoyle et al. 2013, Swain 2017 and
Bassett et al. 2018). Further possible pre-restoration planning and recommendations for this approach
will be discussed for 2020.
Measurements of the total nutrients in water were higher in Six Mile Slough than the Kootenay River. The
total nitrogen was 4.7 times higher in Six Mile Slough (SMS001-6, n=6) than in the Kootenay River (KR001-
2, n=2) when measured July 29-30, 2019 while the total phosphorus was 4.0 times higher in Six Mile Slough
(SMS001-6, n=6) than in the Kootenay River (KR001-2, n=2).
The mean level of total nitrogen within Six Mile Slough wetland was 0.826 mg/L N (n=6, median=0.782,
25th-75th percentile = 0.687-0.819 mg/L) whereas the mean of the Kootenay River samples was 0.175
mg/L (n=2). The median values of total nitrogen from Six Mile Slough were within the ranges of reference
wetlands (n=36, mean= 0.640, median=0.430, 25th-75th percentile = 0.243-0.862 mg/L, Table 5).
The mean level of total phosphorus within the wetland was 0.034 mg/L N (n=6, 25th-75th percentile =
0.024-0.033 mg/L) whereas the mean of the Kootenay River samples was 0.0085 mg/L (n=2). Six Mile
Slough is a mesotrophic system because total phosphorus falls within the limits of 0.01-0.035 mg TP/L for
assessment of trophic status (Ready and Deleune 2008). In contrast, the Kootenay River is an oligotrophic
system because total phosphorus is less than 0.01 mg TP/L. The median values of total phosphorus from
Six Mile Slough were within the ranges of reference wetlands in Meadow Creek and the Slocan Valley
(n=40, mean=0.068, median=0.024, 25th-75th percentile = 0.011-0.073 mg/L, Table 5). Values for
reference wetlands suggest that the trophic status of wetlands in the Slocan and Meadow Creek areas
ranged from mesotrophic to eutrophic (Ready and Deleune 2008).
Total nutrient measurements included dissolved and organic fractions. The total organic phosphorus
comprised 63.5% of the total phosphorus within Six Mile Slough relative to 56.7% within Kootenay River.
While the organic fraction of nitrogen, total organic nitrogen, comprised 87.2% of the total nitrogen within
Six Mile Slough while the samples collected from Kootenay River were below detection. In contrast, in
Kootenay River the dominate forms of nitrogen were ammonia and nitrate-N which comprised over 98%
of the total nitrogen (n=2) while these forms of nitrogen only comprised 14% in Six Mile Slough (n=6).
Pre-restoration Monitoring of Six Mile Slough
21 | P a g e
I N T E G R A T E D E C O L O G I C A L R E S E A R C H
Typically, nitrogen and phosphorus within wetlands predominate in organic forms due to the high organic
fraction within wetlands soils and overlying water.
For the purposes of this study, we defined the term total organic phosphorus as the difference between
total phosphorus and inorganic phosphorus in order to approximate the total organic phosphorus (TOP)
within Six Mile Slough (similar to Ready and DeLaune 2008). We justified this terminology due to the
predominance of organics and the lack of clays in Six Mile Slough that might bind phosphorus. The surface
organic soils (15-25cm) are underlain by sand and silt laid down prior to the isolation of the slough from
Kootenay River in the 1970s through diking and restoration for migratory birds. In water quality analyses,
some mineral forms of phosphorus may not have been solubilized during the extraction process with a
strong acid if strongly bonded to inorganic particulates. As a result, an alternative terminology that is
likely slightly more accurate would be “insoluble phosphorus”.
Nitrogen is the typically limiting nutrient in wetlands with most of nitrogen and phosphorus stored in the
form of organic nitrogen and phosphorus (Ready and DeLaune 2008). If we use the N:P ratio of biologically
available dissolved inorganic nitrogen (DIN) to total dissolved phosphorus (TDP) where <14:1 (weight to
weight) indicative of nitrogen limitation and >14:1 as indicative of phosphorus limitation (Koerselman and
Meuleman. 1996) like Basset et al. 2018. The mean DIN:TDP ratio for the six sites at Six Mile Slough was
10.06 (n = 6, median = 10.38, 25-75th percentile = 7.8-12.3, Table 5) which suggests that DIN-nitrogen may
be limiting relative to total dissolved phosphorus concentrations. These trends were confirmed by 36
samples from lacustrine, palustrine, riverine and small floodplain wetlands where the median N:P ratio
was 4.3 (n = 36, median = 3.35, 25-75th percentile = 2.7-12.4, Table 5) in the Slocan and Meadow Creek
areas (Quamme et al. 2019).
In contrast, the two samples from Kootenay River suggests that phosphorus is limiting because the
DIN:TDP is 46.7 (n = 2). Low levels of nitrogen and phosphorus monitored in Kootenay River and Kootenay
Lake have been well documented in a large body of work in the USA (Hoyle et al. 2013) and on-going
monitoring in Canada (Swain, 2007, Bassett et al. 2018, Schindler et al. 2011). Lower nutrients within
Kootenay River and Kootenay Lake are thought to result from upstream habitat alteration from diking and
draining of floodplain wetlands, channelization, impoundment from Libby Dam, and deforestation of the
historical floodplain (Hoyle et al. 2013, Bassett et al. 2018).
The reducing conditions found at the bottom of Six Mile Slough wetland (mean dissolved oxygen 2.8 mg/L,
range 0.4-5.4 mg/L, 10cm from bottom) promote denitrification, typically, caused by uptake by aquatic
vegetation, microbial activity, and mineralization of organic matter. As a result, nitrates (NO3-) are
converted to ammonia (NH4-) in lower oxygen environments such as Six Mile Slough. Total dissolved
phosphorus is also released under reducing conditions likely accounting for higher phosphorus levels and
ammonia within the wetland. This may account for the higher concentrations of phosphorus at SMS001
had the second lowest level of dissolved oxygen (0.5 mg/L) measured within Six Mile Slough for all forms
of phosphorus (Figure 4).

Pre-restoration Monitoring of Six Mile Slough
22 | P a g e
I N T E G R A T E D E C O L O G I C A L R E S E A R C H
Figure 4. Nutrient concentrations (mg/L) for surface water samples collected from six sites within Six Mile Slough (SMS001-6)
and two sites within the Kootenay River (KR001-2). NP ratio (weight:weight) is the ratio of dissolved inorganic nitrogen (nitrite,
nitrate and ammonia) to dissolved phosphorus. Nitrate levels in Six Mile Slough were below detection. Method reporting levels
included: total and total organic nitrogen (0.05 mg/L), nitrate (0.01 mg/L), ammonia (0.02 mg/L), all forms of phosphorus (0.002
mg/L). Nitrite was below detection at all sites (0.01 mg/L).
Further work and planning regarding the downstream effects of reconnection of Six Mile Slough to the
Kootenay River could involve greater water quality sampling and downstream evaluation of nutrient
spiralling during peak flows and throughout the growing season. Calculation of nutrient loadings at key
locations may aid this evaluation. Work up of Environment Canada time-series data from Kootenay River
at Creston would also be useful as well as downstream monitoring. Further review of nutrient levels or
comparisons to the South Arm of Kootenay Lake nutrient monitoring station may provide additional
inference.
Pre-restoration Monitoring of Six Mile Slough
23 | P a g e
I N T E G R A T E D E C O L O G I C A L R E S E A R C H
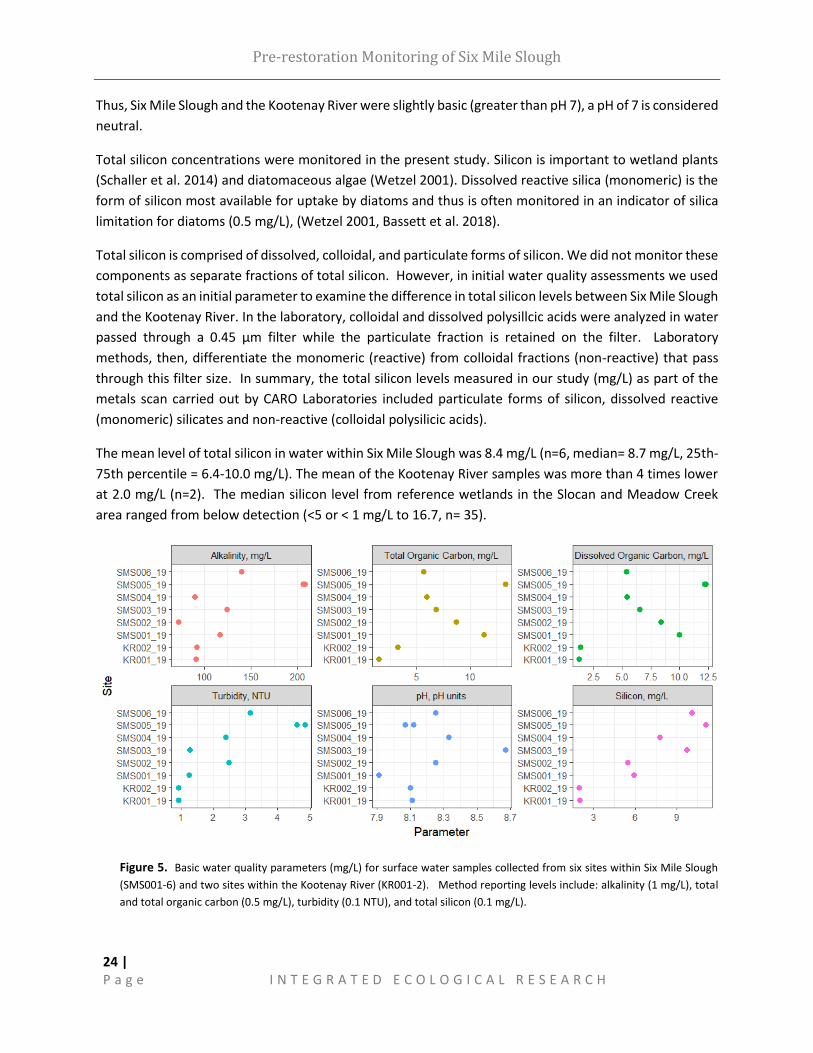
2.2.3.2 Water quality: alkalinity, carbon, turbidity, pH, and silicon
Basic water quality parameters for surface water samples was collected from six sites within Six Mile
Slough (SMS001-6) and two sites within the Kootenay River (KR001-2) including: alkalinity, total and total
organic carbon, turbidity, and total silicon (Figure 5).
Alkalinity is a property of water which is the buffering capacity or ability to resist changes in pH and is
dependent on the concentration of bicarbonates, carbonates, and hydroxides in water (Swensen and
Baldwin 1965). Measurements of alkalinity in water in Six Mile Slough (SMS001-6, n=6) and the Kootenay
River (KR001-2, n=2) ranged from 91-208 mg/L when measured July 29-30, 2019. The mean alkalinity
within the Six Mile Slough wetland was 136.7 mg/L N (n=6, median=124 mg/L, 25th-75th percentile =
103.4-173.0 mg/L) whereas the mean of the Kootenay River samples was 91.4 mg/L (n=2). The median
alkalinity from reference wetlands in the Slocan and Meadow Creek area was 91.8 mg/L and ranged from
13.7 to 427mg/L (25th-75th percentile = 34.1-74.8 mg/L, n=38, Table 5).
Carbon in water was measured as both, total and dissolved organic carbon. Carbon acts as an energy
sources for living systems and is a key component in living systems and cells structure also serving as an
electron acceptor in microbial processes (Ready and DeLeune 2008). The mean level of total organic
carbon within Six Mile Slough was 8.62 mg/L N (n=6, median= 7.8, 25th-75th percentile = 6.17-8.66 mg/L).
The mean of the Kootenay River samples was 2.35 mg/L (n=2). The mean level of total dissolved organic
carbon within Six Mile Slough was 8.60 mg/L N (n=6, median= 8.41, 25th-75th percentile = 5.97-10.40
mg/L). The mean of the Kootenay River samples was 1.29 mg/L (n=2). The median total dissolved organic
carbon from reference wetlands in the Slocan and Meadow Creek area was 4.0 mg/L ranging from 0.5-
35.7 mg/L (25th-75th percentile = 3.0-10.45 mg/L, n=38, Table 5).
Total organic carbon and dissolved organic carbon were remarkably similar in value. This is because
dissolved organic carbon, typically, accounts for more than 90% of the total organic matter in wetlands
(Ready and DeLeune 2008). Dissolved organic carbon is released under the reducing conditions such as
observed in Six Mile Slough during organic matter decomposition and breakdown with microbial activity
(Scott et al 2014).
The mean level of turbidity within Six Mile Slough was 2.9 NTU (n=6, median= 2.5 NTU, 25th-75th
percentile = 1.8-3.9 NTU). The mean of the Kootenay River samples was 0.9 NTU (n=2). The median
turbidity from reference wetlands in the Slocan and Meadow Creek area was 3.7 NTU ranging from 0.5-
19.3 NTU (25th-75th percentile = 0.5-2.0 NTU, n=39, Table 5). These values are reflected of seasonally
receding water levels and baseline flows on the Kootenay River. Increased wind on July 30, 2019,
compared to the previous sampling day may have cause a slight increase in turbidity in the sampling of
SMS005 and SMS006, relative to other sites (Figure 2).
The pH of within Six Mile Slough was 8.3 (n=6, median= 8.3, 25th-75th percentile = 8.1-8.3). The mean of
the Kootenay River samples was 8.1 (n=2). The median pH level from reference wetlands in the Slocan
and Meadow Creek area was 7.4 ranging from 6.0-8.3 (25th-75th percentile = 6.9-7.4, n=40, Table 5).
Pre-restoration Monitoring of Six Mile Slough
24 | P a g e
I N T E G R A T E D E C O L O G I C A L R E S E A R C H
Thus, Six Mile Slough and the Kootenay River were slightly basic (greater than pH 7), a pH of 7 is considered
neutral.
Total silicon concentrations were monitored in the present study. Silicon is important to wetland plants
(Schaller et al. 2014) and diatomaceous algae (Wetzel 2001). Dissolved reactive silica (monomeric) is the
form of silicon most available for uptake by diatoms and thus is often monitored in an indicator of silica
limitation for diatoms (0.5 mg/L), (Wetzel 2001, Bassett et al. 2018).
Total silicon is comprised of dissolved, colloidal, and particulate forms of silicon. We did not monitor these
components as separate fractions of total silicon. However, in initial water quality assessments we used
total silicon as an initial parameter to examine the difference in total silicon levels between Six Mile Slough
and the Kootenay River. In the laboratory, colloidal and dissolved polysillcic acids were analyzed in water
passed through a 0.45 µm filter while the particulate fraction is retained on the filter. Laboratory
methods, then, differentiate the monomeric (reactive) from colloidal fractions (non-reactive) that pass
through this filter size. In summary, the total silicon levels measured in our study (mg/L) as part of the
metals scan carried out by CARO Laboratories included particulate forms of silicon, dissolved reactive
(monomeric) silicates and non-reactive (colloidal polysilicic acids).
The mean level of total silicon in water within Six Mile Slough was 8.4 mg/L (n=6, median= 8.7 mg/L, 25th-
75th percentile = 6.4-10.0 mg/L). The mean of the Kootenay River samples was more than 4 times lower
at 2.0 mg/L (n=2). The median silicon level from reference wetlands in the Slocan and Meadow Creek
area ranged from below detection (<5 or < 1 mg/L to 16.7, n= 35).
Figure 5. Basic water quality parameters (mg/L) for surface water samples collected from six sites within Six Mile Slough
(SMS001-6) and two sites within the Kootenay River (KR001-2). Method reporting levels include: alkalinity (1 mg/L), total
and total organic carbon (0.5 mg/L), turbidity (0.1 NTU), and total silicon (0.1 mg/L).

Pre-restoration Monitoring of Six Mile Slough
25 | P a g e
I N T E G R A T E D E C O L O G I C A L R E S E A R C H
Table 5: Selected physiochemical variables from water and sediment by habitat type 2014-2019.
Wetland Invertebrate Assessment Tool
26 | P a g e
I N T E G R A T E D E C O L O G I C A L R E S E A R C H
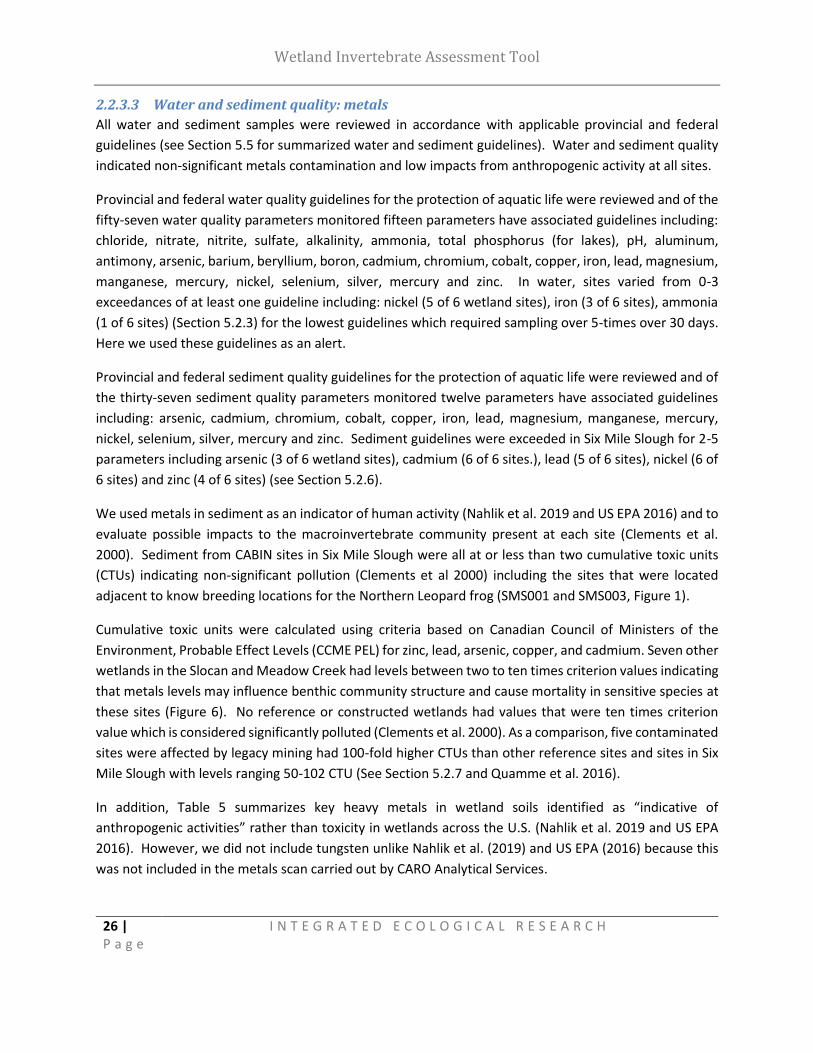
2.2.3.3 Water and sediment quality: metals
All water and sediment samples were reviewed in accordance with applicable provincial and federal
guidelines (see Section 5.5 for summarized water and sediment guidelines). Water and sediment quality
indicated non-significant metals contamination and low impacts from anthropogenic activity at all sites.
Provincial and federal water quality guidelines for the protection of aquatic life were reviewed and of the
fifty-seven water quality parameters monitored fifteen parameters have associated guidelines including:
chloride, nitrate, nitrite, sulfate, alkalinity, ammonia, total phosphorus (for lakes), pH, aluminum,
antimony, arsenic, barium, beryllium, boron, cadmium, chromium, cobalt, copper, iron, lead, magnesium,
manganese, mercury, nickel, selenium, silver, mercury and zinc. In water, sites varied from 0-3
exceedances of at least one guideline including: nickel (5 of 6 wetland sites), iron (3 of 6 sites), ammonia
(1 of 6 sites) (Section 5.2.3) for the lowest guidelines which required sampling over 5-times over 30 days.
Here we used these guidelines as an alert.
Provincial and federal sediment quality guidelines for the protection of aquatic life were reviewed and of
the thirty-seven sediment quality parameters monitored twelve parameters have associated guidelines
including: arsenic, cadmium, chromium, cobalt, copper, iron, lead, magnesium, manganese, mercury,
nickel, selenium, silver, mercury and zinc. Sediment guidelines were exceeded in Six Mile Slough for 2-5
parameters including arsenic (3 of 6 wetland sites), cadmium (6 of 6 sites.), lead (5 of 6 sites), nickel (6 of
6 sites) and zinc (4 of 6 sites) (see Section 5.2.6).
We used metals in sediment as an indicator of human activity (Nahlik et al. 2019 and US EPA 2016) and to
evaluate possible impacts to the macroinvertebrate community present at each site (Clements et al.
2000). Sediment from CABIN sites in Six Mile Slough were all at or less than two cumulative toxic units
(CTUs) indicating non-significant pollution (Clements et al 2000) including the sites that were located
adjacent to know breeding locations for the Northern Leopard frog (SMS001 and SMS003, Figure 1).
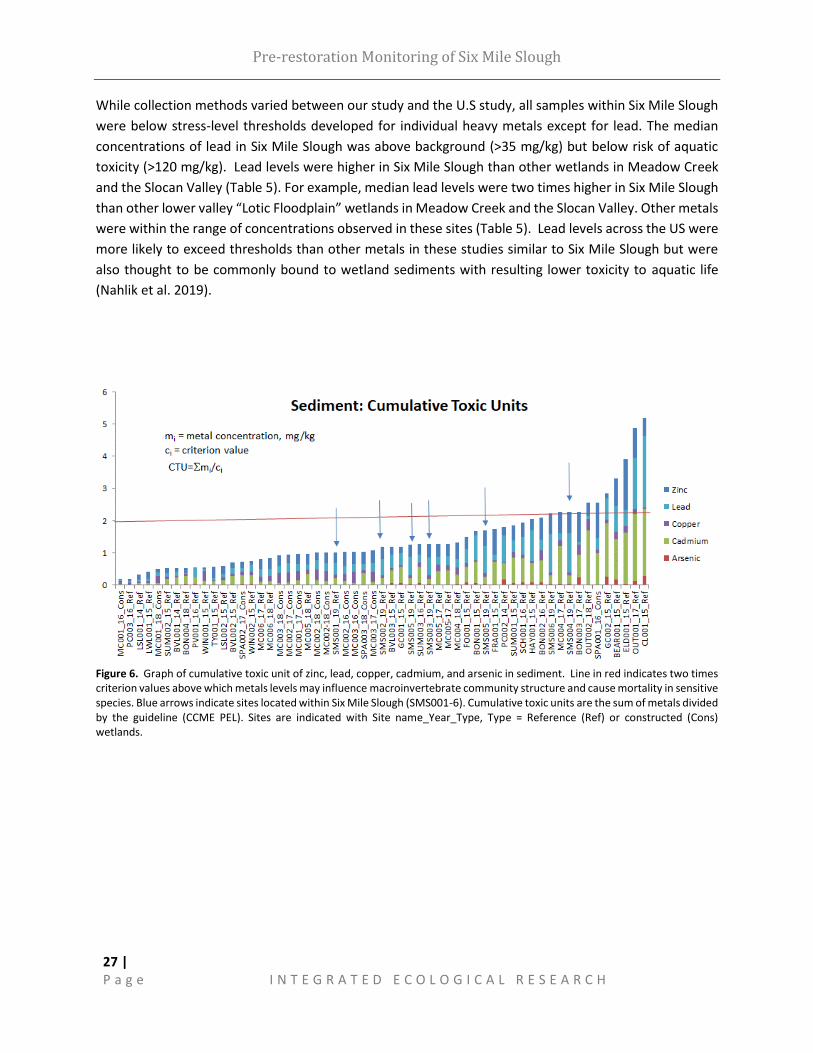
Cumulative toxic units were calculated using criteria based on Canadian Council of Ministers of the
Environment, Probable Effect Levels (CCME PEL) for zinc, lead, arsenic, copper, and cadmium. Seven other
wetlands in the Slocan and Meadow Creek had levels between two to ten times criterion values indicating
that metals levels may influence benthic community structure and cause mortality in sensitive species at
these sites (Figure 6). No reference or constructed wetlands had values that were ten times criterion
value which is considered significantly polluted (Clements et al. 2000). As a comparison, five contaminated
sites were affected by legacy mining had 100-fold higher CTUs than other reference sites and sites in Six
Mile Slough with levels ranging 50-102 CTU (See Section 5.2.7 and Quamme et al. 2016).
In addition, Table 5 summarizes key heavy metals in wetland soils identified as “indicative of
anthropogenic activities” rather than toxicity in wetlands across the U.S. (Nahlik et al. 2019 and US EPA
2016). However, we did not include tungsten unlike Nahlik et al. (2019) and US EPA (2016) because this
was not included in the metals scan carried out by CARO Analytical Services.
Pre-restoration Monitoring of Six Mile Slough
27 | P a g e
I N T E G R A T E D E C O L O G I C A L R E S E A R C H
While collection methods varied between our study and the U.S study, all samples within Six Mile Slough
were below stress-level thresholds developed for individual heavy metals except for lead. The median
concentrations of lead in Six Mile Slough was above background (>35 mg/kg) but below risk of aquatic
toxicity (>120 mg/kg). Lead levels were higher in Six Mile Slough than other wetlands in Meadow Creek
and the Slocan Valley (Table 5). For example, median lead levels were two times higher in Six Mile Slough
than other lower valley “Lotic Floodplain” wetlands in Meadow Creek and the Slocan Valley. Other metals
were within the range of concentrations observed in these sites (Table 5). Lead levels across the US were
more likely to exceed thresholds than other metals in these studies similar to Six Mile Slough but were
also thought to be commonly bound to wetland sediments with resulting lower toxicity to aquatic life
(Nahlik et al. 2019).
Figure 6. Graph of cumulative toxic unit of zinc, lead, copper, cadmium, and arsenic in sediment. Line in red indicates two times criterion values above which metals levels may influence macroinvertebrate community structure and cause mortality in sensitive species. Blue arrows indicate sites located within Six Mile Slough (SMS001-6). Cumulative toxic units are the sum of metals divided by the guideline (CCME PEL). Sites are indicated with Site name_Year_Type, Type = Reference (Ref) or constructed (Cons) wetlands.
Pre-restoration Monitoring of Six Mile Slough
28 | P a g e
I N T E G R A T E D E C O L O G I C A L R E S E A R C H
2.2.4 Ecological productivity and diversity of Six Mile Slough
This study is the first project in BC to use both traditional taxonomy and DNA meta-barcoding to assess
wetland biodiversity of invertebrates to assess restoration and management actions. This project
provided a unique opportunity to obtain data using two different methods in a paired sample approach
to evaluate the biodiversity and invertebrate productivity of Six Mile Slough.
DNA meta-barcoding provided species identification and a deeper understanding of indicator organisms
present at the species level. This data will be used as a baseline to effectively evaluate pre-restoration
years (2019 and 2020) and to post-restoration monitoring (2021-) in comparison analyses. Next
Generation Sequencing also provided new information on wetland invertebrate species inhabiting Six Mile
Slough. This is important because knowledge on wetland invertebrates at the species level is limited in
BC and because Six Mile Slough within the Creston Valley Wildlife Management Area is a designated
RAMSAR site and wetland of international importance.
With respect to assessing productivity of Six Mile Slough, traditional taxonomy outputs based on
morphology included the numerical abundance and biodiversity measures at the genus-level for
diagnostic species. In addition, voucher specimens housed at the Royal BC Museum could be used to
analyze for food web analyses that involve biomass estimates in the future if costs permit. For the present
study, we focussed on numerical abundance of invertebrates in Six Mile Slough as a measure of
production. Importantly, traditional taxonomy also allowed us to make comparisons to previous sites
sampled in the West Kootenay Region to date.
2.2.4.1 Quantifying the abundance and biodiversity: morphology-based taxonomy
The abundance and biodiversity of macroinvertebrates identified by morphology from sites in Six Mile
Slough relative to previously collected samples from the Slocan Valley and Meadow Creek area from 2015-
2018 were compared as benchmarks for the present data. However, the main goal of this project will be
to compare future post-restoration monitoring at Six Mile Slough relative to pre-restoration monitoring
at control and restored sites.
The total abundance and richness were grouped by Chironomidae (midges), Other Diptera (flies),
Segmented worms (Annelida), Arachnids (aquatic mites), OET (Odonata, dragonflies, Ephemeroptera,
mayflies, Trichoptera, caddisflies) and BGA (Bivalves, Amphipods, freshwater shrimp, and Gastropod,
snails) and Arachnids (aquatic mites) (Figure 7 and 8) at constructed wetlands was compared graphically
to reference sites.
Counts of the abundance of chironomids comprised 33% (1-91%) of the total counts 40% (2-92%) of total
counts were dipteran on average (Figure 7). Other groups excluding Diptera comprised 60% (8-98%) of
total counts. Chironomids were the most diverse group at the genus level comprising 15-53% of the
number of genus across all wetland types among these groups while total dipterans (flies including
chironomids) comprised 26-65%. Other groups not including Diptera comprised 35-74% of the total
number of genus across all wetland, respectively. At Six Mile Slough, chironomids comprised 21-33% of

Pre-restoration Monitoring of Six Mile Slough
29 | P a g e
I N T E G R A T E D E C O L O G I C A L R E S E A R C H
the number of genus across all wetland types among these groups while total dipterans (flies including
chironomids) comprised 26-64%. Other groups not including Diptera comprised 46-74%
Counts of the number of total dipteran genus (chironomids plus other dipterans) comprised 39-72% of
the total counts relative to constructed sites 50-% of total counts were dipteran on average (Figure 8).
Other groups including OET, annelids and BGA, together, comprised 28-61% of total counts at reference
sites and 25-50% at constructed sites over the 3-years (Figure 8).
Figure 7. Abundance at wetlands monitored in 2019 from Six Mile Slough and 2015-18 in Meadow Creek and Slocan areas.
Annelid (orange)= segmented worms), Arachnid (grey)= Aquatic mites, BGA (yellow) = Bivalves, gastropods plus amphipods,
Chironomidae (bright blue), Culicidae (green), Other Diptera (light blue), Coleoptera (dark red), Hemiptera (Dark blue),
Lepidoptera (brown), and OET (pink) = Odonata, Ephemeroptera and Trichoptera (dragonflies, mayflies and caddisflies). Site
name is followed by year monitored, YXX= Year following restoration. Ref =Reference site.

Pre-restoration Monitoring of Six Mile Slough
30 | P a g e
I N T E G R A T E D E C O L O G I C A L R E S E A R C H
Figure 8. Richness (total count of genus) for samples analyzed by traditional taxonomy at wetlands monitored in 2019 from Six
Mile Slough and 2015-18 in Meadow Creek and Slocan areas. Annelid (orange)= segmented worms), Arachnid (grey)= Aquatic
mites, BGA (yellow) = Bivalves, gastropods plus amphipods, Chironomidae (bright blue), Culicidae (green), Other Diptera (light
blue), Coleoptera (dark red), Hemiptera (Dark blue), Lepidoptera (brown), and OET (pink) = Odonata, Ephemeroptera and
Trichoptera (dragonflies, mayflies and caddisflies),. Site name is followed by year monitored, YXX= Year following restoration.
Ref =Reference site.
Pirate plots (R Development Core Team. 2018) were used to display the total counts and richness of
macroinvertebrates, graphically for a subset of reference sites including floodplain and lacustrine sites
used as the best benchmarks for Six Mile Slough (Kampstra 2008) at present (Figures 9 and 10).
Pirate Plots display 95% Highest Density Intervals (HDIs) of the mean of each group. HDIs indicate that
there is a 95% probability that the true population mean falls within that interval. In the pirate plots, 95%
HDIs are shown as solid bands around the sample mean.
Sites monitored at Six Mile Slough suggest that average values on macroinvertebrate abundance were
lower (sqrt(mean) of 31.9 and HDIs of 21.2-40.7) than at Lacustrine (sqrt(mean) of 31.9 and HDIs of 21.2-
40.7) and Floodplain wetlands (sqrt(mean) of 31.9 and HDIs of 21.2-40.7) but that this trend was non-
significant at a 95% probability.
However, the biodiversity of invertebrates at Six Mile Slough were higher than average values (sqrt(mean)
of 31.9 and HDIs of 21.2-40.7) at Lacustrine (sqrt(mean) of 31.9 and HDIs of 21.2-40.7) and Floodplain
wetlands (sqrt(mean) of 31.9 and HDIs of 21.2-40.7) again that this trend was non-significant at a 95%
probability.

Pre-restoration Monitoring of Six Mile Slough
31 | P a g e
I N T E G R A T E D E C O L O G I C A L R E S E A R C H
Figure 9.
Figure 10.
Figures 9 and 10. Pirate plots of total count (Figure 9) and total richness (Figure 10) for Floodplain and Lacustrine reference
wetlands relative to Six Mile Slough using BEST (Bayesian Estimation Supersedes the T-Test) with 95% Highest Density
Intervals (HDIs) of the mean of each group. White boxes indicate that there is a 95% probability that the true population
mean falls within that interval. Horizontal black lines indicate mean. (n= 16, 10, 6 and 4 for, Floodplain, Lacustrine and Six
Mile Slough, respectively). All data was transformed using a square root transformation (Zar 1984).
Pre-restoration Monitoring of Six Mile Slough
32 | P a g e
I N T E G R A T E D E C O L O G I C A L R E S E A R C H
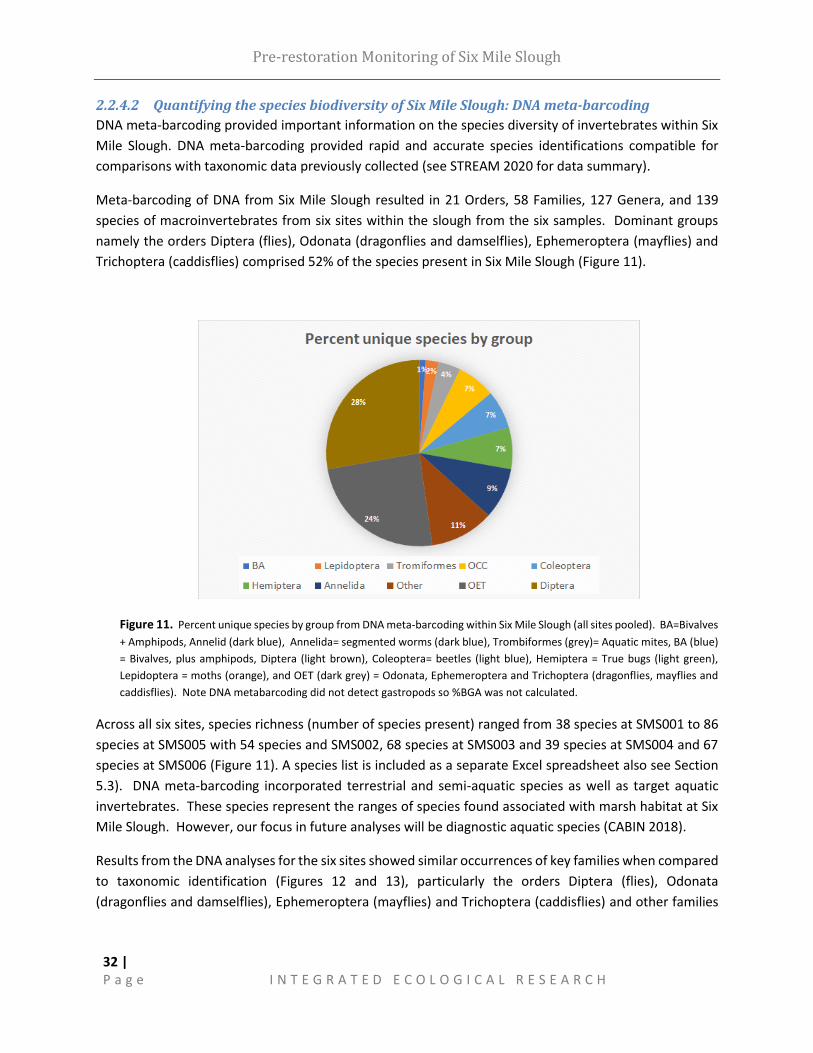
2.2.4.2 Quantifying the species biodiversity of Six Mile Slough: DNA meta-barcoding
DNA meta-barcoding provided important information on the species diversity of invertebrates within Six
Mile Slough. DNA meta-barcoding provided rapid and accurate species identifications compatible for
comparisons with taxonomic data previously collected (see STREAM 2020 for data summary).
Meta-barcoding of DNA from Six Mile Slough resulted in 21 Orders, 58 Families, 127 Genera, and 139
species of macroinvertebrates from six sites within the slough from the six samples. Dominant groups
namely the orders Diptera (flies), Odonata (dragonflies and damselflies), Ephemeroptera (mayflies) and
Trichoptera (caddisflies) comprised 52% of the species present in Six Mile Slough (Figure 11).
Figure 11. Percent unique species by group from DNA meta-barcoding within Six Mile Slough (all sites pooled). BA=Bivalves
+ Amphipods, Annelid (dark blue), Annelida= segmented worms (dark blue), Trombiformes (grey)= Aquatic mites, BA (blue)
= Bivalves, plus amphipods, Diptera (light brown), Coleoptera= beetles (light blue), Hemiptera = True bugs (light green),
Lepidoptera = moths (orange), and OET (dark grey) = Odonata, Ephemeroptera and Trichoptera (dragonflies, mayflies and
caddisflies). Note DNA metabarcoding did not detect gastropods so %BGA was not calculated.
Across all six sites, species richness (number of species present) ranged from 38 species at SMS001 to 86
species at SMS005 with 54 species and SMS002, 68 species at SMS003 and 39 species at SMS004 and 67
species at SMS006 (Figure 11). A species list is included as a separate Excel spreadsheet also see Section
5.3). DNA meta-barcoding incorporated terrestrial and semi-aquatic species as well as target aquatic
invertebrates. These species represent the ranges of species found associated with marsh habitat at Six
Mile Slough. However, our focus in future analyses will be diagnostic aquatic species (CABIN 2018).
Results from the DNA analyses for the six sites showed similar occurrences of key families when compared
to taxonomic identification (Figures 12 and 13), particularly the orders Diptera (flies), Odonata
(dragonflies and damselflies), Ephemeroptera (mayflies) and Trichoptera (caddisflies) and other families

Pre-restoration Monitoring of Six Mile Slough
33 | P a g e
I N T E G R A T E D E C O L O G I C A L R E S E A R C H
within the Class Insecta. The diversity of these groups and others are important because they provide a
food source for other wetland vertebrate species and act as biological indicators for wetland health and
productivity.
DNA meta-barcoding was also used to assess the occurrence of invasive species in Six Mile Slough. This
was particularly important with respect to reconnecting the slough to the Kootenay River. We found that
there were no occurrences of the aquatic invasive species, Mysis relicta (Mysid shrimp introduced to
Kootenay Lake in the 70s), Dreissena polymorpha (Zebra mussels), or Dreissena rostriformis bugensis
(Quagga mussels) in raw data output from Next Generation Sequencing. This result comes with the caveat
that results were based on the CABIN collection protocols, selected locations, wadable depths,
seasonality, and time of day sampled. For instance, the large deep pool (lake) in Compartment 3 near
SMS004 was not sampled and samples were collected during daylight hours.
Figure 12. Richness (count of genus) by family and site within Six Mile Slough for Class Insecta. Paired samples were
analyzed for DNA and traditional taxonomy (morphology), n=12 (6 paired samples x 2 methods). Facets identify cases where
both DNA and traditional taxonomy methods detected similar occurrences within a family and unique detections by method
(indicated by unique).

Pre-restoration Monitoring of Six Mile Slough
34 | P a g e
I N T E G R A T E D E C O L O G I C A L R E S E A R C H
Figure 13. Richness (count of genus) by family and site within Six Mile Slough for other groups including: Ostracods,
Cladocerans, Copepods, Bivalves, Gastropods, Amphipods and Arachnids. Paired samples were analyzed for DNA and
traditional taxonomy (morphology), n=12 (6 paired samples x 2 methods). Facets identify cases where both DNA and
traditional taxonomy methods detected similar occurrences within a family and unique detections by method (indicated by
unique).
2.2.4.3 Review of paired samples
We used DNA meta-barcoding in conjunction with traditional morphology as an effective monitoring
approach that will allow for future detection and changes in biodiversity due to the re-establishment of
the natural water regime within Six Mile Slough.
Paired samples were analyzed using traditional taxonomy based on morphology and DNA meta-barcoding
including 6 paired locations for the two analytical methods for a total of twelve samples. Morphological
methods use CABIN protocols (2014) and follow Level 2 Standard Taxonomic Effort (STE) for Pacific
Northwest Freshwater Macroinvertebrate Samples (2013) (also see Section 5.1.2 for Rhithron’s Technical
report) while analytical methods from DNA metabarcoding are reviewed in detail in the STREAM (2019)
companion report. We examined richness at the genus level grouped by family to compare the two
different taxonomic techniques and to evaluate how best to use both techniques in paired statistical
analyses as further data accumulates in future years.
In total, using both methods there were seventy-one unique families identified with occurrences of at
least one genus in Six Mile Slough. DNA meta-barcoding identified from 58 families and while morphology
identified 35 families.
Richness (count of genus) was calculated for family and site (Figures 12 and 13). There were 18 families
in the Class Insecta and 3 families in “Other groups” that were detected by both methods for at least one

Pre-restoration Monitoring of Six Mile Slough
35 | P a g e
I N T E G R A T E D E C O L O G I C A L R E S E A R C H
site within Six Mile Slough. In addition, there were 19 families in the Class Insecta and 17 families from
other groups that were detected by DNA meta-barcoding only. Finally, there were 8 families in the Class
Insecta and 5 families from other groups that were detected by only by morphology.
The families detected by both traditional taxonomy and DNA methods at 12 sites included the: (1) true
bugs, Velidae (broad-shouldered water striders), Nepidae (water scorpian), Dytiscidae, Gerridae, (2) flys,
Stratiomyidae (soldier fly), Limoniidae, Ceratopogonidae, Chironomidae (midge), (3) caddisflys,
Phryganeidae (giant casemakers), Hydroptilidae (micro-caddis), (4) dragonflys, Lebellulidae, Corduliidae,
Aeshnidae. (5) mayflys, Leptoceridae, Caenidae, Baetidae (6) beetles, Haliplidae (crawling water beetle).
Four non-insect families were identified by both DNA and morphology including the: sphaerid clam
(Sphaeriidae), aquatic mites (Limnesiidae, Arrenuridae) and amphipod (Hyallelidae).
Three insect families were only identified to family using morphology which typically occurs with small or
damaged individuals. These families were Notonectidae (backswimmer), Culicidae (mosquitoes), and
Ephrydidae (shorefly). However, Figures 11 and 12 only show instances where individuals within these
Families were identified to genus.
Other variance around the number of aquatic families identified either only by DNA or morphology were
likely due to natural differences between paired samples because of the low occurrence of the following
families: Tipulidae (craneflies), Scirtidae (marsh beetle), Sciomyzidae (marshfly), Polycentropodidae
(trumpet net caddisfly), Philopotimidae (fingernet caddis), Hydrometridae (marsh treader),
Coenagrionidae (narrow winged damsel), Mesovelidae (water treader), Hydrophilidae (water scavengers),
Hydrochidae, Hebridae (Velvet water bug) and Empididae (aquatic dance flies) (Figures 12 and 13).
Some taxa were not identified by morphology but were identified by DNA meta-barcoding because of
CABIN and STE protocols do not include terrestrial species. In Six Mile Slough, this included terrestrial
insects such as thrips (Phlaeothripidae), fungus gnat (Mycetophilidae), planthopper (Delphicidae), semi-
aquatic true weevil (Curculionidae), silken fungus beetle (Cryptophagidae), leaf hopper (Cicadellidae),
ground beetle (Carabidae), weevil (Brachyceridae), aphids (Aphidae), and semi-aquatic moth (Crambidae)
(Figure 12). It also included terrestrial arachnids including long-jawed orb weaver (Tetragnathidae), wolf
spider (Lycosidae), dwarf spider Linyphiidae (Figure 13).
Many non-insect groups identified by DNA were not identified to genus by morphology because of the
instructions by CABIN and Level 2 STE protocols for morphological-based taxonomy. This included (1)
springtails, Isotomidae (long-bodied springtail), Entomobryidae (slender springtails), (2) tardigrades,
Hypsibiidae (water bears), and (3) crustaceans, Eurycercidae (cladoceran), Diaptomidae (pelagic
copepod), Daphniidae (cladoceran), Cypridae (ostracod), Chydoridae (cladoceran), Bosminidae
(cladoceran) and (4) Chaetonidae (gastrotricha),and (5) Asplanchidae (rotifer).
There were also a number of groups that were identified using morphology but not by DNA meta-
barcoding including: (1) the gastropods, Valvatidae (valve snail), Planorbidae (ramshorn snails), and
Physidae (bladder snail), (2) aquatic mites (Unionicolidae, Pionidae, and Mideopsidae) and (3) jawless
Pre-restoration Monitoring of Six Mile Slough
36 | P a g e
I N T E G R A T E D E C O L O G I C A L R E S E A R C H
leeches (Glossiphonidae). This may be due to the lack of markers for these groups or the presence of
species of these families in the reference library. This may be due to the data quality filtering process,
which removes poor quality data/identifications to ensure a high 95-99% accuracy of identifications across
all taxonomic levels. Additionally, for these groups or the presence of species of these families, there may
not be any reference DNA in the reference libraries that are used to classify the sequences (pers. com
Chloe Robinson).
In addition, the genus Dero sp. was classified as Naididae using STE taxonomic methods in morphological
reporting but was reported as Tubificidae which is an older classification of the genus in DNA outputs.
Standard Taxonomic Effort was used to harmonize data for all analyses in the present report. There is
also error within both methods that may account for some differences. The family Lumbriculidae, small
aquatic worms, was identified by DNA methods but not by morphology and is a case that requires follow
up by taxonomists and genomic specialists to determine why this may occur.
Finally, when DNA meta-barcoding was reduced and subjected to Level 2 STE rules, then both methods
identified twenty-two families in common with morphology identifying seven unique families and DNA
metabarcoding identifying eight unique families. Families within the Class Insecta would be most
applicable for paired statistics using both traditional taxonomy and DNA-metabarcoding.
2.1 Conclusions and recommendations This study is the first project in BC to use both traditional taxonomy and DNA meta-barcoding of
macroinvertebrates to assess restoration and management actions using the CABIN for wetlands
protocols. This data will be used to effectively evaluate pre-restoration years (2019 and 2020) compared
to post-restoration trends (2021-).
We quantified the numerical abundance and diversity of taxa within the wetland. Traditional taxonomy
and DNA meta-barcoding together identified seventy-one unique macroinvertebrate families in Six Mile
Slough. Our analyses suggested that Six Mile Slough may be relatively high in the “kinds” of taxa relative
to other wetlands in the West Kootenays but may be lower in numerical abundance of these taxa. A likely
cause of this observation is the in-filling by Typha latifolia in Six Mile Slough, the high density of thick root
mats resulting in the lack of plant diversity. Typha has been shown to be associated with lower densities
and biomass of macroinvertebrates and reduced macroinvertebrate habitat quality (Lawrence et al 2016).
In addition, common dominants such as sedges (Carex sp.) have reduced seedling survival in stable wet
conditions such as observed in Six Mile Slough which favor vegetative propagation by Typha latifolia
(Bansal et al. 2019, Hall and Zedler 2010). Sedges comprised <1% of the composition of CABIN plots in Six
Mile Slough. The reduced numbers aquatic macroinvertebrates could have negative effects on higher
trophic-levels and important wildlife species that inhabit Six Mile Slough. Pre-restoration monitoring
(2019 and 2020) of the abundance and biodiversity of invertebrates will provide a basis for evaluation of
change due to restoration of the natural flooding regime in plant and macroinvertebrate communities
over time.

Pre-restoration Monitoring of Six Mile Slough
37 | P a g e
I N T E G R A T E D E C O L O G I C A L R E S E A R C H
DNA meta-barcoding provided a list of indicator aquatic organisms present at the species level within the
wetland but also a list of semi-aquatic and terrestrial species associated with the marsh. DNA meta-
barcoding also allowed us to make a preliminary assessment of aquatic invasive invertebrate species. We
found that there were no occurrences of the following aquatic invasive species, Mysis relicta (mysid
shrimp introduced to Kootenay Lake in the 70s), Dreissena polymorpha (Zebra mussels), or Dreissena
rostriformis bugensis (Quagga mussels). Paired samples using traditional taxonomy and DNA will help us
understand the patterns of biodiversity within Six Mile Slough, particularly as restoration actions proceed.
Currently, there is meager coverage of wetland invertebrate species in the Interior BC as well as across
Canada (pers. com. C. Copely). Filling gaps in knowledge on the occurrence of species from sensitive
freshwater wetland habitats is a high priority of both the Royal BC Museum and the STREAM project
because wetlands are at the forefront of ecological change with regards to climate warming. We
submitted voucher samples from traditional taxonomy and the results from DNA meta-barcoding to the
Royal BC Museum in Victoria, BC for their collection and records. Voucher samples were also inspected
in a tour of the Royal BC Museum in September 2019.
A key advantage to using the CABIN methods to assess wetland response to restoration is the inference
these indicators provide to wildlife populations and habitat which may be difficult to assess directly
because of appropriate scale and population movements. The composition and abundance of
macroinvertebrates integrates effects on aquatic biota over time and can capture evidence of multiple
disturbance events, termed the Integrative Ecological Condition (CABIN 2019).
The current monitoring complements pre-restoration amphibian and fisheries assessments carried out of
Six Mile Slough. For instance, water and sediment quality indicated non-significant metals contamination
and low impacts from anthropogenic activity at breeding locations for the Northern Leopard frog.
However, Typha latifolia appears to be limiting the abundance of macroinvertebrates within
Compartments 4 and 5 at sites near the breeding locations for Northern Leopard frogs as indicated by
surveys and mapping. At this threshold of infilling, invasive Typha may also restrict the extent of possible
breeding locations or reduce habitat for larval development, and movement (reviewed in Bansal et al.
2019). In addition, observational experience with previous drawdown and mechanical management in
Typha within breeding areas of Northern Leopard Frog at other locations within the CVWMA have
appeared to improve breeding success (pers. com. Marc-Andre Beaucher). The reconnection of
compartments 4 and 5 to the floodplain is not planned at this time to maintain remaining breeding and
rearing locations for Northern Leopard frog. These compartments will also serve as reference sites for
restoration work.
One of the goals of the project is to re-establish the natural hydrological regime and restore natural
floodplains which historically existed in the valley. It is expected that re-establishing the natural
hydrological regime should reduce dense stands of Typha over the long-term (Biebighauser and Annschild,
2016) and increase the diversity of plant species within Compartments 2 and 3. Increasing plant and

Pre-restoration Monitoring of Six Mile Slough
38 | P a g e
I N T E G R A T E D E C O L O G I C A L R E S E A R C H
structural heterogeneity within these compartments will likely increase macroinvertebrate abundance as
well as improve habitat for higher trophic levels over a long-term time scale (Bansal et al 2019).
Importantly, reconnection to the mainstem Kootenay River will improve key habitat that will benefit all
native fish species including sturgeon and burbot (SARA 2020, EKBSWG 2019). Long-term projections
suggest that the restored compartments (ponds 2 and 3) in Six Mile Slough will have higher nutrient levels,
warmer spring temperatures, and higher primary and secondary productivity than the mainstem river.
Increased off-channel habitat and the downstream effects of floodplain reconnection could address an
important bottleneck to the burbot population in the lower Kootenay River (pers com. Valerie Evans).
Restoration of Six Mile Slough could provide additional early food resources at this time of year to help
establish self-sustaining burbot populations.
Water quality monitoring in July 2019 demonstrated that nitrogen and phosphorus and dissolved organic
carbon concentrations were higher in Six Mile Slough than Kootenay River. The total nitrogen was 4.7
times higher in Six Mile Slough than in the Kootenay River when measured while the total phosphorus
was 4.0 times higher in Six Mile Slough than in the Kootenay River. In addition, dissolved organic carbon
was 3.6 times higher in Six Mile Slough than the Kootenay River. Water and sediment quality indicated
low impacts from metals contamination at all sites. We plan to track these parameters over at least three
years to assess restoration activities and improvements relative to these baseline conditions.
Reconnection of the floodplain to compartments 2 and 3 will result in wetland inundation at freshet by
oligotrophic riverine water from the mainstem Kootenay River. A hydrological assessment of the wetland
reconnection would help to assess the percent of riverine water potentially moving off-channel at
different peak flows. Intermediate water quality values will likely predominate during the freshet as water
from the river and wetland mix, particularly, on the rising limb to the peak of the hydrograph (Scott et al
2014). As the flows decline and the wetland becomes isolated form the river, reducing conditions should
eventually re-establish resulting in a return to mesotrophic conditions as total nitrogen, phosphorus, and
dissolved organic carbon are solubilized. This process is dependent on the restoration design details,
seasonal climate and the extent and timing of river-floodplain connectivity for varying peak flows.
We used existing provincial TEM methods to quantify 100 m buffer areas for the biomonitoring sites and
Northern Leopard frog breeding sites as wells as the entire wetland. Populations of Northern Leopard
frogs that breed within Six Mile Slough are likely affected by immigration and emigration to and from the
wetland on a larger scale than documented here. Mapping and monitoring of these migration corridors
are likely important to Northern Leopard frog populations in Six Mile Slough and recommended for future
work.
Reconnection of the Six Mile Slough to the Kootenay River will result in greater hydrological connectivity
between Six Mile Slough and the Kootenay River, particularly at peak flows. This could result in
downstream export of nutrients and carbon in dissolved and particulate forms (Scott et al. 2014). Planned

Pre-restoration Monitoring of Six Mile Slough
39 | P a g e
I N T E G R A T E D E C O L O G I C A L R E S E A R C H
hydrological monitoring would help the evaluation of the potential for delivery of particulates, nutrients,
and carbon to the Kootenay River if this information is prioritized under current funding.
• Understanding the percent of river water moving into and out of the wetland at various stage
levels based on reconnection design would be particularly useful both at peak and low flow. For
instance, nutrient (Scott et al. 2014) or carbon concentrations may be solubilized if there is
seasonal isolation between riverine and wetland habitats that promotes reducing conditions
within the wetland while delivery mechanisms to Kootenay River would occur at peak flows.
• Calculation of nutrient loadings within Kootenay River at key locations may also aid this evaluation
if this is a project priority.
If it is a priority to understand the ecological implications and transport dynamics of nutrients, carbon and
particulates following restoration of lentic floodplain habitat such as Six Mile Slough to the Kootenay River
then the following are recommended for evaluating downstream effects.
• Further work and planning regarding the downstream effects of reconnection of Six Mile Slough
to the Kootenay River could involve greater water quality sampling and downstream evaluation
of nutrient spiralling during peak flows and trophic-level status throughout the growing season.
• Work up of Environment Canada time-series data from Kootenay River at Creston would also be
useful as well as downstream monitoring.
• Further review of nutrient levels and trophic-level comparisons to the South Arm of Kootenay
Lake nutrient monitoring station may provide further inference.
• It might be wise to also consider how the large pool or small lake near the potential site of
reconnection (near site SMS004, Figure 1 and 2) may act as a settling pond for sediments
entrained in floodwaters, thus, potentially counteracting particulate and nutrient delivery to the
Kootenay River at peak flow.
Pre- and post- restoration monitoring of large-scale restoration projects is important to inform
management actions using an iterative “adaptive management process” (Stelk et al 2017). It is crucial
to continue monitoring the same specific variables over time to evaluate trend and ecological
response to management actions. The indicators established in the current report will inform the
process of adaptive management over time so that the Creston Valley Wetland Management area can
make small iterative adjustments and carry out effective restoration and long-term management of
these globally important wetlands.
3 Acknowledgements With respect to the present report, Darcie Quamme of Integrated Ecological Research conducted field
work, statistical analyses, reporting and presentations. Rhia MacKenzie carried out field work, and data
analysis. Ryan Durand carried out plant identifications and provided GIS site evaluations and disturbance
indicators. Irene Manley and Eva Schindler of Forest, Lands and Natural Resource Operations and Rural
Pre-restoration Monitoring of Six Mile Slough
40 | P a g e
I N T E G R A T E D E C O L O G I C A L R E S E A R C H
Development acted as the contract monitors. Thank you also to Katherine McGlynn for providing
background data and FLNRO reports on restoration sites and mapping. Thank you to Irene Manley, Barb
Houston and Amy Waterhouse for the valuable background, ideas, maps, and GPS locations. Thank you
to Marc-André Beaucher for the opportunity to collaborate, the June tour and July site selection and field
help.
Also, thank you to Living Lakes, WWF and the Hajibabaei Lab, Center for Genomic Biodiversity at the
University of Guelph for all the logistics and DNA laboratory support. Thank you to Chloe Robinson from
the Hajibabaei Lab for producing the DNA data report. Thanks also to Catherine Paquette, WWF, and Kyle
Prince, Raegan Mallinson and Kat Hardwig from Living Lakes for coordination of funding for DNA meta-
bar coding and shipping.
We appreciate long-term support from 2014-2018 for reference sites by the Fish and Wildlife
Compensation Program, BC Ministry of Forests, Lands, Natural Resource Operations and Rural
Development, BC Wildlife Federation, Columbia Basin Trust, Selkirk College, Regional District of Central
Kootenay, Environment Canada’s Canadian Aquatic Biomonitoring Network and Canadian Wildlife Service
National Wetland Conservation Fund, the Columbia Basin Watershed Network, the Ministry of
Environment, the Columbia Power Corporation and the Royal BC Museum, Valhalla Wilderness Society,
Slocan Lake Society, Slocan Solutions, and Slocan River Streamkeepers. We kindly thank private
landowner participation from 2014-2018 to establish reference sites for comparison to current work.
4 References Adama, D., V.C. Hawkes, M.T. Miller, and J. Sharkey. 2013. CLBMON-61 Kinbasket Reservoir Wetlands
Monitoring Program. Annual Report – 2012. LGL Project EA3398. Unpublished report by LGL Limited
environmental research associates, Sidney, BC for BC Hydro Generations, Water License Requirements,
Burnaby, BC.
Apfelbeck, R. 2000. Development of biocriteria for wetlands in Montana. Prep. for Montana
Department of Environmental Quality, Helena, Montana.
Archer, R.W., Christopher, P., Lorenz, J. and Jones, K.E. 2010. Monitoring and assessing marsh habitat
health in the Niagara River area of concern. Prep. for Environment Canada-Great Lakes Sustainability
Fund.
Bailey RC, Norris RH, and Reynoldson TB. (2004) Bioassessment of freshwater ecosystems: using the
Reference Condition Approach. Springer.
Bailey, J.L. and Reynoldson, T.B. 2009. Preliminary wetland aquatic biomonitoring data collection
manual. Commissioned for: Canadian Wildlife Service (Yukon).
Pre-restoration Monitoring of Six Mile Slough
41 | P a g e
I N T E G R A T E D E C O L O G I C A L R E S E A R C H
Bansal, S., Lishawa, S.C., Newman, S. et al. 2019. Typha (Cattail) Invasion in North American Wetlands:
Biology, Regional Problems, Impacts, Ecosystem Services, and Management. Wetlands 39, 645–684.
Bassett, M. Schindler,E.U.,D. L. Vidmanic, T. Weir,and K.I.Ashley. 2018. Kootenay Lake Nutrient
Restoration Program: North and South Arm. 2018. Fisheries Project Report No. RD152. Resource
Management Ministry of Forests, Lands and Natural Resource Operations, Province of British Columbia,
Vancouver, British Columbia, Canada.
Bayley, SE, Wilson, MJ, Rooney RC, and Bolding MT, 2014. Assessment Methods for Reclamation of
Permanent Marshes in the Oil Sands: Handbook and Video. Prepared by The Bayley Lab, Department of
Biological Sciences, University of Alberta, Edmonton, Alberta.
BCWF (BC Wildlife Federation Association). 2019. Extension note re: floristic quality.
Bellamy, C., C. Scott, and J. Altringham. 2013. Multiscale, presence-only habitat suitability models: fine-
resolution maps for eight bat species. Journal of Applied Ecology, 2013,50,892–901. pdf
Bellamy, C., A. Torsney, E. Brown, A. Glover and J. Altringham. 2012. Bat foraging habitat suitability maps
for the Yorkshire Dales, National Park School of Biology, Faculty of Biological Sciences, University of
Leeds. Pdf
Biebighauser, T. R. and R. Annschild. 2016. Six Mile Slough Wetland Restoration Project. Prepared for
the Creston Valley Wildlife Management Area.
Biebighauser, T. R. 2011. Wetland Restoration and Construction, A Technical Guide.
Bray, J. R. and J. T. Curtis. 1957. An ordination of upland forest communities of southern Wisconsin.
Ecological Monographs 27: 325-349.
Cavanagh, N., R.N.Nordin, L.W.Pommen and L.G. Swain. 1997. Guidelines for designing and
implementing a water quality monitoring program in British Columbia. Resources Inventory Committee,
British Columbia Ministry of Environment, Lands and Parks.
Clark, M.J.R. (editor). 2013. British Columbia Field Sampling Manual. Water, Air and Climate Change
Branch, Ministry of Water, Land and Air Protection, Victoria, BC, Canada.
Creston and District Historical and Museum Society. 2003. Taming the Kootenay, Creston, British
Columbia, 2003: The Legacy. [Virtual Museum]. Accessed March 2, 2020.
De Szalay, F. A. and Resh, V. H. 2000. Factors influencing macroinvertebrate colonization of seasonal
wetlands: responses to emergent plant cover. Freshwater Biology 45(3): 295–308.
Duncan, J. and L. Duncan. 2012. Operating Procedures: Columbia Basin Water Quality Monitoring
Project. Prep. for Columbia Basin Trust.

Pre-restoration Monitoring of Six Mile Slough
42 | P a g e
I N T E G R A T E D E C O L O G I C A L R E S E A R C H
Durand, R. 2014a. Slocan Valley Sensitive Ecosystem Mapping. Prep. for: Slocan River Streamkeepers. Durand, R. 2014b. SWAMP Phase I: Slocan Wetlands Assessment and Monitoring Project. Prep. for:
Slocan Solutions Society, Slocan Lake Stewardship Society, BC Wildlife Federation and Slocan River
Streamkeepers.
Durand, R. 2015. SWAMP Phase II: Slocan Wetlands Assessment and Monitoring Project. Prep. for:
Slocan Solutions Society, Slocan Lake Stewardship Society, BC Wildlife Federation and Slocan River
Streamkeepers.
Durand, R. 2016. SWAMP Phase III: Slocan Wetlands Assessment and Monitoring Project. Prep. for:
Slocan Solutions Society, Slocan Lake Stewardship Society, BC Wildlife Federation and Slocan River
Streamkeepers.
EKBSWG (East Kootenay Burbot Scientific Working Group). 2019. Upper Kootenay River Burbot
Conservation Strategy. Prepared by Westslope Fisheries Ltd., Cranbrook, B.C. 61 pp. Prepared for Fish
and Wildlife Compensation Program (Project Number: UKE-F19-F-2734), the Ministry of Forests, Lands,
Natural Resource Operations and Rural Development, and the Ktunaxa Nation Council.
Eaton, B. 2005. Report on tests of aquatic sampling protocols, Alberta Biodiversity Monitoring Program.
Prep. for Alberta Research Council.
Environment Canada. April 2018. CABIN Wetland Macroinvertebrate Protocol. Armellin, A. D. Baird, C.
Curry, N. Glozier, A. Martens, E. McIvor. Ver. 1.0. pdf
Environment Canada. April 2012. CABIN Laboratory Methods: Processing, taxonomy, and quality control
of benthic macroinvertebrates. H. McDermott, T. Paul and S. Strachen.
Environment Canada. April 2007. CABIN Field Manual for Streams. Reynoldson, T. B., C. Logan, T. Pascoe,
S. Thompson, S. Sylvestre, C. Mackinlay, and H. McDermott.
Fish and Wildlife Compensation Program. 2012. Columbia Basin Riparian and Wetlands Action Plan
(Draft). B.C. Hydro, Vancouver, B.C. pdf.
Fletcher, N.F., Tripp, D.B., Hansen, P.L., Nordin, L.J., Porter, M., and Morgan, D. 2019. Field Supplement
to the Wetland Health Management Routine Effectiveness Evaluation. Forest and Range Evaluation
Program, B.C. Ministry of Forests, Lands, Natural Resources Operations and Rural Development, Victoria,
B.C.
Hall SJ, and Zedler, JB. 2010 Constraints on sedge meadow self-restoration in urban wetlands.
Restoration Ecology 18:671–680.
Herlihy, A.T., Sifneos, J.C., Lomnicky, G.A. et al. The response of wetland quality indicators to human
disturbance indicators across the United States. Environ Monit Assess 191, 296 (2019). pdf
Pre-restoration Monitoring of Six Mile Slough
43 | P a g e
I N T E G R A T E D E C O L O G I C A L R E S E A R C H
Hoyle, G.M., C. Holderman, C., P. Anders, B. Shafii, and K.I.Ashley. 2013. Water quality, chlorophyll, and
periphyton responses to nutrient addition in the Kootenai River, Idaho. Freshwater Science 33(4):1024–
1029.
Jepson, S., C. Mazzacano, S.H. Hoffman Black. 2007. Final Report to the Environmental Protection
Agency (EPA), Region 10. Pacific Northwest Wetland Macroinvertebrate Monitoring Protocols and
Variability in Freshwater Riverine Impounding Wetlands. Prep. for the US EPA, Region 10, Seattle
Washington.
Kampstra, P. 2008. Beanplot: A Boxplot Alternative for Visual Comparison of Distributions. Journal of
Statistical Software, Code Snippets, 28(1), 1-9. [URL]
Koerselman, W and A.F.M. Meuleman. 1996. The Vegetation N:P Ratio: a New Tool to Detect the Nature
of Nutrient Limitation. Journal of Applied Ecology. 33(6). 1441-1450.
Kovalenko KE, Brady VJ, Ciborowski JJH, Ilyushkin S, Johnson LB. 2014. Functional Changes in Littoral
Macroinvertebrate Communities in Response to Watershed-Level Anthropogenic Stress. PLoS ONE 9(7):
e101499. pdf.
Kruschke, J. K. 2013. Bayesian estimation supersedes the t test. Journal of Experimental Psychology: General 142(2):573-603. doi: 10.1037/a0029146 Lawrence, B.A., K. Bourkea, S. Lishawaa, N. C. Tuchman. 2016. Typha invasion associated with reduced aquatic macroinvertebrate abundance in northern Lake Huron coastal wetlands, J. Great Lakes Res. pdf. Marvin-DiPasquale, Mark, Alpers, Charles N., and Fleck, Jacob A., 2009, Mercury, methylmercury, and other constituents in sediment and water from seasonal and permanent wetlands in the Cache Creek Settling Basin and Yolo Bypass, Yolo County, California, 2005−06: U.S. Geological Survey, Open File Report 2009-1182. Mazzacano, C., 2011. D. Paulson, and J. Abbott. Backyard Ponds: Guidelines for Creating and Managing Habitat for Dragonflies and Damselflies. 22 pp. Portland, OR. Migratory Dragonfly Partnership. pdf. Mazzacano, Celeste. 2011. Developing a framework for the Oregon Wetland Monitoring and
Assessment Program: Developing an invertebrate-based monitoring tool to assess the biological
integrity of Pacific Northwest Freshwater Wetlands. Prep. for Oregon Watershed Enhancement Board.
by Xerces Society.
MacKenzie, W. and J. Moran. 2004. Wetlands of British Columbia; A guide to identification. BC Ministry
of Forests. Land Management Handbook No. 52.
McGlynn, K. 2018. Post-monitoring of constructed wetlands at Lardeau-Duncan Conservation Complex
and the Creston Valley Wildlife Management Area 2017. FLNRORD, Fish and Wildlife Compensation
Program. Nelson, BC.

Pre-restoration Monitoring of Six Mile Slough
44 | P a g e
I N T E G R A T E D E C O L O G I C A L R E S E A R C H
Miller, M.T. and V.C. Hawkes. 2013. CLBMON-11B4 Monitoring Wetland and Riparian Habitat in
Revelstoke Reach in Response to Wildlife Physical Works. Annual Report – 2012. LGL Report EA3413.
Unpublished report by Okanagan Nation Alliance and LGL Limited environmental research associates,
Sidney, BC, for BC Hydro Generation, Water Licence Requirements, Burnaby, BC.
Ministry of Environment, BC. 2008. Interim Hygiene Protocols for Amphibian field staff and researchers.
Pdf.
Ministry of Environment, BC. 2020. Species and ecosystems explorer Results for Acipenser
transmontanus pop. 1 (White Sturgeon (Upper Kootenay River Population)). Accessed March 3, 2020.
Nahlik, A.M, K. A. Blocksom, A.T. Herlihy, M.E. Kentula, T.K. Magee, S.G. Paulsen. 2019. Use of national-
scale data to examine human-mediated additions of heavy metals to wetland soils of the US. Environ
Monit Assess (2019) 191(Suppl 1): 336.
Patenaude, T., A. C. Smith and L. Fahrig. 2016. Disentangling the effects of wetland cover and urban
development on quality of remaining wetlands. Urban Ecosyst (2015) 18:663–684. pdf.
Province of BC. 2016. (MacKillop, D.J. and A.J. Ehman). A field guide to site classification and
identification for southeast British Columbia: the south-central Columbia Mountains. Prov. B.C., Victoria,
B.C. Land Manag. Handb. 70.
Province of British Columbia. 2010. Field manual for describing terrestrial ecosystems. 2nd ed. B.C. Min.
For. Range and B.C. Min. of Environ., Victoria, B.C. Land Manag. Handb. 25.
Quamme, D.L. 2015. Protocol for 2016 field sampling of wetland macroinvertebrates. Prep. for Slocan Valley Wetland Assessment and Mapping Project, Slocan River Streamkeepers, Passmore, B.C., Slocan Solutions Society and Slocan Lake Stewardship Society, New Denver, B.C.
Quamme, D. L. 2018a. Wildlife Tree Creation: Incorporating attributes for bats with Todd Manning, SRS
Avimetrics. [Powerpoint]. pdf
Quamme, D.L. 2018. Mosquito monitoring at Crooked Horn Farm. [Poster]. pdf.
Quamme, D.L., C. Lausen and E. McCleod. 2018. Quantifying and enhancing the pest-control services
provided by bats to the timber industry. Prep. for the Habitat Conservation Trust and the Forest
Enhancement Society. pdf
Quamme, D.L., R. MacKenzie, G. Lamoureux, R. Johnson, and R. Durand. 2018. Assessing and enhancing
wetland species in the West Kootenays. Prep for the Fish and Wildlife Compensation Program. [EcoCat
link].
Quamme, D.L., R. MacKenzie, R. Johnson, R. Durand and T. Ehlers. 2016. Development of a Multimetric
Index Biotic Integrity for wetland invertebrates. 2016. Prep. for the Fish and Wildlife Compensation
Program. [EcoCat link ].

Pre-restoration Monitoring of Six Mile Slough
45 | P a g e
I N T E G R A T E D E C O L O G I C A L R E S E A R C H
Resource Inventory Standards Committee (RISC). 2006. Standard for Mapping Ecosystems at Risk in British Columbia; An Approach to Mapping Ecosystems at Risk and Other Sensitive Ecosystems. Prepared by BC Ministry of Environment Ecosystems Branch for the Resources Information Standards Committee. [EcoCat link ] Rooney, R. C., S. E. Bayley, I. F. Creed, and M. J. Wilson. 2012. The accuracy of land-cover based wetland assessments is influenced by landscape extent. Landscape Ecology. 27: 1321-1335. Ruhí ,A., G. Winfield Fairchild , Douglas J. Spieles , Gustavo BecerraJurado , and David Moreno-Mateos/ 2016. Invertebrates in Created and Restored Wetlands. In. D. Batzer, D. Boix (eds.), Invertebrates in Freshwater Wetlands, Springer International Publishing Switzerland 2016. Schaller, J., J. Schoelynck, · E. Struyf, P. Meire. 2014. Silicon Affects Nutrient Content and Ratios Of Wetland Plants. Geochimica et Cosmochimica Acta 142, 132-148. SARA 2014. Species at Risk Public Registry. Recovery Strategy for White Sturgeon (Acipenser transmontanus) in Canada. [Accessed June 25, 2020] pdf. Scott, D.T., R.F. Keim, B.L. Edwards, C.N. Jones, D.E. Kroes. 2014. Floodplain biogeochemical processing of floodwaters in the Atchafalaya river Basin during the Mississippi River flood of 2011. J. of Geophysical Research: Biogeosciences. 119, p. 537-537. Schindler, E.U., D. Sebastian, H. Andrusak, L. Vidmanic, G.F. Andrusak, M. Bassett, T. Weir,and K.I.Ashley. 2011. Kootenay Lake Nutrient Restoration Program, year 17 (North Arm) and year 5 (SouthArm) report. Fisheries Project Report No. RD131. Resource Management Ministry of Forests, Lands and Natural Resource Operations, Province of British Columbia, Vancouver, British Columbia, Canada. Standard Taxonomic Effort (STE) for Pacific Northwest Freshwater Macroinvertebrate Samples. 2013. Accessed May 22, 2020. [Website] Statistical Consulting Services. 2017. Floodplain water quality and water chemistry sampling protocol for Nimz Ranch Property. Kootenai River Ops Mitigation and Evaluation (KROME), BPA-57 (200201100) in coordination with Reconnect Project (200200800). Stelk, M.J., Christie, J., Weber, R., Lewis, R.R.III, Zedler, J., Micacchion, M., and Merritt, J. (2017). Wetland Restoration: Contemporary Issues and Lessons Learned. Association of State Wetland Managers, Windham, Maine. Stribling, J. B., S.R Moulton II and G.T. Lester. 2003. Determining the quality of taxonomic data. J.N. Am.
Benthol. Soc. 22(4): 621-631.
Society of Wetland Scientists. 2009. Current practices in wetland management for mosquito control. SWS Wetland Concerns Committee. [Accessed 2020-06-05] pdf. Swain, L. G. 2007. Water Quality Assessment of the Kootenay River at Creston (1979-2005). B.C. Ministry of Environment and Environment Canada, Victoria. pdf

Pre-restoration Monitoring of Six Mile Slough
46 | P a g e
I N T E G R A T E D E C O L O G I C A L R E S E A R C H
Swenson, H. A. and H.L Baldwin. 1965. A primer on water quality; 1965; USGS Unnumbered Series. pdf
STREAM. 2019. STREAM (Sequencing the Rivers for Environmental Assessment and Monitoring):
Preliminary DNA Data: Columbia Basin Wetlands, BC, December 2019. Prep. By: Hajibabaei Lab, Centre
for Biodiversity Genomics, University of Guelph, in collaboration with WWF Canada, Environment and
Climate Change Canada.
Thompson, William H. and Paul L. Hansen. 2003. Classification and management of riparian and wetland sites of Alberta’s Parkland Natural Region and Dry Mixed wood Natural Subregion. Bitterroot Restoration, Inc. Prepared for the Alberta Riparian Habitat Management Program-Cows and Fish, Lethbridge, Alberta, Canada. 340 p. pdf
R Development Core Team. 2018. R: A language and environment for statistical computing. R
Foundation for Statistical Computing, Vienna, Austria. ISBN 3-900051-07-0, UR. [Website].
Tall, L., A. Armellin, B. Pinel-Alloul, G. Méthot, and C. Hudon. 2015. Effects of hydrological regime,
landscape features, and environment on macroinvertebrates in St. Lawrence River wetlands.
Hydrobiologia. 778: 221-241.
Tall, L., G. Méthot, A. Armellin and B. Pinel-Alloul. 2008. Bioassessment of Benthic Macroinvertebrates in
Wetland Habitats of Lake Saint-Pierre (St. Lawrence River) (St. Lawrence River). J. Great Lakes Res. 34:
599-614.
U.S. EPA. 2002. Methods for Evaluating Wetland Condition: Developing Metrics and Indexes of Biological
Integrity. Office of Water, U.S. Environmental Protection Agency, Washington, DC. EPA-822-R-02-016.
U.S. EPA. 2016. National Wetland Condition Assessment 2011, A Collaborative Survey of the Nation’s
Wetlands. Office of Water, U.S. Environmental Protection Agency, Washington, DC EPA-843-R-15-005.
U.S. EPA. 2002. Methods for Evaluating Wetland Condition: Developing Metrics and Indexes of Biological
Integrity. Office of Water, U.S. Environmental Protection Agency, Washington, DC., EPA-822-R-02-016.
Uzarski, D. G., V. J. Brady, M. J. Cooper, D. A., Wilcox, D. A. Albert, R. P. Axler, P. Bostwick, T. N. Brown, J.
J. H. Ciborowski, N. P. Danz, J. P. Gathman, T. M. Gehring, G. P. Grabas, A. Garwood, R. W. Howe, L. B.
Johnson, G. A. Lamberti, A. H. Moerke, B. A. Murry, G. J. Niemi, C. J. Norment, C. R. Ruetz III, A. D.
Steinman, D. C. Tozer, R. Wheeler, T. K. O’Donnell and J. P. Schneider. 2017. Standardized Measures of
Uzarski, D. G., V. J. Brady, and J.P. Schneider. 2017. Coastal Wetland Condition: Implementation at a
Laurentian Great Lakes Basin-Wide Scale. Wetlands 37:15–32.
Wetzel, R.G. 2001. Limnology. 3rd Ed, Academic Press, San Diego.
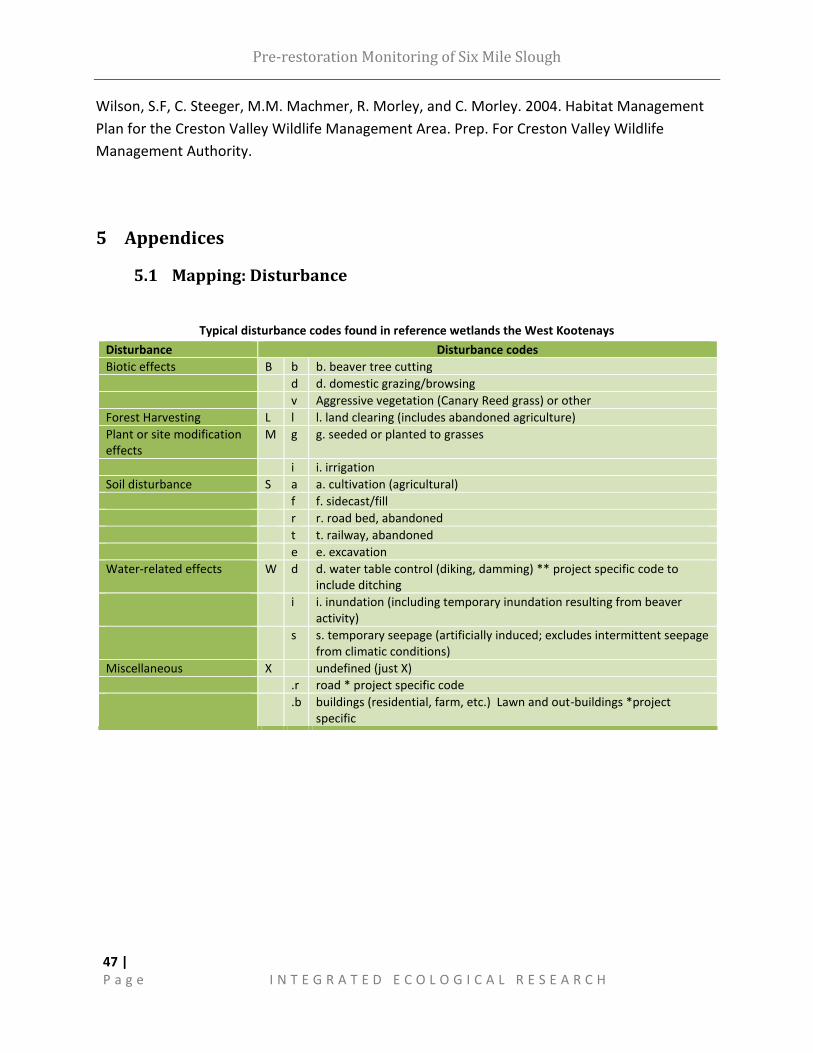
Pre-restoration Monitoring of Six Mile Slough
47 | P a g e
I N T E G R A T E D E C O L O G I C A L R E S E A R C H
Wilson, S.F, C. Steeger, M.M. Machmer, R. Morley, and C. Morley. 2004. Habitat Management
Plan for the Creston Valley Wildlife Management Area. Prep. For Creston Valley Wildlife
Management Authority.
5 Appendices
5.1 Mapping: Disturbance
Typical disturbance codes found in reference wetlands the West Kootenays
Disturbance Disturbance codes
Biotic effects B b b. beaver tree cutting
d d. domestic grazing/browsing
v Aggressive vegetation (Canary Reed grass) or other
Forest Harvesting L l l. land clearing (includes abandoned agriculture)
Plant or site modification effects
M g g. seeded or planted to grasses
i i. irrigation
Soil disturbance S a a. cultivation (agricultural)
f f. sidecast/fill
r r. road bed, abandoned
t t. railway, abandoned
e e. excavation
Water-related effects W d d. water table control (diking, damming) ** project specific code to include ditching
i i. inundation (including temporary inundation resulting from beaver activity)
s s. temporary seepage (artificially induced; excludes intermittent seepage from climatic conditions)
Miscellaneous X undefined (just X)
.r road * project specific code
.b buildings (residential, farm, etc.) Lawn and out-buildings *project specific

Wetland Invertebrate Assessment Tool
48 | P a g e
I N T E G R A T E D E C O L O G I C A L R E S E A R C H
5.2 Physiochemistry
5.2.1 Water quality guidelines for BC and the Canadian Council of Ministers
Analyte Units BC WQG Max A Life
BC WQG 30-day
BC WQG Wildlife
BC Drinking WQG Max
WQ CCME Short term
WQ CCME Long term
Chloride mg/L 600 150 600 250 640 120
Nitrate as N mg/L 32.8 3 100 10 550 13
Nitrite as N mg/L 0.06 when Cl-≤ 2, 0.12 when Cl- 2- 4,
0.6 when Cl->10
0.02 when Cl- ≤ 2, 0.04 when Cl- 2- 4,
0.2 when Cl->10
10 1 60
Sulfate mg/L 100 1 Sulfate calc1
500
Alkalinity, Total as CaCO3
mg/L
<10 when Ca2+<4, 10-20 when Ca2+
4-8, >20 when Ca2+ >82
Ammonia-N mg/L 3.62 - 23.8 temp & pH
None 3.62-23.8
temp & pH pH pH
units 6.5-9.0
Nitrate+Nitrite mg/L
10
Aluminum, total (diss)
mg/L 0.1
5 (total)
0.2 0.005 if pH <6.5, 0.1 if pH>6.5
Antimony mg/L 0.009 (Sb III only)1
Arsenic, total mg/L
0.005 0.0252 0.025 0.005
Barium, total mg/L
1
Beryllium, total mg/L
0.13
Boron, total mg/L
1.2 5 5 29 1.5
Cadmium, total mg/L Cd calc2 Cd calc3
0.001 0.00009
Chromium, total mg/L
0.009 (III), 0.001 (VI)
Cobalt, total mg/L 0.11 0.004
Copper, total mg/L Cu Calc4 ≤2 hardness ≤ 50
Cu Calc5
if Hardness ≥ 50
300
Cu Calc6
Iron, total mg/L 1
0.3
1Sulphate 128mg/L if hardness(0-30), 218 if hardness=(31-75), 309 if hardness=(76-180), 49 if hardness=(181-250) 2WQG Cd(mg/L) = e[1.03 × ln(hardness**) – 5.274]/1000, short-term max 3WQG Cd(mg/L)= e[0.736 × ln(hardness*) – 4.943]/1000, long-term average 4WQG Cu (mg/L)≤ (0.094 hardness(mg/L) + 2)/1000 5WQG Cu (mg/L) ≤ 0.04 (mean hardness)/1000 6When the water hardness is 0 to < 82 mg/L, the WQG is 0.002 mg/L, At hardness ≥82 to ≤180 mg/L, WQG (mg/L) =( 0.2 * e{0.8545[ln(hardness)]-
1.465})/1000, At hardness >180 mg/L, the WQG is 0.004 mg/L

Pre-restoration Monitoring of Six Mile Slough
49 | P a g e
I N T E G R A T E D E C O L O G I C A L R E S E A R C H
Water quality guidelines for British Columbia, BC, and the Canadian Council of Ministers (CCME) continued
Analyte Units BC WQG Max Aquatic Life
BC WQG 30-day
BC WQG Wildlife
BC Drinking WQG Max
WQ CCME Short term
WQ CCME Long term
Lead, total mg/L Pb Calc7 ≤2Hardness ≤ 50 Pb Calc8 If Hardness ≥ 50
Pb Calc9
Manganese, total mg/L Mn Calc10 Mn Calc11 Mncalc12 Mncalc13
Molybdenum, total
mg/L 2 <1 0.05 0.73
Nickel, total mg/L
0.025 Hardness 0-60mg/L 0.110 >60 ≤180mg/L 0.150 >180mg/L
Ni Calc12
Phosphorus, total mg/L
0.015 for lakes
Potassium, total mg/L
Selenium, total mg/L 0.001 (alert) 0.002
0.002 (water), 0.006 (bird egg)
0.01
Silver, total mg/L 0.0001Hardness
≤100mg/L 0.003>100mg/L
0.0015 Hardness ≤100mg/L 0.005Hardness>100mg/L
Thallium, total mg/L
0.008 13
0.0008
Uranium, total mg/L
0.033 0.015
Zinc, total mg/L 0.0075 Hardness ≤90mg/L Zncalc>90mg/L15
0.033 Hardness ≤90mg/L Zncalc>90mg/L16
Zncalc17 Zncalc18
7WQG Pb (mg/L) ≤ e[1.273 ln (hardness*) -1.460]/1000
8WQG Pb (mg/L) ≤≤ 3.31 + e[1.273 ln (hardness*) - 4.704]/1000
9When hardness is 0 to ≤ 60 mg/L, the WQG is 0.001 mg/L, At hardness >60 to ≤ 180 mg/L WQG (mg/L)= (e{1.273[ln(hardness)]-4.705})/1000, At hardness >180 mg/L, the CWQG is 0.007 mg/L 10Mn Calc (mg/L) ≤ 0.01102* hardness+ 0.54/1000
11Mn Calc(mg/L)≤ 0.0044* hardness + 0.605/1000
12Mn Calc (ug/L)= exp(0.878[ln(hardness)] + 4.76) where the benchmark is expressed in dissolved manganese concentration (go/L), and hardness is measured as CaCO3 equivalents in mg/L. 13The CWQG for manganese (i.e. long-term guideline) is found using the CWQG calculator in Appendix B of the Scientific Criteria Document for the Development of the Canadian Water Quality Guidelines for the Protection of Aquatic Life: Manganese.
14When the water hardness is 0 to ≤ 60 mg/L, the WQG is 0.025 mg/L , At hardness > 60 to ≤ 180 mg/L WQG Ni (mg/L)=(e{0.76[ln(hardness)]+1.06})/1000 At hardness >180 mg/L, the WQG is 0.150 mg/L 15WQG Zn (mg/L) ≤33 + 0.75(hardness - 90)/1000
16WQG Zn (mg/L)≤ 7.5 + 0.75 (hardness - 90))/1000
17Zncalc (ug/L) =exp(0.833[ln(hardness mg/L)] + 0.240[ln(DOC mg/L)] + 0.526). For 50 mg CaCO3/L hardness and 0.5 mg/L dissolved organic carbon (DOC). Valid between hardness 13.8 and 250.5 mg CaCO3/L and DOC 0.3 and 17.3 mg/L. 18Zncalc (ug/L) = exp(0.947[ln(hardness mg/L)] - 0.815[pH] + 0.398[ln(DOC mg/L)] + 4.625). For 50 mg CaCO3/L hardness, pH of 7.5 and 0.5 mg/L DOC. Valid between hardness 23.4 and 399 mg CaCO3/L, pH 6.5 and 8.13 and DOC 0.3 to 22.9 mg/L.
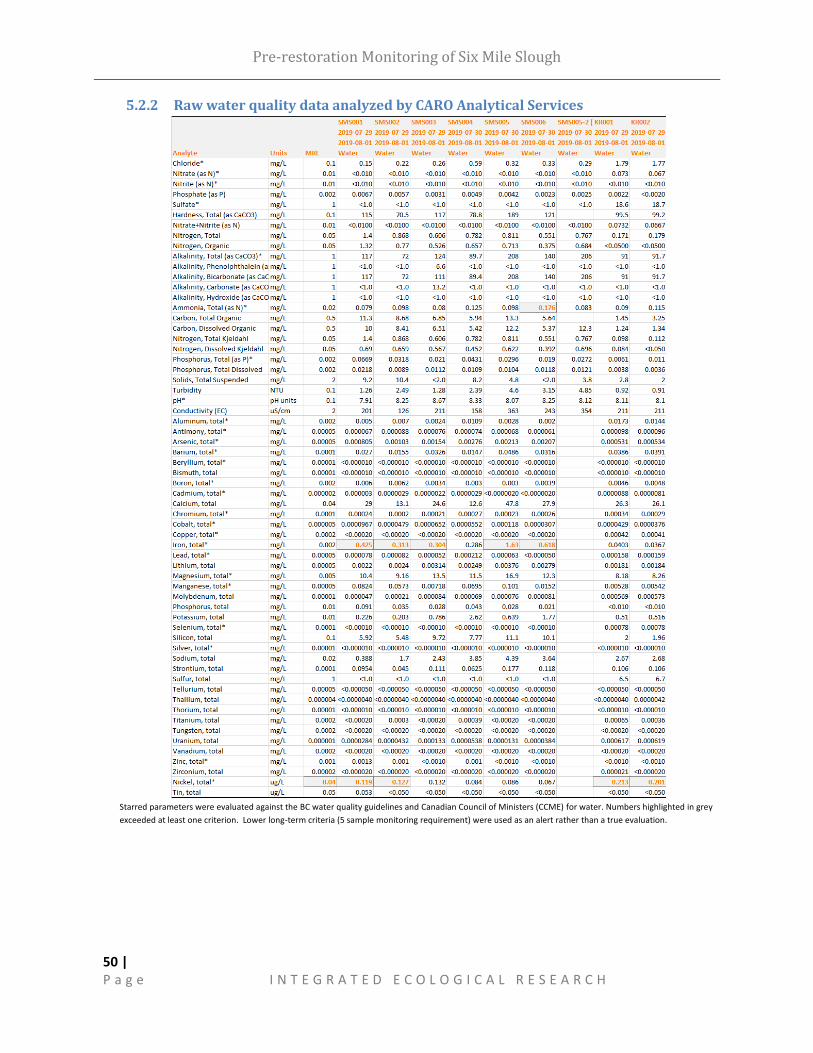
Pre-restoration Monitoring of Six Mile Slough
50 | P a g e
I N T E G R A T E D E C O L O G I C A L R E S E A R C H
5.2.2 Raw water quality data analyzed by CARO Analytical Services
Starred parameters were evaluated against the BC water quality guidelines and Canadian Council of Ministers (CCME) for water. Numbers highlighted in grey
exceeded at least one criterion. Lower long-term criteria (5 sample monitoring requirement) were used as an alert rather than a true evaluation.

Pre-restoration Monitoring of Six Mile Slough
51 | P a g e
I N T E G R A T E D E C O L O G I C A L R E S E A R C H
5.2.3 The number of water quality parameters exceeding at least one guideline
Site % of parameters Exceedance (source*)
exceeding guidelines
SMS001 4.3 Iron (aq. Life CCME)
Nickel (aq. Life CCME)
SMS002 4.3 Iron (aq. Life CCME)
Nickel (aq. Life CCME)
SMS003 4.3 Iron (aq. Life CCME)
Nickel (aq. Life CCME)
SMS004 0
SMS005 2.1 Iron (aq. Life WQG & CCME)
SMS006 4.3 Ammonia (aq. Life and WQG)
Iron (aq. Life CCME)
KR001 2.1 Nickel (aq. Life CCME)
K2002 2.1 Nickel (aq. Life CCME)
Legend:
*Source:
aq. Life CCME= Canadian Water Quality Guidelines
aq. Life CCME*= Canadian Water Quality Guidelines long term
aq. Life WQG = BC Water Quality Guidelines
aq. Life WQG* = BC Water Quality Guidelines long term
WQGwild = BC Water Quality Guidelines for wildlife
BCdw = BC Drinking Water Guidelines

Pre-restoration Monitoring of Six Mile Slough
52 | P a g e
I N T E G R A T E D E C O L O G I C A L R E S E A R C H
5.2.4 Sediment guidelines for British Columbia and the Canadian Council of Ministers
Sediment
Analyte Units BC SQ BC SQ PEL CCME ISQG CCME PEL
Arsenic mg/kg dry 5.9 17
Cadmium mg/kg dry 0.6 3.5 0.6 3.5
Chromium mg/kg dry 37.3 90 37.3 90
Copper mg/kg dry 35.7 197 35.7 197
Iron mg/kg dry 21,200 43,766
Lead mg/kg dry 35 91.3 35 91.3
Manganese mg/kg dry 460 1100
Mercury mg/kg dry 0.17 0.486
Nickel mg/kg dry 16 75
Selenium mg/kg dry 2
Silver mg/kg dry 0.5
Zinc mg/kg dry 123 325 123 315
SQ=sediment quality, ISQG=Interim Sediment Quality Guidelines., PEL=Probable effects levels
https://catalogue.data.gov.bc.ca/dataset/water-quality-guidelines-of-b-c-

Pre-restoration Monitoring of Six Mile Slough
53 | P a g e
I N T E G R A T E D E C O L O G I C A L R E S E A R C H
5.2.5 Raw sediment quality data analyzed by CARO Analytical Services
Starred parameters were evaluated against the Canadian Council of Ministers (CCME) for interim sediment quality (ISQG) high-lighted in grey adopted by BC

Pre-restoration Monitoring of Six Mile Slough
54 | P a g e
I N T E G R A T E D E C O L O G I C A L R E S E A R C H
5.2.6 The number of sediment quality parameters greater than at least one guideline
Site % of parameters Exceedance (source*)
exceeding guidelines
SMS001 16.6 Cadmium (aq. Life ISGQ and CCME)
Nickel (aq. Life ISQG)
SMS002 25 Cadmium (aq. Life ISGQ and CCME)
Lead (aq. Life ISGQ and CCME)
Nickel (aq. Life ISQG)
SMS003 33.3 Cadmium (aq. Life ISGQ and CCME)
Lead (aq. Life ISGQ and CCME)
Nickel (aq. Life ISQG)
Zinc (aq. Life ISGQ and CCME)
SMS004 33.3 Cadmium (aq. Life ISGQ and CCME)
Lead (aq. Life ISGQ, PEL and ISGQ, PEL CCME)
Nickel (aq. Life ISQG)
Zinc (aq. Life ISGQ and CCME)
SMS005 41.6 Arsenic (aq. Life ISGQ)
Cadmium (aq. Life ISGQ and CCME)
Lead (aq. Life ISGQ and CCME)
Manganese (aq. Life ISGQ)
Nickel (aq. Life ISQG)
SMS005-2 41.6 Arsenic (aq. Life ISGQ)
Cadmium (aq. Life ISGQ and CCME)
Lead (aq. Life ISGQ and CCME)
Nickel (aq. Life ISQG)
Zinc (aq. Life ISGQ, ISGQ CCME)
SMS006 41.6 Arsenic (aq. Life ISGQ)
Cadmium (aq. Life ISGQ and CCME)
Lead (aq. Life ISGQ, PEL and ISGQ, PEL CCME)
Nickel (aq. Life ISQG)
Zinc (aq. Life ISGQ, ISGQ CCME)
Legend:
*Source: aq. Life (ISQG or PEL) CCME = Canadian Sediment Quality Guidelines
aq. Life (ISQG or PEL) = BC Sediment Quality Guidelines

Pre-restoration Monitoring of Six Mile Slough
55 | P a g e
I N T E G R A T E D E C O L O G I C A L R E S E A R C H
5.2.7 Cumulative toxic units in sediment including sites affected by historical mining
Graph of cumulative toxic unit of zinc, lead, copper, cadmium, and arsenic in sediment including sites affected by historical mining. Two times criterion is the value above which metals levels may influence macroinvertebrate community structure and cause mortality in sensitive species. Cumulative toxic units are the sum of metals divided by the guideline (CCME PEL). Sites are indicated with Site name_Year_Type, Type = Reference (Ref), constructed wetlands (Cons), impacted by legacy mining (Mine).
5.2.8 Quality Assurance: water and sediment quality
Twenty-four of the twenty-five water quality parameters analysed from SMS005 Six Mile Slough in
duplicate samples were below the RPD limit of 25% in duplicate except the parameters, Phosphate
which was less than two times the method reporting level. However, phosphate was below the
additional criteria that the difference between duplicates should be less than two times the method
detection limit when duplicates are less than five times detection (Clark 2013).
In 2019, 52 out 54 sediment quality parameters analysed from SMS005 Six Mile Slough in duplicate
samples were below the RPD limit of 25% in duplicate except the parameters, Antimony and
Manganese.
0
20
40
60
80
100
120M
C0
01
_1
6_
Co
ns
PC
00
3_
16
_R
efLS
L00
1_
14
_R
efLW
L00
1_1
5_R
efM
C0
01
_1
8_
Co
ns
SUM
00
2_1
5_R
efB
VL0
01
_1
4_
Re
fB
ON
00
4_
18
_R
efP
V0
01
_1
6_
Ref
WIN
00
1_1
5_R
ef
TY0
01
_1
5_
Ref
LSL0
02
_1
5_
Ref
BV
L00
2_
15
_R
ef
SPA
00
2_
17
_C
on
sW
IN0
02
_15
_Re
fM
C0
06
_1
7_
Re
fM
C0
06
_1
8_
Re
fM
C0
03
_1
8_
Co
ns
MC
00
2_
17
_C
on
sM
C0
01
_1
7_
Co
ns
MC
00
5_
18
_R
ef
MC
00
2_
18
_C
on
sM
C0
02
-18
_C
on
sSM
S00
1_1
9_R
ef
MC
00
2_
16
_C
on
sM
C0
03
_1
6_
Co
ns
SPA
00
3_
18
_C
on
sM
C0
03
_1
7_
Co
ns
SMS0
02
_19
_Re
fB
VL0
03
_1
5_
Re
fG
C0
01
_15
_Ref
SMS0
05
_19
_Re
fSU
M0
03
_16
_Ref
SMS0
03
_19
_Re
fM
C0
05
_1
7_
Re
fM
C0
05
-17
_R
ef
MC
00
4_
18
_R
ef
FO0
01
_1
5_
Ref
BO
N0
01
_1
5_
Ref
SMS0
05
_19
_Re
fFR
A0
01
_15
_Re
fP
C0
02
_1
4_
Ref
SUM
00
1_1
5_R
efSC
H0
01
_1
6_
Re
fH
AY0
01
_15
_Re
fB
ON
00
2_
16
_R
efSM
S00
6_1
9_R
ef
MC
00
4_
17
_R
ef
SMS0
04
_19
_Re
fB
ON
00
3_
17
_R
efO
UT0
02
_1
8_
Ref
SPA
00
1_
16
_C
on
sG
C0
02
_15
_Ref
BEA
R0
01
_1
5_
Ref
ELD
00
1_1
5_R
efO
UT0
01
_1
7_
Ref
CL0
01
_1
5_
Ref
SEA
T00
2_1
4_M
ine
SEA
T00
3_1
5_M
ine
SEA
T00
3_1
5_M
ine
SEA
T00
1_1
5)M
ine
SEA
T00
4_1
6_M
ine
Sediment: Cumulative Toxic Units
Zinc
Lead
Copper
Cadmium
Arsenic
mi = metal concentration, mg/kgci = criterion value
CTU=mi/ci

Pre-restoration Monitoring of Six Mile Slough
56 | P a g e
I N T E G R A T E D E C O L O G I C A L R E S E A R C H
5.3 Macroinvertebrates
5.3.1 Quality assurance: morphology-based taxonomy
Technical Report, Rhithron: Macroinvertebrate quality assurance procedures:
By W. Bollman, Chief Biologist, Rhithron Associates, Inc., Missoula, Montana
Sample processing: All samples arrived in good condition. A chain-of-custody document containing
sample identification information was provided by the Integrated Ecological Research (IER) Project
Manager. Upon arrival, samples were unpacked, examined, and checked against the IER chain-of-custody.
An inventory spreadsheet was created which included project code and internal laboratory identification
numbers and was uploaded into the Rhithron database prior to sample processing.
Sorting protocols consistent with CABIN standard operating procedures (Environment Canada: CABIN
Laboratory Methods: Processing, Taxonomy, and Quality Control of Benthic Macroinvertebrate Samples:
May 2014) were applied to achieve representative subsamples of a minimum of 300 organisms. A
Marchant Box was used for subsampling and sorting. Subsampling of each sample began with a random
selection of 5 Marchant Box cells. All ostracods, copepods and cladocerans were picked from the first
selected cell and placed in a separate vial; these organisms were not assigned a count and did not
contribute to the 300-organism target. Subsequent sorting did not include these organisms. The initial 5
cells were completely sorted of all organisms. The contents of each grid were examined under
stereoscopic microscopes using 10x-30x magnification. All aquatic invertebrates from each selected grid
were sorted from the substrate and placed in 80% ethanol for subsequent identification. Grid selection,
examination, and sorting continued until at least 300 organisms were sorted. If more than 50% of the
sample was required to obtain the minimum 300 organism count, the entire sample was sorted. All
unsorted sample fractions were retained and stored at the Rhithron laboratory.
Organisms were individually examined by certified taxonomists, using 10x – 80x stereoscopic dissecting
scopes (Leica S8E) and identified to target taxonomic levels specified by the IER Project Manager, using
appropriate published taxonomic references and keys. Chironomids and oligochaetes were carefully
morphotyped using 10x – 80x stereoscopic dissecting microscopes (Leica S8E) and representative
specimens were slide mounted and examined at 200x – 1000x magnification using an Olympus BX 51 or
Leica DM 1000 compound microscope.
Identification, counts, life stages, and information about the condition of specimens were recorded on
electronic bench sheets. Organisms that could not be identified to the taxonomic targets because of
immaturity, poor condition, or lack of complete current regionally applicable published keys were left at
appropriate taxonomic levels that were coarser than those specified. Organisms designated as “unique”
were those that could be definitively distinguished from other organisms in the sample. Identified
organisms were preserved in 80% ethanol in voucher labeled vials (by taxon and life stage), and shipped
to the Royal BC Museum in Victoria, British Columbia.

Pre-restoration Monitoring of Six Mile Slough
57 | P a g e
I N T E G R A T E D E C O L O G I C A L R E S E A R C H
Quality control procedures: Quality control procedures for initial sample processing and subsampling
involved checking sorting efficiency. These checks were conducted on 15% of the samples (minimum of 3
samples from the project) by independent observers who microscopically re-examined sorted substrate
from each sample. Quality control procedures for each sample proceeded as follows: the quality control
technician poured the sorted substrate from a processed sample out and all substrate was re-examined
under 10x – 30x magnification. All organisms that were missed were counted and this number was added
to the total number obtained in the original sort. Sorting efficiency was evaluated by applying the
following calculation, where: SE is the sorting efficiency, expressed as a percentage, n1 is the total number
of specimens in the first sort, and n 2 is the total number of specimens in the second sort.
10021
1 +
=nn
nSE
Quality control procedures for taxonomic determinations of invertebrates involved checking accuracy,
precision, and enumeration. Three samples were randomly selected, and all organisms re-identified and
counted by an independent taxonomist. Taxa lists, and enumerations were compared by calculating a
Bray-Curtis similarity statistic (Bray and Curtis 1957), Percent Taxonomic Disagreement (PTD) and Percent
Difference in Enumeration (PDE). Routinely, discrepancies between the original identifications and the QC
identifications are discussed among the taxonomists, and necessary rectifications to the data are made.
Discrepancies that cannot be rectified by discussions are routinely sent out to taxonomic specialists for
identification.
Data analysis: Taxa and counts for each sample were entered into Rhithron’s customized database
software. A taxonomic flat file including site information, taxonomic hierarchy, taxonomic identifications,
counts, life stages and other information was formatted in Microsoft Excel.
Results: Results of internal quality control procedures for subsampling and taxonomy are given in Table
1. Sorting efficiency varied from 96-100%. Taxonomic precision for identification and enumeration ranged
from 96-99% (Bray-Curtis), with a range of 0.6-4% for percent taxonomic disagreement and 0-1.2% for
percent difference in enumeration for the randomly selected taxonomic QC samples, and data entry
efficiency averaged 100% for the project. These similarity statistics fall within acceptable industry criteria
(Stribling et al. 2003). An electronic spreadsheet was provided to the IER Project Manager via e-mail.
Voucher labeled vials were shipped to the Royal BC Museum.
Table 1. Results of internal quality control procedures for subsampling and taxonomy for 2019.
Rhithron ID Station ID Date Collected Sorting efficiency
Bray-Curtis similarity for taxonomy and enumeration
Percent Taxonomic Disagreement (PTD)
Percent Difference in Enumeration (PDE)
IER19DQ001 SMS001 7/29/2019 0.9884 0.9739 0.0335 0.0077
IER19DQ002 SMS002 7/29/2019
IER19DQ003 SMS003 7/29/2019 0.9879
IER19DQ004 SMS004 7/30/2019 0.9550 0.0481 0.0032
IER19DQ005 SMS005 7/30/2019 0.9702
IER19DQ006 SMS006 7/30/2019 0.9900 0.0133 0.0033

Pre-restoration Monitoring of Six Mile Slough
58 | P a g e
I N T E G R A T E D E C O L O G I C A L R E S E A R C H
5.3.1 Outputs from morphology-based taxonomy
Taxonomic list and results from Rhithron Associates Inc.

Pre-restoration Monitoring of Six Mile Slough
59 | P a g e
I N T E G R A T E D E C O L O G I C A L R E S E A R C H

Pre-restoration Monitoring of Six Mile Slough
60 | P a g e
I N T E G R A T E D E C O L O G I C A L R E S E A R C H

Pre-restoration Monitoring of Six Mile Slough
61 | P a g e
I N T E G R A T E D E C O L O G I C A L R E S E A R C H

Pre-restoration Monitoring of Six Mile Slough
62 | P a g e
I N T E G R A T E D E C O L O G I C A L R E S E A R C H
5.3.2 Outputs from DNA meta-barcoding
Results from DNA meta-barcoding by the Center for Genomic Biodiversity (STREAM 2019)
Shaded species are of diagnostic interest in assessing wetland health (CABIN 2018)
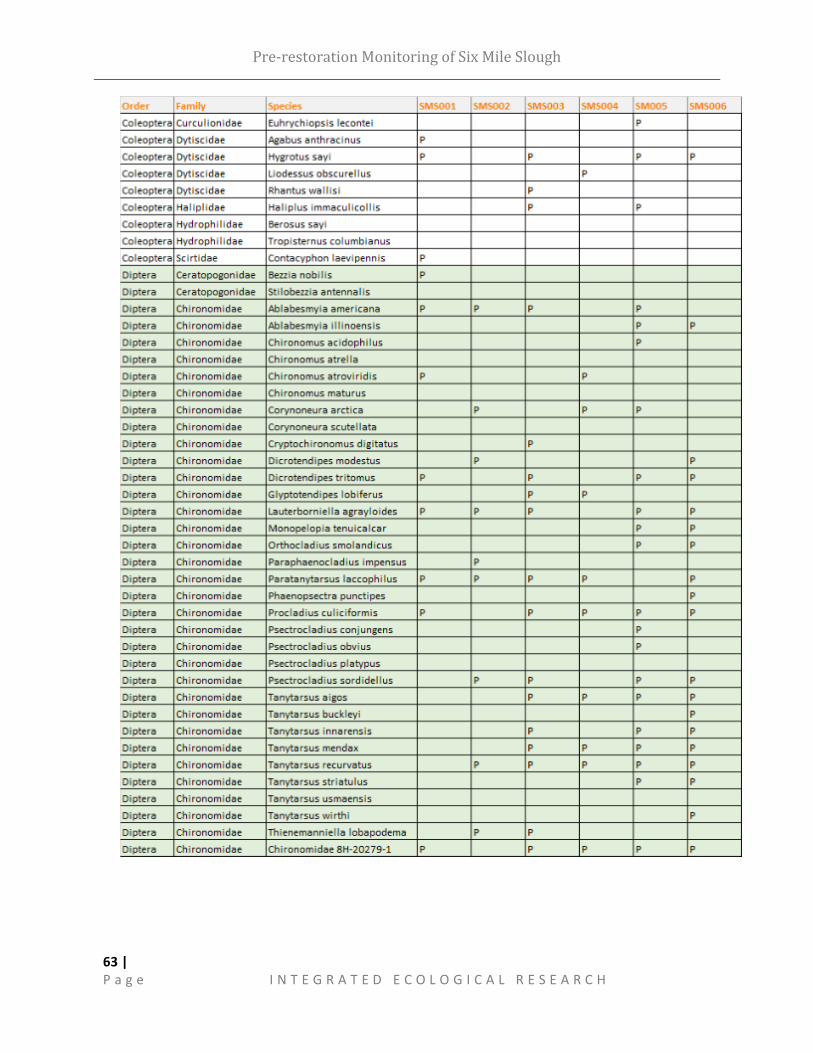
Pre-restoration Monitoring of Six Mile Slough
63 | P a g e
I N T E G R A T E D E C O L O G I C A L R E S E A R C H

Pre-restoration Monitoring of Six Mile Slough
64 | P a g e
I N T E G R A T E D E C O L O G I C A L R E S E A R C H
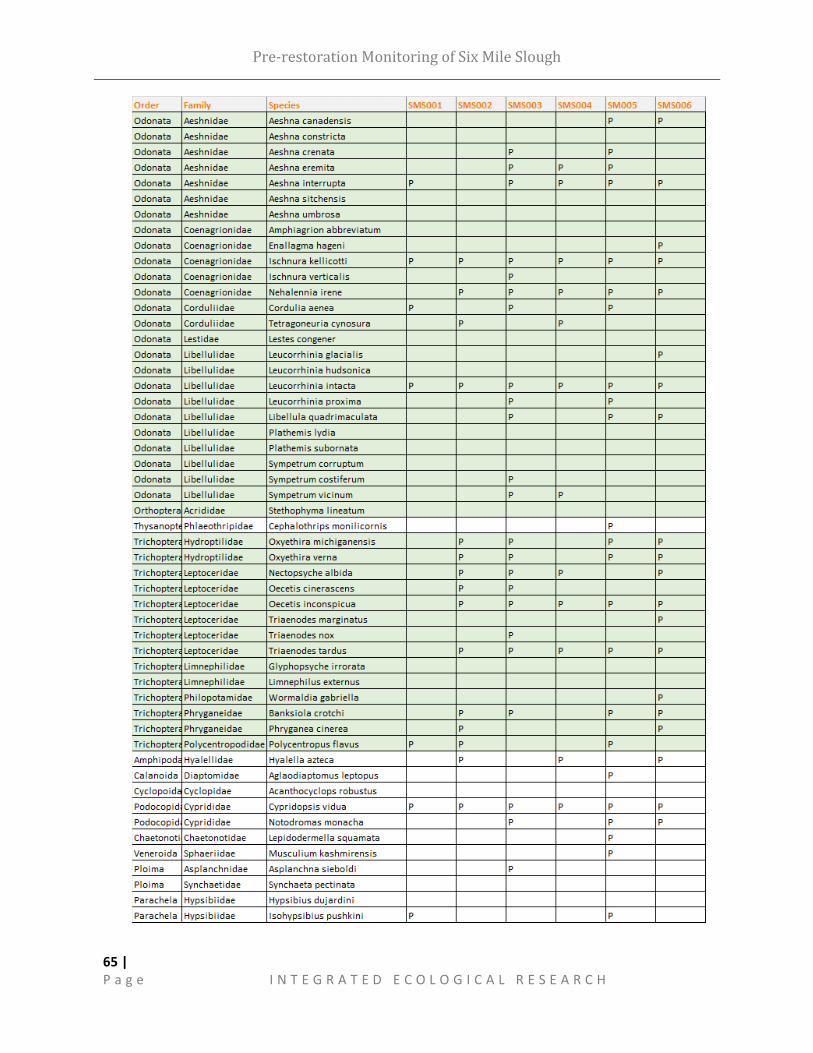
Pre-restoration Monitoring of Six Mile Slough
65 | P a g e
I N T E G R A T E D E C O L O G I C A L R E S E A R C H


