
NC AWWA-WEA Spring Conference, Wilmington, NC April 15, 2013
Powdered and Granular Activated Carbon Treatment for TOC Reduction and Stage
2 D/DBPR Compliance
Pete D’Adamo, PhD, PE [email protected]

Learning Objectives and Outline
Ø Total Organic Carbon (TOC) Basics Ø Activated Carbon Basics Ø Testing Methods to Evaluate TOC Removal Ø TOC Removal Performance with Activated Carbon Ø Types of Delivery Systems Ø Summary and Conclusions
TOC Basics Activated Carbon Basics
TOC Removal Testing
Methods
Activated Carbon
Performance
Activated Carbon Delivery
Systems Cost Data

Natural Organic Matter
TOC Basics Activated Carbon Basics
TOC Removal Testing
Methods
Activated Carbon
Performance
Activated Carbon Delivery
Systems Cost Data

Natural Organic Matter
TOC Basics Activated Carbon Basics
TOC Removal Testing
Methods
Activated Carbon
Performance
Activated Carbon Delivery
Systems Cost Data

Why Are We Concerned About NOM/TOC?
Ø Organic Compounds Represent Sources of Tastes, Odors and Color
Ø Precursor for Disinfection By-Products Ø Potential Health Concerns Ø Many Organics are EDCs, PPCPs and CECs and
may be Subject to Future Regulation Ø Potential Source for Biological Regrowth in
Distribution Systems Ø Regulatory Compliance
§ Stage 1 and 2 D/DBPR
TOC Basics Activated Carbon Basics
TOC Removal Testing
Methods
Activated Carbon
Performance
Activated Carbon Delivery
Systems Cost Data

DBP Control = Controlling this Equation
Chlorine Monochloramine Ozone Chlorine Dioxide
Natural Organic Matter Bromide
+
Trihalomethanes Haloacetic Acids Haloacetonitriles Haloketones Aldehydes Bromate and many more
=
Chemical Disinfectant
Precursor + DBPs =
TOC Basics Activated Carbon Basics
TOC Removal Testing
Methods
Activated Carbon
Performance
Activated Carbon Delivery
Systems Cost Data

What is Activated Carbon?
Ø A highly porous charcoal that effectively removes organic compounds from air and water
Ø Available as a powdered (PAC) or granular (GAC) material
TOC Basics Activated Carbon Basics
TOC Removal Testing
Methods
Activated Carbon
Performance
Activated Carbon Delivery
Systems Cost Data

GAC vs. PAC
Ø Granular Activated Carbon (GAC) § Particle size: larger than 0.1 mm § Typical range – 0.4 to 2.5 mm § Bulk dry (apparent) density – 0.22 to 0.5 kg/L § Used in adsorption columns/filters
Ø Powdered Activated Carbon (PAC) § Particle size: < 200 mesh (74 µm) § Typical range – 10-50 µm § Bulk dry (apparent) density – 0.34 to 0.74 kg/L § Used by direct addition
TOC Basics Activated Carbon Basics
TOC Removal Testing
Methods
Activated Carbon
Performance
Activated Carbon Delivery
Systems Cost Data

Where Does it Come From?
Ø Produced from a variety of source materials… § Coal § Wood § Coconut shells
Ø Raw materials are heated (in two stages) to form activated carbon
TOC Basics Activated Carbon Basics
TOC Removal Testing
Methods
Activated Carbon
Performance
Activated Carbon Delivery
Systems Cost Data

Activated Carbon Manufacturing
Courtesy of Calgon Carbon Corporation
TOC Basics Activated Carbon Basics
TOC Removal Testing
Methods
Activated Carbon
Performance
Activated Carbon Delivery
Systems Cost Data

Internal Surface Area
Courtesy of Calgon Carbon Corporation
TOC Basics Activated Carbon Basics
TOC Removal Testing
Methods
Activated Carbon
Performance
Activated Carbon Delivery
Systems Cost Data

Diffusion in Activated Carbon
Activated Carbon Particle
TOC Basics Activated Carbon Basics
TOC Removal Testing
Methods
Activated Carbon
Performance
Activated Carbon Delivery
Systems Cost Data
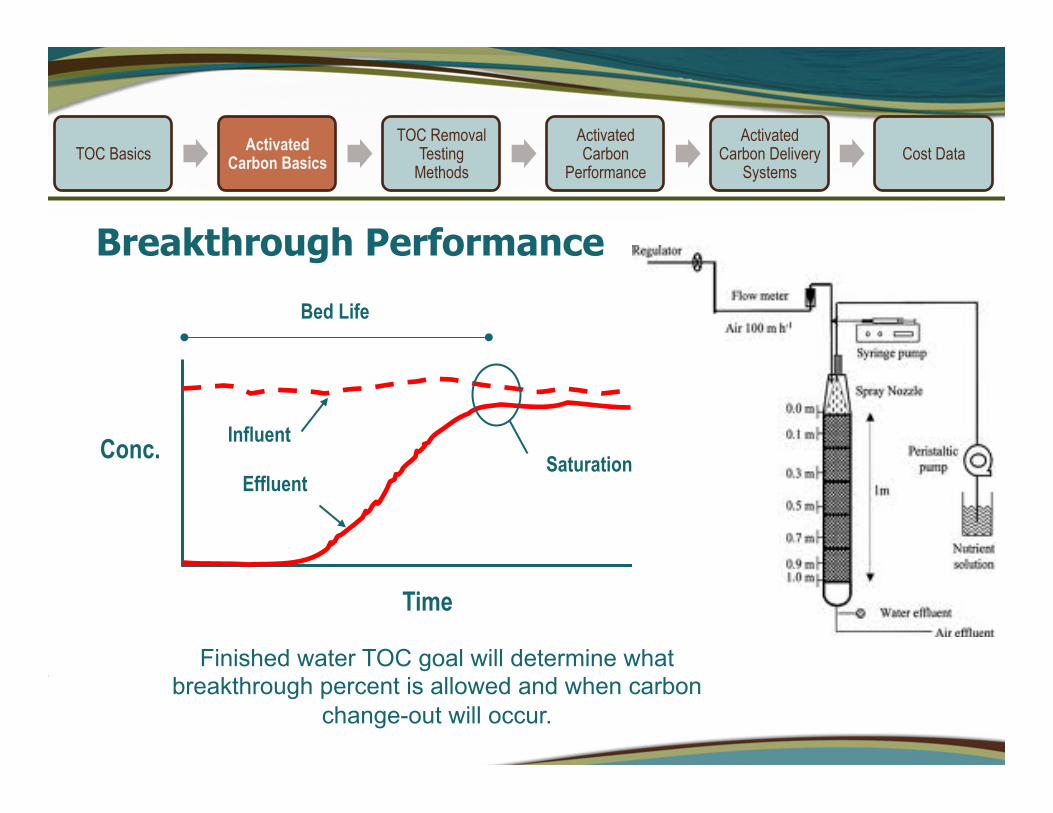
Breakthrough Performance
Time
Conc. Influent
Effluent Saturation
Bed Life
Finished water TOC goal will determine what breakthrough percent is allowed and when carbon
change-out will occur.
TOC Basics Activated Carbon Basics
TOC Removal Testing
Methods
Activated Carbon
Performance
Activated Carbon Delivery
Systems Cost Data

Testing Methods for Assessing TOC Removal with Activated Carbon
Ø Isotherm Testing - GAC Ø Jar Testing - PAC Ø Rapid Small Scale Column Testing - GAC Ø Pilot Column Testing - GAC
TOC Basics Activated Carbon Basics
TOC Removal Testing
Methods
Activated Carbon
Performance
Activated Carbon Delivery
Systems Cost Data

GAC Adsorption Isotherm
TOC Basics Activated Carbon Basics
TOC Removal Testing
Methods
Activated Carbon
Performance
Activated Carbon Delivery
Systems Cost Data
Where q = (TOCinitial – TOCfinal)/Carbon Dose (g/L) Norit HD3000 and Calgon Filtersorb 300

Obtain Raw Water for Testing
Conduct Jar Testing with
Plant Specific Conditions
Analyze for TOC at
Different Carbon Doses
Calculate Performance and Select PAC Type/
Dose
PAC Jar Testing
§ Evaluate the performance of different PACs § Determine optimum dose § Evaluate mixing energy and time § Evaluate impact on coagulation chemistry
TOC Basics Activated Carbon Basics
TOC Removal Testing
Methods
Activated Carbon
Performance
Activated Carbon Delivery
Systems Cost Data

Pilot Column
Ø Advantages: § Incorporates fluctuations in
influent quality and flow rate § Large enough to backwash
and consider physical throughput
Ø Disadvantages § Time consuming § Expensive
TOC Basics Activated Carbon Basics
TOC Removal Testing
Methods
Activated Carbon
Performance
Activated Carbon Delivery
Systems Cost Data

Mini-column Testing § Accelerated Column Testing (ACT) (Calgon) § Rapid Scale Small Column Test (RSSCT) (Michigan State) § Pulverize to reduce particle size and increase rate § Apply “scale up” factors (for reduced particle size and accelerated flow)
TOC Basics Activated Carbon Basics
TOC Removal Testing
Methods
Activated Carbon
Performance
Activated Carbon Delivery
Systems Cost Data

TOC Removal and DBP Reduction with Activated Carbon
Strategy/Technology TOC/DBP Reduction Potential
Enhanced Coagulation/Alternate Coagulants
0 to 10%
Chlorine Dioxide Pre-treatment 0% TOC, 10 to 50% DBPs PAC Pretreatment 5 to 25% MIEX ® 50 to 70% Ozone / Biological Active Filtration 0 to 20% Post Filtration GAC Contactors 25 to 75%
TOC Basics Activated Carbon Basics
TOC Removal Testing
Methods
Activated Carbon
Performance
Activated Carbon Delivery
Systems Cost Data

Powdered Activated Carbon – Townsend WTP
CFE FW
~ 22% TOC Removal at 30 mg/L PAC
TOC Basics Activated Carbon Basics
TOC Removal Testing
Methods
Activated Carbon
Performance
Activated Carbon Delivery
Systems Cost Data
Raw Water TOC/DOC 3.81 mg/L/3.75 mg/L Ferric Dose 40 mg/L Caustic Dose 4 mg/L Raw Water Temperature
25oC
Raw Water pH 7.1

PAC Addition – Concord, NC
Up to ~ 22% TOC Removal at 25 mg/L PAC
TOC Basics Activated Carbon Basics
TOC Removal Testing
Methods
Activated Carbon
Performance
Activated Carbon Delivery
Systems Cost Data
Hillgrove WTP • 7-Day TTHM Formation Potential – 67 mg/L per mg/L TOC
• 7-Day HAA5 Formation Potential – 45 mg/L per mg/L TOC
• ~ 14% DBP Reduction @ 15 mg/L PAC

RSSCT Results - GUC
TOC Basics Activated Carbon Basics
TOC Removal Testing
Methods
Activated Carbon
Performance
Activated Carbon Delivery
Systems Cost Data
0
20
40
60
80
100
120
140
160
0 10 20 30 40 50 60 70
THMFP, ug/L
Full-‐scale service time, days
THMFPLogistic Function FitMCL80% MCL
• Filtersorb 300 • 100 x 200 mesh fraction
• EBCT – 1.26/15 minutes
• Temperature - 22-23.5°C
• pH – 6.3 • Initial TOC – 4 mg/L • UV254 – 0.044 cm-1
• Flow 2 ml/min

Post-Filter GAC Contactors
Rapid Mix Floc/Sed Dual-Media Filter Storage Distribution
GAC Contactor
TOC Basics Activated Carbon Basics
TOC Removal Testing Methods
Activated Carbon Performance
Activated Carbon Delivery
Systems Cost Data

Typical GAC Arrangement
TOC Basics Activated Carbon Basics
TOC Removal Testing Methods
Activated Carbon Performance
Activated Carbon Delivery
Systems Cost Data
Post-Filter Contactor • 2–8 gpm/sf • EBCT of 7-25 minutes per vessel • Typically 10’ to 12’ in diameter; 18’ to 22’ tall • Typical carbon loading - 4 to 8 feet, 20,000 lbs
Granular Media Filter Adsorber • 2–6 gpm/sf • EBCT of 5-20 minutes • Typical media depth – 3 to 6 feet

Dry PAC Delivery Options
TOC Basics Activated Carbon Basics
TOC Removal Testing Methods
Activated Carbon Performance
Activated Carbon Delivery
Systems Cost Data
40 to 45 lbs/33 bags/pallet
750 lb bulk bags
30,000 to 32,000 lb load

PAC Feeders
TOC Basics Activated Carbon Basics
TOC Removal Testing Methods
Activated Carbon Performance
Activated Carbon Delivery Systems Cost Data
Bag Loading
Bulk Bag

PAC Bulk Silo Feed
TOC Basics Activated Carbon Basics
TOC Removal Testing Methods
Activated Carbon Performance
Activated Carbon Delivery
Systems Cost Data

PAC Slurry System
TOC Basics Activated Carbon Basics
TOC Removal Testing Methods
Activated Carbon Performance
Activated Carbon Delivery
Systems Cost Data
Slurry (1- 2lbs/gal)
Mixer
Feed Pump

Typical Cost Data - PAC
Ø PAC - $0.50 to $1.00 per pound
Ø Equipment Cost - $200K to $500K
TOC Basics Activated Carbon Basics
TOC Removal Testing
Methods
Activated Carbon
Performance
Activated Carbon Delivery
Systems Cost Data
Dose (mg/L) 1 MGD 5 MGD 10 MGD 20 MGD 5 $10,654 $53,272 $106,544 $213,087
10 $21,309 $106,544 $213,087 $426,174
15 $31,963 $159,815 $319,631 $639,261
20 $42,617 $213,087 $426,174 $852,348
Based on $0.70/lb

Typical Cost Data - GAC
Ø Capital Cost - $0.25 to $0.50 per gallon Ø GAC Media - $1.50 per pound regenerated Ø 10 MGD WTP ~ $230,000 per change out
§ 4 gpm/sf § 1,750 SF filter area, 3 foot GAC depth § GAC density - 30,000 lbs/CF
TOC Basics Activated Carbon Basics
TOC Removal Testing
Methods
Activated Carbon
Performance
Activated Carbon Delivery
Systems Cost Data

Summary and Conclusions
Ø PAC and GAC are effective technologies for reducing TOC concentrations, minimizing DBPs and can remove selected contaminants of concern
Ø Both technologies are costly to operate Ø Before considering the use of PAC, bench scale testing
should be conducted to determine effectiveness and cost Ø Bench and/or pilot scale testing are required for GAC
including monitoring TOC removal and DBP formation potential
TOC Basics Activated Carbon Basics
TOC Removal Testing
Methods
Activated Carbon
Performance
Activated Carbon Delivery
Systems Cost Data
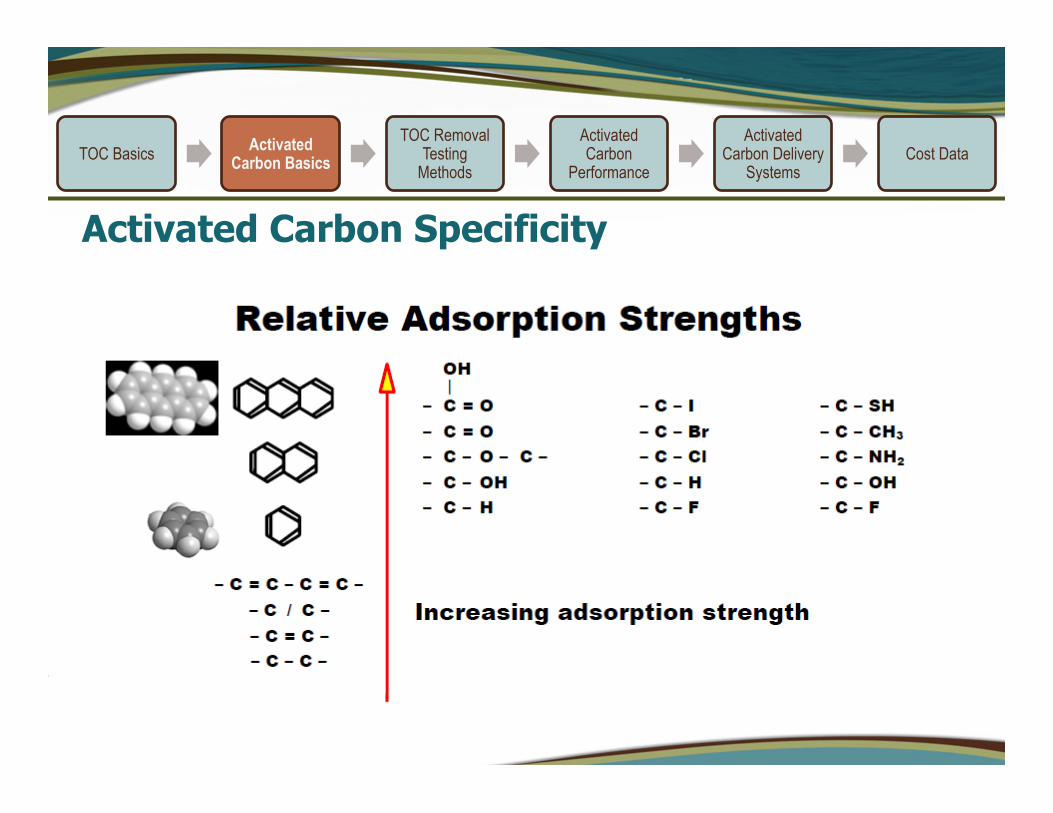
Activated Carbon Specificity
TOC Basics Activated Carbon Basics
TOC Removal Testing
Methods
Activated Carbon
Performance
Activated Carbon Delivery
Systems Cost Data


