
Polaris: A System for Query, Analysis and Visualization of Multi-dimensional Relational
Databases
Presented by Darren Gatesfor ICS 280

Introduction
• Polaris is a system for exploring large multi-dimensional databases, using the Pivot Table interface, but extending this idea to graphical displays and allowing the construction of complex queries.
• Polaris uses tables to organize multiple graphs on a display, with each table consisting of layers and panes.

Pivot Tables
• Multi-dimensional databases are often treated as n-dimensional cubes.
• Pivot Tables allow rotation of multi-dimensional datasets, allowing different dimensions to assume the rows and columns of the table, with the remaining dimensions being aggregated within the table.
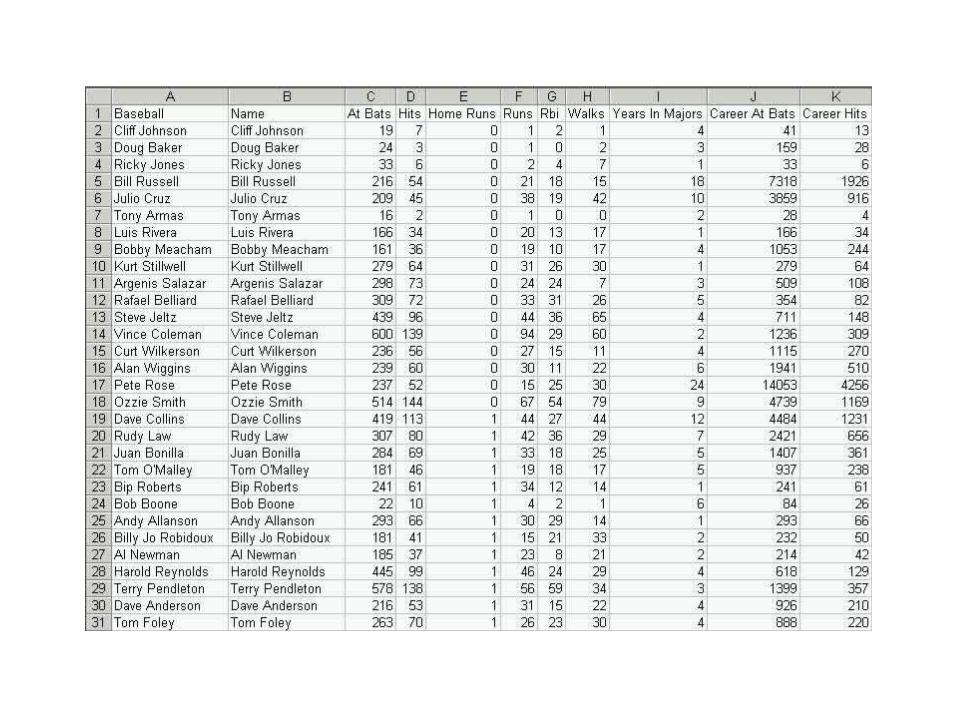
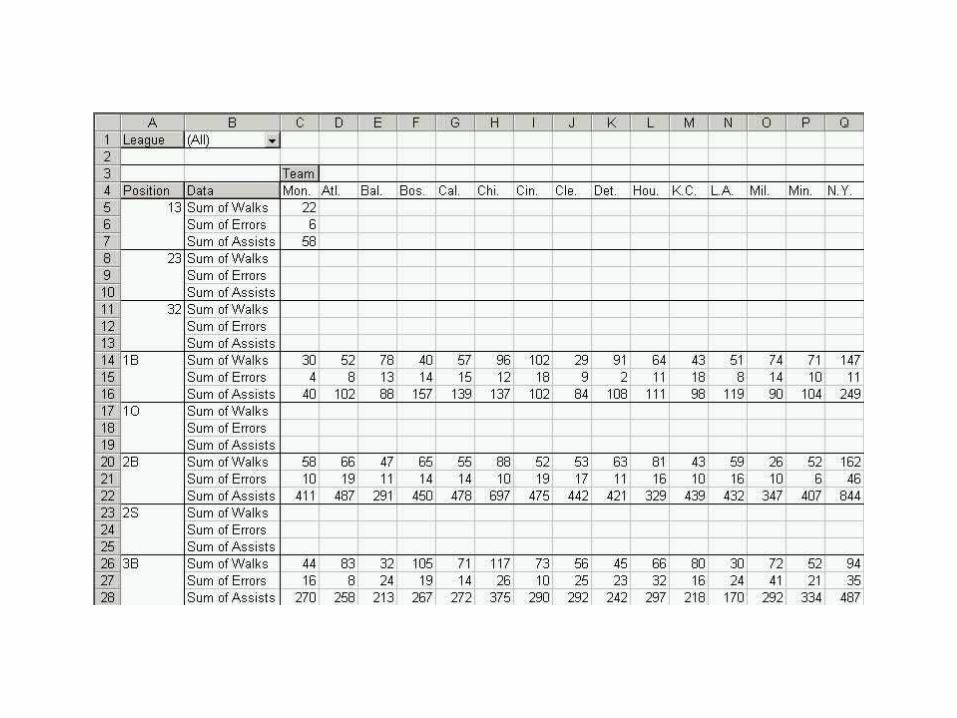
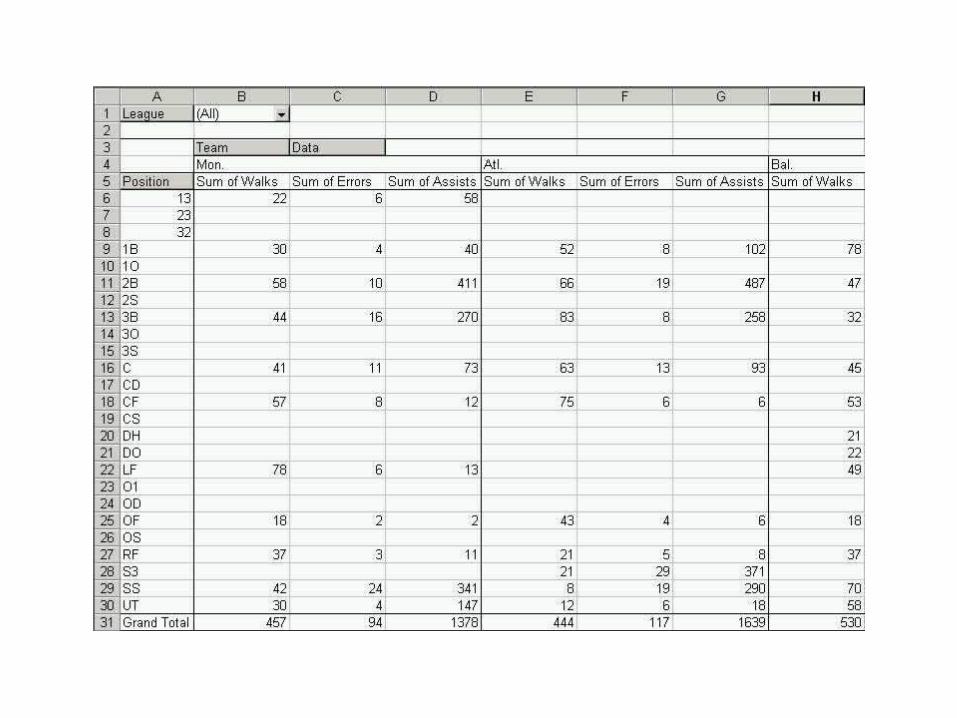
Example: Baseball data
• By dragging and dropping the dimensions to and from the left-hand column, top row, upper-left corner, and central data area (where the remaining dimensions are aggregated), one can change the Pivot Table view. Any of these views can be subsequently graphed.


Polaris Design Concepts 1
• An analysis tool for a large, multi-dimensional database must:– allow data-dense displays for a large number of
records and dimensions– allow multiple display types– have an exploratory interface; should be able to
rapidly change how data is viewed
Polaris Design Concepts 2
• Characteristics of tables that make them effective to display multi-dimensional data:– multivariate: multiple dimensions can be
encoded in the structure of the table– comparative: tables generate “small-multiple”
displays of information– familiar: users are accustomed to tabular
displays
Polaris Display 1
• Drag and drop fields from database scheme onto shelves
• May combine multiple data sources, each data source mapping to a separate layer
• Multiple fields may be dragged onto each shelf
• Data may be grouped or sorted, and aggregations may be computed

Polaris Display 2
• Selecting a single mark in a graphic displays the values for the mark
• Can lasso a set of marks to brush records
• Marks in the graphics use retinal properties (see subsequent slide)
Table Algebra
• A formal mechanism to specify table configurations
• Operators:– concatenation +– cross x– nest /

Graphics
• Ordinal-Ordinal: e.g. the table– the axis variables are typically independent of each
other
• Ordinal-Quantitative: e.g. bar chart– the quantitative variable is often dependent on the
ordinal variable
• Quantitative-Quantitative: e.g. maps– view distribution of data as a function of one or both
variables; discover causal relationships
Retinal Properties
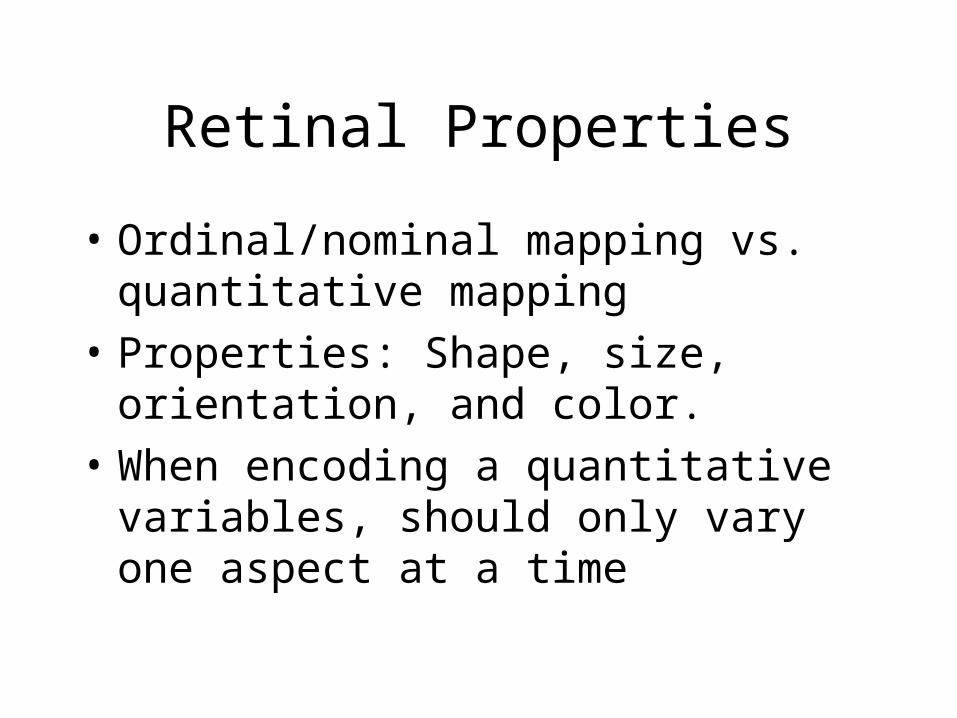
• Ordinal/nominal mapping vs. quantitative mapping
• Properties: Shape, size, orientation, and color.
• When encoding a quantitative variables, should only vary one aspect at a time

Querying
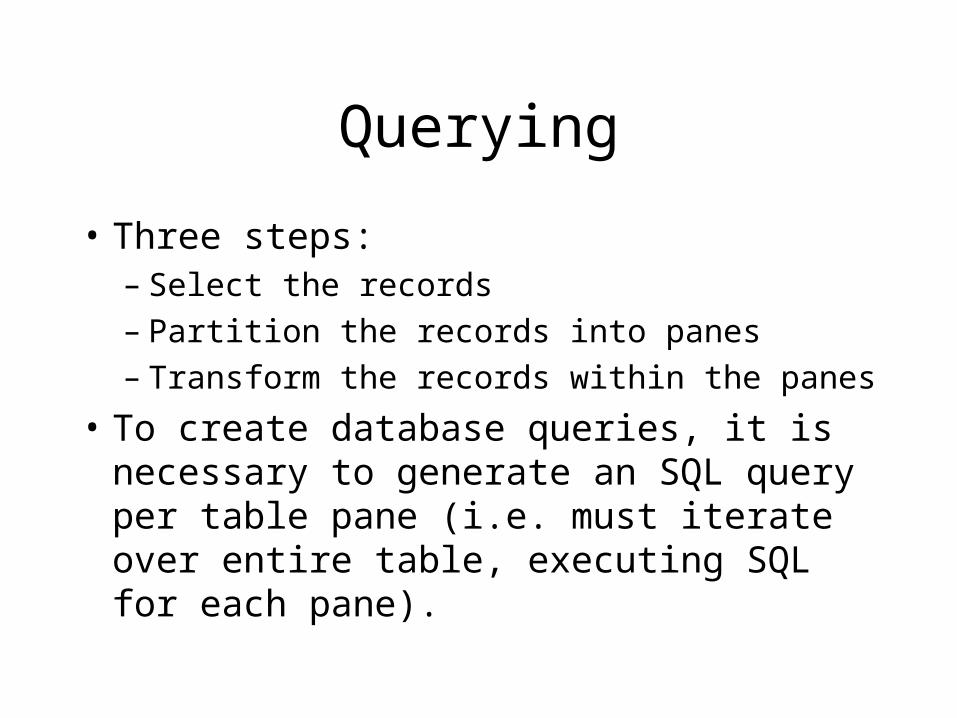
• Three steps:– Select the records– Partition the records into panes– Transform the records within the panes
• To create database queries, it is necessary to generate an SQL query per table pane (i.e. must iterate over entire table, executing SQL for each pane).

Discussion
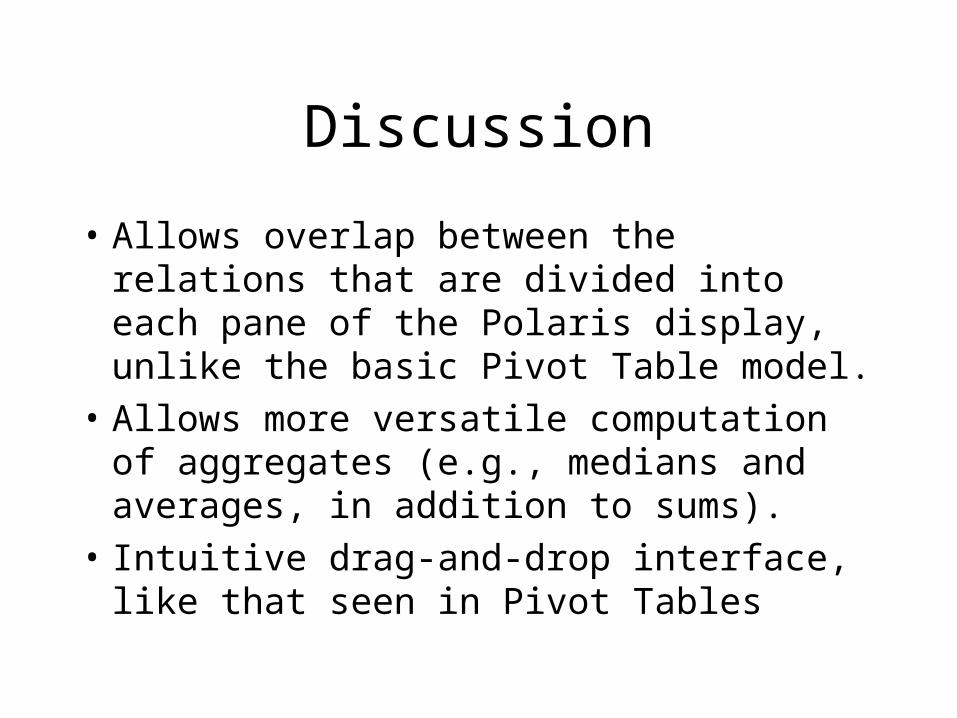
• Allows overlap between the relations that are divided into each pane of the Polaris display, unlike the basic Pivot Table model.
• Allows more versatile computation of aggregates (e.g., medians and averages, in addition to sums).
• Intuitive drag-and-drop interface, like that seen in Pivot Tables

Possible Improvements
• Generate database tables from a selected set of marks
• Integrate a table lens, instead of having to click a mark to view its details

![Technical Bulletin - Polaris - Polaris 9300 Sport & Polaris 9300xi Sport[1]](https://cdn.vdocuments.site/doc/165x107/553b235d4a7959d8258b463f/technical-bulletin-polaris-polaris-9300-sport-polaris-9300xi-sport1.jpg)


