
Plan Collect Process Discuss
Start screen
What sort of place do you live in?

Plan Collect Process Discuss
Start screen
What sort of place do you live in?
Where do your
friends live?
Discuss
Process
Plan Collect Process Discuss
Plan
Collect
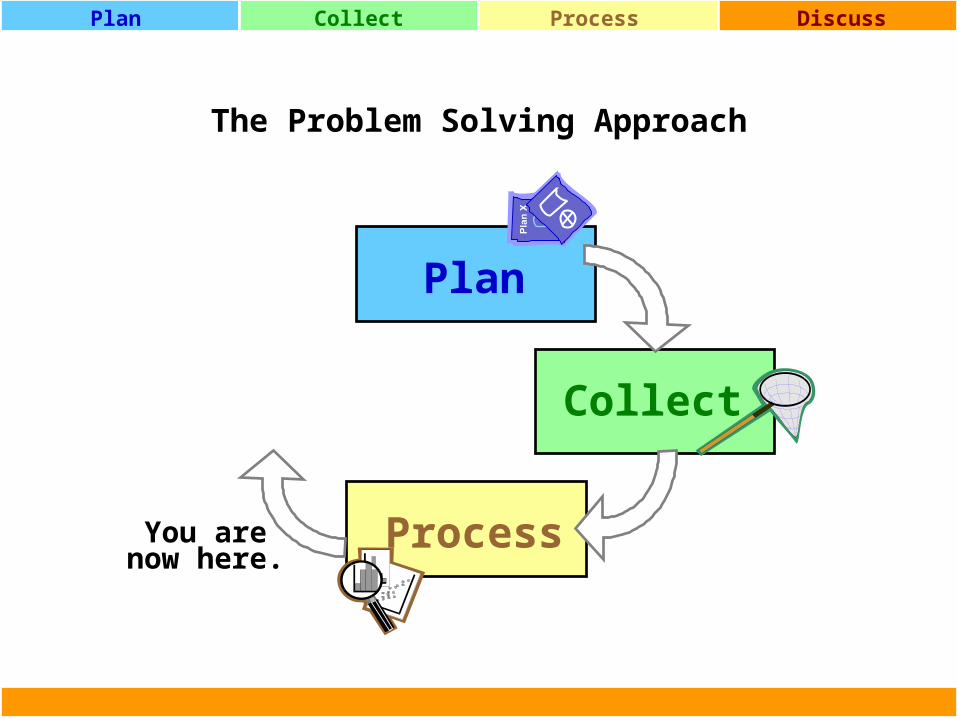
DHCycleThe Problem Solving Approach

Plan Collect Process Discuss
Start screen
How can you find out?
Who should you ask?
What proportion of students are freshers?Do most fr
eshers
live in university
accommodation?
What should you ask them?
Plan

Collect Process Discuss
Crime in the Media
Plan
Does the average rent paid depend on type of accommodation?
Do freshers prefer
private
accommodation?
Do third years live
in hall?
Use a questionnaire?
Do students pay a lot of rent?
Collect Process Discuss
Eight categories
Plan
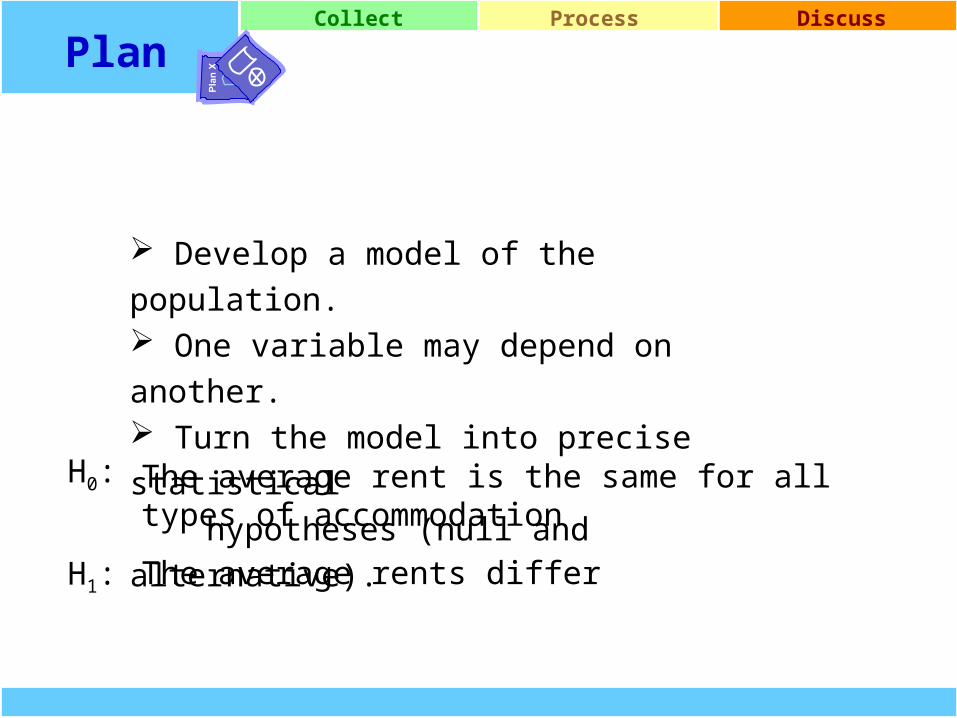
Develop a model of the population. One variable may depend on another. Turn the model into precise statistical hypotheses (null and alternative).
H0:
H1:
The average rent is the same for all types of accommodation
The average rents differ
CollectProcess Discuss
Plan
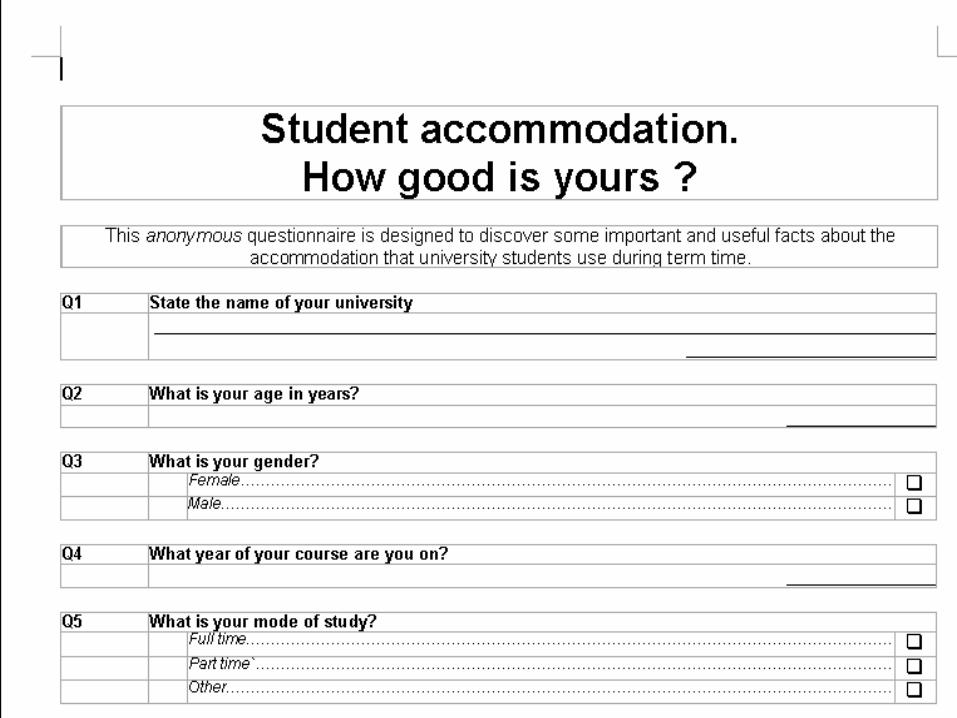
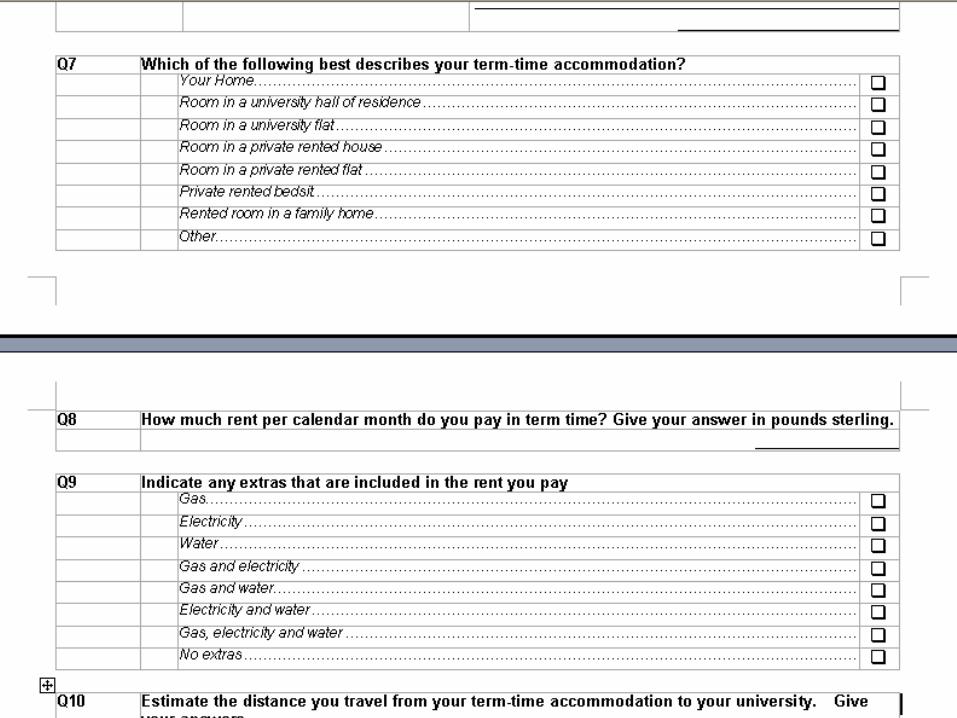
The questionnaire
CollectProcess Discuss
Which data
Plan
Discuss
Process
Plan Collect Process Discuss
Plan
Collect
DHCycleThe Problem Solving Approach
You arenow here.

CollectProcess Discuss
Which data
Plan
You did this in your first seminars
Students at three other UK universities have completed the
questionnaire
Discuss
Process
Plan Collect Process Discuss
Plan
Collect
DHCycleThe Problem Solving Approach
You arenow here.
ProcessPlan Collect Discuss
Which processes
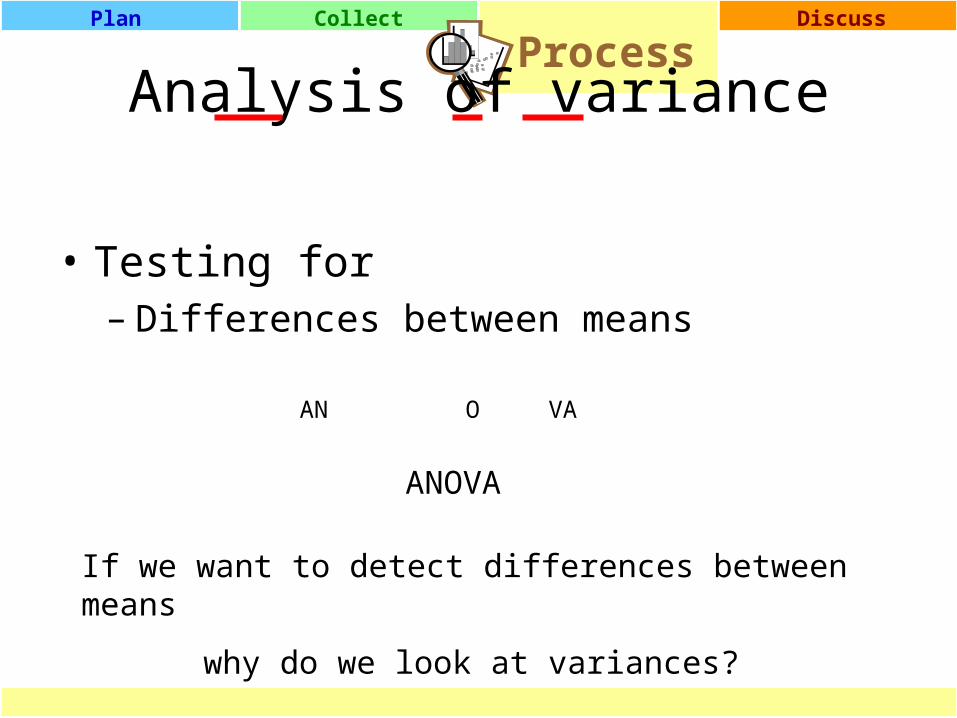
Analysis of variance
• Testing for– Differences between means
AN O VA
ANOVA
If we want to detect differences between means
why do we look at variances?
ProcessPlan Collect Discuss
Which processes
10 15 20 25 30 35 40
0.0
0.4
0.8
x
f(x)
10 15 20 25 30 35 40
0.0
0.4
0.8
x
f(x)
10 15 20 25 30 35 40
0.00
0.06
0.12
x
f(x)
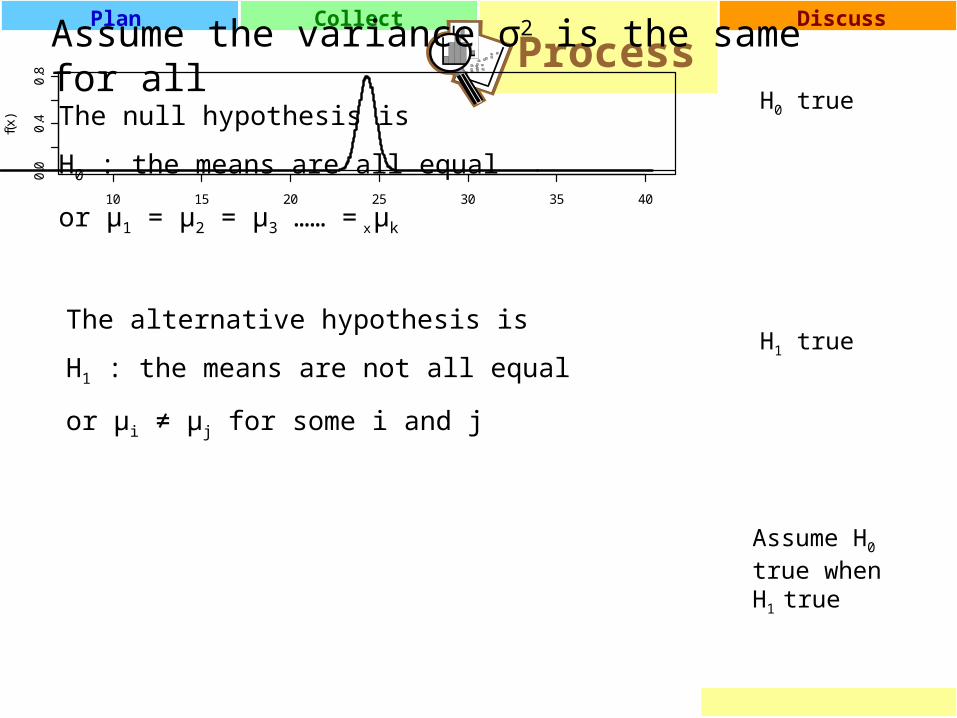
H1 true
H0 true
Assume H0 true when H1
true
The null hypothesis is
H0 : the means are all equal
or μ1 = μ2 = μ3 …… = μk
The alternative hypothesis is
H1 : the means are not all equal
or μi ≠ μj for some i and j
Assume the variance σ2 is the same for all

ProcessPlan Collect Discuss
Which processes
ANOVA10 15 20 25 30 35 40
0.0
0.4
0.8
x
f(x)
10 15 20 25 30 35 40
0.0
0.4
0.8
x
f(x)
10 15 20 25 30 35 40
0.00
0.06
0.12
x
f(x)
H0 : μ1 = μ2 = μ3 …… = μk
H1 : μi ≠ μj for some i and j Average the variances from these
And compare it with the variance from this
ProcessPlan Collect Discuss
ANOVA10 15 20 25 30 35 40
0.0
0.4
0.8
x
f(x)
10 15 20 25 30 35 40
0.0
0.4
0.8
x
f(x)
10 15 20 25 30 35 40
0.00
0.06
0.12
x
f(x)
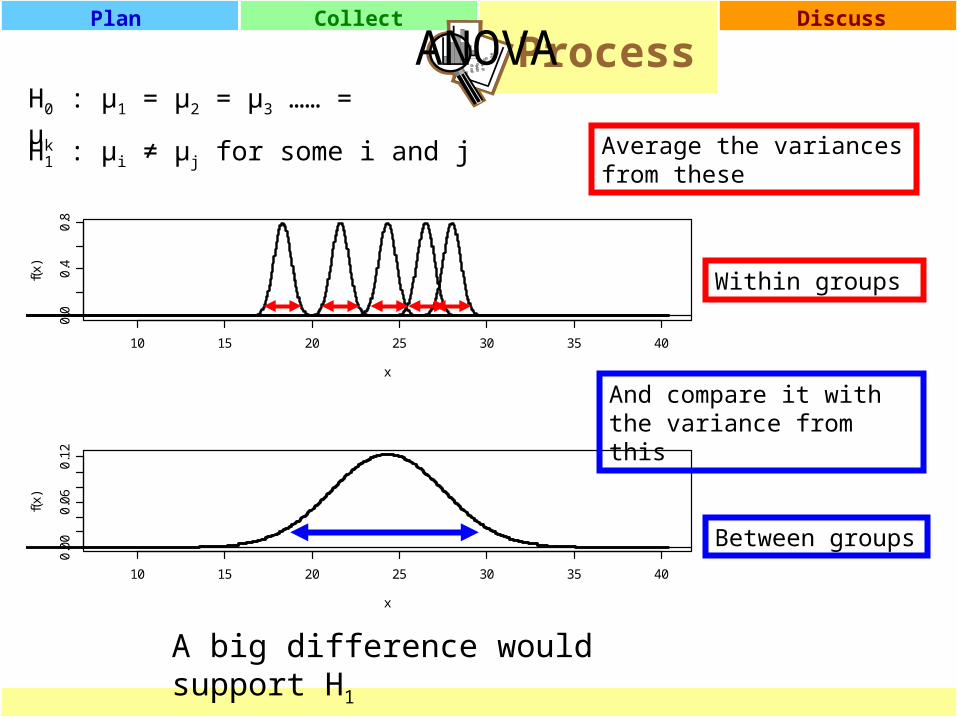
H0 : μ1 = μ2 = μ3 …… = μk
H1 : μi ≠ μj for some i and j Average the variances from these
And compare it with the variance from this
A big difference would support H1
Within groups
Between groups
ProcessPlan Collect Discuss
Which processes
ANOVA
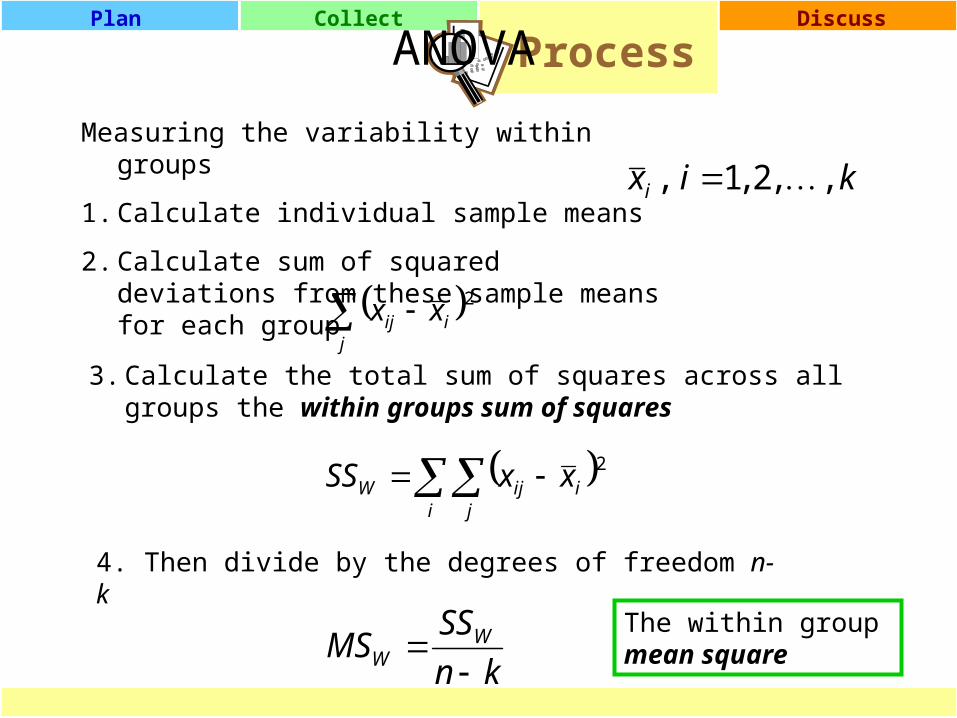
Measuring the variability within groups
1. Calculate individual sample means
2. Calculate sum of squared deviations from these sample means for each group
kixi ,,2,1,
j
iij xx 2
3. Calculate the total sum of squares across all groups the within groups sum of squares
i j
iijW xxSS 2
4. Then divide by the degrees of freedom n-k
kn
SSMS W
W
The within group mean square
ProcessPlan Collect Discuss
Which processes
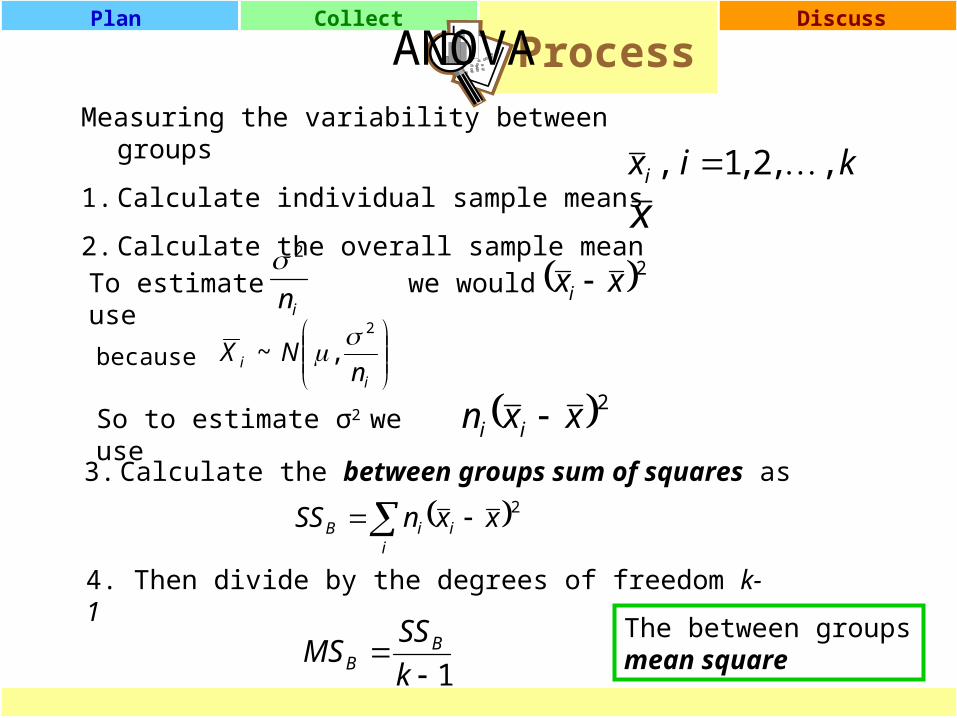
ANOVAMeasuring the variability between groups
1. Calculate individual sample means
2. Calculate the overall sample mean
kixi ,,2,1,
x
3. Calculate the between groups sum of squares as
To estimate we would use in
2
ii n
NX2
,~
2xxi
2xxn ii
because
So to estimate σ2 we use
i
iiB xxnSS 2
4. Then divide by the degrees of freedom k-1
1k
SSMS B
B
The between groups mean square
ProcessPlan Collect Discuss
Which processes
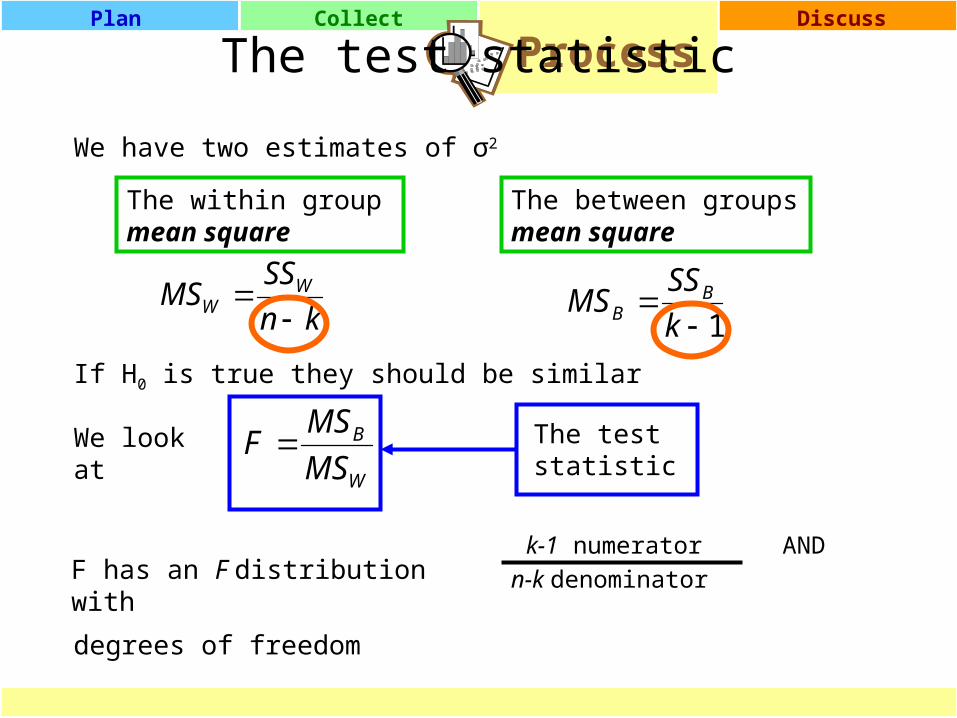
The test statistic
We have two estimates of σ2
1k
SSMS B
B
The within group mean square
The between groups mean square
kn
SSMS W
W
If H0 is true they should be similar
We look at
W
B
MS
MSF The test
statistic
F has an F distribution with k-1 numerator AND
n-k denominator
degrees of freedom
ProcessPlan Collect Discuss
Which processes
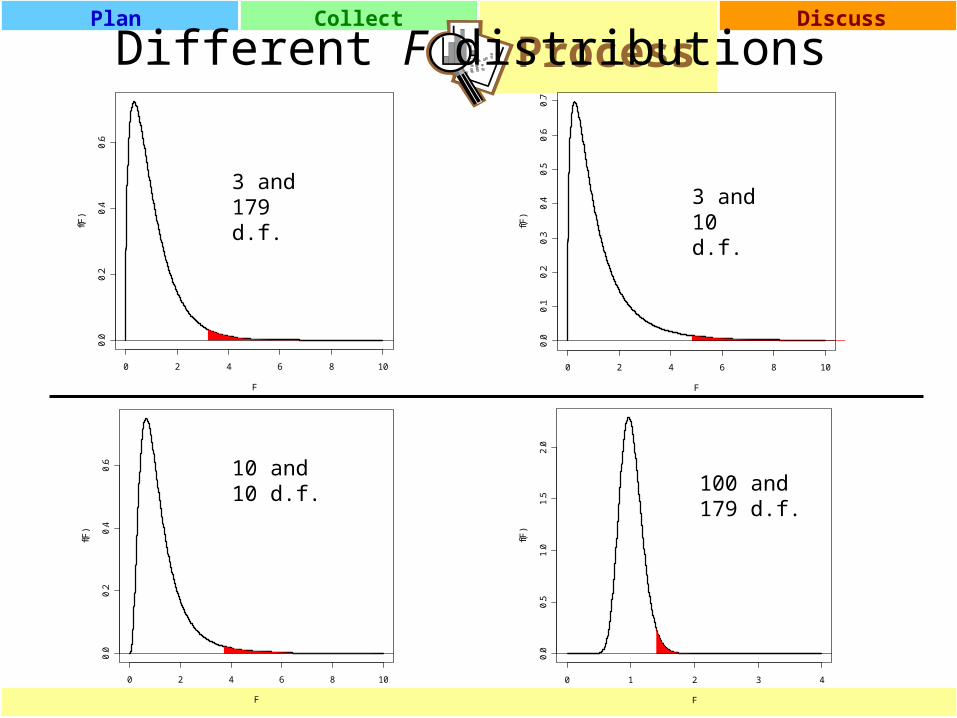
Different F distributions
0 2 4 6 8 10
0.0
0.1
0.2
0.3
0.4
0.5
0.6
0.7
F
f(F)
3 and 179 d.f.
0 2 4 6 8 10
0.0
0.2
0.4
0.6
F
f(F)
3 and 10 d.f.
0 2 4 6 8 10
0.0
0.2
0.4
0.6
F
f(F)
10 and 10 d.f.
0 1 2 3 4
0.0
0.5
1.0
1.5
2.0
F
f(F)
100 and 179 d.f.
Discussion
0 2 4 6 8
0.0
0.2
0.4
0.6
0.8
1.0
F
f(F)
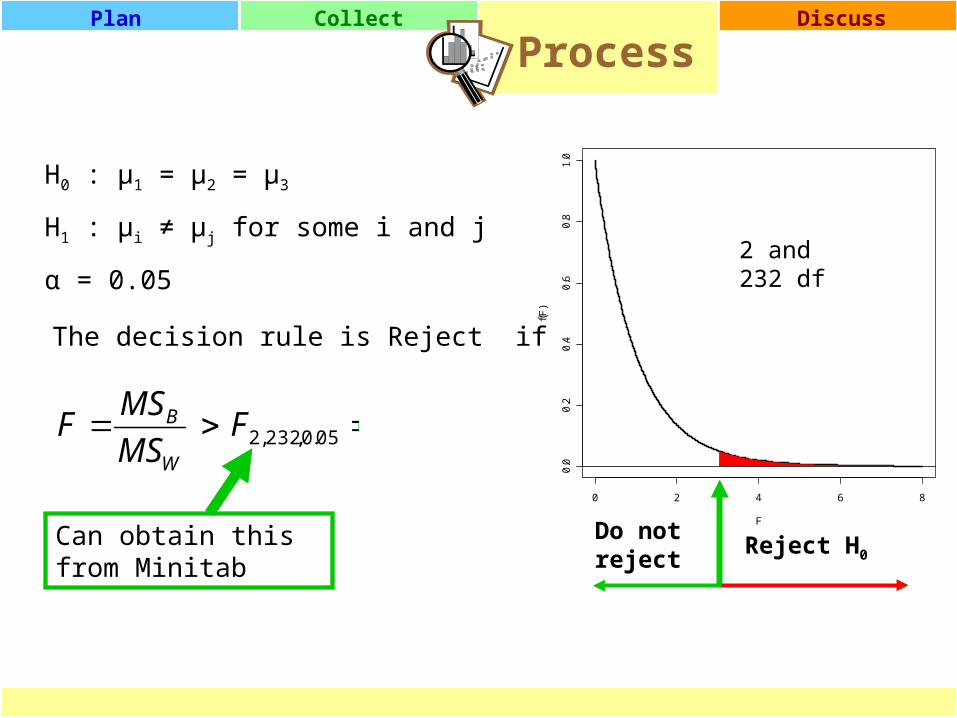
H0 : μ1 = μ2 = μ3
H1 : μi ≠ μj for some i and j
α = 0.05
The decision rule is Reject if
Can obtain this from Minitab
Reject H0
Do not reject
2 and 232 df
03475.305.0,232,2 FMS
MSF
W
B
ProcessPlan Collect Discuss
ProcessPlan Collect Discuss
Which processes
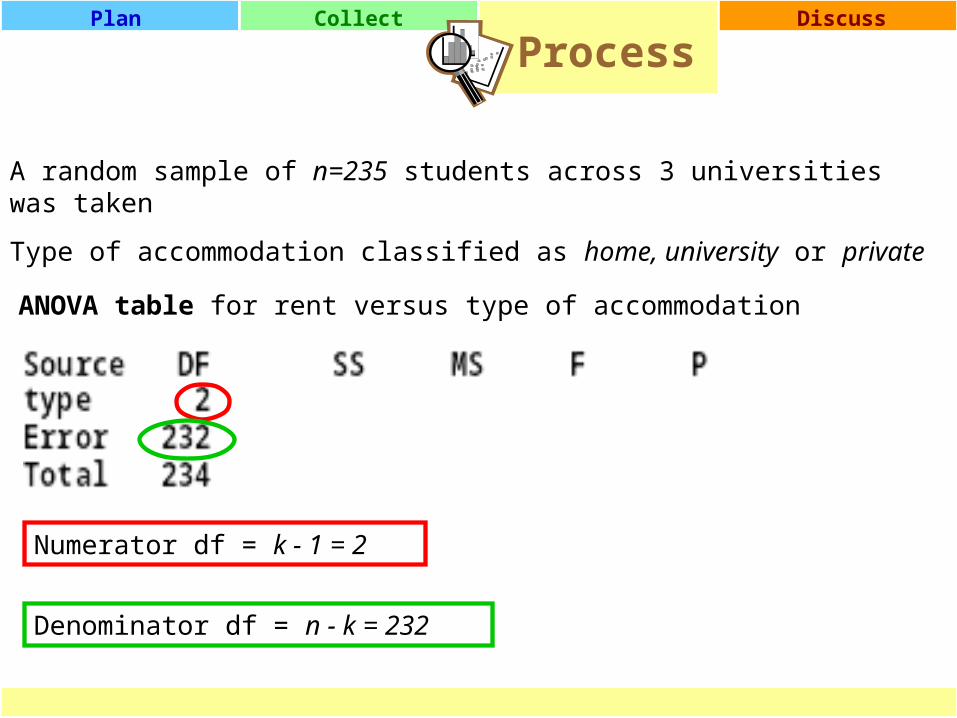
ANOVA table for rent versus type of accommodation
A random sample of n=235 students across 3 universities was taken
Type of accommodation classified as home, university or private
Numerator df = k - 1 = 2
Denominator df = n - k = 232
ProcessPlan Collect Discuss
Which processes
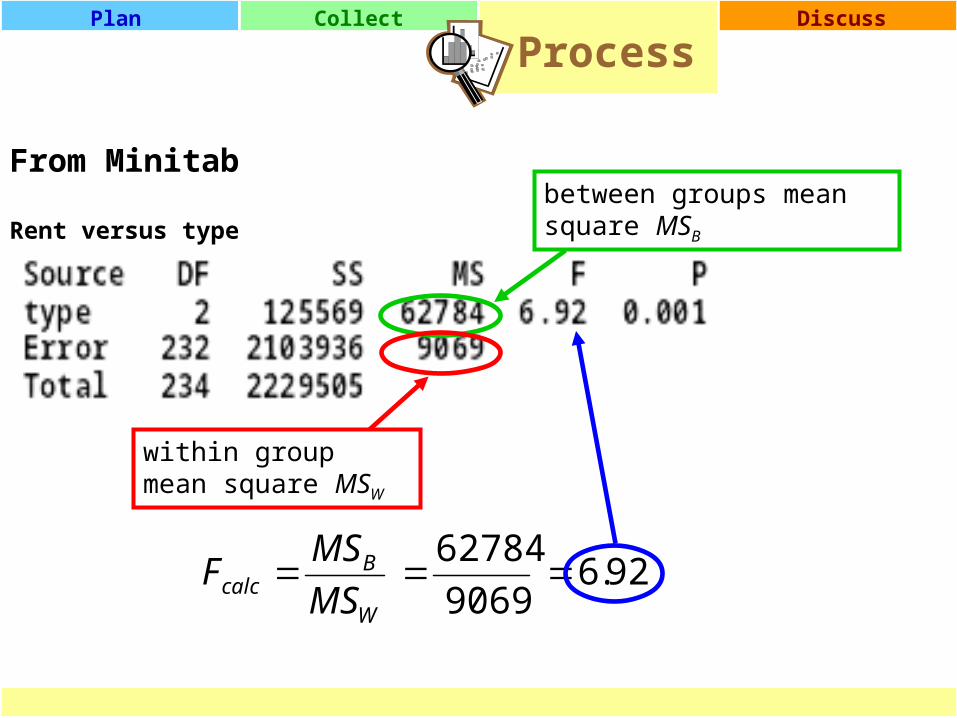
From Minitab
Rent versus type
within group mean square MSW
between groups mean square MSB
92.69069
62784
W
Bcalc MS
MSF
Discuss
Process
Plan Collect Process Discuss
Plan
Collect
DHCycleThe Problem Solving Approach
You arenow here.
DISCUSSDiscussPlan Collect Process
Discussion
0 2 4 6 8
0.0
0.2
0.4
0.6
0.8
1.0
F
f(F)
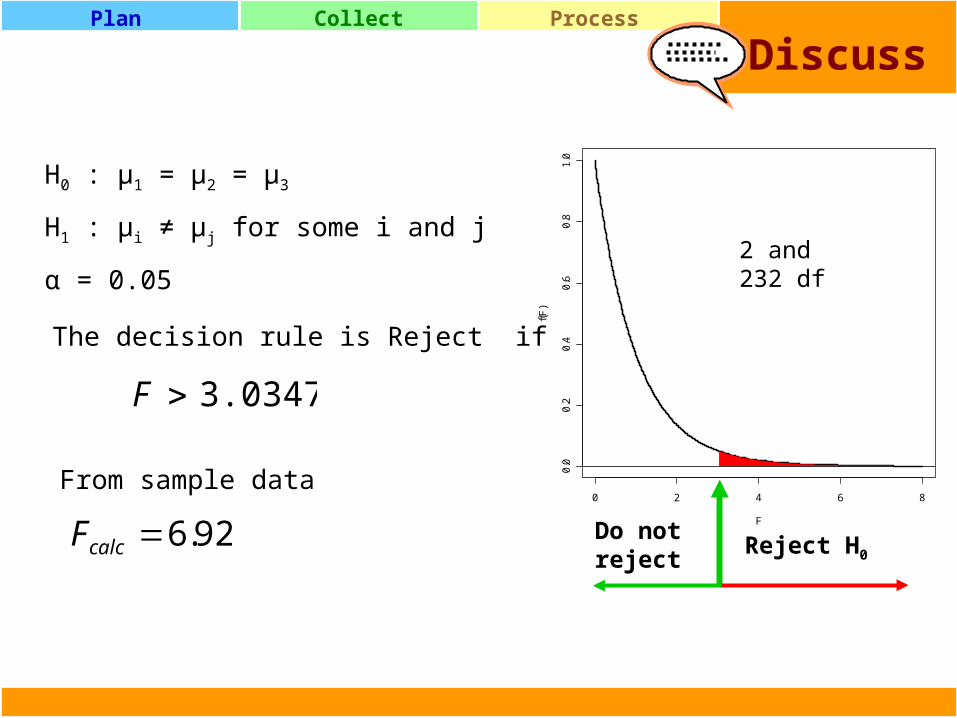
H0 : μ1 = μ2 = μ3
H1 : μi ≠ μj for some i and j
α = 0.05
The decision rule is Reject if
3.03475F
92.6calcF
From sample data
Reject H0
Do not reject
2 and 232 df
DiscussPlan Collect Process
Discussion
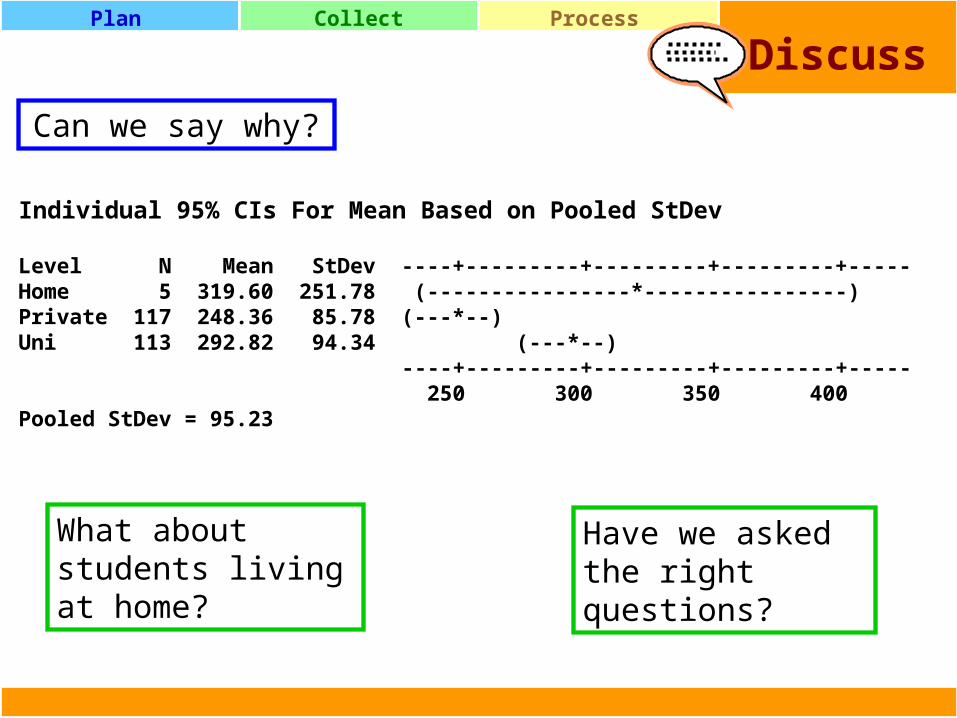
Individual 95% CIs For Mean Based on Pooled StDev
Level N Mean StDev ----+---------+---------+---------+-----Home 5 319.60 251.78 (----------------*----------------)Private 117 248.36 85.78 (---*--)Uni 113 292.82 94.34 (---*--) ----+---------+---------+---------+----- 250 300 350 400Pooled StDev = 95.23
Can we say why?
What about students living at home?
Have we asked the right questions?
DiscussPlan Collect Process
Discussion
Other questions?
• about what is this due to
• about other questions/relationships
What can we conclude?

Discuss
Process
Plan Collect Process Discuss
Plan
Collect
DHCycleThe Problem Solving Approach
You arenow here.
You can build on the first try by
continuing here...
Have you got all the evidence
you want?


