
FULL P
APER
© 2016 WILEY-VCH Verlag GmbH & Co. KGaA, Weinheim (1 of 7) 1601182wileyonlinelibrary.com
Photovoltaic Device with over 5% Efficiency Based on an n-Type Ag2ZnSnSe4 Absorber
Talia Gershon,* Kasra Sardashti, Oki Gunawan, Ravin Mankad, Saurabh Singh, Yun Seog Lee, John A. Ott, Andrew Kummel, and Richard Haight
Dr. T. Gershon, Dr. O. Gunawan, R. Mankad, S. Singh, Dr. Y. S. Lee, Dr. J. A. Ott, Dr. R. HaightIBM T J Watson Research Center1101, Kitchawan Rd, Yorktown Heights, NY 10598, USAE-mail: [email protected]. Sardashti, Prof. A. KummelDepartment of Chemistry and BiochemistryUniversity of CaliforniaSan Diego, 9500 Gilman Dr, CA 92093, USA
DOI: 10.1002/aenm.201601182
to increase the enthalpic penalty for I–II site exchange. In the case of Ag replacing Cu, density functional theory (DFT) calculations indicate that the formation energy for I–II antisite defects is 2.0–3.5× larger in AZTSe than in CZTSe,[7,8] which results in at least an order of magnitude lower density of I–II antisites and less extensive band tailing. This was verified experimentally for (AgxCu1–x)2ZnSnSe4 (ACZTSe) and AZTSe by comparing the measured band gap energy (Eg) with the peak energy of photoluminescence (PL) emission; the large difference in energy is associated with deep band tails.[2,8–10] As Ag is alloyed into CZTSe, the Eg and PL peak energy values converge,[8,9] indicating an improvement in the bulk material quality. While there have been several preliminary reports on the fabrication of AZTSSe,[7,11,12] its performance as a photovoltaic absorber has never before been demonstrated.
AZTSe is a fundamentally interesting material for several key reasons. First, its ntype nature offers the promise of a hybrid, interdiffused pn homojunction with CZTSSe (ptype) as proposed by Yuan et al.[7] Demonstrating the ability to collect photogenerated carriers from AZTSe opens the door to its utilization as an ntype partner material for other ptype absorbers where absorption in AZTSe would supplement that of the ptype material. This has never been demonstrated with common ntype buffers such as CdS and would facilitate novel thin film heterojunction device architectures that are currently inaccessible. Second, the processing temperature for this material is lower than Cu(In,Ga)Se2 (CIGSe) and CZTSSe by at least 100 °C. This makes AZTSe more compatible with nextgeneration and flexible device architectures with a limited thermal budget.
The present investigation demonstrates the firstever photovoltaic device based on AZTSe, and this device exceeds 5% power conversion efficiency. Due to the weakly ntype nature of the absorber, the device structure (back contact, buffer, etc.) must be reengineered. It is shown that the conventional thinfilm device architecture with a Mo back contact and CdS buffer layer (top contact) produces device efficiencies less than 0.5%. An alternative stack with a SnO:F (FTO) back contact and MoO3 buffer is implemented to demonstrate promising initial performance (>5% efficiency). This device, based on the Schottky
The kesterite material Cu2ZnSn(S,Se)4 (CZTSSe) is an attractive earth-abundant semiconductor for photovoltaics. However, the power conversion efficiency is limited by a large density of I–II antisite defects, which cause severe band tailing and open-circuit voltage loss. Ag2ZnSnSe4 (AZTSe) is a promising alternative to CZTSSe with a substantially lower I–II antisite defect density and smaller band tailing. AZTSe is weakly n-type, and this study reports for the first time on how the carrier density is impacted by stoichiom-etry. This study presents the first-ever photovoltaic device based on AZTSe, which exhibits an efficiency of 5.2%, which is the highest value reported for an n-type thin-film absorber. Due to the weakly n-type nature of the absorber, a new architecture is employed (SnO:F/AZTSe/MoO3/ITO) to replace conven-tional contacts and buffer materials. Using this platform, it is shown that the band tailing parameter in AZTSe more closely resembles that of CIGSe than CZTSSe, underscoring the strong promise of this absorber. In demonstrating the ability to collect photogenerated carriers from AZTSe, this study paves the way for novel thin-film heterojunction architectures where light absorption in the n-type device layer can supplement absorption in the p-type layer as opposed to producing a net optical loss.
1. Introduction
Cu2ZnSn(S,Se)4 (CZTSSe) has received significant attention in recent years as an attractive, nontoxic thin film photovoltaic (PV) absorber. While a promising efficiency of 12.6%[1] has been demonstrated with this absorber, further advancements have been limited by a deficit in the opencircuit voltage (VOC).[2] Indepth materials and device characterization point to a large density of bulk defect states and significant Cu–Zn disorder, leading to large deficit in photovoltaic performance.[2–4] Recently, variants of CZTSSe have been proposed where either Zn or Cu is replaced by an element with a larger covalent radius (e.g., Cu2CdSn(S,Se)4
[5] or Ag2ZnSn(S,Se)4[6] (AZTSSe))
Adv. Energy Mater. 2016, 1601182
www.MaterialsViews.comwww.advenergymat.de

FULL
PAPER
© 2016 WILEY-VCH Verlag GmbH & Co. KGaA, Weinheim1601182 (2 of 7) wileyonlinelibrary.com
architecture, is used as a platform to demonstrate that AZTSe has a band tailing parameter more closely resembling that of CIGS than CZTSSe, and therefore AZTSe has the potential to achieve similarly high efficiencies. This work contributes to new fundamental understanding of some of the factors that impact the optoelectronic properties of AZTSe. It also provides a proofofconcept that photogenerated carriers are readily extracted from AZTSe, thus paving the way for new and previouslyinaccessible thinfilm heterojunction photovoltaic architectures.
2. Methods
FTOcoated glass substrates (TEC 7, sheet resistance ≈7 Ω sq−1) were obtained from SigmaAldrich and cleaned using a Nochromix/sulfuric acid solution followed by rinsing in DI water. The substrates were then loaded into an ultrahigh vacuum (UHV) chamber with base pressure of 10−9 Torr. AZTSe thin films were coevaporated from high purity (5N or 6N) elemental Ag, Zn, Sn, and cracked Se sources. The substrate was held at ≈350 °C during growth. Following deposition, the samples were annealed at ≈470 °C for 2 min in a Se overpressure.[8] The CZTSSe sample discussed at the end of the manuscript was prepared using a hydrazinebased solution process in a manner described previously.[1,13] The metal ratios were determined via Xray fluorescence (XRF) measurements, calibrated using proton induced Xray emission (PIXE) analysis, where the reported value represents the average measurement. A 20 nm film of MoO3 was then thermally evaporated as the high work function Schottky top contact, followed by a sputtered In2O3:Sn (ITO) top electrode and a Ni/Al collection grid. For comparison, in some samples the FTO electrode was replaced with a Mo electrode with all other process parameters remaining unchanged (i.e., absorber layer composition, annealing temperature). In other samples, a standard CdS layer (grown by chemical bath deposition)[1] and a ZnO/ITO top electrode were employed as a comparison with the FTO/AZTSe/MoO3 device. The current–density versus voltage (J–V) response of the solar cells was measured in a 1000 W Newport solar simulator, calibrated with a Si reference cell. The measured shortcircuit current density (JSC) from the J–V measurement was in close agreement with the JSC calculated from the external quantum efficiency (EQE) response (measured using lockin detection). The device area was 0.45 cm2.
The carrier type of AZTSe was determined via Hall effect measurements as well as femtosecond ultraviolet photoelectron spectroscopy (fsUPS) measurements. These were performed in a manner described previously.[14] The photoelectron spectra were collected from the sample under excitation with 800 nm light pulses that flatten the AZTSe bands; thus, the flatband location of the valence band maximum relative to the Fermi level is measured. In addition, the magnitude and direction of the band bending can also be determined by comparing unexcited and excited spectra. The sample illumination area in the UPS measurement is ≈1 mm × 1.5 mm. The grain size in these samples is ≈1–2 μm, therefore we expect that a 1.5 mm2 illumination area will include ≈106 grains, and that the resulting UPS measurement is averaged over many grains. The Hall measurements were performed in a recently developed rotating parallel
dipole line Hall system that generates a pure harmonic and unidirectional ac magnetic field and performs lockin detection of the Hall signal with the field oscillation as the reference frequency.[15] The Hall samples are configured in the standard van der Pauw fourterminal arrangement with dimensions of ≈5 mm × 5 mm with fourterminal contact using evaporated aluminum.
Samples for transmission electron microscopy (TEM) were prepared using an FEI Helios dual beam focused ion beam (FIB) tool. FIB sections were capped prior to FIB preparation with nonreactive barrier materials, and low dose methods were employed during the final polish. FIB sections were ex situ lifted out onto a carbon support grid. TEM was performed on a JEOL 3000F and energydispersive xray spectroscopy (EDX), chemical analysis completed using an EMISPEC system.
In order to determine the electronic characteristics of the back contact interfaces crosssectional Kelvin probe force microcopy (KPFM) measurements were performed on AZTSe devices grown on both Mo and FTO. Crosssections were prepared by cryogenic focused ion beam (CryoFIB) at neargrazing ion beam angle of incidence (incidence angle ≈5°). During the ion beam milling samples were cooled down to 90 K in order to minimize local heating and Ga implantation. Details the crosssectioning process using CryoFIB have been given elsewhere.[16] KPFM measurements were performed using a Keysight 5500 atomic force microscope (AFM) with the capability to measure topography and surface potential signal simultaneously using dual lockin amplifier configuration. Further details regarding the KPFM measurements are discussed in the Supporting Information. In order to minimize the in situ oxidation throughout the measurements, all KPFM measurements were performed in an AFM environmental chamber that is continuously purged with ultrahigh purity Ar.
3. Results and Discussion
Figure 1a presents a representative fsUPS measurement of an AZTSe thin film (Ag/Sn ≈1.85, Zn/Sn ≈1.15). The AZTSe valence band maximum is located 1.1 ± 0.1 eV below the Fermi level. Considering that AZTSe has a band gap of ≈1.33–1.35 eV,[8,11] this measurement indicates that AZTSe is ntype. In addition, a 190 meV downward shift of the spectrum under photoexcitation with an intense pulse of 800 nm photons indicates the presence of upward band bending near the surface, which is commonly observed in ntype materials. Hall measurements performed on AZTSe thin films are consistent with the fsUPS measurements. Measurements from multiple samples indicate a carrier density of ≈5 × 10¹⁰–5 × 1011 cm−3 and an electron mobility of ≈90–100 cm2 V−1 s−1. This high mobility is consistent with the strong and clean Hall signal oscillation (under oscillating magnetic field in the Hall measurement) and with electrons being the majority carrier. Since most materials have a smaller electron effective mass (m*) than hole effective mass, the electron mobility is typically higher since mobility μ is proportional to 1/m*. The observation of ntype behavior in AZTSe is in contrast to the conventional ptype behavior in CZTSSe and CIGSe, and warrants additional discussion.
Adv. Energy Mater. 2016, 1601182
www.MaterialsViews.comwww.advenergymat.de

FULL P
APER
© 2016 WILEY-VCH Verlag GmbH & Co. KGaA, Weinheim (3 of 7) 1601182wileyonlinelibrary.com
In the CZTSSe material system, the carrier density can be controlled by adjusting the relative metal concentrations, i.e., Cu/(Zn+Sn).[4] In particular, it is found experimentally that increasing the copper content tends to increase the carrier concentration.[17] Increasing Cu content is believed to promote the formation of free carriergenerating defects such as CuZn acceptors[18] or other extended antisites.[19] For these reasons, the electronic properties of AZTSe were examined as a function of metal composition. Based on firstprinciples calculations, the dominant defect in AZTSe is predicted to be the SnZn donor for lowtomoderate electron concentrations.[7] Therefore, increasing the Sn concentration relative to the other metals is expected to increase the carrier density. Comparing the position of the Fermi level relative to the valence band (VB) (Figure 1b), as derived from fsUPS measurements, showed that the Fermi level moves away from the VB edge (i.e., sample becomes more ntype) as the Sn/(Zn+Ag) ratio increases. The fsUPS spectra from which the data points in Figure 1b were generated can be found in the Supporting Information (Figure S1). All AZTSe samples measured to date have an intrinsic carrier density of roughly 1010–1012 cm−3, which indicates that a pin structure is likely the best device architecture for AZTSe; this is a clear area for future work.
Due to the ntype nature of AZTSe, devices prepared using a standard device architecture (Mo/AZTSe/CdS/ZnO/ITO) display poor performance characteristics (0.1% efficiency,
Figure 1c). Severe shunting occurs due to the absence of a significant depletion region, consistent with the formation of a weak n/n− junction. Therefore, the highwork function material MoO3 was utilized as a potential Schottkytype contact for AZTSe heterojunctions, keeping all other device layers constant. Figure 2a presents a crosssectional image of a Mo/AZTSe/MoO3/ITO device containing an AZTSe layer that was annealed at 470 °C following deposition at 350 °C. An image of a similar device containing an asgrown absorber can be found in the Supporting Information (Figure S2). Annealing coarsens the AZTSe grains, as expected, and also creates a thin (≈150 nm) MoSe2 layer at the interface with the Mo as well as voids near the back contact (voids are absent prior to annealing, Figure 2a, Supporting Information). Voiding at the back interface has previously been observed in annealed CZTSSe thin films.[20] Notably, while the grain size improves significantly with annealing, the performance decreases (Figure 2b) due to the creation of a nonOhmic back contact with the underlying MoSe2, resulting in a “doublediode” characteristic in the J–V response that coincides with a strong degradation of the fill factor (FF). Therefore, the efficiency (≈0.8%) of the sample without annealing the absorber appears to outperform a device with an annealed absorber (≈0.1%) due to the introduction of an electronblocking MoSe2 layer (discussed further below) and significant void formation.
These studies motivate a transition away from the use of a Mo back contact. Of the known electrode materials, FTO
Adv. Energy Mater. 2016, 1601182
www.MaterialsViews.comwww.advenergymat.de
Figure 1. Bulk electronic properties of AZTSe. a) Sample fs-UPS spectrum of AZTSe showing that the Fermi level is ≈1.1 eV from the valence edge. Blue spectrum is collected from AZTSe without photoexcitation, red spectrum is excited with a pulse of 800 nm light. The downward shift of the red spectrum relative to the black indicates upward (n-type) band bending (inset). b) Position of the Fermi level of AZTSe as a function of the Sn/(Zn+Ag) ratio in the absorber layer. c) Light (orange) and dark (green) J–V curve of AZTSe device prepared with a standard thin film architecture: Mo/AZTSe/CdS/ZnO/ITO.
Figure 2. Characterization of AZTSe devices grown on Mo with ITO/MoO3 top contacts. a) SEM cross-section of AZTSe device with an annealed absorber (470 °C, Ag/Sn ≈1.86, Zn/Sn ≈1.22); annealing AZTSe films on Mo creates a MoSe2 layer and voids near the rear interface between Mo and AZTSe. b) J–V data in the dark and under illumination for devices with the as-made and annealed absorbers. Ag/Sn ≈1.86, Zn/Sn ≈1.22.
FULL
PAPER
© 2016 WILEY-VCH Verlag GmbH & Co. KGaA, Weinheim1601182 (4 of 7) wileyonlinelibrary.com
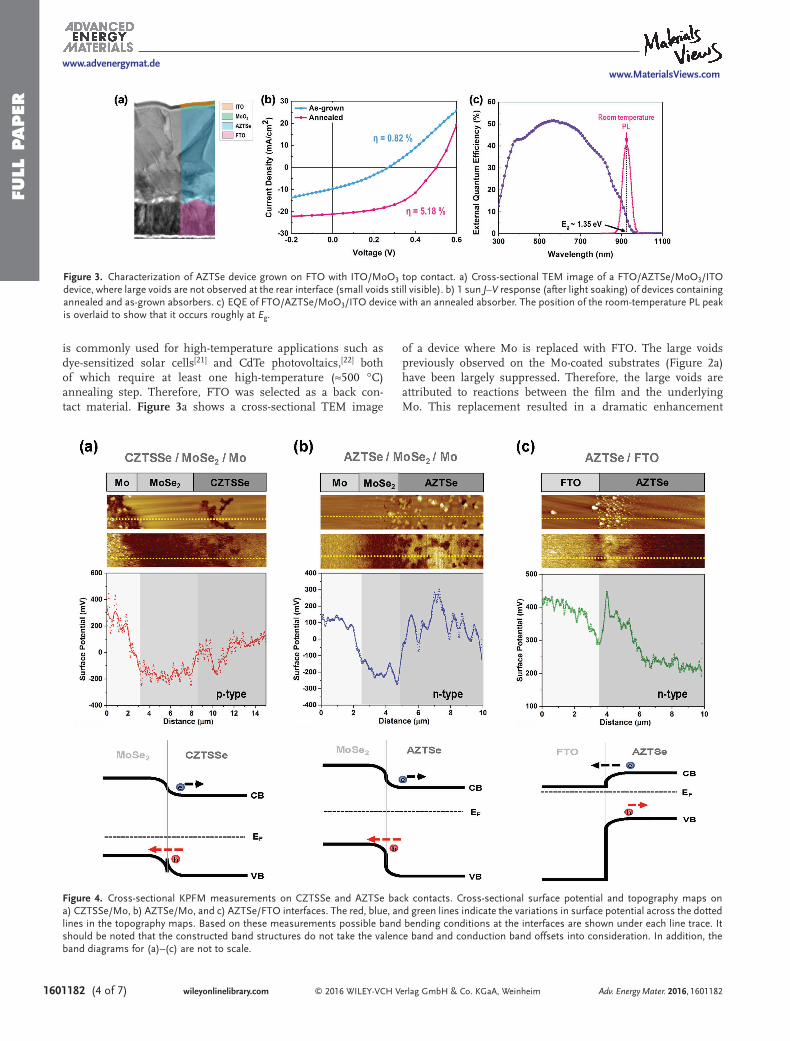
is commonly used for hightemperature applications such as dyesensitized solar cells[21] and CdTe photovoltaics,[22] both of which require at least one hightemperature (≈500 °C) annealing step. Therefore, FTO was selected as a back contact material. Figure 3a shows a crosssectional TEM image
of a device where Mo is replaced with FTO. The large voids previously observed on the Mocoated substrates (Figure 2a) have been largely suppressed. Therefore, the large voids are attributed to reactions between the film and the underlying Mo. This replacement resulted in a dramatic enhancement
Adv. Energy Mater. 2016, 1601182
www.MaterialsViews.comwww.advenergymat.de
Figure 3. Characterization of AZTSe device grown on FTO with ITO/MoO3 top contact. a) Cross-sectional TEM image of a FTO/AZTSe/MoO3/ITO device, where large voids are not observed at the rear interface (small voids still visible). b) 1 sun J–V response (after light soaking) of devices containing annealed and as-grown absorbers. c) EQE of FTO/AZTSe/MoO3/ITO device with an annealed absorber. The position of the room-temperature PL peak is overlaid to show that it occurs roughly at Eg.
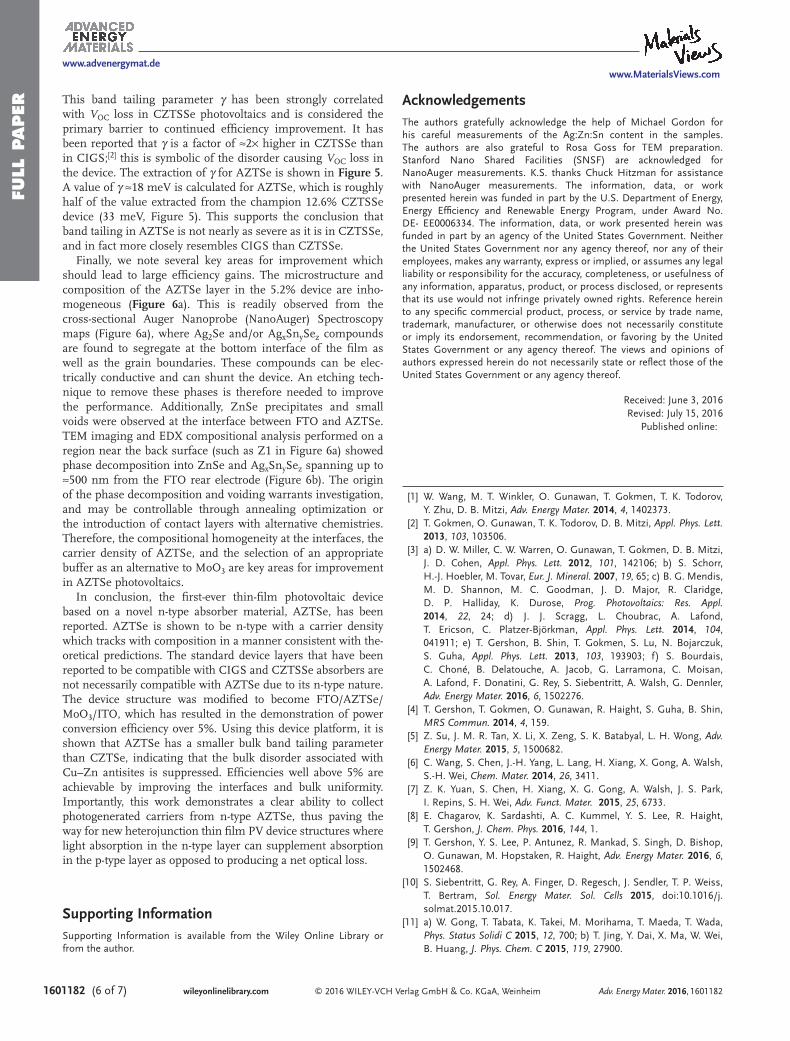
Figure 4. Cross-sectional KPFM measurements on CZTSSe and AZTSe back contacts. Cross-sectional surface potential and topography maps on a) CZTSSe/Mo, b) AZTSe/Mo, and c) AZTSe/FTO interfaces. The red, blue, and green lines indicate the variations in surface potential across the dotted lines in the topography maps. Based on these measurements possible band bending conditions at the interfaces are shown under each line trace. It should be noted that the constructed band structures do not take the valence band and conduction band offsets into consideration. In addition, the band diagrams for (a)–(c) are not to scale.

FULL P
APER
© 2016 WILEY-VCH Verlag GmbH & Co. KGaA, Weinheim (5 of 7) 1601182wileyonlinelibrary.com
in performance to 5.2% (Figure 3b): VOC = 504 mV, JSC = 21 mA cm−2, FF = 48.7% for samples containing an annealed absorber. Here, the samples on FTO displayed the expected trend, which is that the performance of the sample with the annealed absorber was superior to than that of the asmade absorber. The poor FF is strongly related to a high seriesresistance from the insulating MoO3 layer, FTO bottomelectrode, contact resistances, and also potentially the high resistivity of AZTSe. While MoO3 has a high work function, exposure to moisture is known to decrease this value,[23] therefore, a more stable contact material should give better device results. Optimization of the buffer and contact layers are thus an obvious area for future improvement. It is noted that devices appear to improve with light soaking (Supporting Information, Figure S3). The performance characteristics displayed in Figure 3b are for samples which have been lightsoaked for at least 60 s. Figure 3c shows the EQE response of the device, where the roomtemperature PL peak is overlaid, showing that the PL occurs at Eg. The limited EQE (≈50%) is further indication that at least one of the interfaces may be restricting carrier collection. It is also noted that the EQE has a spectral feature in the range of 380–450 nm, which could be related to absorption by ZnSe secondary phases (similar to what has been observed in the CZTSSe system),[24] future measurements will examine this possibility more closely.
To further elucidate the electrostatics at the back contact, topography and surface potential maps measured by KPFM on CZTSSe/Mo, AZTSe/Mo and AZTSe/FTO interfaces are shown in Figure 4. At the interface between CZTSSe and Mo (Figure 4a), a thin layer of MoSe2 is formed during sample processing, which induces upward band bending near the back electrode due to the high work function of MoSe2 (details about the KPFM measurement and how it was used to estimate band bending are given in Supporting Information). Since CZTSSe is ptype, the high work function of MoSe2 and the upward band bending in CZTSSe at this interface aid in the collection of holes. In contrast, since AZTSe is ntype, the presence of a high work function MoSe2 between AZTSe and Mo creates a barrier to electron transport (Figure. 4b) and is therefore a nonOhmic contact. When Mo is replaced by FTO (Figure 4c), the lower work function of FTO assists electron extraction from AZTSe by inducing downward band bending in the absorber close to the AZTSe/FTO interface. We note that the published values of the work functions for MoSe2 and FTO vary depending on sample history, processing, and composition,[25] the values reported here represent the average values measured for these samples using KPFM. The surface potential spike at the AZTSe/FTO interface in Figure 4c is likely due to the presence of secondary phases such as ZnSe or AgxSnySez near the back contact, as discussed further below.
From the longwavelength portion of the EQE spectrum, the absorber band tailing parameter, γ,[2] can be calculated from the relation
exp2
5 /2g photon
5/4E Eα
π γ∝ −
−
(1)
where α is the optical absorption coefficient (extracted from the EQE spectrum) and Ephoton is the energy of incident photon.
Adv. Energy Mater. 2016, 1601182
www.MaterialsViews.comwww.advenergymat.de
Figure 5. Extraction of the band tailing parameter in CZTSSe and AZTSe devices. The long-wavelength EQE is converted to an absorption coef-ficient and fitted with the γOPT model to extract the tailing parameter for AZTSe and CZTSSe devices, as given by Gokmen et al.[2]
Figure 6. Chemical microanalysis of compositional inhomogeneity in AZTSe device. a) SEM image and elemental NanoAuger maps of Ag, Zn, Sn, and Se from an AZTSe film grown on FTO substrates. The NanoAuger cross-section was prepared by mechanically cleaving the sample. Nonuniform compositions and voiding are visible at the front and rear interface of the film as well as at the grain boundaries. b) TEM image and EDX measurements near the interface with FTO.
FULL
PAPER
© 2016 WILEY-VCH Verlag GmbH & Co. KGaA, Weinheim1601182 (6 of 7) wileyonlinelibrary.com
This band tailing parameter γ has been strongly correlated with VOC loss in CZTSSe photovoltaics and is considered the primary barrier to continued efficiency improvement. It has been reported that γ is a factor of ≈2× higher in CZTSSe than in CIGS;[2] this is symbolic of the disorder causing VOC loss in the device. The extraction of γ for AZTSe is shown in Figure 5. A value of γ ≈18 meV is calculated for AZTSe, which is roughly half of the value extracted from the champion 12.6% CZTSSe device (33 meV, Figure 5). This supports the conclusion that band tailing in AZTSe is not nearly as severe as it is in CZTSSe, and in fact more closely resembles CIGS than CZTSSe.
Finally, we note several key areas for improvement which should lead to large efficiency gains. The microstructure and composition of the AZTSe layer in the 5.2% device are inhomogeneous (Figure 6a). This is readily observed from the crosssectional Auger Nanoprobe (NanoAuger) Spectroscopy maps (Figure 6a), where Ag2Se and/or AgxSnySez compounds are found to segregate at the bottom interface of the film as well as the grain boundaries. These compounds can be electrically conductive and can shunt the device. An etching technique to remove these phases is therefore needed to improve the performance. Additionally, ZnSe precipitates and small voids were observed at the interface between FTO and AZTSe. TEM imaging and EDX compositional analysis performed on a region near the back surface (such as Z1 in Figure 6a) showed phase decomposition into ZnSe and AgxSnySez spanning up to ≈500 nm from the FTO rear electrode (Figure 6b). The origin of the phase decomposition and voiding warrants investigation, and may be controllable through annealing optimization or the introduction of contact layers with alternative chemistries. Therefore, the compositional homogeneity at the interfaces, the carrier density of AZTSe, and the selection of an appropriate buffer as an alternative to MoO3 are key areas for improvement in AZTSe photovoltaics.
In conclusion, the firstever thinfilm photovoltaic device based on a novel ntype absorber material, AZTSe, has been reported. AZTSe is shown to be ntype with a carrier density which tracks with composition in a manner consistent with theoretical predictions. The standard device layers that have been reported to be compatible with CIGS and CZTSSe absorbers are not necessarily compatible with AZTSe due to its ntype nature. The device structure was modified to become FTO/AZTSe/MoO3/ITO, which has resulted in the demonstration of power conversion efficiency over 5%. Using this device platform, it is shown that AZTSe has a smaller bulk band tailing parameter than CZTSe, indicating that the bulk disorder associated with Cu–Zn antisites is suppressed. Efficiencies well above 5% are achievable by improving the interfaces and bulk uniformity. Importantly, this work demonstrates a clear ability to collect photogenerated carriers from ntype AZTSe, thus paving the way for new heterojunction thin film PV device structures where light absorption in the ntype layer can supplement absorption in the ptype layer as opposed to producing a net optical loss.
Supporting InformationSupporting Information is available from the Wiley Online Library or from the author.
AcknowledgementsThe authors gratefully acknowledge the help of Michael Gordon for his careful measurements of the Ag:Zn:Sn content in the samples. The authors are also grateful to Rosa Goss for TEM preparation. Stanford Nano Shared Facilities (SNSF) are acknowledged for NanoAuger measurements. K.S. thanks Chuck Hitzman for assistance with NanoAuger measurements. The information, data, or work presented herein was funded in part by the U.S. Department of Energy, Energy Efficiency and Renewable Energy Program, under Award No. DE- EE0006334. The information, data, or work presented herein was funded in part by an agency of the United States Government. Neither the United States Government nor any agency thereof, nor any of their employees, makes any warranty, express or implied, or assumes any legal liability or responsibility for the accuracy, completeness, or usefulness of any information, apparatus, product, or process disclosed, or represents that its use would not infringe privately owned rights. Reference herein to any specific commercial product, process, or service by trade name, trademark, manufacturer, or otherwise does not necessarily constitute or imply its endorsement, recommendation, or favoring by the United States Government or any agency thereof. The views and opinions of authors expressed herein do not necessarily state or reflect those of the United States Government or any agency thereof.
Received: June 3, 2016Revised: July 15, 2016
Published online:
[1] W. Wang, M. T. Winkler, O. Gunawan, T. Gokmen, T. K. Todorov, Y. Zhu, D. B. Mitzi, Adv. Energy Mater. 2014, 4, 1402373.
[2] T. Gokmen, O. Gunawan, T. K. Todorov, D. B. Mitzi, Appl. Phys. Lett. 2013, 103, 103506.
[3] a) D. W. Miller, C. W. Warren, O. Gunawan, T. Gokmen, D. B. Mitzi, J. D. Cohen, Appl. Phys. Lett. 2012, 101, 142106; b) S. Schorr, H.-J. Hoebler, M. Tovar, Eur. J. Mineral. 2007, 19, 65; c) B. G. Mendis, M. D. Shannon, M. C. Goodman, J. D. Major, R. Claridge, D. P. Halliday, K. Durose, Prog. Photovoltaics: Res. Appl. 2014, 22, 24; d) J. J. Scragg, L. Choubrac, A. Lafond, T. Ericson, C. Platzer-Björkman, Appl. Phys. Lett. 2014, 104, 041911; e) T. Gershon, B. Shin, T. Gokmen, S. Lu, N. Bojarczuk, S. Guha, Appl. Phys. Lett. 2013, 103, 193903; f) S. Bourdais, C. Choné, B. Delatouche, A. Jacob, G. Larramona, C. Moisan, A. Lafond, F. Donatini, G. Rey, S. Siebentritt, A. Walsh, G. Dennler, Adv. Energy Mater. 2016, 6, 1502276.
[4] T. Gershon, T. Gokmen, O. Gunawan, R. Haight, S. Guha, B. Shin, MRS Commun. 2014, 4, 159.
[5] Z. Su, J. M. R. Tan, X. Li, X. Zeng, S. K. Batabyal, L. H. Wong, Adv. Energy Mater. 2015, 5, 1500682.
[6] C. Wang, S. Chen, J.-H. Yang, L. Lang, H. Xiang, X. Gong, A. Walsh, S.-H. Wei, Chem. Mater. 2014, 26, 3411.
[7] Z. K. Yuan, S. Chen, H. Xiang, X. G. Gong, A. Walsh, J. S. Park, I. Repins, S. H. Wei, Adv. Funct. Mater. 2015, 25, 6733.
[8] E. Chagarov, K. Sardashti, A. C. Kummel, Y. S. Lee, R. Haight, T. Gershon, J. Chem. Phys. 2016, 144, 1.
[9] T. Gershon, Y. S. Lee, P. Antunez, R. Mankad, S. Singh, D. Bishop, O. Gunawan, M. Hopstaken, R. Haight, Adv. Energy Mater. 2016, 6, 1502468.
[10] S. Siebentritt, G. Rey, A. Finger, D. Regesch, J. Sendler, T. P. Weiss, T. Bertram, Sol. Energy Mater. Sol. Cells 2015, doi:10.1016/j.solmat.2015.10.017.
[11] a) W. Gong, T. Tabata, K. Takei, M. Morihama, T. Maeda, T. Wada, Phys. Status Solidi C 2015, 12, 700; b) T. Jing, Y. Dai, X. Ma, W. Wei, B. Huang, J. Phys. Chem. C 2015, 119, 27900.
Adv. Energy Mater. 2016, 1601182
www.MaterialsViews.comwww.advenergymat.de
FULL P
APER
© 2016 WILEY-VCH Verlag GmbH & Co. KGaA, Weinheim (7 of 7) 1601182wileyonlinelibrary.comAdv. Energy Mater. 2016, 1601182
www.MaterialsViews.comwww.advenergymat.de
[12] a) W. Li, X. Liu, H. Cui, S. Huang, X. Hao, J. Alloys Compd. 2015, 625, 277; b) S. Nakamura, T. Maeda, T. Tabata, T. Wada, 2011 37th IEEE Photovoltaic Specialists Conf. (PVSC), Seattle, WA, USA, July, 2011.
[13] T. K. Todorov, J. Tang, S. Bag, O. Gunawan, T. Gokmen, Y. Zhu, D. B. Mitzi, Adv. Energy Mater. 2013, 3, 34.
[14] R. Haight, X. Shao, W. Wang, D. B. Mitzi, Appl. Phys. Lett. 2014, 104, 033902.
[15] a) O. Gunawan, T. Gokmen, US Patent 9,041,389 2015; b) O. Gunawan, Y. Virgus, K. F. Tai, Appl. Phys. Lett. 2015, 106, 062407.
[16] K. Sardashti, R. Haight, R. Anderson, M. Contreras, B. Fruhberger, A. C. Kummel, ACS Appl. Mater. Interfaces, 2016, 8, 14994.
[17] a) D. M. Bishop, B. E. McCandless, R. Haight, D. B. Mitzi, R. W. Birkmire, IEEE J. Photovoltaics 2014, 5, 390; b) A. Nagaoka, H. Miyake, T. Taniyama, K. Kakimoto, K. Yoshino, Appl. Phys. Lett. 2013, 103, 112107; c) O. Gunawan, T. Gokmen, D. B. Mitzi, J. Appl. Phys. 2014, 116, 084504.
[18] S. Chen, A. Walsh, X.-G. Gong, S.-H. Wei, Adv. Mater. 2013, 25, 1522.
[19] P. Zawadzki, A. Zakutayev, S. Lany, Phys. Rev. B 2015, 92, 201204.
[20] a) R. Chalapathy, G. S. Jung, B. T. Ahn, Sol. Energy Mater. Sol. Cells 2011, 95, 3216; b) S. Pawar, A. Inamdar, K. Gurav, S. Shin, Y. Jo, J. Kim, H. Im, J. H. Kim, Vacuum 2014, 104, 57.
[21] A. Hagfeldt, G. Boschloo, L. Sun, L. Kloo, H. Pettersson, Chem. Rev. 2010, 110, 6595.
[22] J. Britt, C. Ferekides, Appl. Phys. Lett. 1993, 62, 2851.[23] a) I. Irfan, A. J. Turinske, Z. Bao, Y. Gao, Appl. Phys. Lett. 2012, 101,
093305; b) J. Subbiah, F. So, Appl. Phys. Lett. 2010, 96, 243307.[24] D. Colombara, E. V. C. Robert, A. Crossay, A. Taylor, M. Guennou,
M. Arasimowicz, J. C. B. Malaquias, R. Djemour, P. J. Dale, Sol. Energy Mater. Sol. Cells 2014, 123, 220.
[25] a) T. Shimada, F. S. Ohuchi, B. A. Parkinson, Jpn Appl. Phys. Lett. 1994, 33, 2696; b) M. Helander, M. Greiner, Z. Wang, W. Tang, Z. Lu, J. Vac. Sci. Technol., A 2011, 29, 011019; c) P. M. Salomé, V. Fjallstrom, A. Hultqvist, P. Szaniawski, U. Zimmermann, M. Edoff, Prog. Photovoltaics: Res. Appl. 2014, 22, 83; d) P. Rostan, J. Mattheis, G. Bilger, U. Rau, J. Werner, Thin Solid Films 2005, 480, 67; e) D. Abou-Ras, G. Kostorz, D. Bremaud, M. Kälin, F. Kurdesau, A. Tiwari, M. Döbeli, Thin Solid Films 2005, 480, 433; f) T. Gershon, C. Hamann, M. Hopstaken, Y. S. Lee, B. Shin, R. Haight, Adv. Energy Mater. 2015, 5; g) A. Andersson, N. Johansson, P. Broms, N. Yu, D. Lupo, W. R. Salaneck, Adv. Mater. 1998, 10, 859.


