
i
PHOTOCATALYTIC CARBON DIOXIDE REDUCTION IN LIQUID MEDIA
A THESIS SUBMITTED TO THE GRADUATE SCHOOL OF NATURAL AND APPLIED SCIENCES
OF MIDDLE EAST TECHNICAL UNIVERSITY
BY
BAHAR İPEK
IN PARTIAL FULFILLMENT OF THE REQIREMENTS FOR
THE DEGREE OF MASTER OF SCIENCE IN
CHEMICAL ENGINEERING
APRIL 2011
ii
Approval of the thesis:
PHOTOCATALYTIC CARBON DIOXIDE REDUCTION IN LIQUID MEDIA
submitted by BAHAR İPEK in partial fulfillment of the requirements for the degree of Master of Science in Chemical Engineering Department, Middle East Technical University by, Prof. Dr. Canan Özgen Dean, Graduate School of Natural and Applied Sciences Prof. Dr. Deniz Üner Head of Department, Chemical Engineering Prof. Dr. Deniz Üner Supervisor, Chemical Engineering Department, METU
Examining Committee Members Prof. Dr. Gürkan Karakaş Chemical Engineering Dept., METU Prof. Dr. Deniz Üner Chemical Engineering Dept., METU Prof. Dr. Ali Çulfaz Chemical Engineering Dept., METU Prof. Dr. Saim Özkar Chemistry Department, METU Prof. Dr. Meral Yücel Biology Department, METU
Date: 21.04.2011

iii
I hereby declare that all information in this document has been obtained and presented in accordance with academic rules and ethical conduct. I also declare that, as required by these rules and conduct, I have fully cited and referenced all material and results that are not original to this work.
Name, Last name : Bahar İpek
Signature :
iv
ABSTRACT
PHOTOCATALYTIC CARBON DIOXIDE REDUCTION IN LIQUID MEDIA
İpek, Bahar
M.Sc., Department of Chemical Engineering
Supervisor: Prof. Dr. Deniz Üner
April 2011, 135 pages
The aim of this study is to investigate and reveal challenges in
photocatalytic CO2 reduction tests performed in liquid media. Effect of test
conditions in photocatalytic studies are often underestimated with an assumption
of negligible mass transfer limitations in observed rate results. In this study, effect
of mass transfer limitations in liquid phase photocatalytic tests was revealed with
stirring rate and gas hold-up time experiments performed with Pt/TiO2 and
Cu/TiO2 catalysts. In addition, apparent activation energies of 12 and 19.5 kJ/mol
found with Pt/TiO2 and Cu/TiO2 catalysts respectively indicate diffusion
limitations which favor back oxidation reactions resulting in low reduction yields.
Photocatalytic CO2 reduction reaction is named as Artificial Photosynthesis
even though present artificial system does not have sophisticated transport and
membrane systems which natural systems have. Similarities and differences
between artificial and natural photosynthesis are studied in order to present ideas
to improve present photocatalytic rates.
Kinetic and microkinetic modeling of catalytic methanol production from
CO2 hydrogenation on Cu surfaces were performed in order to have an idea about
kinetic limitations at photocatalytic systems. Calculations were performed at
temperatures and pressures at which photocatalytic studies are conducted. The

v
results indicated that water has an inhibitory effect on methanol formation rates
and higher pressures could be implemented in photocatalytic systems for higher
rates. Another implication drawn from degree of rate control calculations is that H
formation step plays an important role underlying the importance of water
splitting in CO2 reduction reactions.
Keywords: Artificial photosynthesis, Carbon dioxide reduction
vi
ÖZ
SIVI FAZDA FOTOKATALİTİK KARBONDİOKSİT İNDİRGENMESİ
İpek, Bahar
Yüksek Lisans, Kimya Mühendisliği Bölümü
Tez Yöneticisi: Prof. Dr. Deniz Üner
Nisan 2011, 135 sayfa
Bu çalışmanın amacı, sıvı fazda gerçekleştirilen fotokatalitik karbondioksit
indirgeme testlerinde karşılaşılabilen sorunları araştırmak ve gözler önüne
sermektir. Fotokataliz çalışmalarında test koşullarının sonuçlara etkisi, ortamda
kütle aktarımı kısıtlamalarının olmadığı varsayımıyla sıklıkla hafife alınmaktadır.
Bu çalışmada, Pt/TiO2 ve Cu/TiO2 katalizörleriyle gerçekleştirilen karıştırma hızı
ve gazın sıvı içinde kalma süresi deneylerinin yardımıyla sıvı fazda
gerçekleştirilen fotokatalitik deneylerde kütle aktarım hızının önemli etkisi gözler
önüne serilmiştir. Deneylerde 12 ve 19.5 kJ/mol olarak bulunan düşük aktivasyon
enerji değerleri testlerin difuzyon hızıyla sınırlandığını gösterir niteliktedir.
Difuzyon hızı sınırlandırmalarının, reaksiyon veriminin düşmesine sebep olan ters
reaksiyonları tetiklediği düşünülmektedir.
Doğal fotosentezin sahip olduğu gelişmiş taşıma ve zar sistemlerine sahip
olmamakla birlikte fotokatalitik karbondioksit indirgenmesi Suni Fotosentez
olarak adlandırılır. Doğal ve suni fotosentez arasındaki benzerlikler ve
farklılıklar, güncel fotokataliz hızlarının gelistirilebilmesi amacıyla irdelenmiştir.
Karbondioksitin bakır yüzeyler üzerinde indirgenerek metanole
dönüşmesinin kinetik ve mikrokinetik modellemesi, fotokatalitik sistemlerde hız
belirleyen basamakların açığa çıkarılması amacıyla yapılmıştır. Hesaplamalar

vii
fotokataliz sıcaklık ve basınçlarında yapıldığında, suyun metanol üretimi hızı
üzerindeki negatif, basıncın ise pozitif etkisi gözlemlenmiştir. Reaksiyon
basamaklarının hıza etkisi araştırıldığında ise, karbondioksit indirgenmesinde H
atomlarının ve de dolaylı olarak su ayrıştırma aşamasının önemi vurgulanmıştır.
Anahtar Kelimeler: Suni fotosentez, Karbondioksit indirgenmesi

viii
To My Family
ix
ACKNOWLEDGEMENTS
The author wishes to express her deepest gratitude to her supervisor Prof.
Dr. Deniz Üner for her guidance, advice, insight and encouragements throughout
the research and life.
The author wishes to express her appreciation to her family for their
endless support and encouragements throughout life. Without their support and
love, the realization of her goals would not be possible.
The author would like to express her intimate thanks to Murat Torun for
his endless patience and support in every stage of the research and for always
being there to share the life.
The author would like to thank former and present CACTUS research
group members for their companionship and suggestions in the laboratory.
The technical assistance of Mrs. Gülten Orakçı, Mr. İsa Çağlar and the
other Personnel of Chemical Engineering Workshop are gratefully acknowledged.
The author would like to thank to Prof. Dr. Ali Çulfaz and Mrs. Berna
Güney for realization of XRD measurements and to Central Laboratory personnel
for TEM measurements.
This study was supported by The Scientific and Technological Research
Council of Turkey (TUBITAK) with research grant numbers: 107M447 and
CAYDAG 106Y075.
The author would also like to acknowledge the financial support of
TUBITAK BIDEB 2228 for M.S. research.

x
TABLE OF CONTENTS
ABSTRACT ................................................................................................................ iv ÖZ ............................................................................................................................... vi DEDICATION .......................................................................................................... viii ACKNOWLEDGEMENTS ........................................................................................ ix TABLE OF CONTENTS ............................................................................................. x LIST OF TABLES .................................................................................................... xiii LIST OF FIGURES ................................................................................................... xv LIST OF SYMBOLS .............................................................................................. xviii CHAPTERS
1. INTRODUCTION.................................................................................................... 1 2. LITERATURE SURVEY ........................................................................................ 6
2.1 PHOTOCATALYSIS ........................................................................................ 6 2.1.1 Preventing Charge Recombination ..................................................................... 7 2.1.2 Thermodynamic Favorability of the Reactions ................................................... 8
2.2 PHOTOSYNTHESIS ...................................................................................... 12 2.2.1 Overview ........................................................................................................... 12 2.2.2 Reactions ........................................................................................................... 13 2.2.2.1 Light Dependent Reactions ............................................................................ 13 2.2.2.2 Light Independent Reactions.......................................................................... 17 2.2.3 Transport Processes ........................................................................................... 20 2.2.4 Similarities and Differences between Photosynthesis and Artificial Photosynthesis ............................................................................................................ 24
2.3 CO2 PHOTOREDUCTION ON TiO2 ............................................................. 25 2.3.1 Challenges in CO2 Photoreduction with H2O in Three-Phase Systems ............ 29 2.3.1.1 Mass Transfer Considerations in Liquid Media Photocatalytic Testing ........ 31 2.3.2 Effect of Micromixing Conditions on Reaction Rates ...................................... 34
2.4 KINETIC CONSIDERATIONS ..................................................................... 36 2.4.1 Photocatalytic CO2 Reduction Reaction Mechanism ........................................ 36 2.4.2 Catalytic Contributions to Photocatalysis ......................................................... 39 2.4.3 Catalytic CO2 Hydrogenation with Copper Based Catalysts ............................ 41 3. MATERIALS AND METHODS ........................................................................... 44

xi
3.1 CATALYST PREPARATION........................................................................ 44 3.1.1 Mixing Rate and Effect of Temperature Experiments ...................................... 44 3.1.2 Photocatalytic CO2 Reduction Experiments ..................................................... 44 3.1.2.1 First Set .......................................................................................................... 44 3.1.2.2 Second Set ...................................................................................................... 46 3.1.2.3 Third Set ......................................................................................................... 47 3.1.2.4 Fourth Set ....................................................................................................... 47
3.2 CATALYST CHARACTERIZATION ........................................................... 50 3.3 CATALYST TESTING .................................................................................. 50
3.3.1 Mixing Rate and Effect of Temperature Experiments ...................................... 50 3.3.2 Photocatalytic CO2 Reduction Experiments ..................................................... 52
3.4 KINETIC AND MICROKINETIC MODELLING OF METHANOL FORMATION ....................................................................................................... 53
3.4.1 Calculation of Methanol Formation Rates with the Steady State Kinetic Model Proposed by Vanden Bussche et al. ........................................................................... 53 3.4.2 Calculation of Methanol Formation Rates with the Static Kinetic Model Proposed by Ovesen et al. .......................................................................................... 55 3.4.2.1 Calculation of Molecular Partition Functions ................................................ 58 3.4.3 Microkinetic Modeling of CO2 Hydrogenation using Finite Difference Method and Pseudo Steady State Approximation ................................................................... 61 3.4.3.1 Activation Energy Barrier Calculations for Each Step .................................. 62 3.4.3.2 Calculation of Pre-Exponentials .................................................................... 64 3.4.3.3 Finite Difference Method ............................................................................... 65 3.4.3.4 Pseudo Steady State Approximation .............................................................. 66 3.4.4 Revealing Rate Determining Steps ................................................................... 67 4. RESULTS AND DISCUSSION ............................................................................ 68
4.1 Cu/ TiO2 CATALYST CHARACTERIZATION RESULTS ......................... 68 4.1.1 BET Surface Area Measurements ..................................................................... 68 4.1.2 XRD Analysis ................................................................................................... 69 4.1.3 TEM Measurements .......................................................................................... 70
4. 2 MASS TRANSFER LIMITATION EXPERIMENTS ................................... 72 4.2.1 Effect of Stirring Rates...................................................................................... 73 4.2.2 Effect of Gas Hold-up Time .............................................................................. 75 4.2.3 Effect of Temperature ....................................................................................... 76
4.3 PHOTOCATALYTIC CO2 REDUCTION ACTIVITY RESULTS ............... 79

xii
4.3.1 Photocatalytic Testing of First Set of Catalysts ................................................ 80 4.3.2 Photocatalytic Testing of Second Set of Catalysts ............................................ 82 4.3.3 Photocatalytic Testing of Third Set of Catalysts............................................... 83 4.3.4 Photocatalytic Testing of Fourth Set of Catalysts ............................................. 84 4.3.5 Comparison of Results with Literature Results ................................................ 86
4.4 KINETIC AND MICROKINETIC ANALYSIS ............................................ 87 4.4.1 Catalytic Methanol Formation Rates Calculated with the Kinetic Model of Vanden Bussche et al [95]. ........................................................................................ 87 4.4.2 Catalytic Methanol Formation Rates Calculated with the Static Kinetic Model Proposed by Ovesen et al [98]. .................................................................................. 89 4.4.3 Microkinetic Modeling of CO2 Hydrogenation using Finite Difference Method and Pseudo Steady State Approximation ................................................................... 93 4.4.4 Rate Determining Step Investigation on Copper Based Catalysts .................. 102 5. CONCLUSIONS .................................................................................................. 105 6. RECOMMENDATIONS ..................................................................................... 107 REFERENCES ......................................................................................................... 108 APPENDICES A. REDOX COMPONENTS IN PHOTOSYNTHESIS .......................................... 119
A.1 TYROSINE .................................................................................................. 119 A.2 PLASTOQUINONE ..................................................................................... 120 A.3 PLASTOCYANIN ....................................................................................... 120 A.4 FERRODOXIN ............................................................................................ 121 A.5 CHLOROPHYLL A AND CHLOROPHYLL B ......................................... 122
B. PHOTOCATALYTIC TEST RESULT CALCULATIONS ............................... 123 B.1 MASS TRANSFER LIMITATION EXPERIMENTS ................................. 123 B.2 PHOTOCATALYTIC CO2 REDUCTION EXPERIMENTS ...................... 130
C. XPS MEASUREMENTS OF Cu/ TiO2 CATALYSTS ...................................... 134

xiii
LIST OF TABLES
TABLES
Table 1.1 Total Primary Energy Supply (TPES) by fuel in 2008 ..................................... 2
Table 2.1 Half cell reactions and their electrooxidation or reduction potentials at
pH=7 vs NHE ........................................................................................................ 9
Table 2.2 Overall reactions and standard Gibbs free energies normalized per mole of
O2 produced ......................................................................................................... 11
Table 2.3 CO2 photoreduction normalized rates from literature ..................................... 26
Table 2.4 Estimated CO2 photoreduction L-H parameters, Wu et al. [59] ..................... 38
Table 2.5 Estimated CO2 photoreduction L-H parameters, Ren et al. [77]. ................... 38
Table 2.6 Catalytic methanol synthesis results from literature at different conditions ... 42
Table 3.1 GC/TCD Operation Parameters ...................................................................... 52
Table 3.1 GC/FID Operation Parameters ........................................................................ 53
Table 3.3 Elementary Steps in the Kinetic Model of Methanol Synthesis ..................... 56
Table 3.4 Rate constants for Cu (111) used in the kinetic model ................................... 57
Table 3.5 Thermodynamic parameters used in partition function calculations .............. 59
Table 3.6 Elementary reaction steps used in microkinetic modelling ............................ 62
Table 3.7 Heats of chemisorptions and total bond energies for reaction species given
on Cu (111) .......................................................................................................... 63
Table 4.1 BET surface areas of Cu/TiO2 catalysts .......................................................... 68
Table 4.2 Initial hydrogen evolution rates with changing temperature values ............... 78
Table 4.3 Calculated rates for first set of catalysts ......................................................... 82
Table 4.4 Initial methanol production rates for tested catalysts...................................... 86
xiv
Table 4.5 Initial methanol formation rates (in mol/gcat/s) with FCO20 = 0.0135 mol/s,
FCO0= 0.0675 mol/s, FH20= 0.189 mol/s............................................................... 88
Table 4.6 Initial methanol formation rates (in mol/gcat/s) with FCO20 = 0.0108 mol/s,
FCO0= 0.0648 mol/s, FH20= 0.189 mol/s, FH2O0= 0.0054 mol/s ............................ 88
Table 4.7 Translational (zt), vibrational (zv) and rotational (zr) partition functions for
species involved in methanol synthesis mechanism ........................................... 90
Table 4.8 Initial Initial methanol formation rates (mol/gcat/s) with FCO20 = 0.0108
mol/s, FCO0= 0.0648 mol/s, FH20= 0.189 mol/s and FH2O0= 0.0054 mol/s ........... 91
Table 4.9 Calculated activation energy barriers and pre exponential factors in
microkinetic modeling ......................................................................................... 94
Table 4.10 Entropy and Gibbs free energy values calculated for each step of reaction . 95
Table 4.11 Steady state surface concentrations and initial methanol formation rates .... 99
Table 4.12 Methanol formation rates (mol/gcat/s) at different reaction conditions
found with different kinetic models .................................................................. 101
Table 4.13 The degree of rate control values with respect to rf10 found by finite
difference method at t= 5.18*10-7 s ................................................................... 102
Table 4.14 The degree of rate control values with respect to r10net found by steady
state assumption at XCO2=0.00005 .................................................................... 103
Table B.1 Raw data obtained from stirring rate experiments a. 900 rpm, b. 350 rpm .. 123
Table B.2 Raw data for effect of gas hold-up time with 0.5 wt % Pt/TiO2 .................. 125
Table B.3 Raw data for effect of temperature experiments with 1 wt % Pt/TiO2 ......... 127
Table B.4 Raw data for effect of temperature experiments with 1 wt % Cu/TiO2 ....... 129
Table B.5 Raw data obtained from photocatalytic CO2 reduction experiment
performed with first set of catalysts ................................................................. 130
Table B.6 Raw data obtained from photocatalytic CO2 reduction experiment
performed with second set of catalysts ............................................................ 132
Table B.7 Raw data obtained from photocatalytic CO2 reduction experiment
performed with fourth set of catalyst ............................................................... 133
Table C.1 The element molar ratio of catalysts found by XPS .................................... 134

xv
LIST OF FIGURES
FIGURES
Figure 1.1 Illustrating scheme of photocatalytic CO2 reduction ....................................... 3
Figure 1.2 Comparison of photosynthesis and photocatalytic CO2 reduction with
illustrating schemes ............................................................................................... 4
Figure 2.1 Illustrating scheme of electron/hole pair generation and realization of
redox reactions ...................................................................................................... 7
Figure 2.2 Schematic illustrations of band structures of semiconductors and redox
potentials of the reactions .................................................................................... 10
Figure 2.3 Z scheme electron transfer in terms of redox potentials ................................ 14
Figure 2.4 Schematic illustration of electron and proton transport processes and ATP
synthesis in light dependent reactions ................................................................. 15
Figure 2.5 Extension of classical S state cycle of the manganese- calcium complex ..... 16
Figure 2.6 The Calvin Cycle ........................................................................................... 18
Figure 2.7 Reaction sequence of carboxylation of RuBP by RubisCO ......................... 19
Figure 2.8 Conversion of 3- Phosphoglycerate to triose phosphate................................ 19
Figure 2.9 Distribution of photosynthetic complexes in thylakoid membrane and the
corresponding Z scheme ...................................................................................... 21
Figure 2.10 PS II electron transport pathways and transfer times with midpoint
potentials of electron carriers .............................................................................. 23
Figure 2.11 PS I electron transport pathways and transfer times with midpoint
potentials of electron carriers .............................................................................. 23
Figure 2.12 Schematic illustration of CO2 purge to system ............................................ 29
Figure 2.13 Schematic illustration of mass transfer limitations in a slurry reactor ........ 31
Figure 2.14 Schematic illustration of stagnant zones in a slurry reactor ........................ 32
xvi
Figure 2.15 Schematic illustration of water boundary layer and diffusion of reactants
and products ........................................................................................................ 33
Figure 2.16 Segregated and maximum mixedness flow models ..................................... 35
Figure 3.1 Preparation procedure of first set of catalysts................................................ 45
Figure 3.2 Preparation procedure of second set of catalysts ........................................... 46
Figure 3.3 Preparation procedure of third set of catalysts .............................................. 48
Figure 3.4 Preparation procedure of fourth set of catalysts ............................................ 49
Figure 3.5 Schematic illustration of the set-up ............................................................... 51
Figure 4.1 XRD analysis of a: TiO2 and b: 10 wt %Cu/TiO2 ......................................... 70
Figure 4.2 TEM image of 2 wt % Cu/ Degussa P25 prepared via incipient wetness
method ................................................................................................................. 71
Figure 4.3 TEM image of 2 wt % Cu/TiO2 prepared via sol- gel technique................... 72
Figure 4.4 Effect of stirring rates on photo catalytic hydrogen evolution with 0.5 wt
% Pt/TiO2 ............................................................................................................ 73
Figure 4.5 Decreasing boundary layer thickness with increasing mixing rates .............. 74
Figure 4.6 Effect of hydrogen hold-up time on photocatalytic hydrogen evolution
amounts (a) normalized with respect to catalyst amount (b) not normalized
with respect to catalyst amount with CH3OH/ H2O: 1/125 and Ccat: 1 g/L ......... 75
Figure 4.7 Effect of temperature on photo catalytic hydrogen evolution with 1 wt %
Pt/TiO2 in 250 ml water and 2 ml methanol ........................................................ 77
Figure 4.8 Effect of temperature on photo catalytic hydrogen evolution with 1 wt %
Cu/TiO2 in 250 ml water and 2 ml methanol ...................................................... 77
Figure 4.9 Effect of temperature on photocatalytic hydrogen evolution and ln rate vs
1/T demonstration with Pt/ TiO2 catalyst ............................................................ 79
Figure 4.10 Photocatalytic methanol production amounts of first set of catalysts with
respect to time ..................................................................................................... 80
Figure 4.11 Reaction rates of first set of catalysts with respect to time.......................... 81
Figure 4.12 Photocatalytic methanol production amounts of second set of catalysts
with respect to time ............................................................................................. 83
xvii
Figure 4.13 Photocatalytic methanol production amounts of 3 wt % Cu/ Degussa P25
and 3 wt % Cu/ TiO2 ........................................................................................... 85
Figure 4.14 Comparison of reaction rates of first set 3 wt % Cu/Degussa P25 and
fourth set 3 wt % Cu/TiO2 ................................................................................... 85
Figure 4.15 Demonstration of calculated rates in ln rate vs 1/T scale. ........................... 92
Figure 4.16 Vacant site coverage values with respect to time at 75 bar, 523 K on a Cu
based catalyst ....................................................................................................... 96
Figure 4.17 CO2 coverage values with respect to time at 75 bar, 523 K ........................ 96
Figure 4.18 CO coverage values with respect to time at 75 bar, 523 K.......................... 97
Figure 4.19 H coverage values with respect to time at 75 bar 523 K. ............................ 97
Figure 4.20 HCOO coverage values with respect to time at 75 bar, 523 K .................... 98
Figure 4.21 Equilibrium CO2 conversion and constant rate conversion values at 75
bar. ..................................................................................................................... 100
Figure 6.1 Schematic illustration of suggested reactor for CO2 reduction ................... 108
Figure A.1 Structural formula of tyrosine ..................................................................... 119
Figure A.2 Structural formula of plastoquinone ........................................................... 120
Figure A.3 Demonstration of copper site in plastocyanine with four amino acids
bound to copper molecule ................................................................................. 120
Figure A.4 Demonstration of Fe2S2 ferrodoxin ............................................................ 121
Figure A.5 Structural formulas of Chloropyhll a and Chlorophyl b ............................. 122
Figure C.1 XPS spectra of Cu/ Degussa P25 catalysts prepared by incipient wetness
method ............................................................................................................... 135

xviii
LIST OF SYMBOLS
ab Specific gas- liquid contact area, m2 bubbles /m3 reactor
ap Specific external interface of solids, m2 catalyst/ m3 liquid
A Electron acceptor
B Rotati onal constant of a gas molecule, cm-1
c Speed of light, 3*108 m/s
D Electron donor
Dab Molecular diffusion coefficient, m2/s
Db Binding energies of bonds broken, kJ/mol
Df Binding energies of bonds formed, kJ/mol
Fi Molar flow rate of species i, mol/s
h Planck constant, 6.63*10-34 J.s
I Light intensity, W.cm-2
IA Moment of inertia, kg.m2
k Reaction rate constant
kB Boltzmann constant, 1.38*10-23 J/K
kG Gas side mass transfer coefficient, m/ s
kL Liquid side mass transfer coefficient, m/ s
ks Liquid to solid mass transfer coefficient, m/ s
Ki Langmuir adsorption equilibrium constants for species i, bar-1
m Molecular weight of gases, g/ mol
Ni Moles of species i in a batch reactor, mol
Qr Heats of chemisorption of reactants, kJ/mol

xix
Qp Heats of chemisorption of products, kJ/mol
P Pressure, bar
T Temperature, K
α Power intensity of light
η Internal efficiency factor
θi Coverage of species i
ν Frequency, cm-1
χrc,i Degree of rate control of step i
1
CHAPTER 1
INTRODUCTION
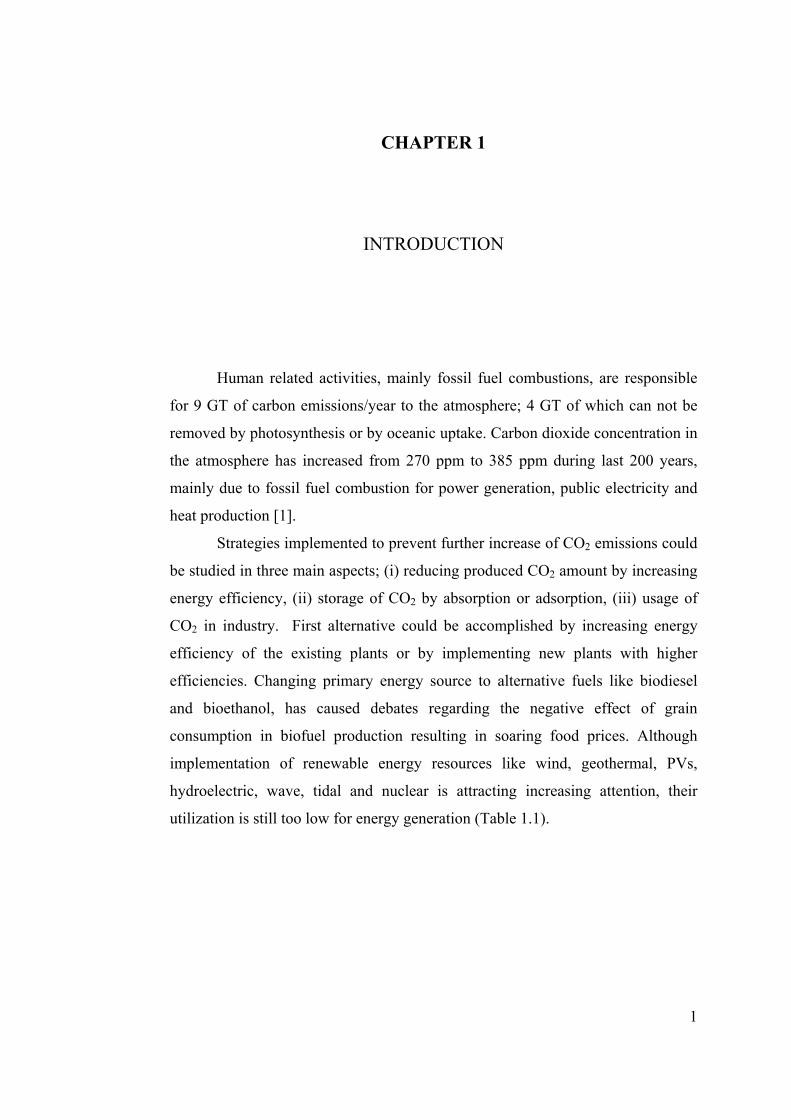
Human related activities, mainly fossil fuel combustions, are responsible
for 9 GT of carbon emissions/year to the atmosphere; 4 GT of which can not be
removed by photosynthesis or by oceanic uptake. Carbon dioxide concentration in
the atmosphere has increased from 270 ppm to 385 ppm during last 200 years,
mainly due to fossil fuel combustion for power generation, public electricity and
heat production [1].
Strategies implemented to prevent further increase of CO2 emissions could
be studied in three main aspects; (i) reducing produced CO2 amount by increasing
energy efficiency, (ii) storage of CO2 by absorption or adsorption, (iii) usage of
CO2 in industry. First alternative could be accomplished by increasing energy
efficiency of the existing plants or by implementing new plants with higher
efficiencies. Changing primary energy source to alternative fuels like biodiesel
and bioethanol, has caused debates regarding the negative effect of grain
consumption in biofuel production resulting in soaring food prices. Although
implementation of renewable energy resources like wind, geothermal, PVs,
hydroelectric, wave, tidal and nuclear is attracting increasing attention, their
utilization is still too low for energy generation (Table 1.1).

2
Table 1.1 Total Primary Energy Supply (TPES) by fuel in 2008 [2]
Fuels Fuel Shares of TPES
(%)
Oil 33.2
Coal 27
Gas 21
Combustible renewables and waste 10
Nuclear 5.8
Hydro 2.2
Other (Geothermal, solar, wind, etc.) 0.7
Storage of CO2 could be realized by carbon capture and sequestration
methods like absorption into chemical solvents like amine based solvents, or by
adsorption onto solid sorbents like metal organic framework compounds.
Although with innovations in material science CO2 can be stored onto MOF 177
with an adsorption capacity of 33.5 mmol/ g [3], storing CO2 onto sorbents could
only solve the problem temporarily. New materials and systems should be
implemented in order to not only store CO2, but also convert it into valuable
chemicals; like fuels.
CO2 is used in industry in beverages, in enhanced oil recovery, as solvents
in its supercritical state, in food preservation technologies; and also in carboxylic
acid, organic carbonate, urea and methanol production with a total annual
consumption rate of 120 MT CO2 / year [4].
Besides catalytic and electrochemical CO2 conversion methods, there is
also photocatalytic method in which CO2 is reduced with H2O into variable
chemicals with utilization of solar energy, in the presence of a semiconductor
(Figure 1.1).

3
Figure 1.1 Illustrating scheme of photocatalytic CO2 reduction
Overall reactions and possible products in photocatalytic CO2 reduction
can be seen below:
2 2 2
2 2 2 2
2 2 3 2
2 2 4 2
CO H O HCOOH +1/2O CO H O CO+H +O CO 2H O CH OH+3/2O CO 2H O CH +2O
+ →+ →+ →+ →
This process is also named as ‘Artificial Photosynthesis’ due to its
resemblance to photosynthesis with the same reactants and the same source of
energy: solar energy. However, photosynthesis is a much more complex process
resulting in a more complex product, (CH2O)6.
Another resemblance between photosynthesis and photocatalytic CO2
reduction is the reaction steps; in both processes, firstly H2O is oxidized to O2
with electromagnetic irradiation and CO2 is reduced with produced H+s (in form
of NAPDH in photosynthesis) (Figure 1.2).

4
Figure 1.2 Comparison of photosynthesis and photocatalytic CO2
reduction with illustrating schemes [5]
In literature survey chapter, a section with the title Photosynthesis is given
to elucidate reaction and transport mechanisms in photosynthesis, compared with
those in photocatalysis with the aim of revealing the position of photocatalytic
CO2 reduction with respect to photosynthesis and in which aspects it could be
amended.
Photocatalysis offers an alternative to conventional catalysis with the
ability of converting solar energy into chemical energy. However, reported
photocatalytic reaction rates so far are not favorable for the commercialization of
the process.
The studies conducted on photocatalytic CO2 reduction focus on material
development for efficient visible light utilization or enhanced charge kinetics on
surface and process development such as utilization of hole scavengers. A broad
overview of mentioned developments is given in literature survey section. In
addition, photocatalytic rates are not reported in standardized reaction systems.
Different reactors with different reaction media, mixing intensities, catalyst
concentrations and liquid volumes could result in improper comparison of activity
Light Dependent Reactions
Light Independent Reaction (Dark Reaction)
5
results with different bases. Yet, reported activity results do not seem to be
improved in order of magnitudes.
Similarity of the reported results necessitates questioning of transport
processes occurring in a photocatalytic reactor. Liquid phase photocatalytic
studies draw special attention due to probable mass transfer limitations in
observed rates arising from interfacial transport processes. Therefore,
investigation of transport phenomena in photocatalytic systems is an objective of
this study.
Presence of dark steps in photocatalytic CO2 reduction is suggested in this
study with the evidences from literature. Similarity in mechanisms of catalytic
CO2 hydrogenation and CO2 reduction reactions were assumed because of the
utilization of copper based catalysts in both reactions. Therefore, kinetic and
microkinetic analysis of catalytic CO2 hydrogenation on copper based catalysts
were performed in order to get a hint about rate limiting steps in photocatalytic
CO2 reduction reaction.
The objective of this study is to elucidate the role of operational
parameters and to understand chemical details of photocatalytic carbon dioxide
reduction reaction in order to improve present photocatalytic systems and carbon
dioxide reduction yields.

6
CHAPTER 2
LITERATURE SURVEY
2.1 PHOTOCATALYSIS
Harnessing solar energy in chemical bonds is viable by photocatalysis. In
photocatalysis, electrons and holes are generated upon electromagnetic irradiation
provided that the energy of the irradiated light is equal or greater than the band
gap energy of the utilized semiconductor. Once electrons and holes are created,
they can experience either migration to the surface and being trapped at the trap
sites or alternatively recombine at the surface or in the bulk volume of the
semiconductor (Figure 2.1) [6]. After charge carriers; electrons and holes, are
trapped at the trap centers, they reduce/oxidize surface adsorbed species if surface
adsorbates possess appropriate redox potentials for a thermodynamically allowed
reaction.

7
Figure 2.1 Illustrating scheme of electron/hole pair generation and
realization of redox reactions
Semiconductors, having a band gap, ensure a life-time for generated
electrons and holes; however, this lifetime is limited to 10-7 s, which is the
characteristic time of recombination (for bare TiO2) [7]. That is to say, charge
carriers; electrons and holes, should be trapped at the trap sites for efficient
utilization in redox reactions. Anpo et al., found a highly excited electronic state
of TiO2 catalyst; (Ti+3 O-)*, with Electron Spin Resonance (ESR) upon irradiation
which labels Ti+3 as trapped electron centers and O- as trapped hole centers [8-10].
2.1.1 Preventing Charge Recombination
Metal addition to semiconductors is widely used in photocatalytic studies,
which are reported to decrease the rate of recombination and increase

8
photocatalytic yields [11-20]. When metals are brought into contact with
semiconductors, electrons populate on metals if Fermi level of the metal is lower
than the conduction band of the semiconductor. Hence, metals act like ‘charge
carrier traps’, increasing lifetime of electron hole pairs with charge separation
effect, known as ‘Schottky Barrier Effect’. Although metal loadings are generally
reported to increase the photocatalytic activity, an optimum loading value is
reported, suggesting that higher loadings decrease photoexcitation capacity of the
semiconductor by masking the surface [15, 18].
Charge separation effect of metals was supported by giving ESR data [16,
21, 22]. Anpo et al. and Sa et al. investigated Ti+3 signals with ESR and observed
that while Ti+3 signals increase with increasing UV irradiation time on TiO2, they
show negligible increase with metal added TiO2. They attributed those results to
localization of electrons at Ti+3 sites when there is no metal (only TiO2), and
transfer of photogenerated electrons from TiO2 to metal with Pt/TiO2 or Ag/TiO2,
resulting in charge separation with good efficiency.
Another modification that can hinder recombination of generated electrons
and holes is formation of solid-solid interfaces in composite photocatalysts having
different band gap energies. To illustrate; commercial TiO2 catalysts; Degussa P-
25, is composed of anatase and rutile crystal phases of TiO2, having band gap
energies of 3.2 eV and 3.0 eV respectively. Mixed phase TiO2, tends to exhibit
higher photocatalytic activity than pure phases, because it allows transfer of the
photogenerated electron from rutile to anatase, resulting in charge separation [7,
23]. Electron transfer from a smaller band gap to a larger band gap crystal is
explained by additional trapping sites of anatase which have energies 0.8 eV less
than conduction band of anatase [23, 24].
2.1.2 Thermodynamic Favorability of the Reactions
In photocatalysis, surface adsorbed species should have appropriate redox
potentials with respect to flat band positions of the semiconductor for
thermodynamic favorability of the reactions. In other words, semiconductors

9
should have conduction bands located at a more negative potential than the
reduction potential of CO2 to hydrocarbons, and valence bands located at a more
positive potential than the oxidation potential of H2O. In Table 2.1 oxidation and
reduction reactions taking place in photocatalytic CO2 reduction are listed with
their electrooxidation or reductionpotentials at pH=7, vs NHE.
Table 2.1 Half cell reactions and their electrooxidation or reduction-
potentials at pH=7 vs NHE
Reactions E0 (V)
2 22H O 4h O 4H+ ++ → + + 0.82
2CO 2H 2e HCOOH + −+ + → - 0.61
2 2CO 2H 2e CO+H O+ −+ + → -0.52
2 2CO 4H 4e HCHO+H O+ −+ + → -0.48
2 3 2CO 6H 6e CH OH+H O+ −+ + → -0.38
2 4 2CO 8H 8e CH +2H O + −+ + → -0.24
In Figure 2.2, flat band positions of the semiconductors used in
photocatalytic CO2 reduction reactions and also redox potentials of the reactions
are given.

10
Figure 2.2 Schematic illustrations of band structures of semiconductors
and redox potentials of the reactions (eV vs NHE at pH 7) [43]
In literature, the most commonly observed reduction products are CH4 and
CH3OH, indicating favorability of multi-electron transfer processes. That
indication becomes reasonable when standard Gibbs free energies of reactions are
calculated per mole of O2 produced (Table 2.2).

11
Table 2.2 Overall reactions and standard Gibbs free energies normalized
per mole of O2 produced
Reactions ∆G0 (kJ/mol O2)
2 (g) 2(g) 2(g)H O 1/2O +H → 457.2
2(g) 2 (g) (l) 2(g)CO H O HCOOH +1/2O+ → 523.2
2(g) 2 (g) (g) 2(g) 2(g)CO H O CO +H +O+ → 485.8
2(g) 2 (g) 3 (g) 2(g)CO 2H O CH OH +3/2O+ → 459.7
2(g) 2 (g) 4(g) 2(g)CO 2H O CH +2O+ → 400.5
In order to provide thermodynamic favorability, large band gap
semiconductors are mostly utilized in photocatalytic CO2 reduction reactions. It is
stated that as band gap energies of the semiconductors increase, both oxidizing
and reducing power of photocatalysts increase [25]. However, one disadvantage
of utilization of large band gap semiconductors is that, they can be activated only
under UV illumination; if their band gap energies are larger than 3 eV, according
to Equation (1).
Band gap energy (eV) = 1240 / λ (nm) (1)
Visible light utilization is a goal of present photocatalytic studies. There
are modification studies going on for effective sunlight utilization like particle
size modification, dye sensitization [26], and anion doping [27].
Chemical stability, non-toxicity and low cost render TiO2 most commonly
preferred semiconductor in photocatalytic studies. Ideally, a semiconductor
photocatalyst should be chemically and biologically inert, photocatalytically
stable, easy to produce and to use and efficiently activated by sunlight [7].
Therefore, TiO2 can be considered as an ideal photocatalyst except that it cannot
absorb visible light.

12
TiO2 is commonly used in photocatalysis either doped with metals or with
support materials like MCM-41, MCM-48 [14], porous silica thin films [28],
SBA-15 [20, 25], and zeolites [30]. Support materials are reported to increase
surface area and also increase selectivity of products upon alteration of Ti
coordination [14].
In this section, recent developments in photocatalysis and photocatalytic
CO2 reduction studies were given with an emphasis on charge recombination.
2.2 PHOTOSYNTHESIS
2.2.1 Overview
Photosynthesis is the world’s most abundant process with an approximate
carbon turnover number of 300- 500 billion tons of CO2 per year. In this vital
process, green plants, algae and photosynthetic bacteria are converting CO2 with
water into carbohydrates and oxygen (in oxygenic photosynthesis), both of which
are essential for sustaining life on earth. Oxygenic photosynthesis is believed to
be started 2.5 billion years ago by the ancestors of cyano bacteria. In this
remarkable process, energy need for converting stable compounds (CO2 and H2O)
into comparably less stable arranged molecules ((CH2O)n and O2) is supplied from
solar energy in which highly sophisticated protein complexes embedded in an
internal chloroplast membrane (called thylakoid membrane) are major players.
6 12 6 6
ΔG0= 2870 kJ /mol C6H12O6
Harnessing solar energy into chemical bonds in this process is achieved by
light absorption and sequential electron and proton transport processes in which a
great deal of number of light harvesting pigments, protein complexes and
intermediate charge carriers are involved. CO2 is being reduced with the indirect
13
products of water oxidation; supplying required energy in the form of redox free
energy (from NADPH) and high energy Pi bonds (from ATP).
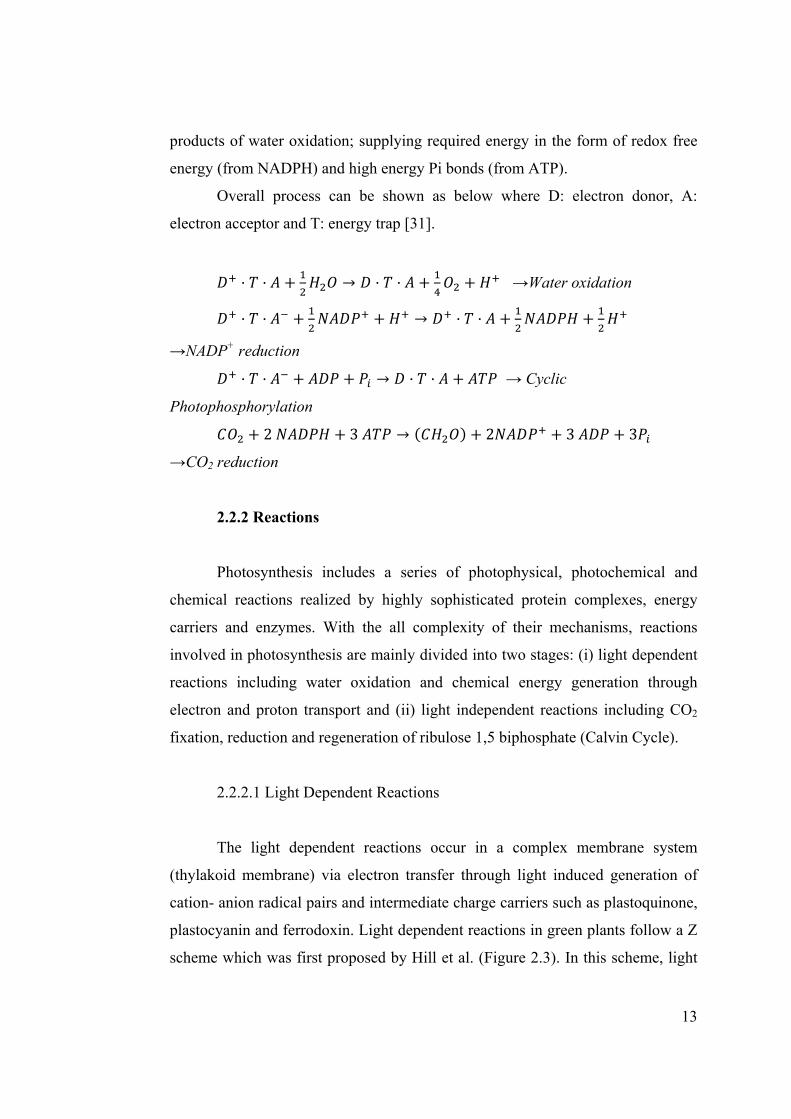
Overall process can be shown as below where D: electron donor, A:
electron acceptor and T: energy trap [31].
→Water oxidation
→NADP+ reduction
→ Cyclic
Photophosphorylation
2 3 2 3 3
→CO2 reduction
2.2.2 Reactions
Photosynthesis includes a series of photophysical, photochemical and
chemical reactions realized by highly sophisticated protein complexes, energy
carriers and enzymes. With the all complexity of their mechanisms, reactions
involved in photosynthesis are mainly divided into two stages: (i) light dependent
reactions including water oxidation and chemical energy generation through
electron and proton transport and (ii) light independent reactions including CO2
fixation, reduction and regeneration of ribulose 1,5 biphosphate (Calvin Cycle).
2.2.2.1 Light Dependent Reactions
The light dependent reactions occur in a complex membrane system
(thylakoid membrane) via electron transfer through light induced generation of
cation- anion radical pairs and intermediate charge carriers such as plastoquinone,
plastocyanin and ferrodoxin. Light dependent reactions in green plants follow a Z
scheme which was first proposed by Hill et al. (Figure 2.3). In this scheme, light

14
energy is absorbed by light harvesting molecules and funneled to two special
reaction center molecules; P680 and P700 which are acting as major electron
donors in PS II and PSI respectively. Electron transport from PSII to PS I is
realized by intermediate charge carriers (Appendix A) and electron need of P680+
(strong oxidant with E0 = 1.1 eV) in PSII is compensated from water molecules
(water oxidation).
Figure 2.3 Z scheme electron transfer in terms of redox potentials
Electron transport through thylakoid membrane and water oxidation
reactions results in a proton concentration gradient across the thylakoid
membrane. Energy created by proton electrochemical potential resulting from this
proton gradient is used by ATP synthase to produce ATP from ADP and Pi. The
net reaction in light dependent reaction system is the electron transport form a
water molecule to a NADP+ molecule with the production of ATP molecules
(Figure 2.4).

15
Figure 2.4 Schematic illustration of electron and proton transport processes
and ATP synthesis in light dependent reactions [32]
In this complex electron transport system, PS II alone is composed of more
than 15 polypeptides and nine different redox components including chlorophylla
and b, pheophytin, plastoquinone.
Photosystem II is the only protein complex with the capability of oxidizing
water into O2 and protons. In PS II, water is oxidized with an Oxygen Evolving
Complex whose components are believed to be in the form of Mn4OxCaCly [33].
This inorganic core oxidizes two water molecules in Kok cycle, comprised of five
oxidation states (S states) of PSII donor site. In this model, oxygen formation
requires successive four light flashes for four-electron and four-proton release.
Recently, presence of an intermediate S4’ state and kinetics of completion of final
oxidation cycle responsible for O- O bond formation was revealed with time
resolved X ray study of Haumann et al. (Figure 2.5) [34].

16
Figure 2.5 Extension of classical S state cycle of the manganese- calcium
complex [34]
This high energy requiring water oxidation reaction with four- proton,
four- electron extraction and an oxygen- oxygen bond formation (with a standard
free energy requirement of 312 kJ/mol of O2) necessitates the regeneration of the
oxygen evolving complex at every half an hour in order to repair the damage
caused by the oxygen production [35].
In electron transfer from the oxygen evolving complex (OEC) to P680+
molecule, tyrosine (Yz*) acts as intermediate electron carrier. Protons evolved
from OEC are deposited in lumen phase contributing proton concentration
gradient (ΔpH) mentioned in ATP synthesis part. Excited electron upon light
absorption is transferred to the cytochrome b6f complex through a pheophytin, a
thightly bound phylloquinone (QA) and a mobile phylloquinone (QB).
Subsequently reduced phylloquinol (PQH2) (reduced with electrons from P680*
and two protons from stromal phase) releases two additional protons into lumen
phase as it binds to cyctochrome b6f complex after diffusion through thylakoid
membrane. Electron transfers from cyctochrome b6f complex to PS I (through
lumen phase) and from PS I to NADP+ molecule (through stromal phase) is
17
achieved by plastocyanin and ferrodoxin respectively. ATP synthesis reaction in
light dependent reactions is driven by the proton electrochemical and charge
potential across the membrane resulted from proton concentration difference and
charge separation during illumination respectively.
Produced NADPH and ATP molecules as a result of electron and proton
transport in light dependent reactions are used as energy and proton sources in
carbon dioxide reduction reactions in Calvin Cycle.
2.2.2.2 Light Independent Reactions
Light independent reactions take place in outer space of thylakoid
membrane which is also known as stromal phase. CO2 enters the leaf structure
through small perforations called stomata and diffuses into stromal phase in the
chloroplast where it is being reduced with reactions in series that are catalyzed by
more than ten enzymes. Driving force for the reduction reaction is supplied from
NADPH and ATP molecules; hence, the ‘catalytic’ reaction sequence does not
require light as an energy source and called as light independent reactions.
However, recent findings indicate light activation of enzymes due to regulatory
processes (reductive pentose phosphate).
Melvin Calvin and his collaborators were the first to resolve the
photosynthetic CO2 reduction mechanism with studies involving radioactively
labeled CO2. The Calvin Cycle, also known as reductive pentose phosphate
pathway consists of three sections:
1. CO2 fixation by carboxylation of rubilose 1,5- bisphosphate to two 3-
phosphoglycerate molecules,
2. Reduction of 3-phosphoglycerate to triose phosphate, and
3. Regeneration of rubilose 1,5- bisphosphate from triose phosphate
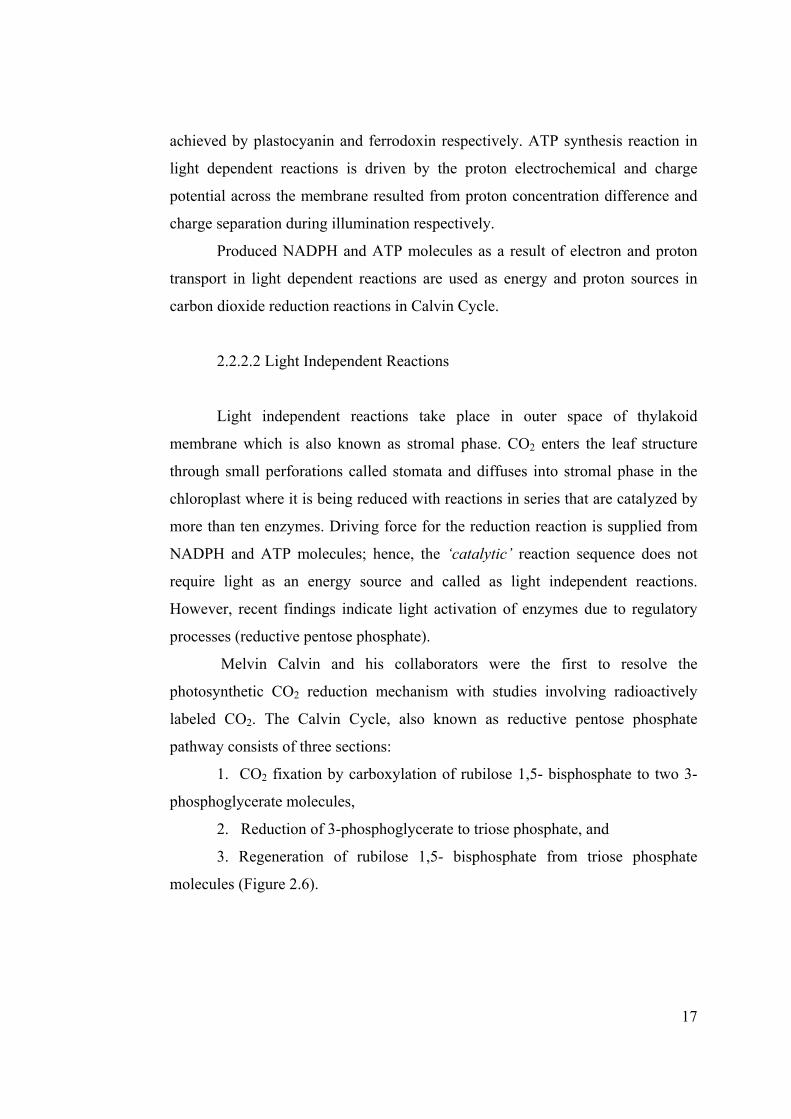
molecules (Figure 2.6).
18
Figure 2.6 The Calvin Cycle
The key reaction in photosynthetic CO2 reduction is the fixation of a CO2
molecule to rubilose 1,5- bisphosphate to two phosphoglycerate molecules with a
standard free energy of -35 kJ/mol indicating its irreversibility. This reaction is
catalyzed with the Ribulose biphosphate Carboxylase/Oxygenase (RubisCO)
enzyme which is one of largest enzymes in nature with its 8 large, 8 small
subunits (with molecular weights changing from 12 to 58 kDa). This enzyme also
catalyzes a side reaction, oxygenation, to give a 3-phospho glycerate and a 2-
phosphoglycolate instead of two 3- phosphoglycerates for CO2 fixation. Although
oxygenation occurs with a ratio of 1:4 to 1:2 (oxygenation:carboxylation),
oxygenation ratio decreases as CO2 concentration in the atmosphere is increased.
This regulatory measure of photosynthesis worths appreciation.
In carboxylation reaction catalyzed by RubisCO, rubilose 1,5-
bisphosphate (RuBP) accepts CO2 to form a keto intermediate after keto-enol
isomerization (Figure 2.7).
19
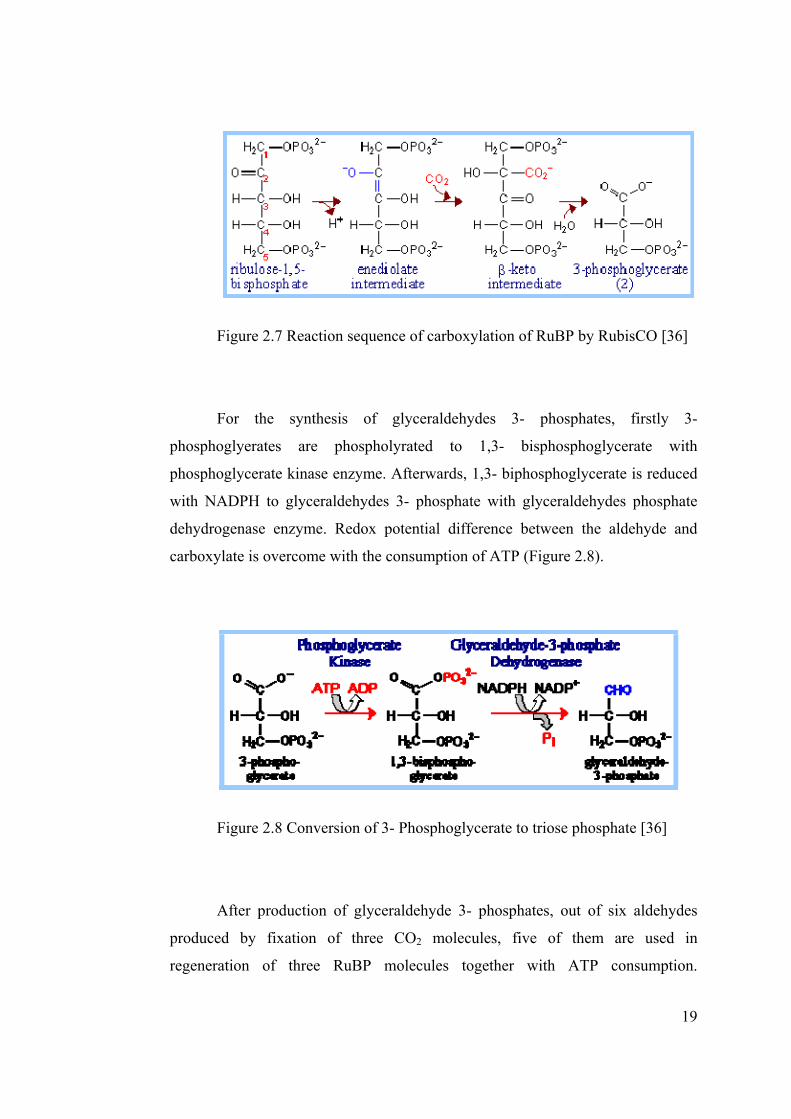
Figure 2.7 Reaction sequence of carboxylation of RuBP by RubisCO [36]
For the synthesis of glyceraldehydes 3- phosphates, firstly 3-
phosphoglyerates are phospholyrated to 1,3- bisphosphoglycerate with
phosphoglycerate kinase enzyme. Afterwards, 1,3- biphosphoglycerate is reduced
with NADPH to glyceraldehydes 3- phosphate with glyceraldehydes phosphate
dehydrogenase enzyme. Redox potential difference between the aldehyde and
carboxylate is overcome with the consumption of ATP (Figure 2.8).
Figure 2.8 Conversion of 3- Phosphoglycerate to triose phosphate [36]
After production of glyceraldehyde 3- phosphates, out of six aldehydes
produced by fixation of three CO2 molecules, five of them are used in
regeneration of three RuBP molecules together with ATP consumption.

20
Remaining one molecule of glyceraldehyde 3- phosphate is transported into the
cytosol for utilization in glucose synthesis.
2.2.3 Transport Processes
The vesicular thylakoid membrane structure defines a closed space
separating outside water phase (stromal phase) and inside water phase (lumen
phase). CO2 fixation reactions occur in the stromal phase while majority of light
dependent reactions are realized in the complex membrane system with embedded
protein complexes and intermediate charge carriers.
As mentioned in light dependent reactions, electron and proton transport
processes through protein complexes and intermediate charge carriers like
plastoquinone, plastocynanin and ferrodoxin molecules play an important role in
controlling photosynthetic rates. Within a protein complex such as PSII or
cyctochrome bf complex, electron transfer and pathway is controlled by
polypeptide chains of the protein. However between protein complexes, electron
transfer via electron carriers is controlled by distance and free energy. Below,
electron and proton transport processes taken place in light dependent reactions is
illustrated with particle sizes of protein complexes given by Ke et al. [37].
21
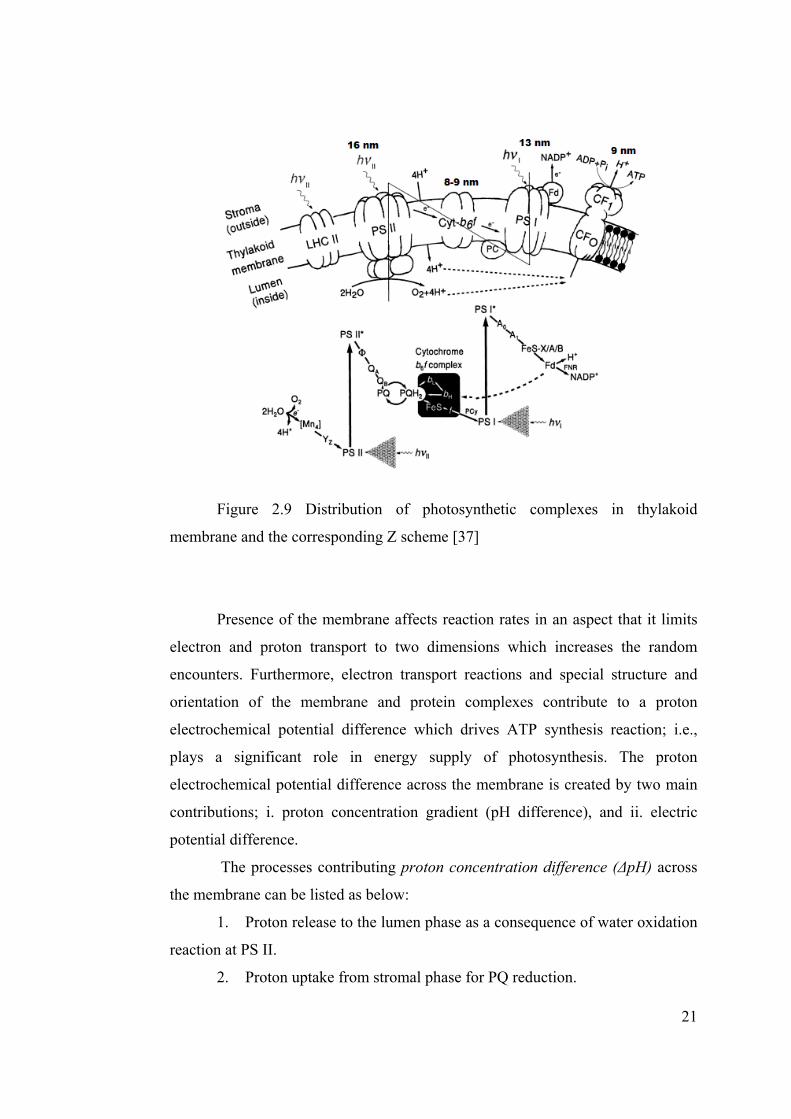
Figure 2.9 Distribution of photosynthetic complexes in thylakoid
membrane and the corresponding Z scheme [37]
Presence of the membrane affects reaction rates in an aspect that it limits
electron and proton transport to two dimensions which increases the random
encounters. Furthermore, electron transport reactions and special structure and
orientation of the membrane and protein complexes contribute to a proton
electrochemical potential difference which drives ATP synthesis reaction; i.e.,
plays a significant role in energy supply of photosynthesis. The proton
electrochemical potential difference across the membrane is created by two main
contributions; i. proton concentration gradient (pH difference), and ii. electric
potential difference.
The processes contributing proton concentration difference (ΔpH) across
the membrane can be listed as below:
1. Proton release to the lumen phase as a consequence of water oxidation
reaction at PS II.
2. Proton uptake from stromal phase for PQ reduction.

22
3. Proton release into lumen phase during PQH2 oxidation at cytochrome
b6f complex.
4. NADP+ reduction at stromal phase.
On the other hand, vectoral electron transfer process in PS II and PS I
initiated by photon absorption could be accounted as the reason for electric
potential difference (ΔΨ). Whitmarsh et al. [38] gave the proton electrochemical
potential difference with Equation (2).
μ 2.3 (2)
Where F is the Faraday constant, R is the ideal gas constant and T is
temperature in Kelvin. They reported that although electric potential difference
can be as large as 100 mV, pH difference has a dominating effect in overall
electrochemical potential. For a pH difference of 2 (with inner pH 6 and outer pH
8, ΔpH equivalent to 120 mV), the free energy difference across the membrane
results in -12 kJ/mol of proton.
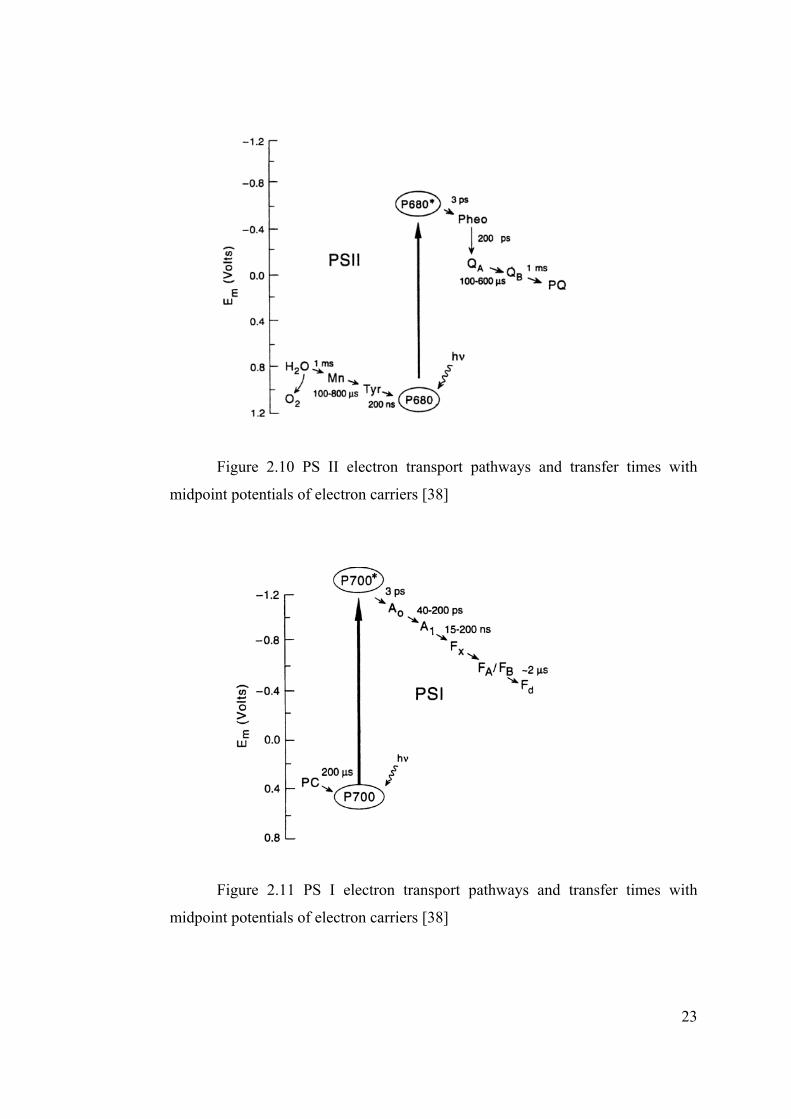
In photosynthesis, fastest reactions taking place are the photophysical
reactions like light absorption and charge separation in picoseconds orders. They
are followed with rapid photochemical processes like electron transfer reactions
and with slower biochemical reactions like water splitting and CO2 reduction.
Since photosynthesis is a series of reactions including photophysical,
photochemical and chemical reactions, reaction rates of particular reactions are
dependent upon transfer rates of reaction intermediates like electrons or protons.
In Figures 2.10 and 2.11, electron transfer times in PS II and PS I are given to
illustrate characteristic times of different processes.
23
Figure 2.10 PS II electron transport pathways and transfer times with
midpoint potentials of electron carriers [38]
Figure 2.11 PS I electron transport pathways and transfer times with
midpoint potentials of electron carriers [38]

24
Water oxidation and CO2 reduction reactions are the slowest processes in
photosynthesis. S- cycle taking place in PS II for water oxidation is completed
with a total of 1.59 ms, which is equivalent to production of 630 molecule of
O2/site/s. On the other hand, turnover frequency given for a subunit of RubisCO
for CO2 reduction is given as 3.3 s-1 [39], which is much slower than oxygen
evolution. Average photosynthesis rate of a sunflower was given as 13.5
µmol/m2/s by Whittingham et al. [40] and as 12 µmol/m2/s for Brassica pods with
an internal CO2 concentration of 292 ppm by Signal et al. [41] where rate of dark
CO2 fixation was given as 400 nmol/ mg protein/h.
2.2.4 Similarities and Differences between Photosynthesis and
Artificial Photosynthesis
Analogy between photosynthesis and artificial photosynthesis is in the
similar tools and methods utilized in both systems. Collecting solar energy for
triggering chemical reactions by chlorophyll pigments packed in thylakoid
membrane or by semiconductors; oxidizing water into molecular oxygen and
protons and reducing CO2 with transported electrons and H+s are among the
similarities of the two systems. However, the gap between the design of the
systems and number of reaction sites and intermediate molecules result in more
sophisticated such as (CH2O)6 in photosynthesis and simpler products in
photocatalysis (CH4 or CH3OH).
In photosynthesis, there are three major reaction centers in light dependent
reactions, regulating electron and proton transport together with the intermediate
charge carriers (redox components). In photocatalysis, on the other hand, design
of the system is limited to the presence of a pool of charges wandering on the
semiconductor/metal surface in an unregulated fashion, increasing the chance of
recombination of charge carriers. In addition, realization of oxidation and
reduction reactions on the same catalyst surface results in interactions between the
surface adsorbates which in some cases could be proven to be inhibitory on
reaction rates.

25
In photosynthesis, CO2 diffusion from atmosphere to stromal phase in
chloroplasts is controlled by stomata activities and permeability of chloroplast
membranes. Photosynthetic rate is limited with the CO2 concentration in stromal
phase for values lower than a saturation value; i.e., the photosynthetic rate is
linearly increasing with CO2 concentration. For CO2 concentrations above the
saturation value, photosynthetic rate stays constant, limited by the rate of the
enzyme system. Since CO2 concentration in the stromal phase is related to CO2
diffusion, photosynthetic rate is dependent upon diffusion rates.
In photocatalysis, diffusion of dissolved CO2 to the catalyst surface is
largely dependent upon the reactor types, reaction media and stirring rates. Since
the photocatalytic experiments are not standardized, the rate of CO2 diffusion and
its affect on surface concentrations and photocatalytic rates vary to a great extend.
In PSII of photosynthesis, there are over 15 polypeptides and 9 different
redox components responsible for water oxidation and electron transport. Even
the oxygen evolving complex is regenerating itself at every 30 minutes in order to
sustain its stability. Along with the sophistication of light dependent reactions
including numerous intermediate charge carriers, difference in the CO2 reduction
mechanism (activating CO2 by fixing it into another chemical) with 13 specific
enzymes result in higher photosynthetic rates and more complicated products
(such as glucose) in photosynthesis. On the other hand, C-C bond making is still
remaining as a challenge in artificial photosynthesis systems. Even with one
carbon chemical synthesis, photocatalytic rates are well below photosynthetic
rates. To illustrate, CO2 reduction using titanium nanotubes resulted in nearly 1
nmol/m2/s CH4 production rate [42] whereas an avarage photosynthetic rate is 12
µmol/m2/s.
2.3 CO2 PHOTOREDUCTION ON TiO2
Starting from the pioneering work of Inoue et al. [43], there have been
many photocatalytic CO2 reduction studies with TiO2. Studies are mainly
conducted either in gaseous media or liquid media, in several types of reactors. In

26
gaseous media CO2 is reduced to CH4 especially in the presence of Pt [13, 14, 28];
however, in liquid media most commonly encountered reduction product was
CH3OH especially in the presence of Cu [15, 20]. Literature results for
photocatalytic CO2 reduction in gaseous and liquid media for different reactor
types are summarized in Table 2.3.
Table 2.3 CO2 photoreduction normalized rates from literature
BATCH REACTORS
GAS PHASE LIQUID PHASE
Photocatalyst Normalized Rates (μmol*gcat-1*h-1)
Photocatalyst
Normalized Rates (μmol*gcat-1*h-1)
CH4 CH3OH CH4 CH3OH TiO2
10
H2O (g) 0,11 0,02 TiO2
H2O, Iso-propanol44 5,94
JRC TiO2
H2O (g)9 0,17 TiO2 (Degussa P-25)
H2O, 0.2N NaOH15 6,37
Cu/TiO2
H2O (g)8 0,013 0,0015 Cu/TiO2
H2O, 0.2N NaOH15 19,75
Ti-SBA-15 H2O(g)29
63,60 16,62 TiO2/SBA-15 H2O, 0.1N NaOH20
627
Ti-MCM-48, H2O(g)14
4,5 1,5 Cu/TiO2/SBA-15 H2O, 0.1N NaOH20
689,7
Pt/ Ti-MCM-48 H2O(g)14
7,5 0,48 TiO2 anatase
H2O, 0.2M NaOH45 0,38 0,045
TiO246
H2O (g) 0,2 0,003 Ag/ TiO2
H2O, 0.2M NaOH47 0,38 0,075
Ex-Ti-oxide/ Y-zeolite
H2O(g)13
4,2 2,4 TiO2 H2O, 1M isopropanol48
0,72
Pt TiNT H2O(g)49
0,07 Rh /TiO2 /WO3
H2O50 2,7
CdSe/Pt/TiO2
H2O(g)51 0,61 0,04 NiO InTaO4
H2O, 0.2M NaOH52 2,8
NT/Cu-600 H2O(g)53
2,84 CoPc TiO2
H2O, 0.1N NaOH54 9,3
Average Normalized Photocatalytic Rate w/o Ti-
SBA-15
2,5 Average Normalized Photocatalytic Rate w/o TiO2
SBA-15
5,4
Average Normalized Photocatalytic Rate
9,5 Average Normalized Photocatalytic Rate
68
27
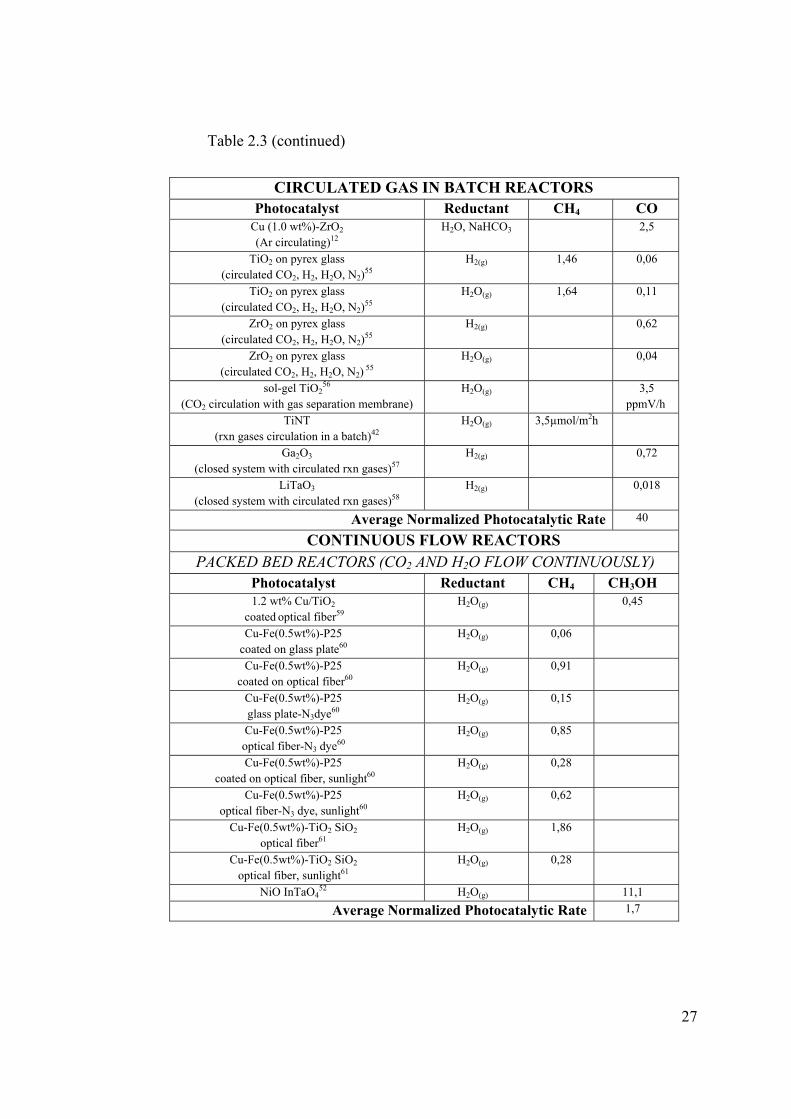
Table 2.3 (continued)
CIRCULATED GAS IN BATCH REACTORS
Photocatalyst Reductant CH4 CO Cu (1.0 wt%)-ZrO2 (Ar circulating)12
H2O, NaHCO3 2,5
TiO2 on pyrex glass (circulated CO2, H2, H2O, N2)55
H2(g) 1,46 0,06
TiO2 on pyrex glass (circulated CO2, H2, H2O, N2)55
H2O(g) 1,64 0,11
ZrO2 on pyrex glass (circulated CO2, H2, H2O, N2)55
H2(g) 0,62
ZrO2 on pyrex glass (circulated CO2, H2, H2O, N2) 55
H2O(g) 0,04
sol-gel TiO256
(CO2 circulation with gas separation membrane) H2O(g) 3,5
ppmV/h TiNT
(rxn gases circulation in a batch)42 H2O(g) 3,5µmol/m2h
Ga2O3
(closed system with circulated rxn gases)57 H2(g) 0,72
LiTaO3 (closed system with circulated rxn gases)58
H2(g) 0,018
Average Normalized Photocatalytic Rate 40
CONTINUOUS FLOW REACTORS PACKED BED REACTORS (CO2 AND H2O FLOW CONTINUOUSLY)
Photocatalyst Reductant CH4 CH3OH 1.2 wt% Cu/TiO2
coated optical fiber59 H2O(g) 0,45
Cu-Fe(0.5wt%)-P25 coated on glass plate60
H2O(g) 0,06
Cu-Fe(0.5wt%)-P25 coated on optical fiber60
H2O(g) 0,91
Cu-Fe(0.5wt%)-P25 glass plate-N3dye60
H2O(g) 0,15
Cu-Fe(0.5wt%)-P25 optical fiber-N3 dye60
H2O(g) 0,85
Cu-Fe(0.5wt%)-P25 coated on optical fiber, sunlight60
H2O(g) 0,28
Cu-Fe(0.5wt%)-P25 optical fiber-N3 dye, sunlight60
H2O(g) 0,62
Cu-Fe(0.5wt%)-TiO2 SiO2 optical fiber61
H2O(g) 1,86
Cu-Fe(0.5wt%)-TiO2 SiO2 optical fiber, sunlight61
H2O(g) 0,28
NiO InTaO452 H2O(g) 11,1
Average Normalized Photocatalytic Rate 1,7

28
Table 2.3 (continued)
SEMIBATCH REACTORS (CONTINUOUS CO2 FLOW) Photocatalyst Reductant C2H5OH CH3OH
NiO-InTaO4, visible light62 H2O,KHCO3 1,39
monoclinic BiVO4, visible light63 H2O 21,6 monoclinic BiVO4, UV+ visible light63 H2O 406
Average Normalized Photocatalytic Rate 143
As it can be seen from Table 2.3, reported photocatalytic CO2 reduction
rates vary with rector type and reaction media. Although different reactor types
and media seem to result in different observed reaction rates, on the overall,
photocatalytic CO2 reduction rates do not seem to be improved in orders of
magnitude with few exceptions.
One common practice in photocatalytic studies is the assumption of
negligible effect of mass transfer limitations in the observed kinetic rates. This
assumption is made based upon the slow photocatalytic reaction rates. However
presence of three-phases in liquid phase photocatalytic tests introduces mass
transfer limitations at interfaces which could hinder real kinetic rates.
In addition to the different mass transfer rates existing in different reactor
types and reaction media, different macro and micromixing conditions in different
reactor types could result in changes in kinetic rates and observed rate values
respectively. Especially relatively higher photocatalytic rates obtained with gas
circulation or semi batch reactors could be explained with the effect of different
micromixing conditions on reactions with different reaction orders.
Challenges in liquid media photocatalytic tests arising from mass transfer
limitations and possible effects of micromixing conditions on kinetic rates for
different types of reactors are discussed in sections 2.3.1 and 2.3.2.
29
2.3.1 Challenges in CO2 Photoreduction with H2O in Three-Phase
Systems
Comparison of the CO2 photoreduction literature results can be fallacious
because of the fact that, reaction conditions such as stirring rates, catalyst
concentration, liquid volumes and illumination intensities are not standardized for
photocatalytic experiments.
In order to understand effect of reaction conditions and be able to report
activity test results without any limitations on kinetics, it is required to take a
closer look into reaction media and transport phenomena realized in that media.
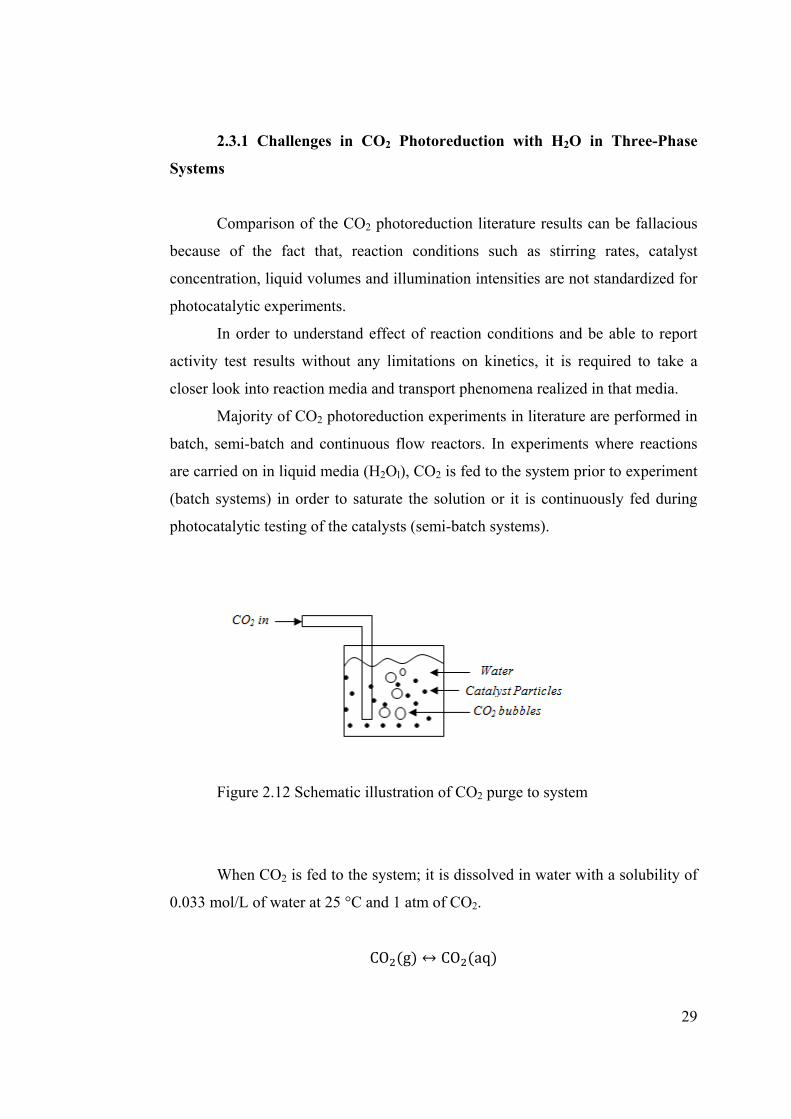
Majority of CO2 photoreduction experiments in literature are performed in
batch, semi-batch and continuous flow reactors. In experiments where reactions
are carried on in liquid media (H2Ol), CO2 is fed to the system prior to experiment
(batch systems) in order to saturate the solution or it is continuously fed during
photocatalytic testing of the catalysts (semi-batch systems).
Figure 2.12 Schematic illustration of CO2 purge to system
When CO2 is fed to the system; it is dissolved in water with a solubility of
0.033 mol/L of water at 25 °C and 1 atm of CO2.
CO g CO aq

30
Dissolved CO2 exists in equilibrium with carbonic acid in water with an
equilibrium constant of 1.7*10-3 at 25 °C which means that majority of CO2
remains as CO2 molecules.
CO aq H O l H CO aq
Carbonic acid dissociates in water to bicarbonate and carbonate ion in two
steps:
H CO aq H HCO aq Ka1= 4.6*10-7 at 25 °C
HCO aq H CO aq Ka2=5.6*10-11 at 25 °C
In other words, when 1 atm of CO2 is fed to neutral water, there are 0.033
mol of CO2, 5.7*10-5 mol of H2CO3 and 1.2*10-4 mol of HCO3- with negligible
amount of CO3-2 in 1 liter of water.
Solubility of CO2 depends on pH of water. Some alkaline chemicals may
be present in water, such as NaOH which is used in photocatalytic CO2 reductions
as hole scavengers. In such solutions, alkali-carbonates, such as sodium carbonate
or sodium bicarbonate, may be produced with solubilities of 220 g/L and 100g/L
respectively at 20 °C.
CO 2NaOH Na CO H O
Na CO CO H O 2NaHCO
Presence of alkali metals in solution may lead to interaction with catalyst
surface which can be detrimental or promoting to/for catalytic activity. To
illustrate, Na residues were reported to inhibit the interaction between CuO
particles with ZnO matrix in methanol synthesis from CO2 hydrogenation [64]
whereas K residues were reported to facilitate CO2 activation and dissociation
reactions on Rh (111) single crystal by decreasing minimum energy required for
photoelectron excitation [65].

31
2.3.1.1 Mass Transfer Considerations in Liquid Media Photocatalytic
Testing
Even though CO2 exists in CO2 (aq) and HCO3- (aq) forms in neutral
water, CO2 bubbles also exist in the solution together with suspended catalyst
particles in CO2 photocatalytic reduction tests performed in liquid media (Figure
2.13). Presence of three phases in such systems; gas (CO2), liquid (H2O) and solid
(catalyst particles), may lead to complications especially in mass transfer
processes. In order CO2 (g) to reach catalyst surface, it should overcome mass
transfer resistances across gas- liquid- solid interfaces as shown in Figure 2.13.
Figure 2.13 Schematic illustration of mass transfer limitations in a slurry
reactor
Gas reactant (CO2) participate five reaction steps in a slurry system:
1. Absorption from the gas phase into the liquid phase at bubble surface:
RCO2= kGab(CA,G-CA,Gi)
2. Diffusion in the liquid phase from bubble surface to bulk liquid:
RCO2= kLab(CA,Li-CA,L)

32
3. Diffusion from the bulk liquid to the external surface of the solid
catalyst: RCO2= ksapm(CA,L-CA,S)
4. Internal diffusion of the reactant in the porous catalyst
5. Reaction within the porous catalyst: RCO2= ηm(-rCO2’)
Mass transfer limitations are frequently overlooked in photocatalytic
reaction systems while assuming the system as reaction limited considering slow
observed reaction rates. However in three-phase systems, stirring rate plays an
important role in observed reaction rates. Increased stirring rates, and equivalently
flow rates, in slurry reactors are reported to have improving effects on
photocatalytic degradation kinetics for both suspended [66, 67] and immobilized
catalysts [68-70] referring to perturbations in concentration profile due to
probable boundary layer around catalyst particles.
Diffusion of CO2 from bulk liquid to external surface of solid particles and
also internal diffusion in catalyst particles may alter reaction kinetics, moreover
can be rate determining steps due to the probable presence of a boundary layer
surrounding catalyst particles in a three-phase system where mixing conditions are
not adequate. Especially in cylindrical reactors where mixing is supplied with a
magnetic stirrer like the majority of the systems found in literature, there are
stagnant zones at the walls of the reactor where formation of boundary layers
around catalyst particles is most probable.
Figure 2.14 Schematic illustration of stagnant zones in a slurry reactor
Magnetic stirrer
Stagnant zones

33
Super hydrophilicity of TiO2 under UV irradiation [7, 46, 71] could be
accounted as one of the reasons for water boundary layer formation around TiO2
particles. Mentioned boundary layer of water inhibits diffusion of reactants such
as CO2/ HCO3- as well as products to/from catalyst surface to a great extent which
results in very low concentrations of reactants on surface.
Figure 2.15 Schematic illustration of water boundary layer and diffusion of
reactants and products
Even though reactants survive until catalyst surface and react there, same
boundary layer will inhibit the diffusion of product to the bulk liquid. More time
the products spend on the catalyst surface or in the liquid volume where they can
interact with other catalyst particles, more chance there are that they can undergo
back-oxidation reactions. Oxidation of the products back to CO2 and H2 and
negative effects of those back oxidation reactions on photoreduction experiments
were reported by Koci et al. 2009 and Tan et al 2007 [45,72]. Recently, enhanced
production rates were reported with a gas separation membrane which removes
reaction products from reaction surface [56]. Increased reaction yields were
achieved since back oxidation reactions were prevented to some extend by
removing those intermediates and products from the surface.
CO2, HCO3-DAB
CH3OH
TiO2
H2O

34
2.3.2 Effect of Micromixing Conditions on Reaction Rates
As it can be seen from Table 2.3, gas circulation enhance the rates slightly
by postponing equilibrium and preventing back reactions by sweeping away
products from catalyst surface. In addition to those, different micromixing
conditions introduced in gas circulation reactors may contribute to enhanced rates.
Before explaining how, some introductory definition of micromixing, age and life
expectation terms will be made.
Starting from 1953 by Danckwert’s study, the urge to define non ideal
flow patterns in continuous flow reactors was satisfied by introducing “age” and
“life expectation” concepts [73, 74]. After describing mixing with two
components; macromixing and micromixing, effect of different mixing conditions
on reactor performances started to be questioned [75]. Macromixing was defined
as being the component that specifies the variation in residence times experienced
by the molecules flowing through the system; whereas, micromixing was more
concerned with the environment experienced by those molecules.
In plug flow reactors, molecules entering the reactor experience same
residence time and therefore same have same life expectation. However molecules
inside the reactor have residence times less than entering ones which obstructs
micromixing.
In CSTRs, molecules within the reactor and entering to the reactor
experience same life expectation and residence time distribution function which is
exponential decay function. Micromixing must occur to provide that overlap of
those two distributions.
Micromixing is related to the attainment of homogeneity at molecular level
and micromixing levels are classified by the earliness or lateness of the
association of entering molecules with older molecules within the reactor. Two
extremes of micromixing are segregated flow in which association takes place at
the exit of the reactor and maximum mixedness in which association is as early as
possible.

35
Figure 2.16 Segregated and maximum mixedness flow models
Micromixing conditions affect the chemical reactions by changing their
conversions and selectivity. In study of Weinstein et al., segregated flow was
observed from calculations to increase second order reaction kinetics and
furthermore, Chauhan et al proved the positive effect of micromixing on reaction
rates for reactions having orders less than one by a general statement;
• For reactions having reaction rates in the form of R(C) = k* Cn, for n
>1 (or d2R/dC2 > 0), segregation yields maximum conversion.
• For n = 1, all micromixing policies yield the same conversion.
• For n < 1 (or d2R/dC2 < 0), maximum mixedness yields maximum
conversion [76].
When CO2 photoreduction reaction with H2O is concerned, reaction rate
Equation (3) is obtained for a Langmuir- Hinshelwood reaction mechanism,
2 2
3
2 2 2 2
2
31
CO H OCH OH
H O H O CO CO
kP P Ir
K P K P
α
=⎡ ⎤+ +⎣ ⎦ (3)
where I is defined as illumination intensity [77].
Reaction rate equation simplifies to Equation (4) assuming higher water
adsorption constant and concentration in liquid media (See section 2.4).
(4)

36
For reaction order less than one; for H2O in this situation, maximum
mixedness is expected to give better conversions. Therefore, higher mixing rates,
approaching to ideal CSTR case is preferred. For CO2, segregated flow would
increase conversion. Both of these conditions; i.e., maximum mixedness for water
and segregated flow for carbon dioxide are satisfied with batch reactors with gas
circulation of CO2. This special feature of gas circulation reactors may explain the
observed enhanced kinetic reaction rates.
2.4 KINETIC CONSIDERATIONS
2.4.1 Photocatalytic CO2 Reduction Reaction Mechanism
The photocatalytic CO2 reduction reaction mechanism still holds its
ambiguity, even though there are several propositions like formation of C· and H·
and OH· radicals and formation of CH4 and methanol either from H· or OH·
respectively [45, 78].
Mechanism proposed by Tan et al. is as follows [78]:
TiO e h
H O h • OH H• OH H O 3h O 3H
2H O 4h O 4H
CO CO 12 O
CO • C 12 O
CO • C O
• C 4H 4e CH
2H 2e H
And similarly, with the addition of excited state of TiO2 and formation of
methanol, Koci et al. proposed the following mechanism [45]:
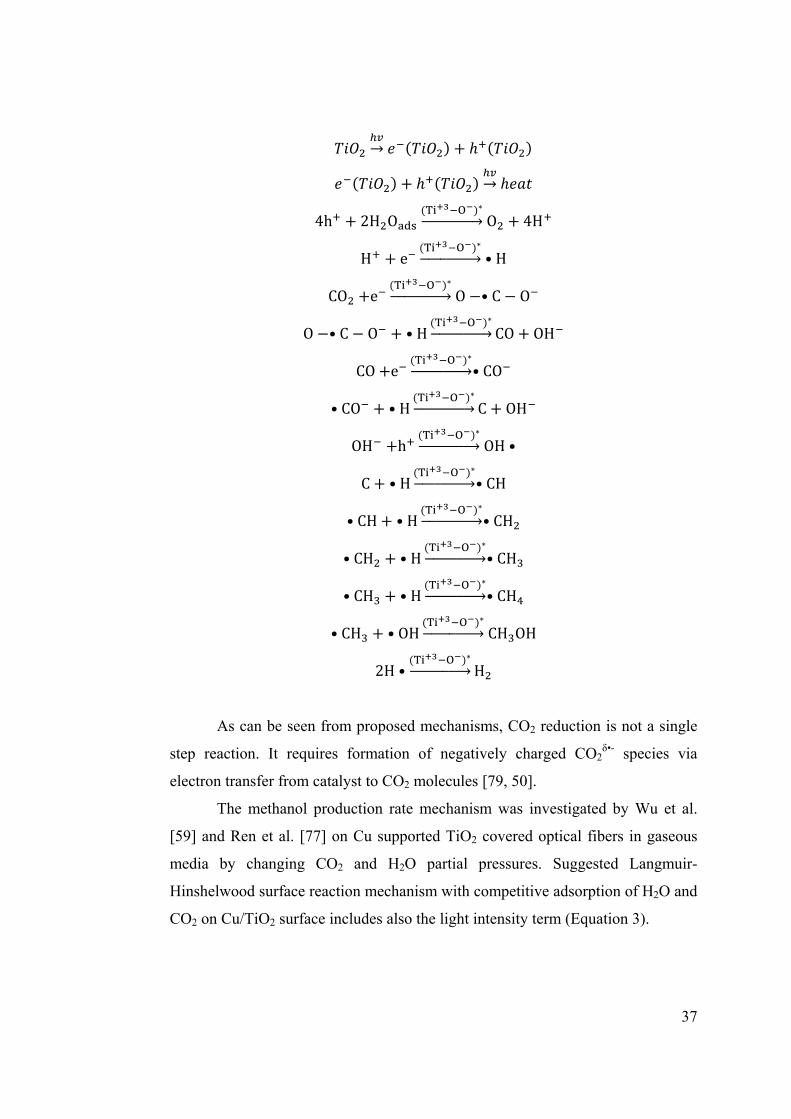
37
4h 2H OT O
O 4H
H eT O
• H
CO eT O
O • C O
O • C O • HT O
CO OH
CO eT O
• CO
• CO • HT O
C OH
OH hT O
OH •
C • HT O
• CH
• CH • HT O
• CH
• CH • HT O
• CH
• CH • HT O
• CH
• CH • OHT O
CH OH
2H •T O
H
As can be seen from proposed mechanisms, CO2 reduction is not a single
step reaction. It requires formation of negatively charged CO2δ•- species via
electron transfer from catalyst to CO2 molecules [79, 50].
The methanol production rate mechanism was investigated by Wu et al.
[59] and Ren et al. [77] on Cu supported TiO2 covered optical fibers in gaseous
media by changing CO2 and H2O partial pressures. Suggested Langmuir-
Hinshelwood surface reaction mechanism with competitive adsorption of H2O and
CO2 on Cu/TiO2 surface includes also the light intensity term (Equation 3).
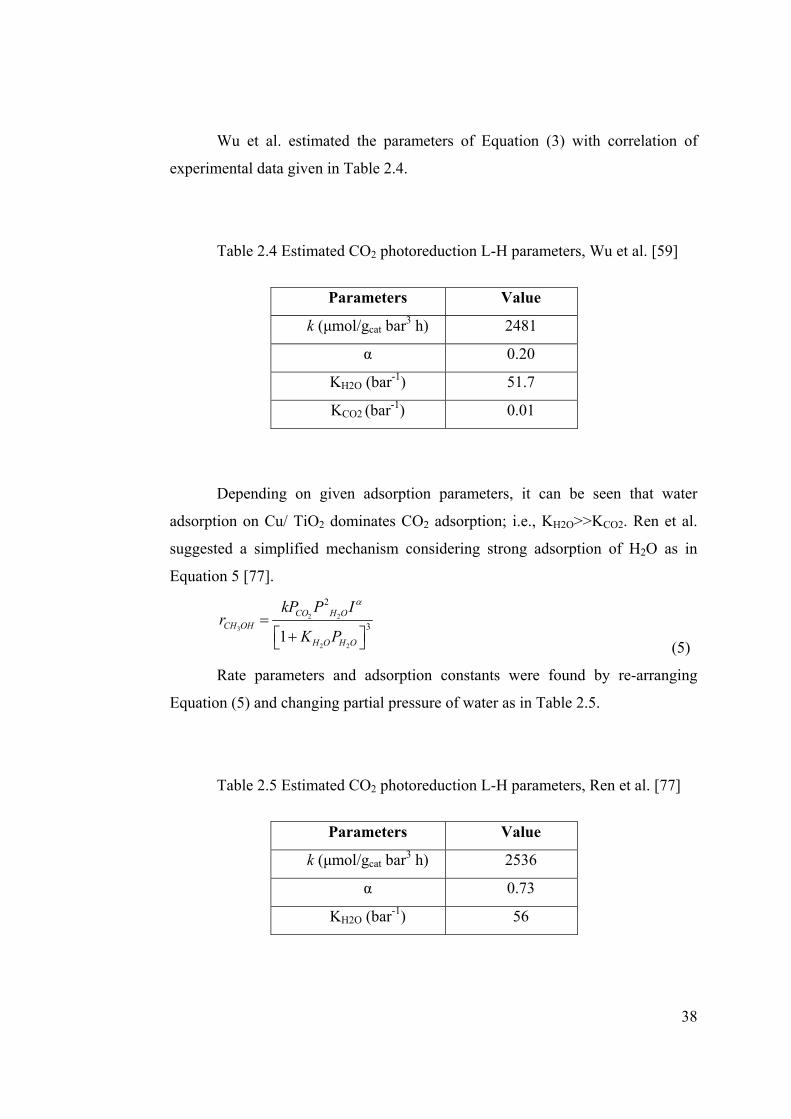
38
Wu et al. estimated the parameters of Equation (3) with correlation of
experimental data given in Table 2.4.
Table 2.4 Estimated CO2 photoreduction L-H parameters, Wu et al. [59]
Parameters Value
k (μmol/gcat bar3 h) 2481
α 0.20
KH2O (bar-1) 51.7
KCO2 (bar-1) 0.01
Depending on given adsorption parameters, it can be seen that water
adsorption on Cu/ TiO2 dominates CO2 adsorption; i.e., KH2O>>KCO2. Ren et al.
suggested a simplified mechanism considering strong adsorption of H2O as in
Equation 5 [77].
2 2
3
2 2
2
31
CO H OCH OH
H O H O
kP P Ir
K P
α
=⎡ ⎤+⎣ ⎦ (5)
Rate parameters and adsorption constants were found by re-arranging
Equation (5) and changing partial pressure of water as in Table 2.5.
Table 2.5 Estimated CO2 photoreduction L-H parameters, Ren et al. [77]
Parameters Value
k (μmol/gcat bar3 h) 2536
α 0.73
KH2O (bar-1) 56

39
Reported weaker adsorption of CO2 with TiO2 than that of H2O (together
with earlier reports; [13, 14]) could be related to photo induced super
hydrophilicity of TiO2 [7, 46, 71] which supports probability of water boundary
layer formation around TiO2 particles.
2.4.2 Catalytic Contributions to Photocatalysis
Sahibzaba et al. [80] revealed that kinetic inhibitions at finite conversions
of CO2 into methanol has been mainly caused by increasing concentration of
product water and relatively increasing oxygen coverage on copper surface.
Similarly one can infer inhibition of TiO2 surface in abundance of water for CO2
photoreduction reactions. Apart from the fact that TiO2 is super hydrophilic under
UV illumination and electronic interactions and also higher tendency of TiO2 to
adsorb water causes a boundary layer of water particles surrounding TiO2 based
photocatalysts, high concentrations of water would make CO2 activation; i.e.,
electron transfer from oxygen deficient TiO2 to CO2 impossible by oxidizing TiO2
surface.
Formation of CO2- is attributed to the defect structure of TiO2 by Rasko et
al. [81]. Higher oxygen deficiencies of TiO2 result in higher concentrations of free
electrons and therefore ease the electron transfer from Ti+3 molecules to CO2.
However one electron reduction potential of CO2 is much higher than multi
electron potential requirements and also higher than conduction band levels of
commonly used photocatalysts (CO2+e-→CO2•- E0
redox= -1.9 V vs. NHE at pH 7).
Therefore, one can say that without a specific interaction between the surface and
CO2, CO2 reduction is not possible.
Electron affinity of CO2 molecule is related to the position of lowest
unoccupied molecular orbital of CO2 and conduction band of TiO2, assuming that
electron is transferred from excited state of TiO2 (Ti+3-O-) to CO2. A decrease in
lowest unoccupied molecular orbital (LUMO) of CO2 was reported with lower
bond angles that could result from the interaction of the molecule with the surface
[82]. According to Indrakanti et al., CO2 gains electrons from oxygen deficient
40
TiO2 via the formation of bent CO2 molecules near Ti+3 sites, whereas electron
transfer is not favorable with defect free TiO2 due to high LUMO of CO2 [83].
In studies of Solymosi, radical anion CO2- was designated to be essential
for CO2 reduction reactions. Addition of electron donating characters such as K to
single metal surfaces like Rh (111) or doping TiO2 with higher valent metals such
as W+6 increases electron concentration on metals and also electric conductivity of
semiconductors (TiO2) resulting in higher rates of CO2 activation and also
photolysis. (Minimum energy required for photoelectron excitation was reported
to decrease with K addition.)
Study of Rasko et al., showed that even if oxygen deficient TiO2 is
compatible to produce CO2- anions, it could not dissociate CO2. For dissociation
of CO2, a metal; Rh, incorporated to TiO2 surface is needed [81]. Also they
reported CO formation on Rh/ TiO2 catalyst even under dark conditions, with an
increase with illumination. In literature dark methane formation was also reported
previously although in very small amount [13, 53].
In study of Solymosi et al. where CH3Cl dissociation on Pd (100) surface
was investigated, cleavage of C-Cl bond was found to be photoinduced where as
following reactions regarding dissociation of CH3 to CH2 and C were designated
as thermal processes [84].
Considering above arguments, one can claim that in CO2 photoreduction
reactions, predominant step; CO2 activation is being realized with the promotion
of electron conductivity through generation of photo induced electrons, and
following reduction steps were realized catalytically on metal incorporated TiO2
surface.
Increased CO2 photoreduction rates at elevated temperatures were
observed in literature. In study of Chen et al., methane production activity on
magnetron sputtered TiO2 film was reported to be tripled when temperature was
raised to 353 K from 298 K [23]. Similarly methane production from CO2
reduction was reported to increase to 0.3 µmol*gcat-1*h-1 from 0.07 µmol*gcat
-1*h-1
as temperature raised from 323 K to 343 K with Pt doped titania nanotubes [49].
Another enhancement in production rates was observed with NiO doped InTaO4
41
catalyst, in production of methanol; initial production rate was observed to be
doubled (from 12 µmole/gcat/h to 24 µmole/gcat/h) as temperature raised to 348 K
from 298 K [52].
In a recent study by Uner et al., CH4 formation under dark conditions was
observed upon hydrogen exposure to previously formed carbon deposition on
Pt/TiO2 catalyst. With elevation of temperature to 85 °C from room temperature,
methane formation increased approximately 8 times [85]. Photocatalytic methane
formation with hydrogenation of CO2 together with the temperature sensitivity of
the photocatalytic CO2 reduction reaction encourages one to think about the
presence of thermally induced steps in CO2 reduction at which presence of
hydrogen or H• radicals play an important role.
In photocatalytic studies and also in photosynthesis, water oxidation
reaction is considered to be the key step with very high standard Gibbs free
energy: 312 kJ/mol O2. Concentration and availability of H• radicals on the
catalyst surface, limited by the water oxidation rates could be important in
photocatalytic CO2 reduction rates. In order to have a better insight in
photocatalytic CO2 reduction mechanism and possible rate determining steps,
kinetic and microkinetic analysis of CO2 reduction with copper based catalyst
were performed regarding the mentioned possible similarities in catalytic and
photocatalytic CO2 reduction reactions mechanisms. Methods and assumptions
used in kinetic analysis can be found in Section 3.1.
2.4.3 Catalytic CO2 Hydrogenation with Copper Based Catalysts
Catalytic CO2/CO hydrogenation to CH3OH with copper based industrial
Cu/ZnO/Al2O3 catalysts is a commercial process for decades with the special
emphasis on CO2 to be the main carbon source of CH3OH after isotope labeling
experiments [86]. Catalytic methanol synthesis was observed to be favored with
addition of CO into CO2 feed, as a consequence of water gas shift reaction [87].
3 ∆ 49.47 ∆ 3.30
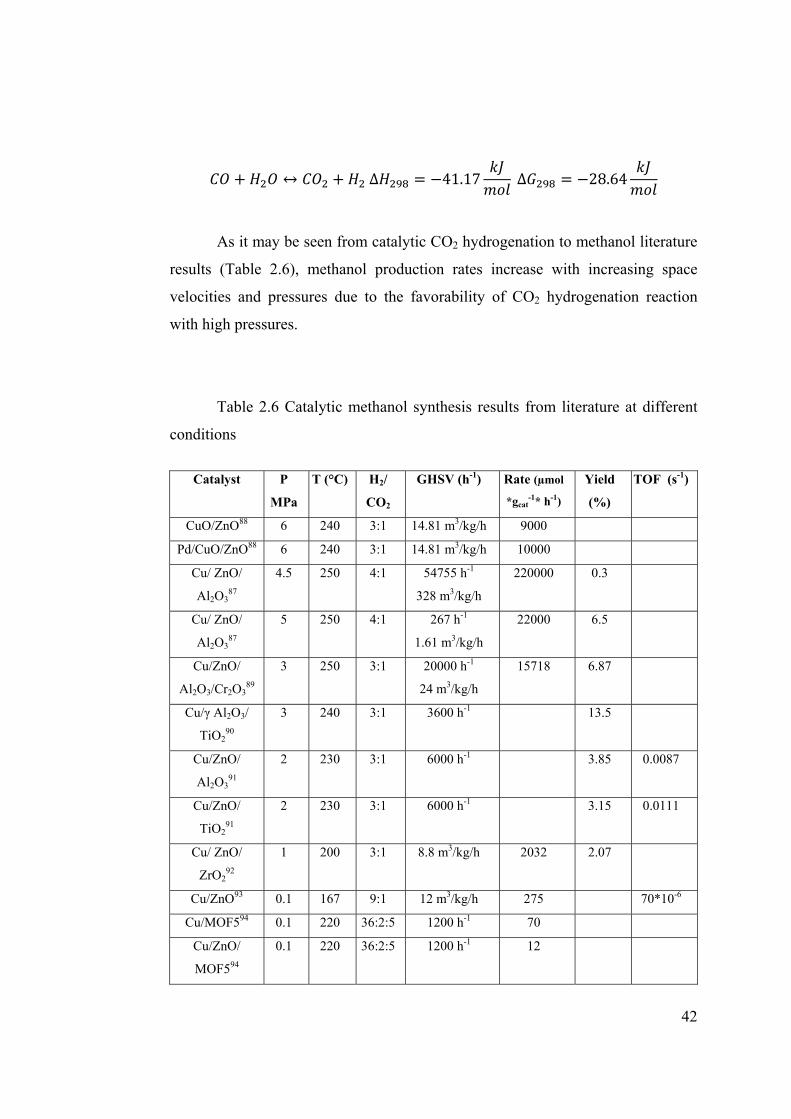
42
∆ 41.17 ∆ 28.64
As it may be seen from catalytic CO2 hydrogenation to methanol literature
results (Table 2.6), methanol production rates increase with increasing space
velocities and pressures due to the favorability of CO2 hydrogenation reaction
with high pressures.
Table 2.6 Catalytic methanol synthesis results from literature at different
conditions
Catalyst P
MPa
T (°C) H2/
CO2
GHSV (h-1) Rate (µmol
*gcat-1* h-1)
Yield
(%)
TOF (s-1)
CuO/ZnO88 6 240 3:1 14.81 m3/kg/h 9000
Pd/CuO/ZnO88 6 240 3:1 14.81 m3/kg/h 10000
Cu/ ZnO/
Al2O387
4.5 250 4:1 54755 h-1
328 m3/kg/h
220000 0.3
Cu/ ZnO/
Al2O387
5 250 4:1 267 h-1
1.61 m3/kg/h
22000 6.5
Cu/ZnO/
Al2O3/Cr2O389
3 250 3:1 20000 h-1
24 m3/kg/h
15718 6.87
Cu/γ Al2O3/
TiO290
3 240 3:1 3600 h-1 13.5
Cu/ZnO/
Al2O391
2 230 3:1 6000 h-1 3.85 0.0087
Cu/ZnO/
TiO291
2 230 3:1 6000 h-1 3.15 0.0111
Cu/ ZnO/
ZrO292
1 200 3:1 8.8 m3/kg/h 2032 2.07
Cu/ZnO93 0.1 167 9:1 12 m3/kg/h 275 70*10-6
Cu/MOF594 0.1 220 36:2:5 1200 h-1 70
Cu/ZnO/
MOF594
0.1 220 36:2:5 1200 h-1 12

43
Higher methanol formation rates (compared to photocatalytic rates; e.g. 20
µmol *gcat-1* h-1) in catalytic CO2 hydrogenation experiments could be attributed
to high temperatures and pressures. For a more proper comparison, catalytic rates
at room conditions (as they are in photocatalysis) will be reported via kinetic and
microkinetic analysis.
44
CHAPTER 3
MATERIALS AND METHODS
3.1 CATALYST PREPARATION
3.1.1 Mass Transfer Limitation Experiments
Catalysts used in stirring rate, gas hold-up time and effect of temperature
experiments are 0.5 and 1 wt % Pt/ TiO2 and they were prepared by incipient
wetness method. Pt source; Pt (NH3)4Cl2·H2O (Alfa Aesar) was dissolved in
deionized water and mixed with TiO2 Degussa P25. After drying at room
conditions for one day, and at 120 °C for 2 h, the catalysts were calcined at 410
°C for 5 h.
3.1.2 Photocatalytic CO2 Reduction Experiments
Commercial TiO2 Degussa P-25 catalyst and sol- gel prepared TiO2
catalyst were used in this study with copper; either loaded with incipient wetness
method or with direct addition to sol-gel mixture.
There are four sets of catalysts prepared for photoreduction experiments:
3.1.2.1 First Set
First set of Cu/Degussa P25 catalysts (1, 2 and 3 wt %) were prepared by
incipient wetness method. In incipient wetness method, copper source;
Cu(NO3)2.3H2O was dissolved in 10 ml distilled water for 5 g of TiO2 Degussa

45
P25. After dissolving copper salt, TiO2 Degussa P25 was added and mixed
thoroughly. The mixture was left to overnight drying at room conditions and
further dried at 150 °C for 2 hours. Finally, the dried catalyst was calcined at 500
°C for 30 minutes under air (Figure 3.1).
Figure 3.1 Preparation procedure of first set of catalyst; incipient wetness
method
Dissolve Cu(NO3)2 ·3H2O
in deionized water
Mixing with TiO2 (Degussa P-25)
and stirring
Drying at 150 °C
for 2 h
Calcination at 500 °C for 30 min

46
3.1.2.2 Second Set
Second set of catalysts were prepared via sol- gel method. In sol-gel
method, titanium isopropoxide, (Ti{OCH(CH3)2}4), ethanol (C2H5OH), acetic
acid (CH3COOH), and water is mixed at volumetric ratios of 15:90:1:1 and stirred
for 15 h. Afterwards, copper source; Cu (NO3)2. 3H2O (1 and 2 wt %) was added
to the mixture and further stirred for 30 minutes. The mixture was again dried at
150 °C for 2 hours and calcined at 500 °C for 30 minutes (Figure 3.2).
Figure 3.2 Preparation procedure of second set of catalysts
Mixing Titanium isopropoxide
(Ti{OCH(CH3)2}4), C2H5OH,
CH3COOH and H2O (15:90:1:1) for 15 h
Adding Cu(NO3)2 ·3H2O
into sol-gel and further mixing for 30 min
Drying at 150 °C
for 2 h
Calcination at 500 °C for 30 min

47
3.1.2.3 Third Set
For preparation of the third set of catalysts; surfactant and also titanium
oxide anatase nanopowder (Aldrich, <25 nm) was added to the sol-gel mixture in
order to obtain higher surface areas in sol-gel prepared TiO2. Firstly, surfactant;
Pluronic 123 is dissolved in ethanol and then titanium anatase nanopowder,
titanium isopropoxide and nitric acid (HNO3) was added to the mixture. After
stirring it for 20 hours, copper source; copper nitrate (II) trihydrate (1 wt %) was
added and further stirred for 30 min. The mixture was again dried at 150 °C for 2
hours and calcined at 500 °C for another 2 hours in order to burn surfactant
thoroughly (Figure 3.3).
3.1.2.4 Fourth Set
The difference between third set and fourth set of catalysts is that; in
fourth set, copper is added to sol-gel prepared catalyst by incipient wetness
method. In the sol-gel mixture, surfactant, ethanol, titanium anatase nanopowder,
titanium isopropoxide and nitric acid were added and stirred for 80 hours this
time, and dried at 150 °C for 2 hours and calcined at 500 °C for 5 hours. After
calcination, copper was added by previously mentioned incipient wetness method
and further calcined at 500 °C for 2 hours after drying at 150 °C for 2 hours
(Figure 3.4).

48
Figure 3.3 Preparation procedure of third set of catalysts
Dissolve surfactant
Pluronic P123 in C2H5OH
Calcination at 500 °C
for 2 h
Addition of TiO2
nanopowder (anatase), Titanium isopropoxide
(Ti{OCH(CH3)2}4) and HNO3 and mixing for 20 h
Drying
at 150 °C for 2 h
Addition of Cu(NO3)2 ·3H2O
into sol-gel and further mixing for 30 min
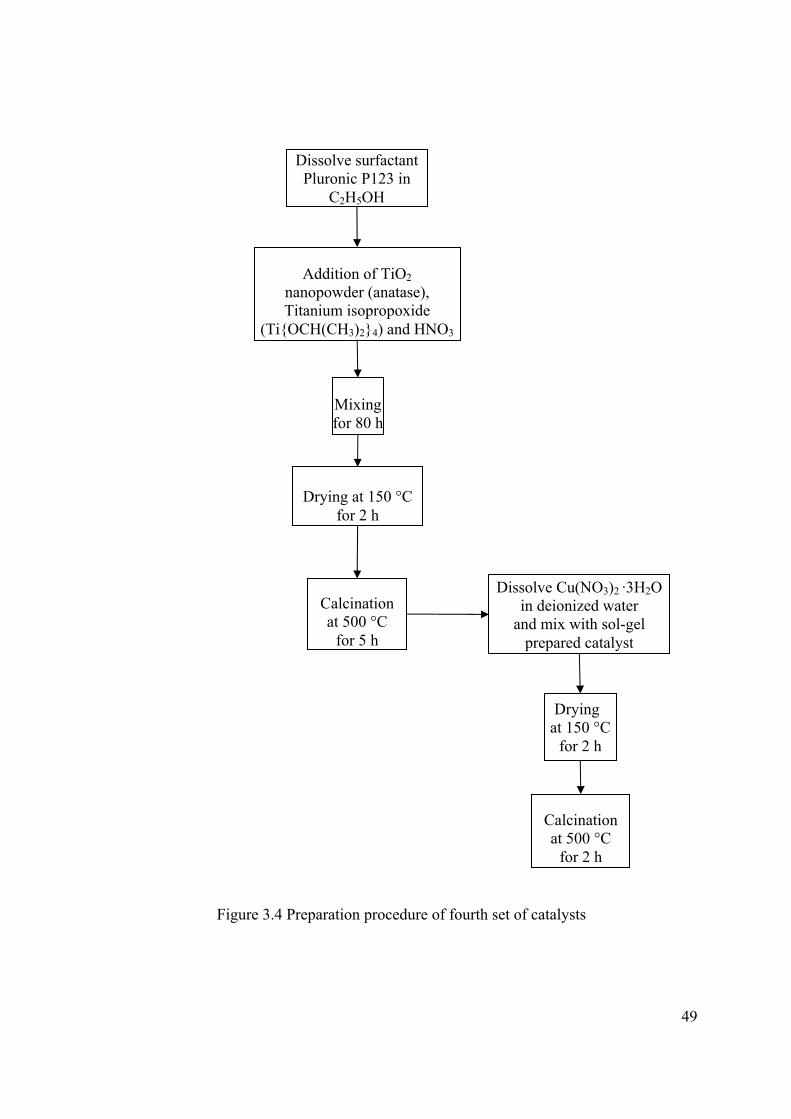
49
Figure 3.4 Preparation procedure of fourth set of catalysts
Dissolve surfactant Pluronic P123 in
C2H5OH
Calcination at 500 °C
for 5 h
Addition of TiO2
nanopowder (anatase), Titanium isopropoxide
(Ti{OCH(CH3)2}4) and HNO3
Drying at 150 °C
for 2 h
Mixing for 80 h
Dissolve Cu(NO3)2 ·3H2O in deionized water
and mix with sol-gel prepared catalyst
Calcination at 500 °C
for 2 h
Drying at 150 °C
for 2 h

50
3.2 CATALYST CHARACTERIZATION
BET surface area measurements of Cu/TiO2 catalysts were done by
automated ASAP 2000 Micromeritics N2 adsorption equipment. All of the
samples were dried under vacuum in order to eliminate water vapor adsorbed on
surface of powder catalysts.
X ray diffraction (XRD) analysis was done to determine crystallinity of the
catalysts and also to investigate other phases formed with copper titania. The
analysis was done by a Philips PW 1840 Diffractometer.
Transmission Electron Microscopy (TEM) was used to observe
morphology of the prepared catalysis and also to measure copper particle sizes on
TiO2. The microscopy was performed with a JEOL JEM 2100F STEM.
X ray photoelectron spectroscopy (XPS) measurements were performed at
Central Laboratory, M.E.T.U., as additional information. XPS measurement
results can be seen in Appendix C.
3.3 CATALYST TESTING
3.3.1 Mass Transfer Limitation Experiments
In stirring rate and effect of temperature experiments, photocatalytic
hydrogen evolution tests were conducted in a batch Pyrex glass reactor containing
250 ml de-ionized water and 2 ml methanol mixture with 0.25 g of catalyst. Total
volume of the reactor was measured to be 354 ml comprised 250 ml liquid volume
and 104 ml gas volume including pipe connections to manometer. The cylindrical
shape Pyrex glass reactor has a diameter of 5 cm and a height of 18 cm,
approximately 13 cm of which belongs to liquid volume for 250 ml of water. The
magnetic stirrer has a diameter of 3 cm (Figure 3.5).

51
Figure 3.5 Schematic illustration of the set-up
In gas hold-up time experiment, amount of de-ionized water in the same
reactor has been changed to 187.5, 125 and 62.5 ml, in order to alter the path
distance and hold-up time of product hydrogen in liquid media (before transferred
into gas phase). The methanol and catalyst concentration was kept the same for
each solution in gas hold-up time experiments. The catalyst concentration was
selected to be 1 g/L for each experiment for it is being the optimal concentration
reported by Tseng et al. in terms of photo-activation [15].
The solutions were purged with N2 for 30 min in order to remove
dissolved O2 from deionized water and from closed gas volume. After purging,
100 W UV lamp (365 nm) is activated and batch testing of the catalysts were
performed while stirring the solution with a magnetic stirrer. The distance of the
UV lamp was taken constant at each experiment and the reactor set up is covered
with an aluminum foil for better illumination of the reactor. Gas samples were
withdrawn from closed gas volume for every 15 min with a gas syringe and
analyzed with a HP 4890 GC with TCD equipped with a 6’ Alltech Porapak Q
column (Table 3.1). The pressure and temperature were recorded for each sample
withdrawn (Raw data of the experiment and product amount calculations are
UV Light (100W) 360 nm
Sampling syringe
Magnetic stirrer
Thermometer
Manometer
N2/ CO2

52
given in Appendix B). The temperature of the reactor reached to upmost 40 °C
because of UV irradiation during reaction.
Table 3.1 GC/ TCD Operation Parameters
Column Characteristics Alltech Porapak Q 6’ 1/8’’ .085’’
Column Head Pressure 15 psi
Column Temperature 35 °C
Injection Temperature 40 °C
Detector Temperature 50 °C
3.3.2 Photocatalytic CO2 Reduction Experiments
The photocatalytic testing of the Cu /TiO2 catalysts for methanol
production were done in a Pyrex reactor containing 300 ml of de-ionized water
and 0.3 g catalyst under 365 nm UV light illumination (Figure 3.5). Prior to batch
testing of the prepared catalysts, CO2 was purged into the system for 30 minutes
in order to saturate the solution. After purging, the system was closed and UV
light (100W) was activated while a magnetic stirrer continuously mixed the
solution at 1000 rpm.
Liquid samples (1 ml) were withdrawn from the solution every hour and
filtered through millipore filters in order to eliminate catalyst particles from the
solution. After filtering, samples were kept in sample holder and withdrawn with
liquid syringes (2 μl) for GC analysis.
The samples were analyzed with HP-5890 GC, with flame ionization
detector, equipped with a 12’ Porapak Q column. Operation method parameters
were given in Table 3.2.

53
Table 3.2 GC/ FID Operation Parameters
Column Characteristics Alltech Porapak Q 12’ 1/8’’ .085’’
Column Head Pressure 40 psi
Column Temperature 150 °C
Injection Temperature 220 °C
Detector Temperature 230 °C
3.4 KINETIC AND MICROKINETIC MODELLING OF
METHANOL FORMATION
3.4.1 Calculation of Methanol Formation Rates with the Steady State
Kinetic Model Proposed by Vanden Bussche et al. [95]
Methanol formation rates through CO2 hydrogenation and water gas shift
reactions over a Cu based catalyst were calculated by using steady state kinetic
model proposed by Vanden Bussche et al. for Cu/ZnO/Al2O3 catalyst [95]. In their
model, CO2 was taken as the main source of carbon in methanol whereas water
gas shift reaction produces extra CO2.
3
Methanol production rate was derived by assuming a pseudo steady state
concentration of surface intermediates. Rate determining steps were selected to be
for water gas shift reaction and
for CO2 hydrogenation.
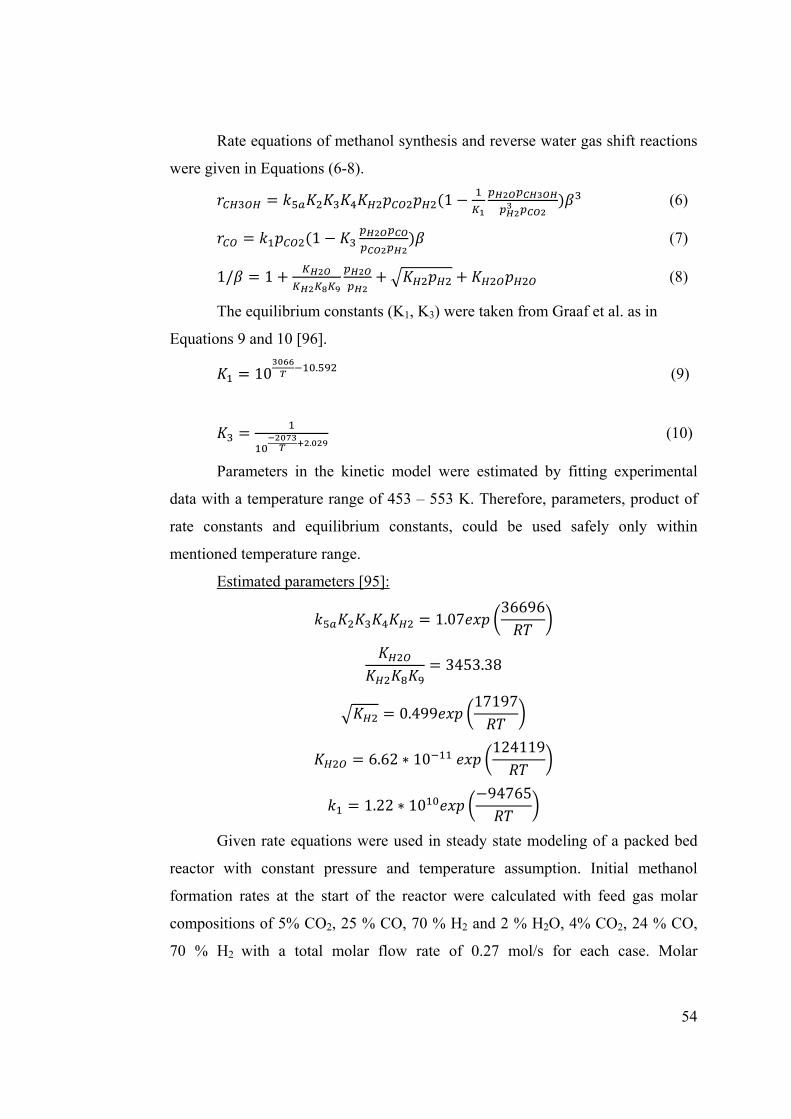
54
Rate equations of methanol synthesis and reverse water gas shift reactions
were given in Equations (6-8).
1 (6)
1 (7)
1/ 1 (8)
The equilibrium constants (K1, K3) were taken from Graaf et al. as in
Equations 9 and 10 [96].
10 . (9)
. (10)
Parameters in the kinetic model were estimated by fitting experimental
data with a temperature range of 453 – 553 K. Therefore, parameters, product of
rate constants and equilibrium constants, could be used safely only within
mentioned temperature range.
Estimated parameters [95]:
1.0736696
3453.38
0.49917197
6.62 10 124119
1.22 1094765
Given rate equations were used in steady state modeling of a packed bed
reactor with constant pressure and temperature assumption. Initial methanol
formation rates at the start of the reactor were calculated with feed gas molar
compositions of 5% CO2, 25 % CO, 70 % H2 and 2 % H2O, 4% CO2, 24 % CO,
70 % H2 with a total molar flow rate of 0.27 mol/s for each case. Molar

55
composition of the feed was determined based on the optimal conditions for
highest methanol yields reported by Klier et al. in his study [97].
Equations used in initial methanol formation rate calculations are as
follows:
, , , ,
Where and 3
And
3.4.2 Calculation of Methanol Formation Rates with the Static Kinetic
Model Proposed by Ovesen et al. [98]
As mentioned in previous section, kinetic model proposed by Vanden
Bussche et al. did not cover temperature ranges below 453 K. In order to obtain
more accurate rate data at low temperatures also, a kinetic model of methanol
synthesis over a Cu based catalyst, proposed by Ovesen et al. was used [98]. In
this model, parameters were obtained from surface science studies and also from
partition functions of intermediates.
Elementary steps in this kinetic model including CO2 hydrogenation and
water gas shift reactions are given in Table 3.3.
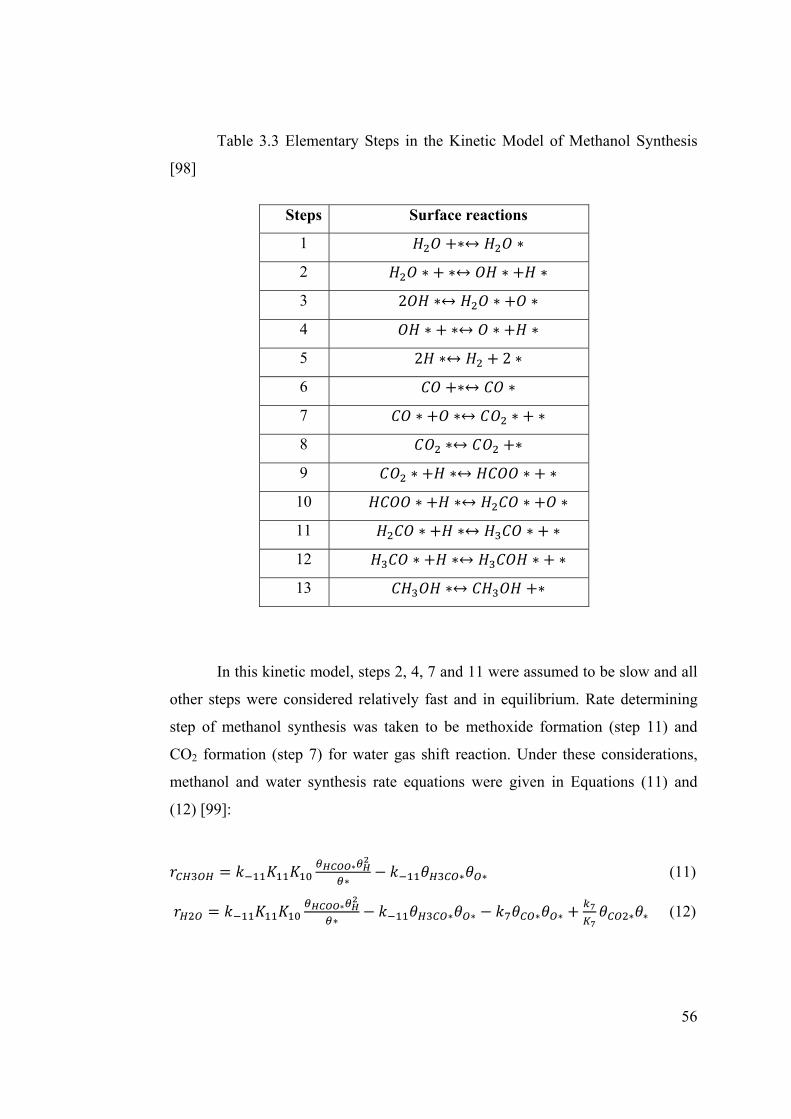
56
Table 3.3 Elementary Steps in the Kinetic Model of Methanol Synthesis
[98]
Steps Surface reactions
1
2
3 2
4
5 2 2
6
7
8
9
10
11
12
13
In this kinetic model, steps 2, 4, 7 and 11 were assumed to be slow and all
other steps were considered relatively fast and in equilibrium. Rate determining
step of methanol synthesis was taken to be methoxide formation (step 11) and
CO2 formation (step 7) for water gas shift reaction. Under these considerations,
methanol and water synthesis rate equations were given in Equations (11) and
(12) [99]:
(11)
(12)

57
Rate constants belonging to slow steps were fitted from experimental data
(with a temperature range of 485- 580 K) (Table 3.4).
Table 3.4 Rate constants for Cu (111) used in the kinetic model ki= Ai* exp
(-Ei/RT) [99]
Steps Ai (s-1) Ei (kJ/mol)
2 2.6*1014 114
4 2.3*108 99.1
7 1.1*1013 72.2
9 2.1*1010 78
11 7.8*1020 161.8
Equilibrium constants for fast reactions in the kinetic model were
calculated from the partition functions of each species:
K1=zH2O*/ zH2O
K2=zOH*zH*/zH2O*
K3=zH2O*zH*/zOH*
K4=zO*zH*/zOH*
K5=zH2/z2H*
K6=zCO*/zCO
K7=zCO2/zCO*zo*
K8=zCO2/zCO2*
K9=zHCOO*/zH*zCO2*
K10=zH2COO*/zH*zHCOO*
K11=zH3CO*zO*/zH*zH2COO*
K12=zCH3OH*/zH*zH3CO*
K13=zCH3OH/zCH3OH*

58
Where the partition function of a species is the product of its translational,
vibrational, rotational and ground state partition functions. (z = zt zv zr ze)
3.4.2.1 Calculation of Molecular Partition Functions
For gas molecules translational partition function was calculated from
Equation (13).
(13)
for triple degeneracy (where P is 1 atm reference pressure).
For adsorbed molecules, translation was taken as frustrated translation
accounting vibrations of the molecule parallel and orthogonal to surface (Equation
(14)).
(14)
Vibrational partition function, zv, was calculated for each vibrational
degree of freedom from with Equation (15).
(15)
Rotational partition function for gas linear molecules was calculated from
Equation (16).
(16)
For nonlinear gas molecules:
√ / / / (17)
The ground state partition function, ze, is given as :
exp (18)
Partition function values of species involved at methanol synthesis were
calculated with the vibrational parameters given by Ovesen et al. (Table 3.5).
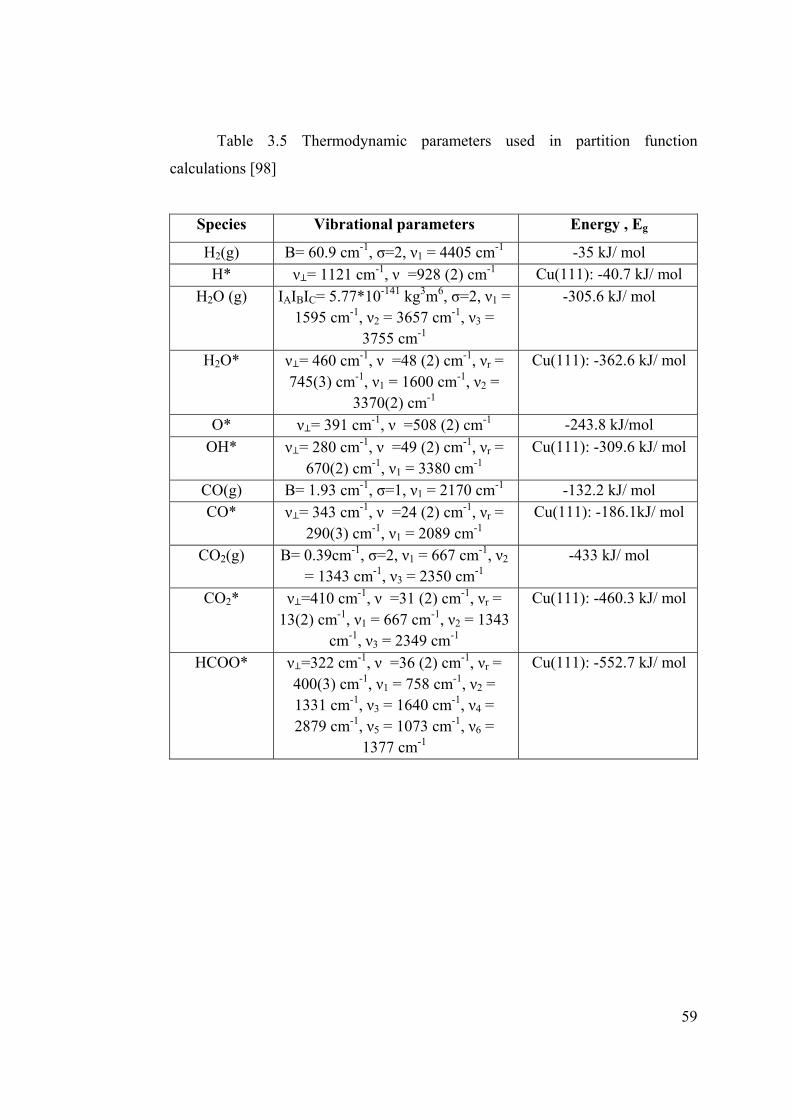
59
Table 3.5 Thermodynamic parameters used in partition function
calculations [98]
Species Vibrational parameters Energy , Eg
H2(g) B= 60.9 cm-1, σ=2, ν1 = 4405 cm-1 -35 kJ/ mol H* ν = 1121 cm-1, ν�=928 (2) cm-1 Cu(111): -40.7 kJ/ mol
H2O (g) IAIBIC= 5.77*10-141 kg3m6, σ=2, ν1 = 1595 cm-1, ν2 = 3657 cm-1, ν3 =
3755 cm-1
-305.6 kJ/ mol
H2O* ν = 460 cm-1, ν�=48 (2) cm-1, νr = 745(3) cm-1, ν1 = 1600 cm-1, ν2 =
3370(2) cm-1
Cu(111): -362.6 kJ/ mol
O* ν = 391 cm-1, ν�=508 (2) cm-1 -243.8 kJ/mol OH* ν = 280 cm-1, ν�=49 (2) cm-1, νr =
670(2) cm-1, ν1 = 3380 cm-1 Cu(111): -309.6 kJ/ mol
CO(g) B= 1.93 cm-1, σ=1, ν1 = 2170 cm-1 -132.2 kJ/ mol CO* ν = 343 cm-1, ν�=24 (2) cm-1, νr =
290(3) cm-1, ν1 = 2089 cm-1 Cu(111): -186.1kJ/ mol
CO2(g) B= 0.39cm-1, σ=2, ν1 = 667 cm-1, ν2 = 1343 cm-1, ν3 = 2350 cm-1
-433 kJ/ mol
CO2* ν =410 cm-1, ν�=31 (2) cm-1, νr = 13(2) cm-1, ν1 = 667 cm-1, ν2 = 1343
cm-1, ν3 = 2349 cm-1
Cu(111): -460.3 kJ/ mol
HCOO* ν =322 cm-1, ν�=36 (2) cm-1, νr = 400(3) cm-1, ν1 = 758 cm-1, ν2 = 1331 cm-1, ν3 = 1640 cm-1, ν4 = 2879 cm-1, ν5 = 1073 cm-1, ν6 =
1377 cm-1
Cu(111): -552.7 kJ/ mol
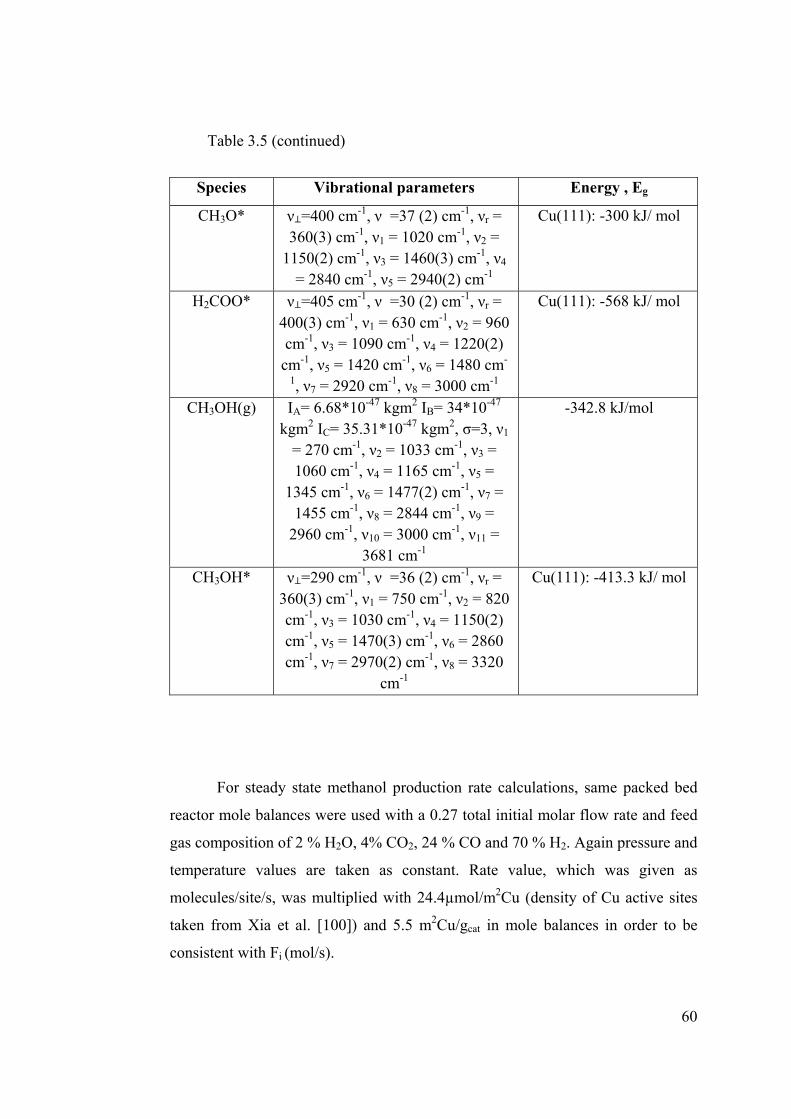
60
Table 3.5 (continued)
Species Vibrational parameters Energy , Eg
CH3O* ν =400 cm-1, ν�=37 (2) cm-1, νr = 360(3) cm-1, ν1 = 1020 cm-1, ν2 =
1150(2) cm-1, ν3 = 1460(3) cm-1, ν4 = 2840 cm-1, ν5 = 2940(2) cm-1
Cu(111): -300 kJ/ mol
H2COO* ν =405 cm-1, ν�=30 (2) cm-1, νr = 400(3) cm-1, ν1 = 630 cm-1, ν2 = 960 cm-1, ν3 = 1090 cm-1, ν4 = 1220(2)
cm-1, ν5 = 1420 cm-1, ν6 = 1480 cm-
1, ν7 = 2920 cm-1, ν8 = 3000 cm-1
Cu(111): -568 kJ/ mol
CH3OH(g) IA= 6.68*10-47 kgm2 IB= 34*10-47 kgm2 IC= 35.31*10-47 kgm2, σ=3, ν1
= 270 cm-1, ν2 = 1033 cm-1, ν3 = 1060 cm-1, ν4 = 1165 cm-1, ν5 =
1345 cm-1, ν6 = 1477(2) cm-1, ν7 = 1455 cm-1, ν8 = 2844 cm-1, ν9 =
2960 cm-1, ν10 = 3000 cm-1, ν11 = 3681 cm-1
-342.8 kJ/mol
CH3OH* ν =290 cm-1, ν�=36 (2) cm-1, νr = 360(3) cm-1, ν1 = 750 cm-1, ν2 = 820 cm-1, ν3 = 1030 cm-1, ν4 = 1150(2) cm-1, ν5 = 1470(3) cm-1, ν6 = 2860 cm-1, ν7 = 2970(2) cm-1, ν8 = 3320
cm-1
Cu(111): -413.3 kJ/ mol
For steady state methanol production rate calculations, same packed bed
reactor mole balances were used with a 0.27 total initial molar flow rate and feed
gas composition of 2 % H2O, 4% CO2, 24 % CO and 70 % H2. Again pressure and
temperature values are taken as constant. Rate value, which was given as
molecules/site/s, was multiplied with 24.4µmol/m2Cu (density of Cu active sites
taken from Xia et al. [100]) and 5.5 m2Cu/gcat in mole balances in order to be
consistent with Fi (mol/s).
61
3.4.3 Microkinetic Modeling of CO2 Hydrogenation using Finite
Difference Method and Pseudo Steady State Approximation
Rate determining steps in proposed kinetic models were selected based on
methanol formation experiments conducted at temperature ranges between 450
and 580 K. However using kinetic models with the same rate determining steps
for methanol formation reaction occurring at lower temperatures is not reasonable.
Rate mechanism with the slowest rate may change upon significant decreases in
temperature. In order to prevent such inexact results, a microkinetic modeling
without a rate determining step was performed with finite differences method and
pseudo steady state approximation.
In this microkinetic model, molar and thermodynamic consistency was
sought. Reaction steps and total reaction including CO2 hydrogenation and water
gas shift reaction can be seen in Table 3.6.

62
Table 3.6 Elementary reaction steps used in microkinetic modeling
Steps Reactions
1 5/
2 5/ 2
3
4
5
6 2/
7 2/
8 2/
9 2/
10 2/
11
12
13
Total 5 2
3.4.3.1 Activation Energy Barrier Calculations for Each Step
Enthalpy changes of reaction steps and individual activation energy
barriers were calculated using Bond Order Conservation – Morse Potential
Method, which is further developed and named as Unity Bond Index Quadratic
Exponential Potential (UBI-QEP) method.
In Bond Order Conservation- Morse Potential Method, energetics of
chemisorption and surface reactions can be described in an accurate manner with
basic inputs such as atomic heats of adsorption and gas phase molecular bond
energies. The method is suggested to estimate energetics of complex reactions
with an accuracy of ±1-3 kcal/mol [101].

63
Heats of chemisorptions on Cu (111) and total bond energies in gas phase
for species involved in methanol synthesis reaction were calculated and listed by
Shustorovich et al. [101].
Table 3.7 Heats of chemisorptions and total bond energies for reaction
species given on Cu (111)
Species Total Bond
Energies
(kj/mol)
Heat of
Chemisorption on
Cu (111) (kJ/mol)
H - 234
C - 502
O - 431
OH 427 218
HCOO 1607 247
H2CO 1511 67
CH3O 1603 230
H2 435 21
CO2 1607 21
CO 1076 50
CH3OH 2038 63
H2O 921 59
From heats of chemisorptions and bond energies, enthalpy change of
reactions can be calculated using Equation (19).
∑ ∑ ∑ ∑ (19)

64
Where Qr and Qp are the heats of chemisorption of reactants and products,
Db and Df are the binding energies of the bonds that are broken and formed
respectively.
Forward activation energy barrier for a dissociation reaction from a
chemisorbed state is given as Equation (20):
, (20)
And reverse activation barrier could be calculated from Equation (21).
(21)
For the dissociation reactions in which gas phase species are involved, heat
of adsorption of dissociated molecule, QAB should be subtracted from the barrier
of dissociation reaction involving surface adsorbates (Equation (22)).
2
, , (22)
For recombination reactions, for one dimensional cases such as, COs+
Os→ CO2s+s, forward activation barrier was given as in Equation (23):
, (23)
For disproportionation reactions such as As+ BCs→ ABs+ Cs, the forward
activation barrier can be calculated with Equation (24) provided that direction of
the reaction was set right with the condition DBC > DAB satisfied..
, (24)
3.4.3.2 Calculation of Pre-Exponentials
In most of the microkinetic studies, preexponential factors were assumed
from Transition State Theory, in which entropy change of the elementary steps
were not taken into consideration. In this model, a combination of transition state

65
theory and Lunds methodology was used in order to sustain thermodynamic
consistency of the reaction.
In order to achieve this, firstly the entropy change of each step was
calculated from partition function of species.
Since equilibrium constant of a reaction is given as:
(25)
and
(26)
therefore;
(27)
for a reaction : A+ B → C+ D, net entropy change of each reaction can be
found from Ki.
After calculating Af/Ar, one of the pre-exponentials was assumed from
TST (1013s-1 for a surface reaction, immobile species [102]) and the other one was
calculated according to entropy change of that step (Equation (28)).
(28)
3.4.3.3 Finite Difference Method
In the finite difference method, forward and reverse elementary reaction
rates for reaction: 5 2 were solved for a batch
system. It was assumed to be 5 g of Cu based catalyst in a 1 L of reactor. Initial
moles of reactants were calculated from initial pressures. Initial molar fractions of
gases were taken as: %70 H2, %25 CO and %5 CO2. Density of copper active
sites and copper surface area were taken as 24.4 µmol/ m2Cu and 5.5 m2Cu/gcat
respectively. Therefore, reaction rate, which was originally in molecules * site-1*
s-1, was multiplied with 24.4*10-6 mol/m2Cu*5.5 m2Cu/gcat *5 gcat* 6.02*10-23
sites/ 1 mol /6.02*10-23 molecules* 1 mol= 6.71*10-4 site*mol/molecule.
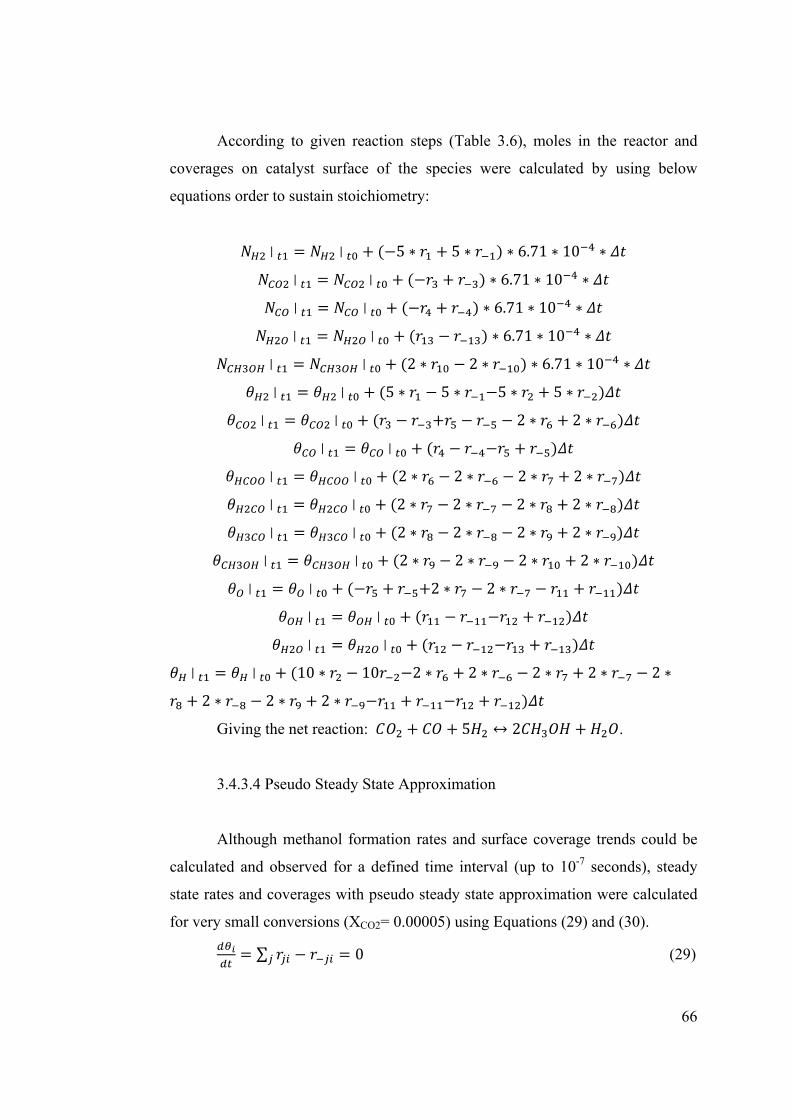
66
According to given reaction steps (Table 3.6), moles in the reactor and
coverages on catalyst surface of the species were calculated by using below
equations order to sustain stoichiometry:
5 5 6.71 10
6.71 10
6.71 10
6.71 10
2 2 6.71 10
5 5 5 5
2 2
2 2 2 2
2 2 2 2
2 2 2 2
2 2 2 2
2 2
10 10 2 2 2 2 2
2 2 2
Giving the net reaction: 5 2 .
3.4.3.4 Pseudo Steady State Approximation
Although methanol formation rates and surface coverage trends could be
calculated and observed for a defined time interval (up to 10-7 seconds), steady
state rates and coverages with pseudo steady state approximation were calculated
for very small conversions (XCO2= 0.00005) using Equations (29) and (30).
∑ 0 (29)

67
∑ 1 (30)
Feed compositions were again taken as 70 % H2, 25 % CO, 5 % CO2 and
70 % H2, 24 % CO, 4 % CO2, 2% H2O.
3.4.4 Revealing Rate Determining Steps
In order to reveal any change in reaction mechanism and to find rate
determining steps, the degree of rate control of each elementary step is calculated
for different temperatures.
The concept of the degree of rate control of elementary steps is defined by
Campbell et al. as in Equation (31) [103].
Xrc,i = (ki/δki)*(δR/R) (31)
By changing both forward and reverse rate constants (%5) for step i (in
order not to disturb thermodynamics), change in overall rate, R, was observed
while keeping other parameters constant. In this study, step 10 (methanol
desorption step) is taken as the reference methanol formation step while changing
other steps rate constants.
Campbell proposed that rate-limiting steps were those with positive degree
of rate control and inhibition steps were those with negative degree of rate
control.. The larger the numeric value of degree of rate control, Xrc,i, the bigger is
the influence of its rate constant on the overall reaction rate.
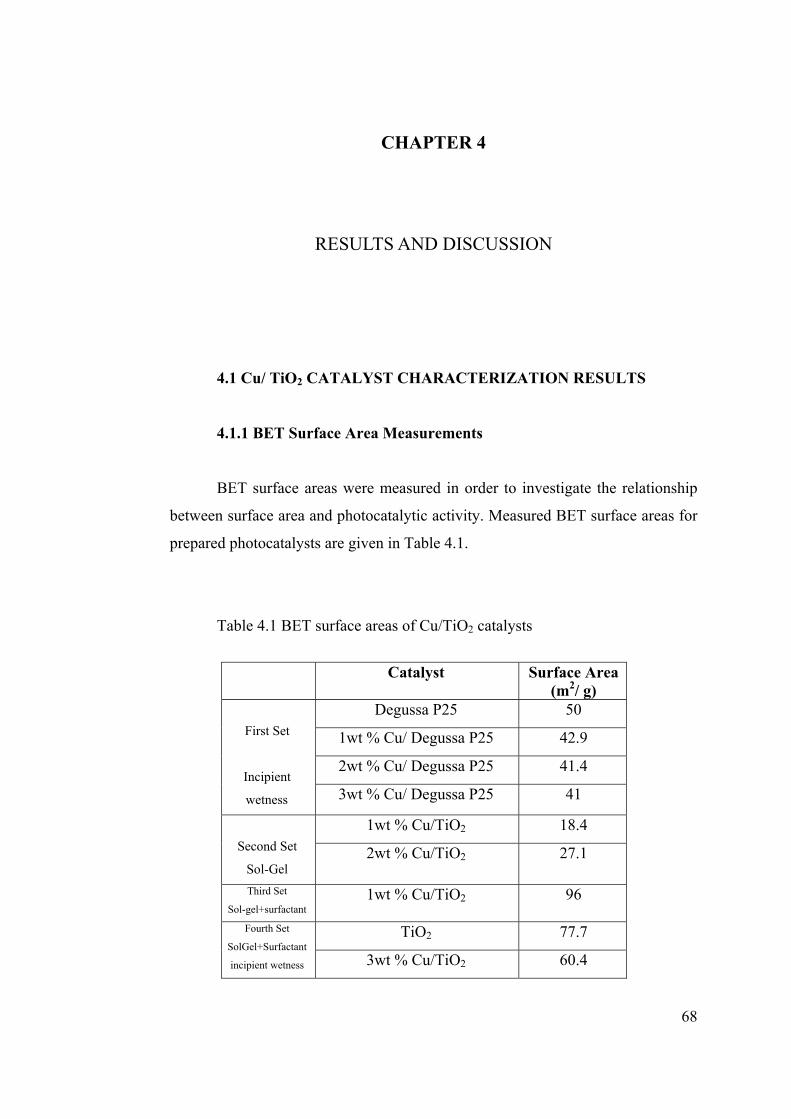
68
CHAPTER 4
RESULTS AND DISCUSSION
4.1 Cu/ TiO2 CATALYST CHARACTERIZATION RESULTS
4.1.1 BET Surface Area Measurements
BET surface areas were measured in order to investigate the relationship
between surface area and photocatalytic activity. Measured BET surface areas for
prepared photocatalysts are given in Table 4.1.
Table 4.1 BET surface areas of Cu/TiO2 catalysts
Catalyst Surface Area
(m2/ g)
First Set
Incipient
wetness
Degussa P25 50
1wt % Cu/ Degussa P25 42.9
2wt % Cu/ Degussa P25 41.4
3wt % Cu/ Degussa P25 41
Second Set
Sol-Gel
1wt % Cu/TiO2 18.4
2wt % Cu/TiO2 27.1
Third Set
Sol-gel+surfactant 1wt % Cu/TiO2 96
Fourth Set
SolGel+Surfactant
incipient wetness
TiO2 77.7
3wt % Cu/TiO2 60.4

69
As it can be seen from Table 4.1, copper addition with incipient wetness
method has caused a slight decrease in BET surface area from 50 m2/g to 41 m2/g.
Sol-gel prepared catalysts without surfactant (Second set of catalysts) had
low surface areas, whereas, addition of surfactant and also titanium anatase
nanopowder contributed to a three-fold increase in the surface area.
Apparently, longer mixing of the solution in fourth set of catalysts has not
resulted in higher surface areas, on the contrary, decreased the surface area from
96 m2/g (for 20 h of mixing) to 77.7 m2/g (for TiO2, 80 h of mixing). Also,
addition of copper with incipient wetness method further decreased the surface
area (60.4 m2/g for 3 wt% Cu/ TiO2).
4.1.2 XRD Analysis
XRD analysis was performed in order to investigate crystalline phases of
TiO2 and copper oxides. A representative 10 wt % Cu/TiO2 catalyst was prepared
via sol- gel method with surfactant in order to be able to see crystalline phases of
copper. It was compared with bare TiO2 (also prepared with surfactant and TiO2
anatase nanopowder) in measurements (Figure 4.1).
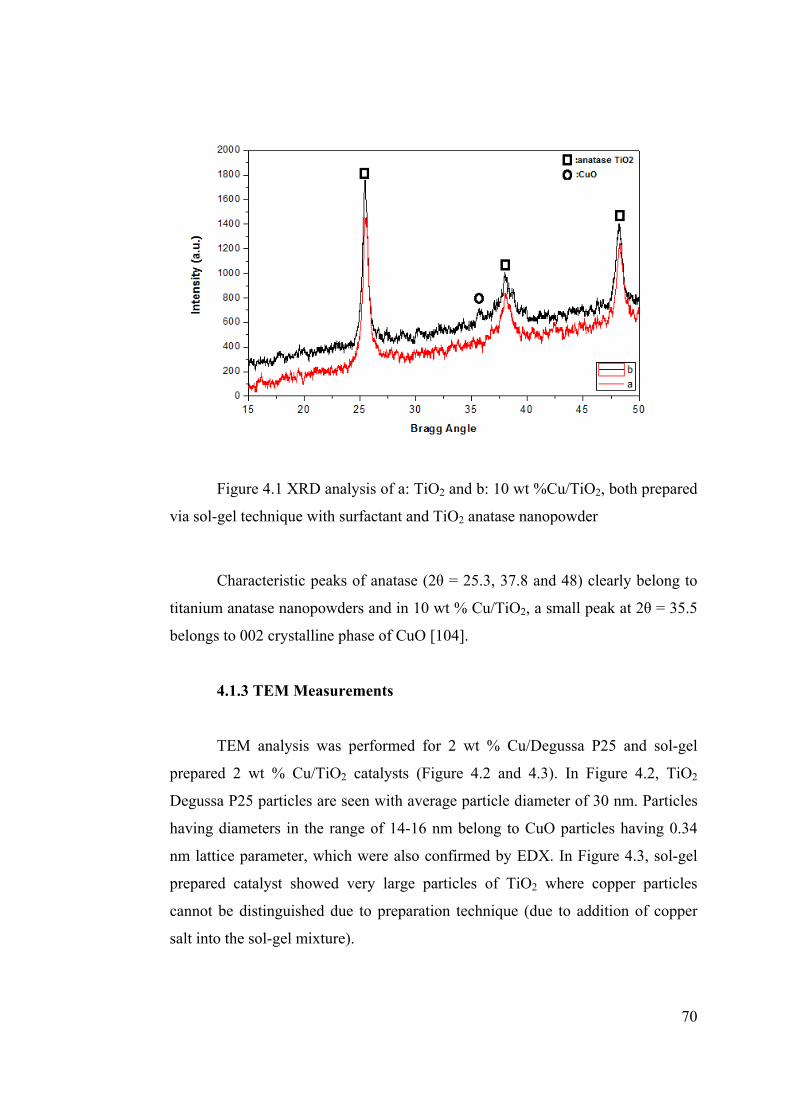
70
Figure 4.1 XRD analysis of a: TiO2 and b: 10 wt %Cu/TiO2, both prepared
via sol-gel technique with surfactant and TiO2 anatase nanopowder
Characteristic peaks of anatase (2θ = 25.3, 37.8 and 48) clearly belong to
titanium anatase nanopowders and in 10 wt % Cu/TiO2, a small peak at 2θ = 35.5
belongs to 002 crystalline phase of CuO [104].
4.1.3 TEM Measurements
TEM analysis was performed for 2 wt % Cu/Degussa P25 and sol-gel
prepared 2 wt % Cu/TiO2 catalysts (Figure 4.2 and 4.3). In Figure 4.2, TiO2
Degussa P25 particles are seen with average particle diameter of 30 nm. Particles
having diameters in the range of 14-16 nm belong to CuO particles having 0.34
nm lattice parameter, which were also confirmed by EDX. In Figure 4.3, sol-gel
prepared catalyst showed very large particles of TiO2 where copper particles
cannot be distinguished due to preparation technique (due to addition of copper
salt into the sol-gel mixture).

71
Figure 4.2 TEM image of 2 wt % Cu/ Degussa P25 prepared via incipient
wetness method
Large particle sizes of catalyst may explain lower surface areas in sol-gel
prepared, second set of catalysts. In sol-gel prepared samples, presence of copper-
titanate is suggested with a lattice parameter of 0.77 nm which is in agreement
with literature data; 0.74 nm , lattice parameter of calcium copper-titanate [105].

72
Figure 4.3 TEM image of 2 wt % Cu/TiO2 prepared via sol- gel technique
4. 2 MASS TRANSFER LIMITATION EXPERIMENTS
Stirring rate and gas hold-up time experiments were conducted on
photocatalytic hydrogen evolution from a water/ methanol mixture with Pt/ TiO2
for revealing mass transfer limitation effects in gas – liquid – solid systems.
Investigation of mass transfer limitations was performed with photocatalytic
hydrogen evolution experiments since photocatalytic hydrogen evolution rates
were reported to be much higher in literature than CO2 reduction rates so that
changes in rates resulted from reactor parameters can be easily followed. Tests
were conducted with 250 ml deionized water and 2 ml methanol mixture with
0.25 g of catalyst. For gas hold-up time experiments, 62.5, 125, 187.5 and 250 ml
of water was used with same catalyst and methanol concentrations.
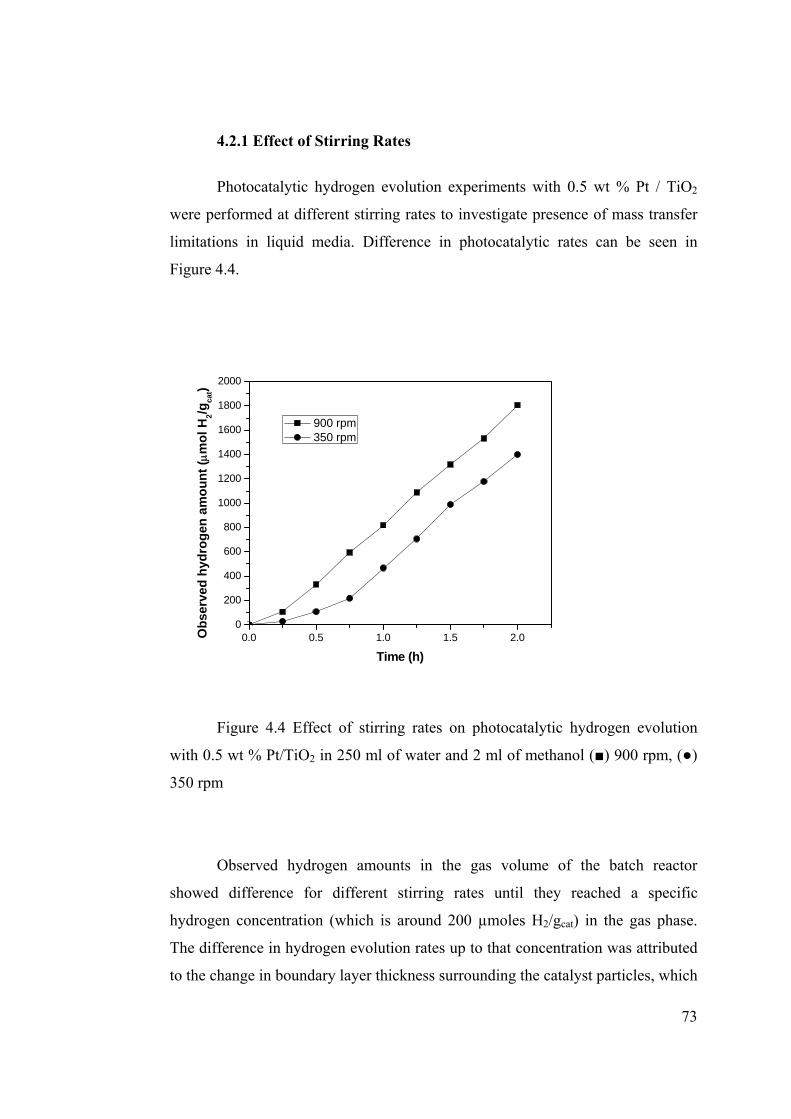
73
4.2.1 Effect of Stirring Rates
Photocatalytic hydrogen evolution experiments with 0.5 wt % Pt / TiO2
were performed at different stirring rates to investigate presence of mass transfer
limitations in liquid media. Difference in photocatalytic rates can be seen in
Figure 4.4.
0.0 0.5 1.0 1.5 2.00
200
400
600
800
1000
1200
1400
1600
1800
2000
Obs
erve
d hy
drog
en a
mou
nt (μ
mol
H2/g
cat)
Time (h)
900 rpm 350 rpm
Figure 4.4 Effect of stirring rates on photocatalytic hydrogen evolution
with 0.5 wt % Pt/TiO2 in 250 ml of water and 2 ml of methanol (■) 900 rpm, (●)
350 rpm
Observed hydrogen amounts in the gas volume of the batch reactor
showed difference for different stirring rates until they reached a specific
hydrogen concentration (which is around 200 µmoles H2/gcat) in the gas phase.
The difference in hydrogen evolution rates up to that concentration was attributed
to the change in boundary layer thickness surrounding the catalyst particles, which
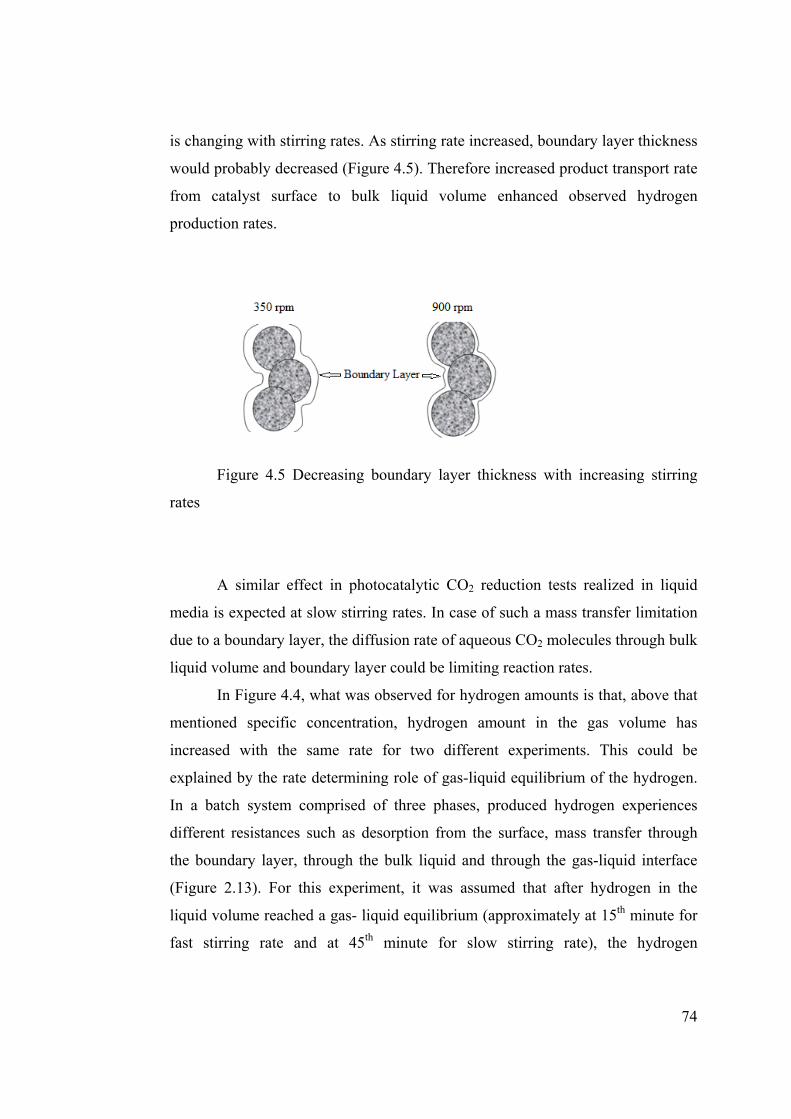
74
is changing with stirring rates. As stirring rate increased, boundary layer thickness
would probably decreased (Figure 4.5). Therefore increased product transport rate
from catalyst surface to bulk liquid volume enhanced observed hydrogen
production rates.
Figure 4.5 Decreasing boundary layer thickness with increasing stirring
rates
A similar effect in photocatalytic CO2 reduction tests realized in liquid
media is expected at slow stirring rates. In case of such a mass transfer limitation
due to a boundary layer, the diffusion rate of aqueous CO2 molecules through bulk
liquid volume and boundary layer could be limiting reaction rates.
In Figure 4.4, what was observed for hydrogen amounts is that, above that
mentioned specific concentration, hydrogen amount in the gas volume has
increased with the same rate for two different experiments. This could be
explained by the rate determining role of gas-liquid equilibrium of the hydrogen.
In a batch system comprised of three phases, produced hydrogen experiences
different resistances such as desorption from the surface, mass transfer through
the boundary layer, through the bulk liquid and through the gas-liquid interface
(Figure 2.13). For this experiment, it was assumed that after hydrogen in the
liquid volume reached a gas- liquid equilibrium (approximately at 15th minute for
fast stirring rate and at 45th minute for slow stirring rate), the hydrogen

75
accumulation rate in the gas phase is controlled with mass transfer rate of
hydrogen at the gas- liquid interface.
4.2.2 Effect of Gas Hold-up Time
Photocatalytic hydrogen evolution reactions were performed with 0.5 wt %
Pt/TiO2 and with liquid volumes of 62.5, 125, 187.5 and 250 ml as they were
explained in Section 3.3.1.
Figure 4.6 Effect of hydrogen hold-up time on photocatalytic hydrogen
evolution amounts (a) normalized with respect to catalyst amount (b) not
normalized with respect to catalyst amount, with CH3OH/ H2O: 1/125 (v/v) and
Ccat: 1 g/L (■) 62.5 ml (●) 125 ml (▲) 187.5 ml (▼) 250 ml
In Figure 4.6 (a) the effect of the hydrogen hold-up time on normalized
hydrogen evolution amounts with respect to the catalyst amount was plotted
versus time, while in Figure 4.6 (b), the data was presented without normalizing to
the catalyst amount. The data in Figure 4.6 (b) indicated that the evolved
0.0 0.5 1.0 1.5 2.00
1
2
3
4
5
a)
Obs
erve
d H
2 am
ount
(mm
ol H
2/gca
t)
Time (h)
62.5 ml 125 ml 187.5 ml 250 ml
0.00 0.25 0.50 0.75 1.00 1.25 1.50 1.750
100
200
300
400
b)
Mic
rom
oles
of H
2 ob
serv
ed
Time (h)
250 ml 187.5 ml 125 ml 62.5 ml
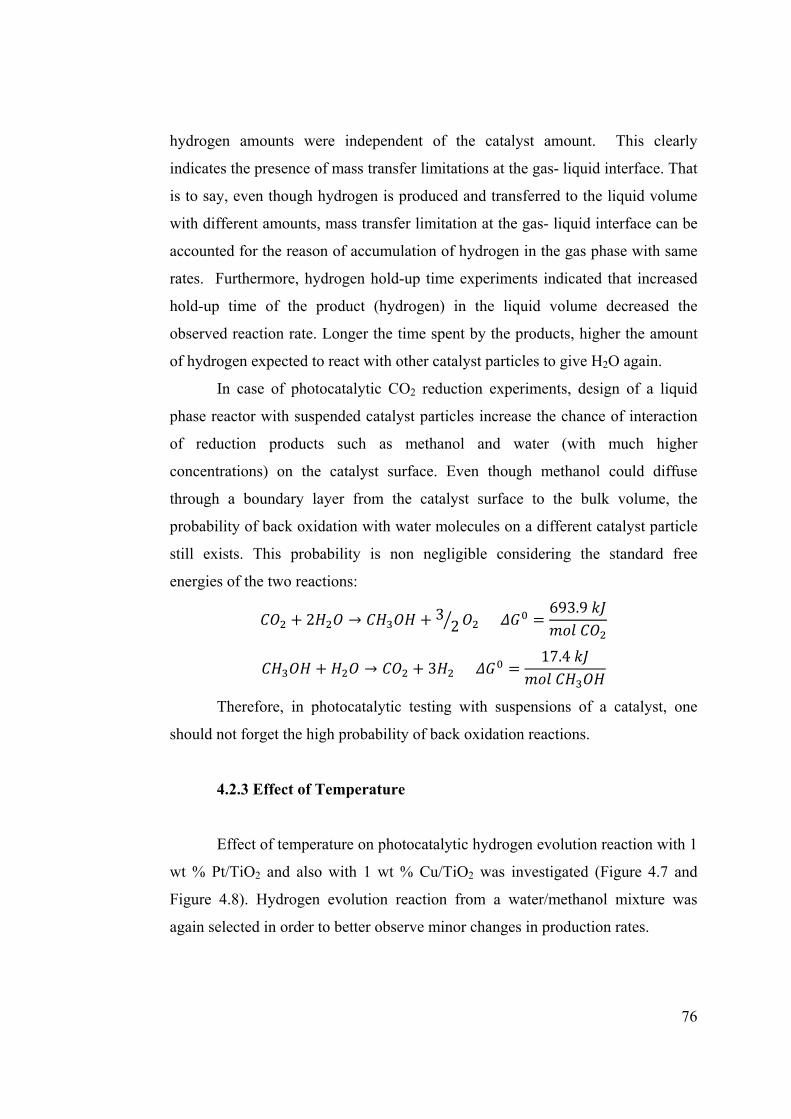
76
hydrogen amounts were independent of the catalyst amount. This clearly
indicates the presence of mass transfer limitations at the gas- liquid interface. That
is to say, even though hydrogen is produced and transferred to the liquid volume
with different amounts, mass transfer limitation at the gas- liquid interface can be
accounted for the reason of accumulation of hydrogen in the gas phase with same
rates. Furthermore, hydrogen hold-up time experiments indicated that increased
hold-up time of the product (hydrogen) in the liquid volume decreased the
observed reaction rate. Longer the time spent by the products, higher the amount
of hydrogen expected to react with other catalyst particles to give H2O again.
In case of photocatalytic CO2 reduction experiments, design of a liquid
phase reactor with suspended catalyst particles increase the chance of interaction
of reduction products such as methanol and water (with much higher
concentrations) on the catalyst surface. Even though methanol could diffuse
through a boundary layer from the catalyst surface to the bulk volume, the
probability of back oxidation with water molecules on a different catalyst particle
still exists. This probability is non negligible considering the standard free
energies of the two reactions:
2 32
693.9
3 17.4
Therefore, in photocatalytic testing with suspensions of a catalyst, one
should not forget the high probability of back oxidation reactions.
4.2.3 Effect of Temperature
Effect of temperature on photocatalytic hydrogen evolution reaction with 1
wt % Pt/TiO2 and also with 1 wt % Cu/TiO2 was investigated (Figure 4.7 and
Figure 4.8). Hydrogen evolution reaction from a water/methanol mixture was
again selected in order to better observe minor changes in production rates.

77
0.0 0.5 1.0 1.5 2.00
1000
2000
3000
4000
5000Pr
oduc
ed H
2 am
oýunt
(μm
ol H
2 /g
cat)
Time (h)
32 C 65 C 77 C 85 C
Figure 4.7 Effect of temperature on photocatalytic hydrogen evolution
with 1 wt % Pt/TiO2 in 250 ml water and 2 ml methanol (■) 32 °C (●) 65 °C (▲)
77 °C (▼) 85°C
0.0 0.5 1.0 1.5 2.00
200
400
600
800
1000
1200
1400
Prod
uced
H2
amou
nt (μ
mol
H2/
g cat
)
Time (h)
44 C 75 C
Figure 4.8 Effect of temperature on photocatalytic hydrogen evolution
with 1 wt % Cu/TiO2 in 250 ml water and 2 ml methanol (■) 44 °C (●) 75 °C

78
Table 4.2 Initial hydrogen evolution rates with changing temperature
values
Temperature ( °C) Catalyst Hydrogen Evolution
Rates
(μmol H2 *gcat-1* h-1)
32 1 wt % Pt/ TiO2 782
65 1 wt % Pt/ TiO2 1058
77 1 wt % Pt/ TiO2 1241
85 1 wt % Pt/ TiO2 1563
44 1 wt % Cu/ TiO2 296
75 1 wt % Cu/ TiO2 573
As it can be seen from Table 4.2, photocatalytic hydrogen production with
both Pt/TiO2 and Cu/TiO2 catalysts showed increased initial rates with increased
temperature. Temperature sensitivity with Pt/TiO2 catalyst was found to be
respectively low when compared with catalytic temperature sensitivities.
Apparent activation energy with Pt/ TiO2 catalyst was found to be 12 kJ/mol
(Figure 4.9) and 19.5 kJ/mol for Cu/TiO2 catalyst.
Low activation energy barrier (8 kJ/mol) for water oxidation reaction was
also reported by Hisatomi et al., relating the observed activation energy to trap
hindered transport of photoexcited carriers [106]. However, in a study of Suzuki
et al., activation energy of diffusion of dilute solvents in water was reported to be
16 kJ/mol, which is close to our observed activation energy values [107]. Based
on the results presented in the previous sections and the results of the activation
energy measurements, it is reasonable to say that the liquid phase photocatalytic
hydrogen evolution reaction is mass transfer limited.
79
300 310 320 330 340 350 360
800
1000
1200
1400
1600
2,8 2,9 3,0 3,1 3,26,6
6,7
6,8
6,9
7,0
7,1
7,2
7,3
7,4
ln ra
te
1/T *103 (K-1)
Rat
e (μ
mol
H2*g
cat-1
*h-1)
Temperature (K)
Figure 4.9 Effect of temperature on photocatalytic hydrogen evolution and
ln rate vs 1/T demonstration with Pt/ TiO2 catalyst
4.3 PHOTOCATALYTIC CO2 REDUCTION ACTIVITY RESULTS
Four sets of Cu/TiO2 catalysts were tested for CO2 photo reduction in
liquid media. Batch testing was performed with 300 ml deionized water and 0.3 g
catalyst (with a catalyst concentration of 1 g/ L). In comparing the results of
photocatalytic testing of the prepared catalysts, same conditions (such as
temperature and stirring rates) and procedure were tried to be followed for a
proper comparison. However, having proved the significant effect of slight
changes in reaction conditions such as temperature or stirring rates on
photocatalytic rates, one should not draw exact conclusions from this part of the
study. This section is only to show the ability of reducing CO2 photocatalytically
at similar conditions as in literature.

80
4.3.1 Photocatalytic Testing of First Set of Catalysts
In Figure 4.10, methanol production amounts with respect to time are
given for first set of catalysts which were prepared with incipient wetness method.
0 1 2 3 4 5 6 7 80
4
8
12
16
20
24
28
Mic
rom
oles
of M
eOH
pro
duce
d/g c
atal
yst
Time (h)
1 wt% Cu/P25 2 wt% Cu/P25 3 wt% Cu/P25
Figure 4.10 Photocatalytic methanol production amounts of first set of
catalysts with respect to time
Among the catalysts prepared by incipient wetness method, 3 wt % Cu/
Degussa P25 has showed the highest photocatalytic activity. Methanol production
amounts are 26 μmol/gcat for 3 wt % Cu/ Degussa P25, 15.9 μmol/gcat for 1 wt %
Cu/ Degussa P25, and finally 7.6 μmol/gcat for 1 wt % Cu/ Degussa P25 after 5
hour of UV- illumination.
Instantaneous reaction rates related to above catalysts can be found in
Figure 4.11. It can be inferred that firstly reaction rates increased slightly to a
maximum and then started to decrease and finally became negative after fifth
hour.
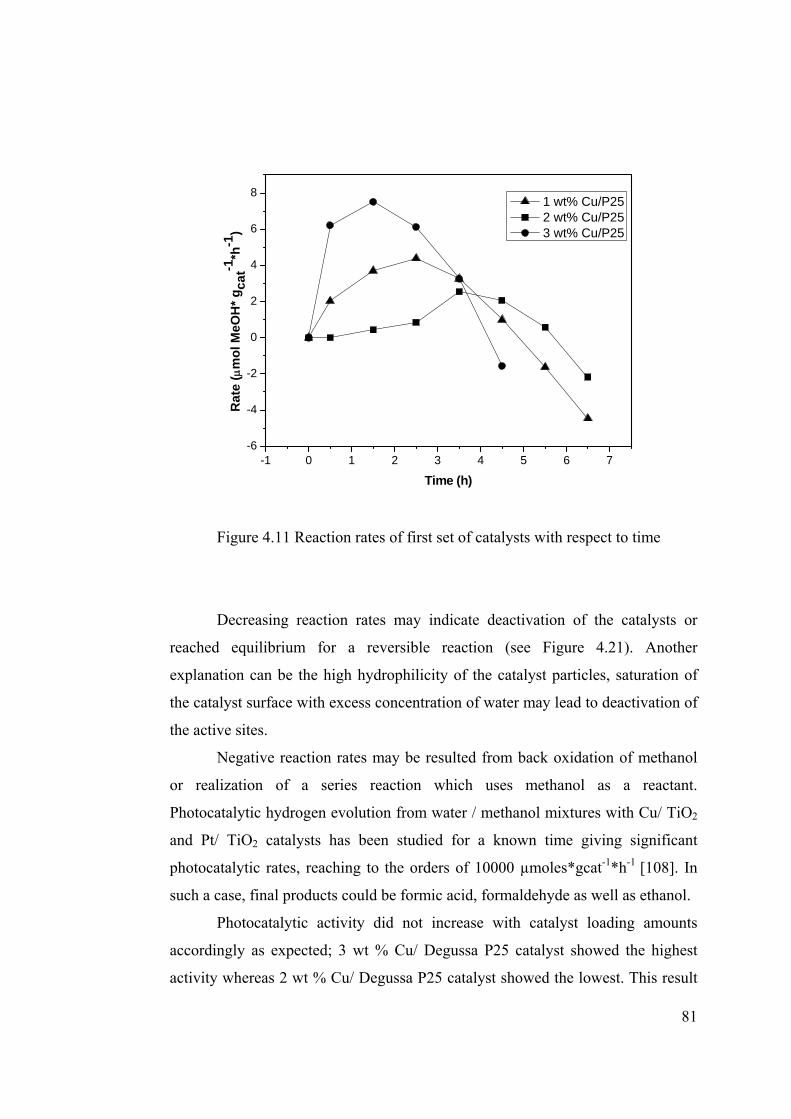
81
-1 0 1 2 3 4 5 6 7-6
-4
-2
0
2
4
6
8
Rat
e (μ
mol
MeO
H* g
cat-1
*h-1
)
Time (h)
1 wt% Cu/P25 2 wt% Cu/P25 3 wt% Cu/P25
Figure 4.11 Reaction rates of first set of catalysts with respect to time
Decreasing reaction rates may indicate deactivation of the catalysts or
reached equilibrium for a reversible reaction (see Figure 4.21). Another
explanation can be the high hydrophilicity of the catalyst particles, saturation of
the catalyst surface with excess concentration of water may lead to deactivation of
the active sites.
Negative reaction rates may be resulted from back oxidation of methanol
or realization of a series reaction which uses methanol as a reactant.
Photocatalytic hydrogen evolution from water / methanol mixtures with Cu/ TiO2
and Pt/ TiO2 catalysts has been studied for a known time giving significant
photocatalytic rates, reaching to the orders of 10000 µmoles*gcat-1*h-1 [108]. In
such a case, final products could be formic acid, formaldehyde as well as ethanol.
Photocatalytic activity did not increase with catalyst loading amounts
accordingly as expected; 3 wt % Cu/ Degussa P25 catalyst showed the highest
activity whereas 2 wt % Cu/ Degussa P25 catalyst showed the lowest. This result

82
may indicate that particle sizes and dispersion of copper particles on TiO2
Degussa P25 changes with different copper loading amounts.
In Table 4.3 calculated normalized rates and rates per gram of copper
added can be seen for catalysts prepared with incipient wetness method. Highest
rate per gram of copper was achieved with lowest copper loading; 1 wt % Cu/
Degussa P25 catalyst. This phenomenon can be explained by the findings that
with higher metal loadings, a decrease in activity is observed because of
agglomeration of metal particles on catalyst support; i.e., lower dispersions of
metal particles. But again, one should keep in mind that minor changes in
photocatalytic rates could be resulted from changing reaction conditions.
At the highest methanol amount in the liquid volume; i.e., 26 micromoles
of methanol/gcat ~7.8 micromoles in 300 ml water, there is approximately 0.0005
micromoles of methanol in 50 ml of gas volume considering an ideal solution
with vapor pressure of methanol 175 mmHg at 30 °C.
Table 4.3 Calculated rates for first set of catalysts
Photocatalyst Normalized Rates
(μmol*gcat-1*h-1)
Rate / g Cu (µmol H2* gCu
-1*h-1)
1 wt % Cu / Degussa P25 4.4 440
2 wt % Cu / Degussa P25 2.5 125
3 wt % Cu / Degussa P25 7.5 250
4.3.2 Photocatalytic Testing of Second Set of Catalysts
In Figure 4.12, methanol production amounts with respect to time are
given for second set of catalysts which were prepared via sol-gel method.

83
0 1 2 3 4 5 6 70
2
4
6
8
10
Mic
rom
oles
of M
eOH
pro
duce
d/g c
atal
yst
Time (h)
1 wt% Cu/TiO2
2 wt % Cu/TiO2
Figure 4.12 Photocatalytic methanol production amounts of second set of
catalysts with respect to time
Sol-gel prepared catalysts produced very small amounts of methanol only
at the second hour of the experiments. Low concentrations of methanol; with
respect to those produced from first set of catalysts, may result from very low
surface areas of those catalysts prepared with sol-gel method.
4.3.3 Photocatalytic Testing of Third Set of Catalysts
Third set of catalyst, 1 wt % Cu/TiO2, showed negligible activity during
seven hour of UV illumination. 1 wt % Cu/TiO2 was prepared with sol-gel
technique with the addition of surfactant and also titanium dioxide anatase
nanoparticles. BET surface area of that catalyst was found to be 96 m2/g, which
was reasonably high than second set of catalysts. From that result, it can be
inferred that surface area is not directly related to photocatalytic activity.

84
Surface copper/titanium ratios were found too high for second and third set
of catalysts in which copper source was added to the sol-gel mixture (Appendix
C). Not forgetting the importance of surface structure of copper and titanium
dioxide, and their arrangements on surface for better interpreting surface activity,
one can suggest inefficient light activation of TiO2 semiconductor catalyst for sol-
gel prepared catalysts due to excess amount of copper on surface.
4.3.4 Photocatalytic Testing of Fourth Set of Catalysts
Fourth set of catalyst, 3 wt % Cu/TiO2 was prepared with incipient wetness
impregnated copper onto bare TiO2 prepared via sol-gel technique with surfactant
and titanium dioxide anatase powder. In Figure 4.13, methanol production
amounts of 3 wt % Cu/ TiO2 catalyst from fourth set and also 3 wt % Cu/ Degussa
P25 catalyst from first set were compared.
Photocatalytically produced methanol concentrations in batch testing of
fourth set 3 wt % Cu/ TiO2 showed overlapping results with 3 wt % Cu/ Degussa
P25. That result emphasizes the importance of the presence and availability of the
metal particles on the surface. In the preparation of the third set of catalyst; 1 wt
% Cu/ TiO2, copper was added to the sol-gel mixture; however, in fourth set of
catalysts; 3 wt % Cu/TiO2, incipient wetness addition of copper clearly resulted in
proper distribution of copper (II) oxide sites on sol-gel prepared TiO2, which
enhanced the photocatalytic activity. Also, since the surface area of the fourth
catalyst was measured to be smaller than third set of catalyst, it can be again
stated that surface area does not directly affect the activity. In Figure 4.14,
instantaneous reaction rates were compared for the mentioned catalysts. Decrease
in rates and negative rates were again observed for 3 wt % Cu/ TiO2 catalyst.

85
0 1 2 3 4 5 6 7 80
4
8
12
16
20
24
28
Mic
rom
oles
of M
eOH
pro
duce
d/g c
atal
yst
Time (h)
3wt% Cu/P25 3wt% Cu/TiO2
Figure 4.13 Photocatalytic methanol production amounts of 3 wt % Cu/
Degussa P25 and 3 wt % Cu/ TiO2 (prepared by incipient wetness addition of
copper on sol-gel prepared titania)
-1 0 1 2 3 4 5 6 7
-14
-12
-10
-8
-6
-4
-2
0
2
4
6
8
10
Rat
e (μ
mol
MeO
H* g
cat-1
*h-1
)
Time (h)
3wt% Cu/P25 3wt% Cu/TiO2
Figure 4.14 Comparison of reaction rates of first set 3 wt % Cu/Degussa
P25 and fourth set 3 wt % Cu/TiO2 with respect to time

86
4.3.5 Comparison of Results with Literature Results
In Table 4.4 initial methanol production rates of this study is given
together with some literature results.
Table 4.4 Initial methanol production rates for tested catalysts
Photocatalyst Normalized Rates
(μmol*gcat-1*h-1)
1 wt % Cu / Degussa P25 (This study) 4.4
2 wt % Cu / Degussa P25(This study) 2.5
3 wt % Cu / Degussa P25(This study) 7.5
3 wt % Cu / TiO2(This study) 7.8
2 wt % Cu/ Degussa P25, 0.2 N NaOH15 10
2 wt % Cu / TiO2, 0.2 N NaOH15 19.7
3.3 wt % Cu/ TiO2, 0.2 N NaOH15 14.9
Photocatalytic CO2 reduction rates obtained from this study is compared
with those obtained under similar conditions. Tseng et al reported that Cu/ TiO2
photocatalysts those were prepared with sol-gel method gave better activities than
those prepared with incipient wetness method. They also added that CO2 could
not be reduced at solutions having pH 7.
In this study, it was seen that CO2 could be reduced at pH 7 with
comparable photocatalytic CO2 reduction rates with those obtained in literature at
pH 13.
Of course, one should always keep in mind that, comparison of the CO2
reduction results with the literature results always brings the possibility of
drawing misleading conclusions due to presence of mentioned mass transfer
effects. In fact, very close photocatalytic CO2 reduction results given in Table 4.4
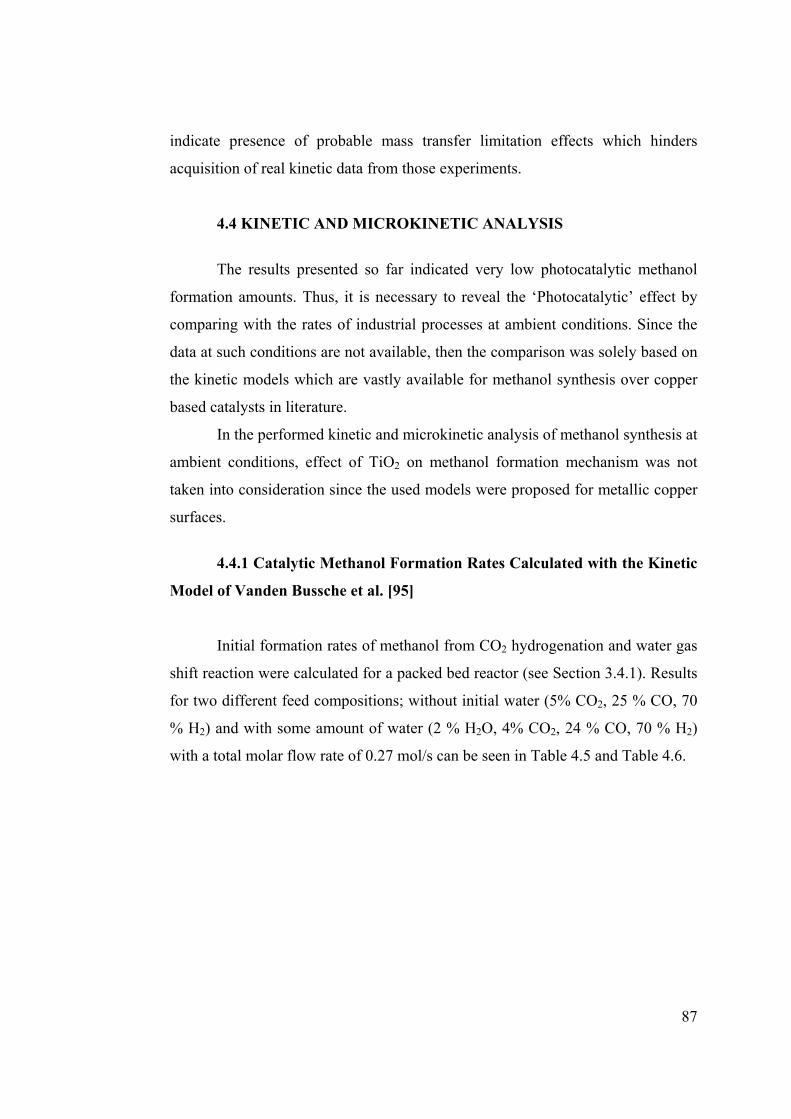
87
indicate presence of probable mass transfer limitation effects which hinders
acquisition of real kinetic data from those experiments.
4.4 KINETIC AND MICROKINETIC ANALYSIS
The results presented so far indicated very low photocatalytic methanol
formation amounts. Thus, it is necessary to reveal the ‘Photocatalytic’ effect by
comparing with the rates of industrial processes at ambient conditions. Since the
data at such conditions are not available, then the comparison was solely based on
the kinetic models which are vastly available for methanol synthesis over copper
based catalysts in literature.
In the performed kinetic and microkinetic analysis of methanol synthesis at
ambient conditions, effect of TiO2 on methanol formation mechanism was not
taken into consideration since the used models were proposed for metallic copper
surfaces.
4.4.1 Catalytic Methanol Formation Rates Calculated with the Kinetic
Model of Vanden Bussche et al. [95]
Initial formation rates of methanol from CO2 hydrogenation and water gas
shift reaction were calculated for a packed bed reactor (see Section 3.4.1). Results
for two different feed compositions; without initial water (5% CO2, 25 % CO, 70
% H2) and with some amount of water (2 % H2O, 4% CO2, 24 % CO, 70 % H2)
with a total molar flow rate of 0.27 mol/s can be seen in Table 4.5 and Table 4.6.
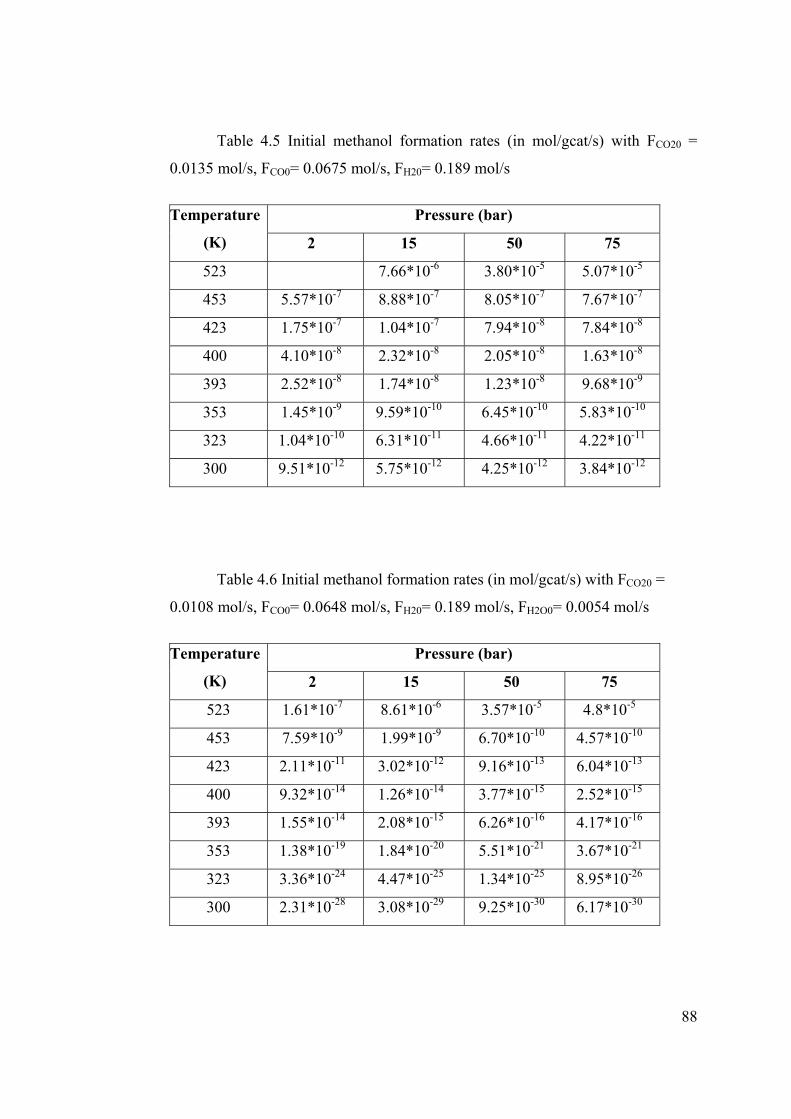
88
Table 4.5 Initial methanol formation rates (in mol/gcat/s) with FCO20 =
0.0135 mol/s, FCO0= 0.0675 mol/s, FH20= 0.189 mol/s
Temperature
(K)
Pressure (bar)
2 15 50 75
523 7.66*10-6 3.80*10-5 5.07*10-5
453 5.57*10-7 8.88*10-7 8.05*10-7 7.67*10-7
423 1.75*10-7 1.04*10-7 7.94*10-8 7.84*10-8
400 4.10*10-8 2.32*10-8 2.05*10-8 1.63*10-8
393 2.52*10-8 1.74*10-8 1.23*10-8 9.68*10-9
353 1.45*10-9 9.59*10-10 6.45*10-10 5.83*10-10
323 1.04*10-10 6.31*10-11 4.66*10-11 4.22*10-11
300 9.51*10-12 5.75*10-12 4.25*10-12 3.84*10-12
Table 4.6 Initial methanol formation rates (in mol/gcat/s) with FCO20 =
0.0108 mol/s, FCO0= 0.0648 mol/s, FH20= 0.189 mol/s, FH2O0= 0.0054 mol/s
Temperature
(K)
Pressure (bar)
2 15 50 75
523 1.61*10-7 8.61*10-6 3.57*10-5 4.8*10-5
453 7.59*10-9 1.99*10-9 6.70*10-10 4.57*10-10
423 2.11*10-11 3.02*10-12 9.16*10-13 6.04*10-13
400 9.32*10-14 1.26*10-14 3.77*10-15 2.52*10-15
393 1.55*10-14 2.08*10-15 6.26*10-16 4.17*10-16
353 1.38*10-19 1.84*10-20 5.51*10-21 3.67*10-21
323 3.36*10-24 4.47*10-25 1.34*10-25 8.95*10-26
300 2.31*10-28 3.08*10-29 9.25*10-30 6.17*10-30

89
Calculated initial methanol formation rates seem to be in agreement with
literature data. A methanol formation rate of 6.11*10-5 mol/gcat/s was found with
a differential reactor at 523 K and 45 bar without initial water concentration [87].
Although at high temperatures such as 523 K, initial water concentration
did not alter methanol formation rates significantly, as temperature decreases,
inhibitory effect of water on methanol formation rates is substantial. Another
interesting point is that, at lower temperatures, increasing pressure affects the
methanol formation rates in an unexpected way; i.e., decreasing the methanol
formation rates. This phenomenon is also observed with the kinetic modeling of
Ovesen et al. [98].
4.4.2 Catalytic Methanol Formation Rates Calculated with the Static
Kinetic Model Proposed by Ovesen et al. [98]
In this static kinetic model, again rate determining steps were determined
in order to find the rate expressions. Parameters used in kinetic model were either
obtained from gas phase experiments or surface science studies. In calculation of
equilibrium constants of elementary steps, molecular partition functions were
used. Molecular partition function values, calculated from the given
thermodynamic data (Table 3.3) by Ovesen et al. are given in Table 4.7.
Equations used in partition function calculations can be seen in Section 3.4.2.

90
Table 4.7 Translational (zt), vibrational (zv) and rotational (zr) partition
functions for species involved in methanol synthesis mechanism (T= 523K)
Species zt zv zr z
H* 2.05*10-2 1 1 2.05*10-2
H2 (g) 4.52*105 2.33*10-3 2.98 3.14*103
O* 3.86*10-1 1 1 3.86*10-1
OH* 69.5 9.55*10-3 2.23*10-1 1.48*10-1
HCOO* 111 4.94*10-6 6.45*10-1 3.54*10-4
H2COO* 125 7.16*10-9 6.45*10-1 5.77*10-7
CH3O* 83.2 1.88*10-10 9.10*10-1 1.43*10-8
CO2 (g) 4.67*107 3.03*10-3 4.66*102 6.59*107
CO2* 115 3.03*10-3 7.81*102 2.73*102
CO (g) 2.37*107 5.06*10-2 1.88*102 2.26*108
CO* 234 5.66*10-2 1.82 2.41*101
CH3OH(g) 2.90*107 3.75*10-11 2.47*103 2.68
CH3OH* 124 2.44*10-13 9.10*10-1 2.75*10-11
H2O (g) 1.22*107 4.19*10-6 99.37 5.09*103
H2O* 42.3 1.05*10-5 6.98*10-2 3.10*10-5
Equilibrium constants of the reaction steps were calculated to result in
below equations with the partition function values reported above.
K1 = 5.56*10-9 exp(57000/RT)
K2 = 117.8 exp(-12300/RT)
K3 = 4.37*10-5 exp(-2800/RT)
K4 = 5.34*10-2 exp(-25100/RT)
K5 = 8.06*106 exp(-46400/RT)
K6 = 8*10-8 exp(53900/RT)

91
K7 = 17 exp(30400/RT)
K8 = 2.44*105 exp(-27300/RT)
K9 = 1.65*10-4 exp(51700/RT)
K10 = 0.814 exp(-25400/RT)
K11 = 6.22 exp(-64900/RT)
K12= 1.27*10-2 exp(72600/RT)
K13= 4.53*108 exp(-70500/RT)
From the kinetic model described in Section 3.4.2 and a similar packed
bed reactor with same feed molar flow rates, initial methanol formation rates were
calculated as in Table 4.8.
Table 4.8 Initial Initial methanol formation rates (mol/gcat/s) with FCO20 =
0.0108 mol/s, FCO0= 0.0648 mol/s, FH20= 0.189 mol/s and FH2O0= 0.0054 mol/s
Temperature
(K)
Pressure (bar)
2 15 50 75
523 3.83*10-8 4.04*10-6 4.73*10-5 9.78*10-5
453 7.16*10-9 3.36*10-7 1.27*10-6 1.63*10-6
423 2.26*10-9 3.33*10-8 5.03*10-8 5.01*10-8
400 5.32*10-10 1.88*10-9 1.61*10-9 1.43*10-9
393 2.82*10-10 6.33*10-10 4.84*10-10 4.2*10-10
353 5.04*10-13 2.37*10-13 1.37*10-13 1.12*10-13
323 3.10*10-16 1.18*10-16 6.51*10-17 5.31*10-17
300 3.15*10-19 1.61*10-19 6.37*10-20 5.20*10-20

92
From calculated kinetics, it was seen that water concentration drops due to
higher kinetics of water gas shift reaction, therefore water was added to inlet gas
composition as 2% of inlet gas making initial gas composition as: 70 % H2, 24 %
CO, 4 % CO2 and 2 % H2O.
It can be said for initial methanol rates that, for temperatures greater than
400 K, pressure has a positive effect on rates, nevertheless, for temperatures
below 400 K, increasing pressure leads to a decrease in rates. A similar trend was
observed for the rates calculated with Vanden Bussche and Froment kinetic model
[95]. This may be due to increasing formate (HCOO*) coverage at low
temperatures, which is said to be the abundant species for temperatures below 500
K by blocking free sites [99].
0.0018 0.0020 0.0022 0.0024 0.0026 0.0028 0.0030 0.0032 0.0034
-45
-40
-35
-30
-25
-20
-15
-10
-5
ln (r
ate(
mol
/gca
t/s))
1/T (K-1)
2 bar 15 bar 50 bar 75 bar
Figure 4.15 Demonstration of calculated rates in ln rate vs 1/T scale.

93
For temperatures below 393 K, same activation energy value, 240 kJ/mole
is found for all pressure values. For temperatures above 393 K, found activation
energy values vary between 60 kJ/mol and 100 kJ/mol, which is consistent with
the values found by Askgaard et al. [99].
4.4.3 Microkinetic Modeling of CO2 Hydrogenation using Finite
Difference Method and Pseudo Steady State Approximation
Majority of the methanol formation kinetic models and their rate
determining steps were based on the experimental data obtained at temperature
ranges between 450 K and 580 K. Observed unexpected behaviors in calculated
rates for low temperatures could be attributed to limitedness of the kinetic models
to high temperatures. In order to obtain reasonable methanol formation rates at
low temperatures also, a microkinetic modeling whose details can be found in
Section 3.4.3 was performed. Calculated activation energy barriers and pre-
exponential factors for each elementary step can be found in Table 4.9.

94
Table 4.9 Calculated activation energy barriers and pre exponential factors
in microkinetic modeling
kf= Af*exp(-Eaf/RT)
Reactions
kr= Ar*exp(-Ear/RT)
Af Eaf
(kJ/mol)
Ar Ear
(kJ/mol)
6.77*105 0 6*1012 21
1* 1013 52.5 2 8.55*1012 64.5
1* 106 0 1.62*1013 21
1* 106 0 8.86*1014 50
1* 1013 44.8 2.38*1013 115.8
1* 1013 14 1.79*1011 6
1* 1013 79 1* 1013 0
1* 1013 15.5 1* 1013 36.5
1* 1013 41 1.06*1014 75
9*1016 63 1* 106 0
1* 1013 86.8 5.31*1011 64.8
1* 1013 6 9.78*1014 107
1.59*1014 59 1* 106 0
Thermodynamic consistency of the reaction parameters could be observed
from Table 4.10.

95
Table 4.10 Entropy and Gibbs free energy values calculated for each step
of reaction
Reactions ΔS
(J/mol/K)
ΔH
(kJ/mol)
ΔG
(kJ/mol)
1 -133 -21 18.63
2 2 1.30 -12 -12.39
3 -138 -21 20.13
4 -171 -50 1.04
5 -7.21 -71 -68.85
6 33.4 8 -1.97
7 0 79 79
8 0 -21 -21
9 -19.6 -34 -28.16
10 210 63 0.508
11 24.4 22 14.73
12 -38.1 -101 -89.65
13 157 59 12.21
T 5 2 -137 -22.4
In the microkinetic analysis performed with finite difference method,
surface intermediate coverages could be easily followed for very short time
intervals. CO2 and CO molecules showed a sharp saturation coverage which is
responsible for the sharp decrease in vacant site coverage (Figure 4.16). Surface
intermediates and H* species on the surface, on the other hand, showed a slow
increase with progressing time (Figure 4.19 and 4.20).
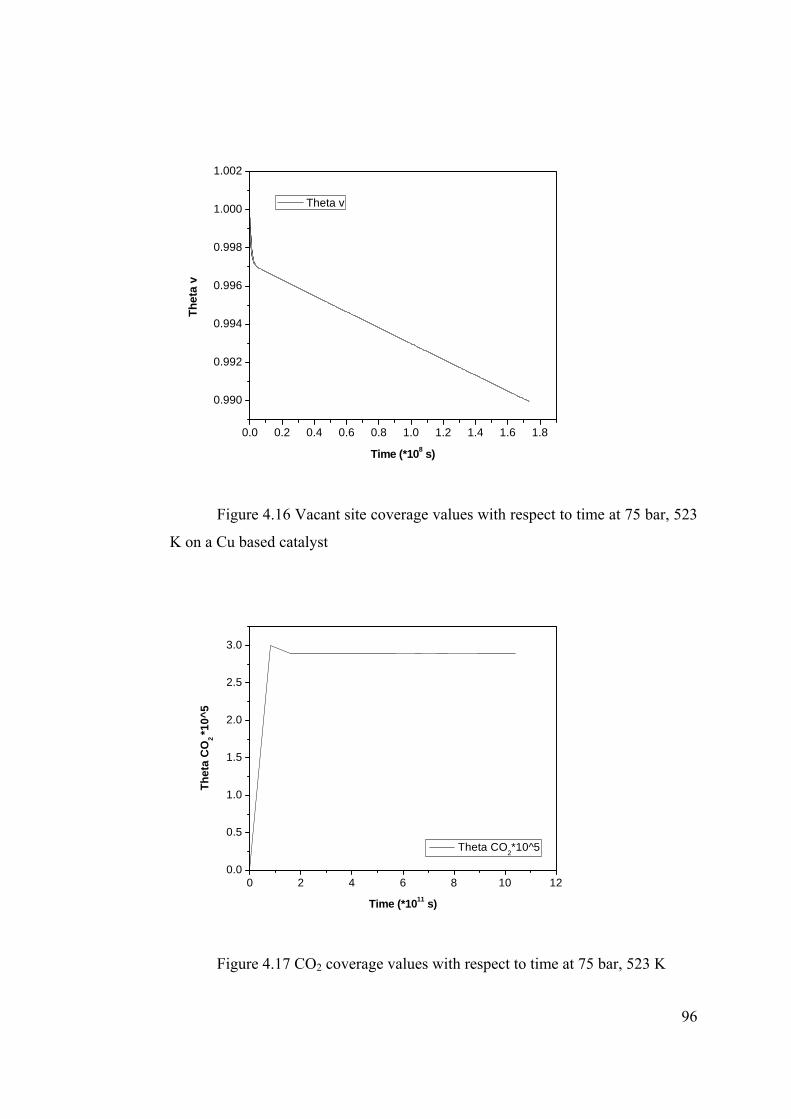
96
0.0 0.2 0.4 0.6 0.8 1.0 1.2 1.4 1.6 1.8
0.990
0.992
0.994
0.996
0.998
1.000
1.002
Thet
a v
Time (*108 s)
Theta v
Figure 4.16 Vacant site coverage values with respect to time at 75 bar, 523
K on a Cu based catalyst
0 2 4 6 8 10 120.0
0.5
1.0
1.5
2.0
2.5
3.0
Thet
a C
O2 *1
0^5
Time (*1011 s)
Theta CO2*10^5
Figure 4.17 CO2 coverage values with respect to time at 75 bar, 523 K

97
0 2 4 6 8 100.0
0.5
1.0
1.5
2.0Th
eta
CO
* 10^
3
Time (*1010 s)
Theta CO* 10^3
Figure 4.18 CO coverage values with respect to time at 75 bar, 523 K
0 1 2 3 4 50.000
0.002
0.004
0.006
0.008
0.010
0.012
0.014
0.016
0.018
0.020
Thet
a H
Time (*108 s)
Theta H
Figure 4.19 H coverage values with respect to time at 75 bar 523 K
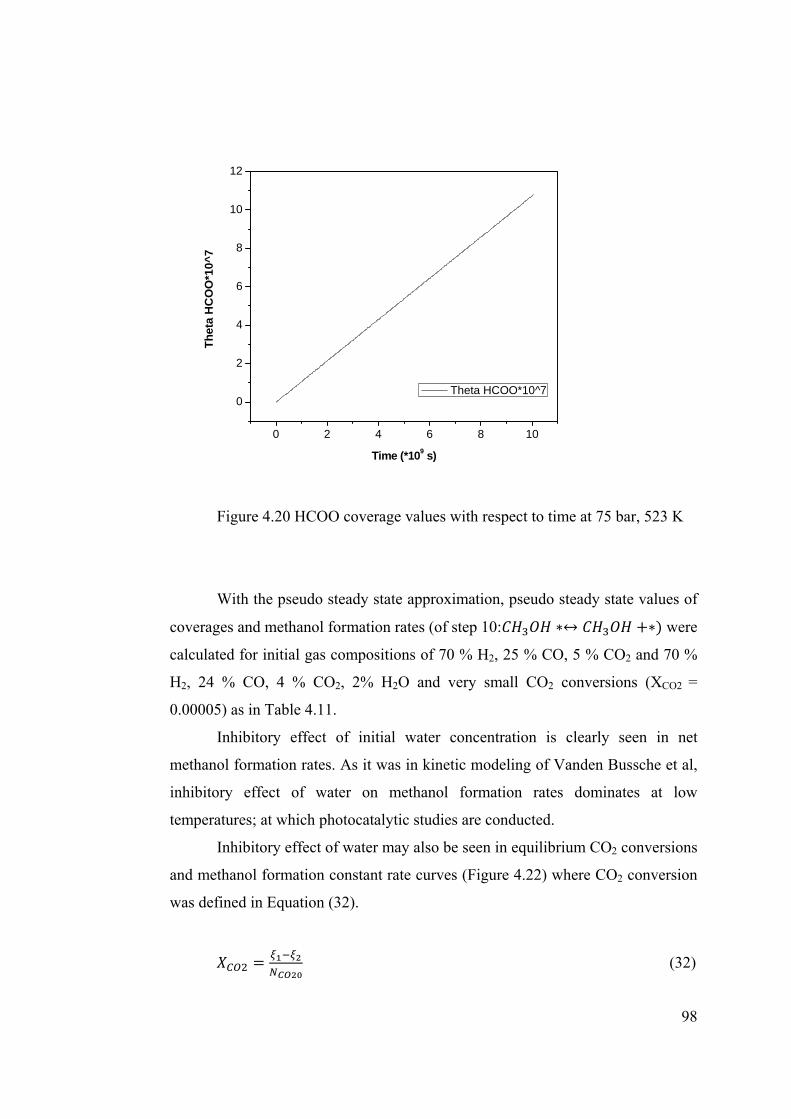
98
0 2 4 6 8 10
0
2
4
6
8
10
12
Thet
a H
CO
O*1
0^7
Time (*109 s)
Theta HCOO*10^7
Figure 4.20 HCOO coverage values with respect to time at 75 bar, 523 K
With the pseudo steady state approximation, pseudo steady state values of
coverages and methanol formation rates (of step 10: were
calculated for initial gas compositions of 70 % H2, 25 % CO, 5 % CO2 and 70 %
H2, 24 % CO, 4 % CO2, 2% H2O and very small CO2 conversions (XCO2 =
0.00005) as in Table 4.11.
Inhibitory effect of initial water concentration is clearly seen in net
methanol formation rates. As it was in kinetic modeling of Vanden Bussche et al,
inhibitory effect of water on methanol formation rates dominates at low
temperatures; at which photocatalytic studies are conducted.
Inhibitory effect of water may also be seen in equilibrium CO2 conversions
and methanol formation constant rate curves (Figure 4.22) where CO2 conversion
was defined in Equation (32).
(32)

99
For reactions:
1. 3 and
2.
Table 4.11 Steady state surface concentrations and initial methanol
formation rates (XCO2= 0.00005) at 75 bar and initial gas composition: 70 % H2,
25 % CO, 5 % CO2 for rNET1 and coverages and 70 % H2, 24 % CO, 4 % CO2, 2%
H2O for rNET2
T (K) θCO2 θCO θH θHCOO θCH3OH θv rNET1 (s
-1) rNET2 (s
-1)
523 2.6*10-5 1.9*10-3 0.104 2.7*10-5 3.7*10-7 0.893 0.3378 0.267
453 5*10-5 1*10-2 0.172 7*10-5 3.2*10-6 0.818 0.0878 0.064
423 6.9*10-5 2.4*10-2 0.217 1.1*10-4 9.6*10-6 0.758 0.0407 0.025
393 9.5*10-5 6.2*10-2 0.272 1.8*10-4 3.3*10-5 0.664 1.5*10-2 0.0059
353 1.3*10-4 2.3*10-1 0.321 3.5*10-4 2*10-4 0.442 2.2*10-3 1.7*10-4
323 1.2*10-4 5.3*10-1 0.254 4.1*10-4 6.7*10-4 0.207 1.7*10-4 2.2*10-6
300 7.6*10-5 7.8*10-1 0.142 1.4*10-4 1.4*10-3 0.073 8.0*10-6 3.4*10-8

100
250 300 350 400 450 500 5500.0
0.2
0.4
0.6
0.8
1.0
X CO
2
Temperature (K)
Without Initial Water With Initial 2% Water RMet: 6.50E-6 s-1 Without H2O RMet: 6.50E-6 s-1 With H2O RMet: 5.42E-7 s-1 Without H2O RMet: 5.42E-7 s-1 With H2O RMet: 1.90E-8 s-1 Without H2O RMet: 1.90E-8 s-1 With H2O
Figure 4.21 Equilibrium CO2 conversion and constant rate conversion
values at 75 bar. Constant rate curves were drawn for two cases, i. for 0 % initial
H2O concentration and ii. for 2 % initial H2O concentration in the feed. Negative
CO2 conversion values are resulted from extra CO2 production from water gas
shift reaction in the presence of extra water.
Methanol formation rates with different kinetic and microkinetic models
and at different reaction conditions are given in Table 4.12 in order to be able to
compare methanol formation rates within the kinetic models and also with the
photocatalytic rates.
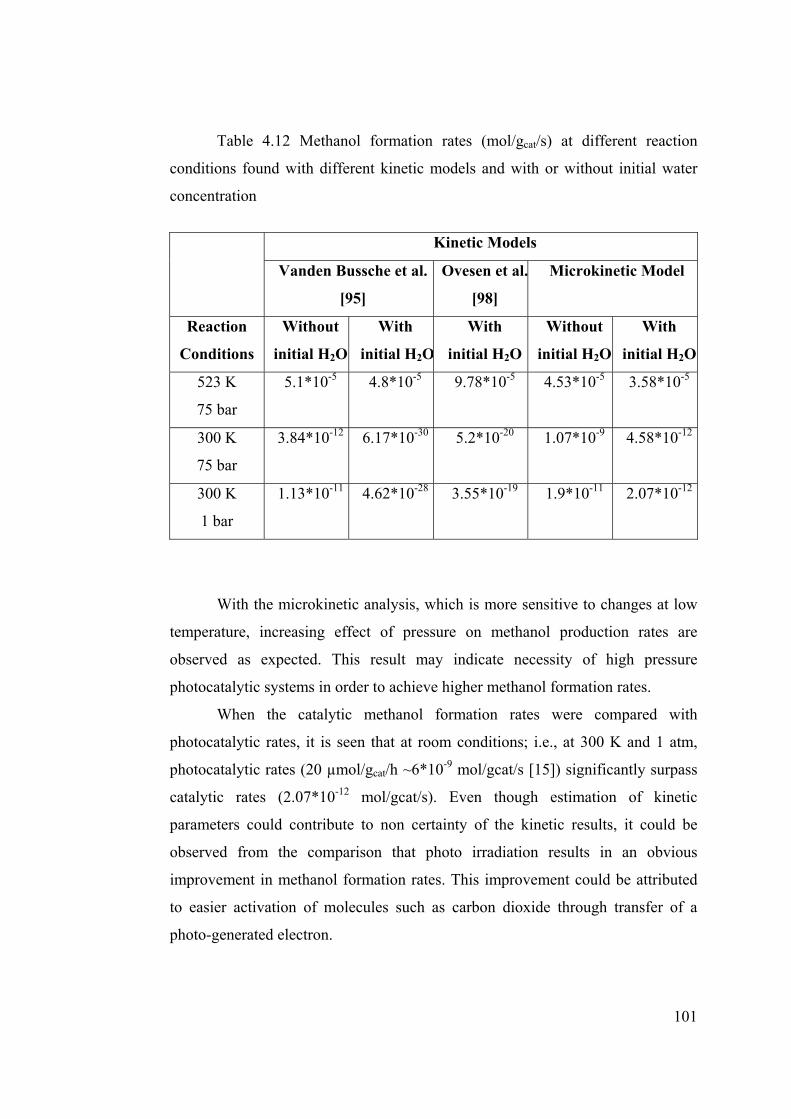
101
Table 4.12 Methanol formation rates (mol/gcat/s) at different reaction
conditions found with different kinetic models and with or without initial water
concentration
Kinetic Models
Vanden Bussche et al.
[95]
Ovesen et al.
[98]
Microkinetic Model
Reaction
Conditions
Without
initial H2O
With
initial H2O
With
initial H2O
Without
initial H2O
With
initial H2O
523 K
75 bar
5.1*10-5 4.8*10-5 9.78*10-5 4.53*10-5 3.58*10-5
300 K
75 bar
3.84*10-12 6.17*10-30 5.2*10-20 1.07*10-9 4.58*10-12
300 K
1 bar
1.13*10-11 4.62*10-28 3.55*10-19 1.9*10-11 2.07*10-12
With the microkinetic analysis, which is more sensitive to changes at low
temperature, increasing effect of pressure on methanol production rates are
observed as expected. This result may indicate necessity of high pressure
photocatalytic systems in order to achieve higher methanol formation rates.
When the catalytic methanol formation rates were compared with
photocatalytic rates, it is seen that at room conditions; i.e., at 300 K and 1 atm,
photocatalytic rates (20 µmol/gcat/h ~6*10-9 mol/gcat/s [15]) significantly surpass
catalytic rates (2.07*10-12 mol/gcat/s). Even though estimation of kinetic
parameters could contribute to non certainty of the kinetic results, it could be
observed from the comparison that photo irradiation results in an obvious
improvement in methanol formation rates. This improvement could be attributed
to easier activation of molecules such as carbon dioxide through transfer of a
photo-generated electron.

102
Rate determining steps in methanol synthesis reaction on copper based
catalysts were investigated in the next section.
4.4.4 Rate Determining Step Investigation on Copper Based Catalysts
In order to find rate determining steps in methanol formation reaction,
degree of rate control of each species were calculated at t= 5.18*10-7 s in finite
difference method (Table 4.13) and at the pseudo steady state (Table 4.14).
Table 4.13 The degree of rate control values with respect to rf10 (
) found by finite difference method at t= 5.18*10-7 s
Elementary reactions
Xrc,i
75 atm
523 K
75 atm
423 K
75 atm
300 K
1 atm
300K
1 ~0 0 0 0
2 2 0.36 2.4 3.53 3.7
3 0 0 ~0 0
4 0 0 -3.67 -0.21
5 0 0 0 0
6 0 0 0 0
7 0.997 ~1 ~1 1
8 ~0 ~0 0.71 0.57
9 0 0.56 ~1 1
10 - - - -
11 0 0 0 0
12 0 0 0 0
13 0 0 0 0
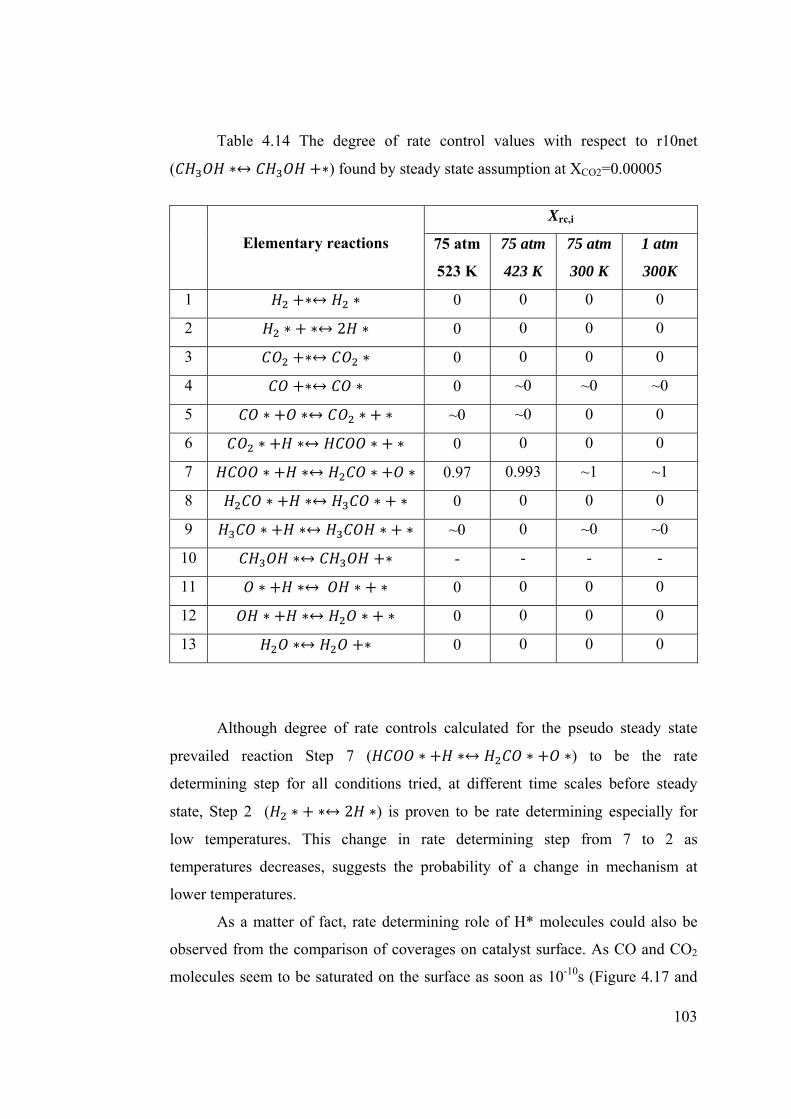
103
Table 4.14 The degree of rate control values with respect to r10net
( ) found by steady state assumption at XCO2=0.00005
Elementary reactions
Xrc,i
75 atm
523 K
75 atm
423 K
75 atm
300 K
1 atm
300K
1 0 0 0 0
2 2 0 0 0 0
3 0 0 0 0
4 0 ~0 ~0 ~0
5 ~0 ~0 0 0
6 0 0 0 0
7 0.97 0.993 ~1 ~1
8 0 0 0 0
9 ~0 0 ~0 ~0
10 - - - -
11 0 0 0 0
12 0 0 0 0
13 0 0 0 0
Although degree of rate controls calculated for the pseudo steady state
prevailed reaction Step 7 ( ) to be the rate
determining step for all conditions tried, at different time scales before steady
state, Step 2 ( 2 ) is proven to be rate determining especially for
low temperatures. This change in rate determining step from 7 to 2 as
temperatures decreases, suggests the probability of a change in mechanism at
lower temperatures.
As a matter of fact, rate determining role of H* molecules could also be
observed from the comparison of coverages on catalyst surface. As CO and CO2
molecules seem to be saturated on the surface as soon as 10-10s (Figure 4.17 and

104
Figure 4.18), H molecules continue to accumulate on the surface slowly (Figure
4.19).
Therefore, one could suggest that the bottleneck of the reaction in
photocatalytic CO2 reduction mechanism could be the H supply to the catalyst
surface, whose rates are already known to be slow since only source of H is the
water oxidation reaction in photocatalytic CO2 reduction mechanism.
In photocatalytic CO2 reduction systems, utilization of H2O as the
reductant results in some consequences which can be said to be limiting the
photocatalytic rates. The following factors are the observations and the outcomes
of this study:
• As it was proved from kinetic and microkinetic modeling, water itself
has an inhibitory effect on methanol formation rates on copper surfaces.
• Slow stirring rates of photocatalytic solutions together with the super
hydrophilicity of TiO2 surfaces contribute to a water boundary layer formation
which complicates CO2 diffusion to the surface.
• The presence of water molecules prevents or hinders activation of CO2
in photocatalytic systems by interrupting the interaction between CO2 molecules
and catalyst surface and by also oxidizing oxygen deficiencies which are essential
in CO2 activation [83].
• Slow water oxidation rates on photocatalytic systems (in which back
oxidation reaction was reported to have significant effect on observed slow
hydrogen evolution rates) limits the H concentration on the catalyst surface which
limits CO2 reduction rates.
This result; i.e., discovery of the rate determining step to be the presence
or rates of H supply in photocatalytic experiments supports the assertion of the
presence of dark steps in photocatalysis so that CO2 could be reduced with H
molecules on copper/ metal surfaces catalytically.

105
CHAPTER 5
CONCLUSIONS
The aim of this study is to elucidate the role of operational parameters and
to understand chemical details of photocatalytic carbon dioxide reduction reaction
performed in liquid media.
The stirring rate and gas hold-up time experiments performed in a liquid
phase photocatalytic system indicated probable interference of mass transfer rates
in kinetic rates at three- phase photocatalytic systems, especially at the solid-
liquid and gas- liquid interfaces. Also, gas hold-up time experiments performed in
liquid suspension of photocatalysts revealed the probability of negative
contribution of back oxidation reactions. Apparent activation energies of 12 and
19.5 kj/mol, found in photocatalytic hydrogen evolution experiments with 1 wt %
Pt/ TiO2 and 1 wt % Cu/TiO2 catalysts, were attributed as solute diffusion
activation energies in water, which also confirms the probability of mass transfer
limitations in liquid media photocatalytic tests.
As a second part of this study, photocatalytic CO2 reduction activities of
Cu/ TiO2 photocatalysts, prepared with sol-gel and incipient wetness methods,
were tested in liquid media. BET surface area, XRD, TEM and XPS
characterization analysis were performed. Metal addition with incipient wetness
method showed the best results underlying the importance of the availability of
the copper oxides on surface and also their size and dispersion rather than the
surface area of the catalyst. All of the observed methanol formation rates showed
a decrease after some point, reaching to negative values, indicating equilibrium
and realization of back oxidation reactions.

106
Low methanol formation amounts observed with carbon dioxide reduction
experiments led to the investigation of the rates of industrial processes at ambient
conditions. Comparison of the industrial and photocatalytic methanol formation
rates on copper surfaces indicated the significant effect of photo-irradiation in
carbon dioxide activation at ambient conditions. But still, findings of the kinetic
and microkinetic analysis such as inhibitory effect of water on methanol
formation rates on copper surfaces is of importance, especially at ambient
conditions. Kinetic and microkinetic analysis gave an opinion about the rate
determining steps in CO2 reduction. It was observed that 2 step
plays an important role especially at lower temperatures at which photocatalysis
occurs. Therefore, for photocatalytic systems where carbon dioxide is reduced
with water, the importance of the water oxidation rates were underlined since it is
the only H* source. Results also indicated the probability of dark steps of CO2
reduction with H molecules.
107
CHAPTER 6
RECOMMENDATIONS
One suggestion that could improve the present photocatalytic rates is the
utilization of a gas circulation system in CO2 reduction experiments. As
mentioned in Section 4.3.2, different micromixing conditions could be achieved
with a gas circulated batch system. Maximum mixedness achieved for water
molecules in the system would improve the reaction kinetics as having a reaction
order less than one in reaction rate. CO2 circulation, on the other hand, would
approach to segregated flow, which would also enhance the rates.
From the kinetic analysis, it was observed that methanol formation rates
increase as pressure increase even at room temperatures. Photocatalytic systems
could benefit from higher pressures in methanol synthesis likewise the
photosynthesis which benefits from high osmotic pressures inside the plants.
Another suggestion that could be made for present photoreactors is the
implementation of immobilized catalysts. Such kind of a system is believed to
inhibit back oxidation reactions of the reaction products by preventing the
encounter between products and other catalyst particles.
On the other hand, the gap between the photocatalytic and photosynthetic
rates motivates designing a photocatalytic system similar to photosynthetic
systems. In designing photocatalytic CO2 reduction reactions, thermal
contributions to the reaction mechanism as well as contribution of a special
electron and proton transport process should be taken into consideration.
By mimicking the nature, one could design a photocatalytic/ catalytic
reactor in such a way that in one compartment light is harvested by the

108
semiconductor in order to split water to form H+s and by the transfer of produced
protons and electrons, CO2 could be reduced catalytically with another catalyst,
such as copper, in the other compartment. In this way, with the help of proton
exchange membranes and separate reaction centers interaction between reactants
or products and therefore reverse reactions could be prevented by supplying Hs to
catalytic compartment at the same time. On the other hand, a high conductance
electron membrane would prevent charge recombination (Figure 6.1). By this way
one may approach photosynthetic rates which are 12000 times faster than current
photocatalytic CO2 reduction yields.
Figure 6.1 Schematic illustration of suggested reactor for CO2 reduction
In literature, Kitano et al. reported separate hydrogen and oxygen
evolution with an H-type glass container, in which water is splitted with titanium
nanotubes on one chamber and hydrogen is evolved with Pt particles on the other
chamber. The electrical connection was set with a nafion film [109]. Karslioglu
studied and improved this H-type system for water splitting reaction with a proton
exchange membrane and resulted in separate oxygen and hydrogen evolution in
neutral media [110].

109
REFERENCES
[1] U.S. Department of Energy Office of Science Genomic Science Program, www.genomicscience.energy.gov/pubs/CarbonCycleFlyer_01-28-09.pdf, last visited in October 2010.
[2] International Energy Agency, www.iea.org/textbase/nppdf/free/2010/
key_stats_2010.pdf, last visited in October 2010. [3] Millward, A. R.; Yaghi, O. M. Journal of the American Chemical Society
2005, 127, 17998. [4] Mikkelsen, M.; Jorgensen, M.; Krebs, F. C. Energy & Environmental Science
2010, 3, 43. [5] Softpedia, news.softpedia.com/news/Photosynthesis-Denuded-41035.shtml,
last visited in April 2010. [6] Linsebigler, A. L.; Lu, G. Q.; Yates, J. T. Chemical Reviews 1995, 95, 735. [7] Carp, O.; Huisman, C. L.; Reller, A. Progress in Solid State Chemistry 2004,
32, 33. [8] Yamashita, H.; Nishiguchi, H.; Kamada, N.; Anpo, M.; Teraoka, Y.; Hatano,
H.; Ehara, S.; Kikui, K.; Palmisano, L.; Sclafani, A.; Schiavello, M.; Fox, M. A. Research on Chemical Intermediates 1994, 20, 815.
[9] Anpo, M.; Yamashita, H.; Ichihashi, Y.; Ehara, S.; Journal of Electroanalyti-
cal Chemistry 1995 396, 21. [10] Anpo, M.; Chiba, K., Journal of Molecular Catalysis, 1992, 74, 207.

110
[11] Hirano, K.; Inoue, K.; Yatsu, T. Journal of Photochemistry and Photobiology a-Chemistry 1992, 64, 255.
[12] Sayama, K.; Arakawa, H. Journal of Physical Chemistry 1993, 97, 531. [13] Anpo, M.; Yamashita, H.; Ichihashi, Y.; Fujii, Y.; Honda, M. Journal of
Physical Chemistry B 1997, 101, 2632. [14] Anpo, M.; Yamashita, H.; Ikeue, K.; Fujii, Y.; Zhang, S. G.; Ichihashi, Y.;
Park, D. R.; Suzuki, Y.; Koyano, K.; Tatsumi, T. Catalysis Today 1998, 44, 327.
[15] Tseng, I. H.; Chang, W. C.; Wu, J. C. S. Applied Catalysis B-Environmental
2002, 37, 37. [16] Anpo, M.; Takeuchi, M.; Journal of Catalysis 2003, 216, 505. [17] Yahaya, A. H.; Gondal, M. A.; Hameed, A. Chemical Physics Letters 2004,
400, 206. [18] Wu, J. C. S.; Lin, H. M. International Journal of Photoenergy 2005, 7, 115. [19] Ozcan, O.; Yukruk, F.; Akkaya, E. U.; Uner, D. Applied Catalysis B-
Environmental 2007, 71, 291. [20] Yang, H. C.; Lin, H. Y.; Chien, Y. S.; Wu, J. C. S.; Wu, H. H. Catalysis
Letters 2009, 131, 381. [21] Kaneco, S.; Kurimoto, H.; Ohta, K.; Mizuno, T.; Saji, A. Journal of
Photochemistry and Photobiology a-Chemistry 1997, 109, 59. [22] Sa, J.; Fernandez-Garcia, M.; Anderson, J. A. Catalysis Communications
2008, 9, 1991.

111
[23] Chen, L.; Graham, M. E.; Li, G. H.; Gentner, D. R.; Dimitrijevic, N. M.; Gray, K. A. Thin Solid Films 2009, 517, 5641.
[24] Woan, K.; Pyrgiotakis, G.; Sigmund, W. Advanced Materials 2009, 21, 2233. [25] Yoneyama, H. Catalysis Today 1997, 39, 169. [26] Ozcan, O.; Yukruk, F.; Akkaya, E. U.; Uner, D. Topics in Catalysis 2007, 44,
523. [27] Asahi, R.; Morikawa, T.; Ohwaki, T.; Aoki, K.; Taga, Y. Science 2001, 293,
269. [28] Ikeue, K.; Nozaki, S.; Ogawa, M.; Anpo, M. Catalysis Today 2002, 74, 241. [29] Hwang, J. S.; Chang, J. S.; Park, S. E.; Ikeue, K.; Anpo, M. Topics in
Catalysis 2005, 35, 311. [30] Yamashita, H.; Fujii, Y.; Ichihashi, Y.; Zhang, S. G.; Ikeue, K.; Park, D. R.;
Koyano, K.; Tatsumi, T.; Anpo, M. Catalysis Today 1998, 45, 221. [31] Govindjee, Ed. Bioenergetics of Photosynthesis; Academic Press: New York,
1975. [32] Hankamer, B.; Barber, J.; Boekema, E. J. Annual Review of Plant Physiology
and Plant Molecular Biology 1997, 48, 643. [33] Ananyev, G. M.; Zaltsman, L.; Vasko, C., Dismukes, G. C.; Biochimica et
Biophysica Acta 2001, 1503, 52. [34] Haumann, M.; Liebisch, P.; Muller, C.; Barra, M.; Grabolle, M.; Dau, H.
Science 2005, 310, 1019. [35] Meyer, T. J. Nature 2008, 451, 778.
112
[36] Rensselaer Polytechnic Institute, http://www.rpi.edu/dept/bcbp/molbiochem/ MBWeb/mb2/part1/dark.htm, last visited in March 2011.
[37] Ke, B. Photosynthesis: Photobiochemistry and Photobiophysics; Kluwer
Academic Publishers: Dordrecht, 2001; Vol. 10 of Advances in Photosynthesis.
[38] Whitmarsh, J.; Govindjee In Concepts in Photobiology: Photosynthesis and
Photomorphogenesis; Singhal, G.S., Renger, G., Sopory, S. K., Irrgang, K. D., Govindjee, Eds.; Narosa Publishing House: New Delhi, 1999; Chapter 2.
[39] Heldt, H. W. Plant Biochemistry; Heldt, H. W., B. Piechulla, Eds.; Academic:
London, 2010; 4th Edition. [40] Whittingham, C. P. The Mechanism of Photosynthesis; American Elsevier
Pub. Co: New York, 1974. [41] Singal, H. R.; Talwar, G.; Dua, A.; Singh, R. Journal of Biosciences 1995,
20, 49. [42] Schulte, K. L.; DeSario, P. A.; Gray, K. A. Applied Catalysis B-Environmen-
tal 2010, 97, 354. [43] Inoue, T.; Fujishima, A.; Konishi, S.; Honda, K. Nature 1979, 277, 637. [44] Dey, G. R.; Belapurkar, A. D.; Kishore, K. Journal of Photochemistry and
Photobiology a-Chemistry 2004, 163, 503. [45] Koci, K.; Obalova, L.; Matejova, L.; Placha, D.; Lacny, Z.; Jirkovsky, J.;
Solcova, O. Applied Catalysis B-Environmental 2009, 89, 494. [46] Kitano, M.; Matsuoka, M.; Ueshima, M.; Anpo, M. Applied Catalysis a-
General 2007, 325, 1.
113
[47] Koci, K.; Mateju, K.; Obalova, L.; Krejcikova, S.; Lacny, Z.; Placha, D.; Capek, L.; Hospodkova, A.; Solcova, O. Applied Catalysis B: Environmental 2010, 96, 239.
[48] Kaneco, S.; Shimizu, Y.; Ohta, K.; Mizuno, T. Journal of Photochemistry
and Photobiology a-Chemistry 1998, 115, 223. [49] Zhang, Q. H.; Han, W. D.; Hong, Y. J.; Yu, J. G. Catalysis Today 2009, 148,
335. [50] Solymosi, F.; Tombacz, I. Catalysis Letters 1994, 27, 61. [51] Wang, C. J.; Thompson, R. L.; Baltrus, J.; Matranga, C. Journal of Physical
Chemistry Letters 2010, 1, 48. [52] Wang, Z. Y.; Chou, H. C.; Wu, J. C. S.; Tsai, D. P.; Mul, G. Applied
Catalysis a-General 2010, 380, 172. [53] Varghese, O. K.; Paulose, M.; LaTempa, T. J.; Grimes, C. A. Nano Letters
2009, 9, 731. [54] Zhao, Z. H.; Fan, J. M.; Xie, M. M.; Wang, Z. Z. Journal of Cleaner
Production 2009, 17, 1025. [55] Lo, C. C.; Hung, C. H.; Yuan, C. S.; Wu, J. F. Solar Energy Materials and
Solar Cells 2007, 91, 1765. [56] Nishimura, A.; Komatsu, N.; Mitsui, G.; Hirota, M.; Hu, E. Catalysis Today
2009, 148, 341. [57] Tsuneoka, H.; Teramura, K.; Shishido, T.; Tanaka, T. Journal of Physical
Chemistry C 2010, 114, 8892. [58] Teramura, K.; Okuoka, S.; Tsuneoka, H.; Shishido, T.; Tanaka, T. Applied
Catalysis B-Environmental 2010, 96, 565.

114
[59] Wu, J. C. S.; Lin, H. M.; Lai, C. L. Applied Catalysis a-General 2005, 296, 194.
[60] Nguyen, T. V.; Wu, J. C. S.; Chiou, C. H. Catalysis Communications 2008, 9,
2073. [61] Nguyen, T. V.; Wu, J. C. S. Solar Energy Materials and Solar Cells 2008, 92,
864. [62] Pan, P. W.; Chen, Y. W. Catalysis Communications 2007, 8, 1546. [63] Liu, Y. Y.; Huang, B. B.; Dai, Y.; Zhang, X. Y.; Qin, X. Y.; Jiang, M. H.;
Whangbo, M. H. Catalysis Communications 2009, 11, 210. [64] Jun, K. W.; Shen, W. J.; Rao, K. S. R.; Lee, K. W. Applied Catalysis a-
General 1998, 174, 231. [65] Solymosi, F.; Kliveyni, G. Journal of Physical Chemistry 1994, 98, 8061. [66] Bigg, T.; Judd, S. J. Process Safety and Environmental Protection 2001, 79,
297. [67] Nam, S.; Tratnyek, P. G. Water Research 2000, 34, 1837. [68] Chen, D.W.; Li, F.M.; Ray, A.K. Alche Journal 2000 46, 1034. [69] Chen, D.W.; Li, F.M.; Ray, A.K. Catalysis Today 2001 66, 475. [70] Dijkstra, M. F. J.; Michorius, A.; Buwalda, H.; Panneman, H. J.; Winkelman,
J. G. M.; Beenackers, A. Catalysis Today 2001, 66, 487. [71] Wang, R.; Hashimoto, K.; Fujishima, A.; Chikuni, M.; Kojima, E.; Kitamura,
A.; Shimohigoshi, M.; Watanabe, T. Advanced Materials 1998, 10, 135.
115
[72] Tan, S. S.; Zou, L.; Hu, E. Science and Technology of Advanced Materials 2007, 8, 89.
[73] Danckwerts, P. V. Chemical Engineering Science 1953, 2, 1. [74] Zwietering, T. N. Chemical Engineering Science 1959, 11, 1. [75] Weinstei.H; Adler, R. J. Chemical Engineering Science 1967, 22, 65. [76] Chauhan, S. P.; Adler, R. J.; Bell, J. P. Chemical Engineering Science 1972,
27, 585. [77] Ren, M. M.; Valsaraj, K. International Journal of Chemical Reactor
Engineering 2009, 7. [78] Tan, S. S.; Zou, L.; Hu, E. Catalysis Today 2006, 115, 269. [79] Indrakanti, V. P.; Kubicki, J. D.; Schobert, H. H. Energy & Environmental
Science 2009, 2, 745. [80] Sahibzada, M. Chemical Engineering Research and Design 2000, 78, 943. [81] Rasko, J.; Solymosi, F. Journal of Physical Chemistry 1994, 98, 7147. [82] Freund, H. J.; Roberts, M. W. Surface Science Reports 1996, 25, 227. [83] Indrakanti, V. P.; Schobert, H. H.; Kubicki, J. D. Energy & Fuels 2009, 23,
5247. [84] Solymosi, F.; Kiss, J.; Revesz, K. Journal of Chemical Physics 1991, 94,
8510. [85] Uner, D.; Oymak, M. M. Catalysis Today in press

116
[86] Chinchen, G. C.; Denny, P. J.; Parker, D. G.; Spencer, M. S.; Whan, D. A. Applied Catalysis 1987, 30, 333.
[87] Sahibzada, M.; Metcalfe, I. S.; Chadwick, D. Journal of Catalysis 1998, 174,
111. [88] Melian-Cabrera, I.; Granados, M. L.; Fierro, J. L. G. Journal of Catalysis
2002, 210, 285. [89] Arakawa, H.; Dubois, J. L.; Sayama, K. Energy Conversion and Management
1992, 33, 521. [90] Qi, G. X.; Zheng, X. M.; Fei, J. H.; Hou, Z. Y. Catalysis Letters 2001, 72,
191. [91] Lee, K. H.; Lee, J. S. Korean Journal of Chemical Engineering 1995, 12,
460. [92] Arena, F.; Italiano, G.; Barbera, K.; Bonura, G.; Spadaro, L.; Frusteri, F.
Catalysis Today 2009, 143, 80. [93] Fujita, S.; Moribe, S.; Kanamori, Y.; Kakudate, M.; Takezawa, N. Applied
Catalysis a-General 2001, 207, 121. [94] Muller, M.; Hermes, S.; Kaehler, K.; van den Berg, M. W. E.; Muhler, M.;
Fischer, R. A. Chemistry of Materials 2008, 20, 4576. [95] Vanden Bussche, K. M.; Froment, G. F. Journal of Catalysis 1996, 161, 1. [96] Graaf, G. H.; Sijtsema, P. J. J. M.; Stamhuis, E. J.; Joosten, G. E. H.
Chemical Engineering Science 1986, 41, 2883. [97] Klier, K.; Chatikavanij, V.; Herman, R. G.; Simmons, G. W. Journal of
Catalysis 1982, 74, 343.
117
[98] Ovesen, C.V., Clausen, B.S., Schiotz, C., Stoltze, P., Topsoe, H., Norskov, J.K, Journal of Catalysis 1997, 168, 133.
[99] Askgaard, T.S., Norskov, J.K., Ovesen, C.V., Stoltze, P, Journal of Catalysis
1995, 156, 229. [100] Xia, X.; d’Alnoncourt, R. N.; Strunk, J.; Litvinov, S.; Muhler, M. Applied
Surface Science 2007, 253, 5851. [101] Shustorovich, E; Bell, A. T. Surface Science 1991, 253, 386. [102] Dumesic, J. A.; Rudd, D. F.; Aparicio, L. M.; Rekoske, J. E.; Trevino, A. A.
The Microkinetics of Heterogeneous Catalysis; American Chemical Society: Washington, 1993.
[103] Campbell, C.T.; Letter to the Editor, Journal of Catalysis, 2001, 204, 520. [104] Majid, A.; Tunney, J.; Argue, S.; Kingston, D.; Post, M.; Margeson, J.;
Gardner, G. J. Journal of Sol- Gel Science and Technology 2010, 53, 390. [105] Ramirez, A. P.; Subramanian, M. A; Gardel, M.; Blumberg, G.; Li, D.; Vogt,
T.; Shapiro, S. M. Solid State Communications 2000, 115, 217. [106] Hisatomi, T.; Maeda, K.; Takanabe, K.; Kubota, J.; Domen, K. Journal of
Physical Chemistry C 2009, 113, 21458. [107] Suzuki, E.; Hayashi, Y.; Shimomura, Y.; Yoshida, S.; Usami, H.; Nakasa, A.;
Fujimatsu, H. Journal of Chemical Engineering of Japan 2005, 38, 824. [108] Choi, H. J.; Kang, M. International Journal of Hydrogen Energy 2007, 32,
3841. [109] Kitano, M..; Takeuchi, M.; Matsuoka, M.; Thomas, J. M.; Anpo, M.;
Catalysis Today 2007, 120, 133.

118
[110] Osman Karslıoğlu, Photocatalytic and Photoelectrochemical Water Splitting over Ordered Titania Nanotube Arrays, M.Sc. Thesis, Chemical Engineering Department, METU, Ankara, 2008.

119
APPENDIX A
REDOX COMPONENTS IN PHOTOSYNTHESIS
A.1 TYROSINE
Figure A.1 Structural formula of tyrosine

acids b
A.2 PLAST
Figure A.2
A.3 PLAST
Figure A.3
ound to cop
TOQUINO
Structural
TOCYANI
Demonstra
pper molecu
ONE
formula of p
IN
ation of cop
ule
plastoquino
pper site in
one
plastocyaniine with fou
120
ur amino

121
A.4 FERRODOXIN
Figure A.4 Demonstration of Fe2S2 ferrodoxin
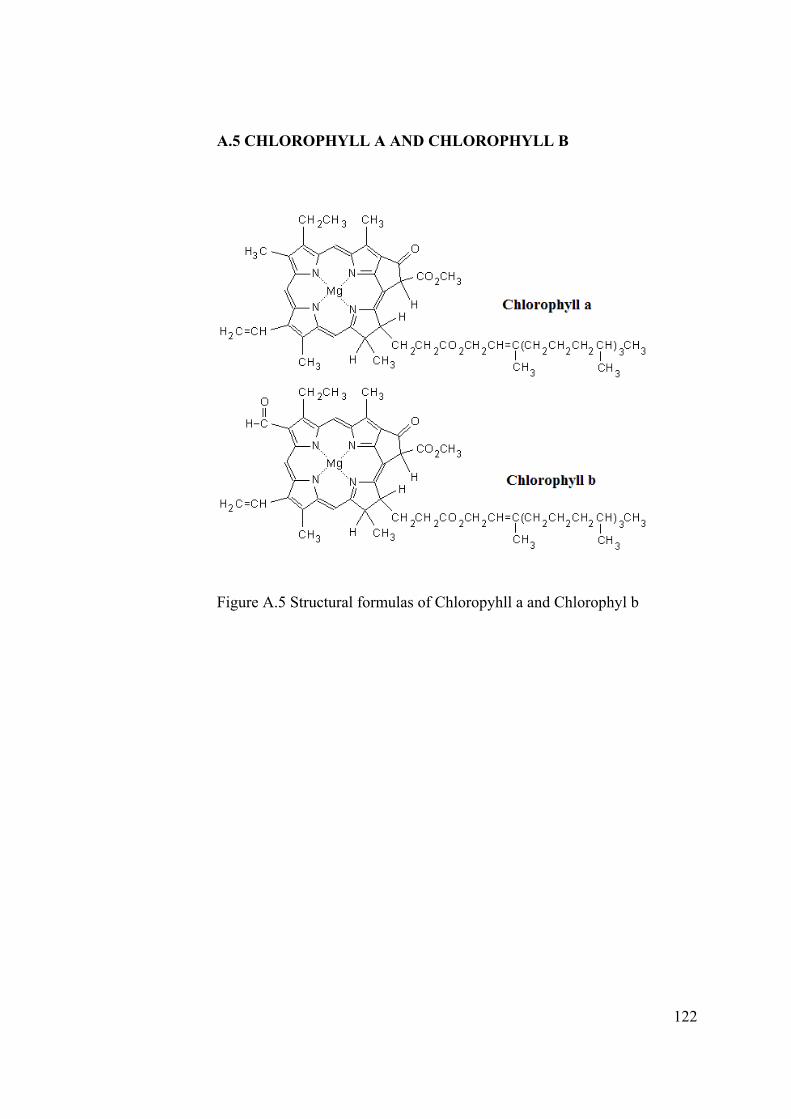
122
A.5 CHLOROPHYLL A AND CHLOROPHYLL B
Figure A.5 Structural formulas of Chloropyhll a and Chlorophyl b

123
APPENDIX B
PHOTOCATALYTIC TEST RESULT CALCULATIONS
B.1 MASS TRANSFER LIMITATION EXPERIMENTS
In the mass transfer limitations, pressure and temperature of the system
were recorded for each sample withdrawn. The calibration curve for hydrogen in
GC/TCD is given in Equation (B.1).
% concentration of H2 = 5.8*10-4* H2 peak area in GC (B.1)
Table B.1 Raw data obtained from stirring rate experiments, a. 900 rpm, b.
350 rpm
a. 900 rpm
Time
(h)
Peak
Area (H2)
%conc
H2
Pressure
(Pa)
T (K) Micromole
of H2
Micromole
of H2/gcat
0 0 0 101521.2 298 0 0 0.25 1051.3 0.61 103188.9 302 26.813 107.25 0.5 3259.4 1.89 104660.4 306 83.214 332.86 0.75 5790.3 3.36 105837.6 308 148.52 594.09
1 7975.9 4.63 105935.7 308 204.77 819.09 1.25 10596.3 6.15 106328.1 309 272.17 1088.70 1.5 12845.3 7.45 106818.6 311 329.33 1317.32 1.75 14893.6 8.64 107897.7 313 383.23 1532.95
2 17427.1 10.11 108584.4 313 451.28 1805.13

124
Table B.1 (Continued)
b. 350 rpm
Time
(h)
Peak
Area (H2)
%conc
H2
Pressure
(Pa)
T (K) Micromole
of H2
Micromole
of H2/gcat
0 0 0.00 101619.3 296 0 0.00 0.25 294.6 0.17 102698.4 302 7.48 29.91 0.5 1070.9 0.62 103483.2 307 26.95 107.78 0.75 2195.6 1.27 103581.3 310 54.76 219.05
1 4654.1 2.70 104856.6 312 116.76 467.02 1.25 6977.2 4.05 106033.8 313 176.43 705.74 1.5 9685.1 5.62 107799.6 315 247.41 989.63 1.75 11414.3 6.62 108878.7 315 294.50 1177.99
2 13486.8 7.82 109467.3 315 349.85 1399.41
During the calculations, gas volume of the reactor is taken constant at 104
ml. Micromoles of hydrogen is calculated from ideal gas law with found %
concentrations in the gas volume.

125
Table B.2 Raw data for effect of gas hold-up time experiments with 0.5 wt
% Pt/TiO2, a. 62.5 ml, b. 125 ml, c. 187.5 ml, d. 250 ml
a. 62.5 ml
Time
(h)
Peak
Area (H2)
%conc
H2
Pressure
(Pa)
T (K) Micromole
of H2
Micromole
of H2/gcat
0 0 0.00 101521.2 297 0.00 0.00 0.25 484.4 0.28 103973.7 302 34.26 548.21 0.5 1018.6 0.59 105150.9 308 71.44 1143.11 0.75 1471.6 0.85 106131.9 310 103.51 1656.14
1 1798.6 1.04 106916.7 310 127.44 2039.11 1.25 2228.6 1.29 107211 312 157.33 2517.33 1.5 2762.4 1.60 107603.4 313 195.11 3121.70 1.75 3062.6 1.78 107897.7 313 216.90 3470.41
2 4095.2 2.38 108093.9 313 290.56 4648.95 b. 125 ml
Time
(h)
Peak
Area (H2)
%conc
H2
Pressure
(Pa)
T (K) Micromole
of H2
Micromole
of H2/gcat
0 0 0.00 101619.3 297 0.00 0.00 0.25 406.2 0.24 102796.5 302 22.38 179.02 0.5 998 0.58 104366.1 305 55.27 442.17 0.75 1948.8 1.13 105837.6 308 108.38 867.07
1 2527.6 1.47 106720.5 310 140.83 1126.65 1.25 4158.7 2.41 107995.8 312 232.98 1863.83 1.5 5088 2.95 109467.3 313 288.00 2304.00 1.75 6195.2 3.59 109859.7 313 351.93 2815.43
2 7174.5 4.16 111135 313 412.29 3298.33
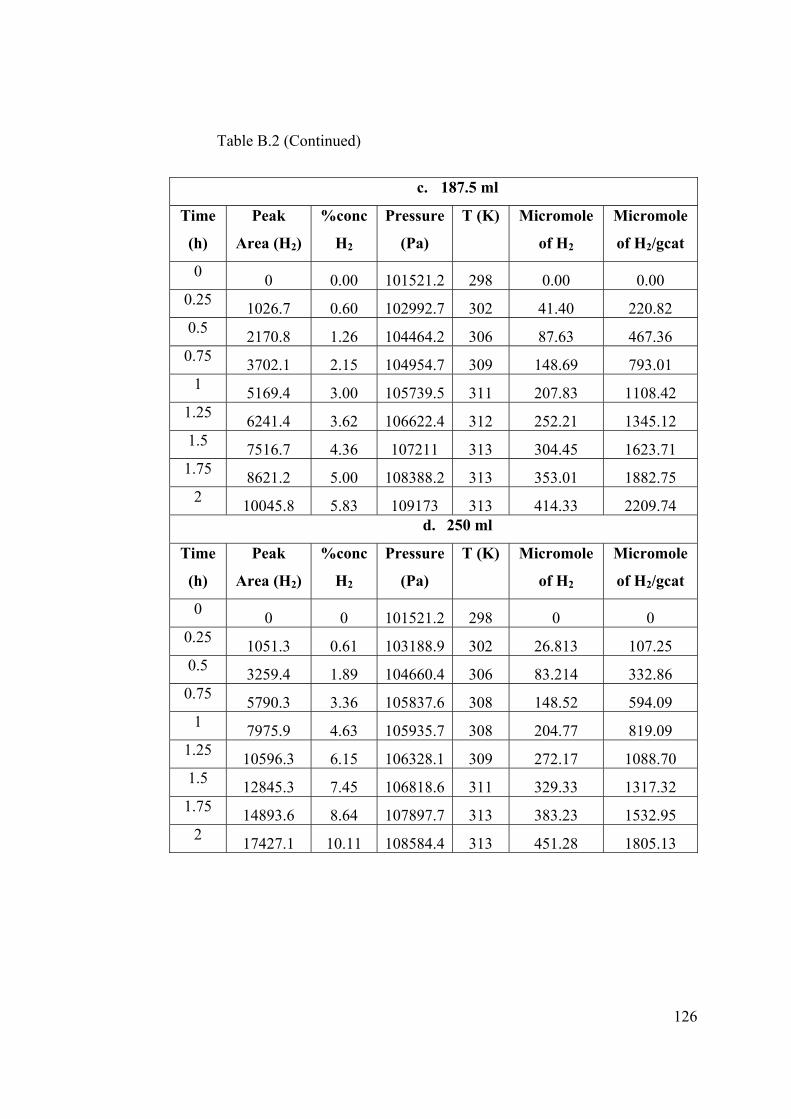
126
Table B.2 (Continued)
c. 187.5 ml
Time
(h)
Peak
Area (H2)
%conc
H2
Pressure
(Pa)
T (K) Micromole
of H2
Micromole
of H2/gcat
0 0 0.00 101521.2 298 0.00 0.00 0.25 1026.7 0.60 102992.7 302 41.40 220.82 0.5 2170.8 1.26 104464.2 306 87.63 467.36 0.75 3702.1 2.15 104954.7 309 148.69 793.01
1 5169.4 3.00 105739.5 311 207.83 1108.42 1.25 6241.4 3.62 106622.4 312 252.21 1345.12 1.5 7516.7 4.36 107211 313 304.45 1623.71 1.75 8621.2 5.00 108388.2 313 353.01 1882.75
2 10045.8 5.83 109173 313 414.33 2209.74 d. 250 ml
Time
(h)
Peak
Area (H2)
%conc
H2
Pressure
(Pa)
T (K) Micromole
of H2
Micromole
of H2/gcat
0 0 0 101521.2 298 0 0 0.25 1051.3 0.61 103188.9 302 26.813 107.25 0.5 3259.4 1.89 104660.4 306 83.214 332.86 0.75 5790.3 3.36 105837.6 308 148.52 594.09
1 7975.9 4.63 105935.7 308 204.77 819.09 1.25 10596.3 6.15 106328.1 309 272.17 1088.70 1.5 12845.3 7.45 106818.6 311 329.33 1317.32 1.75 14893.6 8.64 107897.7 313 383.23 1532.95
2 17427.1 10.11 108584.4 313 451.28 1805.13

127
Table B.3 Raw data for effect of temperature experiments with 1 wt %
Pt/TiO2, a. 32 °C, b. 65 °C, c. 77 °C, d. 85 °C
a. 32 ° C
Time
(h)
Peak
Area (H2)
%conc
H2
Pressure
(Pa)
T (K) Micromole
of H2
Micromole
of H2/gcat
0 0 0.00 101325 296 0 0.00 0.25 1342.7 0.88 101717.4 298 21.59 86.35 0.5 4457.4 2.91 102109.8 300 71.46 285.85 0.75 9079.4 5.93 102306 300 145.85 583.38
1 12231.7 7.98 102502.2 301 196.20 784.82 1.25 16127.1 10.53 103483.2 302 260.30 1041.20 1.5 18882.4 12.32 104954.7 304 307.07 1228.29 1.75 22383 14.61 105150.9 304 364.68 1458.72
2 25283.6 16.50 105935.7 304 415.01 1660.06 b. 65 ° C
Time
(h)
Peak
Area (H2)
%conc
H2
Pressure
(Pa)
T (K) Micromole
of H2
Micromole
of H2/gcat
0 0 0.00 101325 338 0.00 0.00 0.25 1444.5 0.84 103581.3 338 32.12 128.47 0.5 4666 2.71 105543.3 338 105.71 422.83 0.75 7855.7 4.56 107309.1 338 180.95 723.80
1 11967.1 6.94 108878.7 338 279.68 1118.73 1.25 14599.7 8.47 110546.4 338 346.44 1385.74 1.5 18641.7 10.81 112017.9 338 448.24 1792.95 1.75 21499.3 12.47 113195.1 338 522.38 2089.52
2 26397.8 15.31 114470.4 338 648.63 2594.51
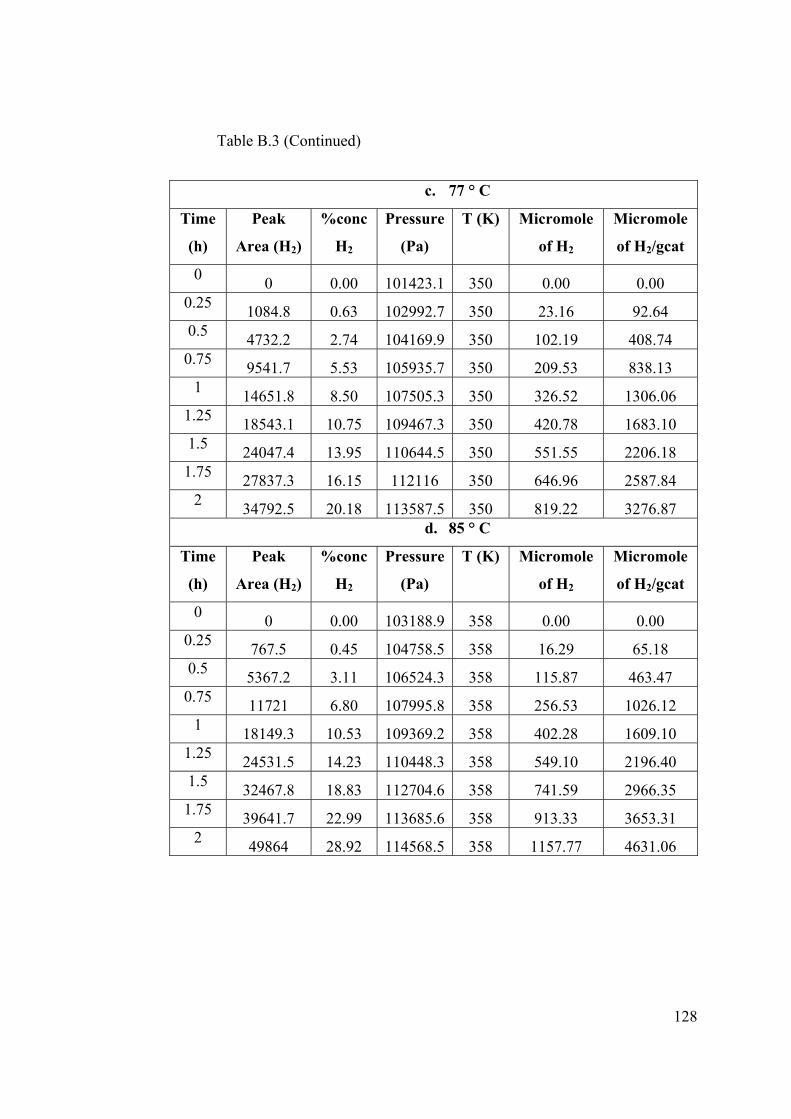
128
Table B.3 (Continued)
c. 77 ° C
Time
(h)
Peak
Area (H2)
%conc
H2
Pressure
(Pa)
T (K) Micromole
of H2
Micromole
of H2/gcat
0 0 0.00 101423.1 350 0.00 0.00 0.25 1084.8 0.63 102992.7 350 23.16 92.64 0.5 4732.2 2.74 104169.9 350 102.19 408.74 0.75 9541.7 5.53 105935.7 350 209.53 838.13
1 14651.8 8.50 107505.3 350 326.52 1306.06 1.25 18543.1 10.75 109467.3 350 420.78 1683.10 1.5 24047.4 13.95 110644.5 350 551.55 2206.18 1.75 27837.3 16.15 112116 350 646.96 2587.84
2 34792.5 20.18 113587.5 350 819.22 3276.87 d. 85 ° C
Time
(h)
Peak
Area (H2)
%conc
H2
Pressure
(Pa)
T (K) Micromole
of H2
Micromole
of H2/gcat
0 0 0.00 103188.9 358 0.00 0.00 0.25 767.5 0.45 104758.5 358 16.29 65.18 0.5 5367.2 3.11 106524.3 358 115.87 463.47 0.75 11721 6.80 107995.8 358 256.53 1026.12
1 18149.3 10.53 109369.2 358 402.28 1609.10 1.25 24531.5 14.23 110448.3 358 549.10 2196.40 1.5 32467.8 18.83 112704.6 358 741.59 2966.35 1.75 39641.7 22.99 113685.6 358 913.33 3653.31
2 49864 28.92 114568.5 358 1157.77 4631.06

129
Table B.4 Raw data for effect of temperature experiments with 1 wt %
Cu/TiO2, a. 44 °C, b. 75 °C
a. 44 ° C
Time
(h)
Peak
Area (H2)
%conc
H2
Pressure
(Pa)
T (K) Micromole
of H2
Micromole
of H2/gcat
0 0 0.00 101423.1 300 0.00 0.00 0.25 52.6 0.03 102796.5 305 1.33 5.31 0.5 496 0.30 103777.5 310 12.44 49.74 0.75 1239.5 0.74 104758.5 314 30.97 123.88
1 2052.2 1.23 106033.8 316 51.57 206.29 1.25 2708.6 1.62 107014.8 316 68.70 274.79 1.5 4142.6 2.48 107505.3 317 105.21 420.86 1.75 5785.3 3.46 108192 317 147.87 591.50
2 6976.5 4.18 108780.6 317 179.29 717.17 b. 75 ° C
Time
(h)
Peak
Area (H2)
%conc
H2
Pressure
(Pa)
T (K) Micromole
of H2
Micromole
of H2/gcat
0 0 0.00 101325 348 0.00 0.00 0.25 81.3 0.05 103287 348 1.81 7.23 0.5 1021.4 0.61 106524.3 348 23.42 93.66 0.75 3297 1.97 108486.3 348 76.97 307.90
1 5202.8 3.11 109467.3 348 122.57 490.27 1.25 6417.6 3.84 110448.3 348 152.54 610.16 1.5 8285.9 4.96 111919.8 348 199.57 798.29 1.75 10649 6.38 117315.3 348 268.85 1075.42
2 13182.8 7.89 118590.6 348 336.44 1345.77

130
B.2 PHOTOCATALYTIC CO2 REDUCTION EXPERIMENTS
In CO2 reduction experiments, the moles of methanol in 300 ml water
were calculated from the raw % volume concentration data obtained from GC FID
analysis. The calibration curve found for methanol/water mixture is given in
Equation (B.2).
% concentration of MeOH= 3.99*10-8* peak area of MeOH (B.2)
During the calculations of micromoles of methanol in 300 ml water,
density and molecular mass of methanol is taken as 0.7918 g/cm3 and 32.04
g/mole respectively.
Table B.5 Raw data obtained from photocatalytic CO2 reduction
experiment performed with first set of catalysts a. 1 wt % Cu/ TiO2 (Degussa
P25), b. 2 wt % Cu/ TiO2 (Degussa P25), c. 3 wt % Cu/ TiO2 (Degussa P25)
a. 1 wt % Cu/TiO2 (Degussa P25)
Time
(h)
Peak
Area of
MeOH
%conc
MeOH in
liquid
Volume
of MeOH (ml) in 300
ml water
Micromole
of MeOH
Micromole
of
MeOH/gcat
0 0 0 0 0.00 0.00 1 0 0 0 0.00 0.00 2 618.6 2.47*10-5 7.40*10-5 1.83 6.10 3 1125.2 4.49*10-5 1.35*10-4 3.33 11.09 4 1334 5.32*10-5 1.60*10-4 3.95 13.15 5 1608 6.42*10-5 1.92*10-4 4.76 15.86 6 1426.2 5.69*10-5 1.71*10-4 4.22 14.06 7 838 3.34*10-5 1.00*10-4 2.48 8.26
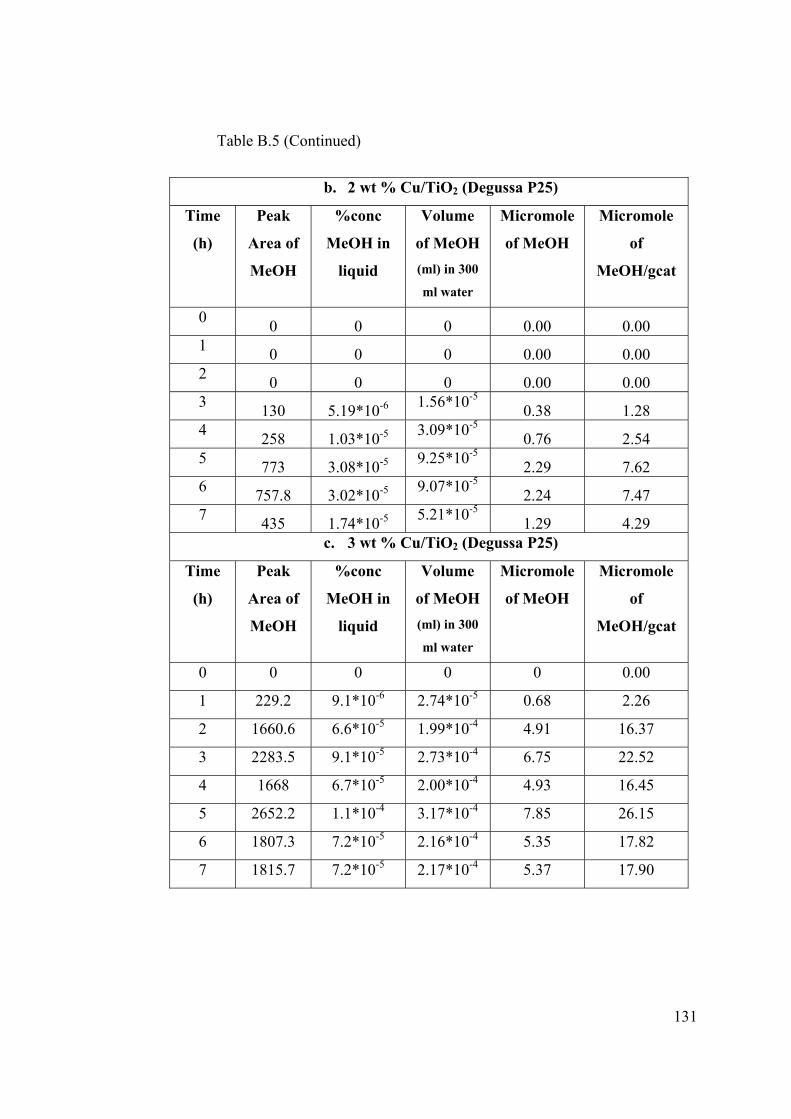
131
Table B.5 (Continued)
b. 2 wt % Cu/TiO2 (Degussa P25)
Time
(h)
Peak
Area of
MeOH
%conc
MeOH in
liquid
Volume
of MeOH (ml) in 300
ml water
Micromole
of MeOH
Micromole
of
MeOH/gcat
0 0 0 0 0.00 0.00 1 0 0 0 0.00 0.00 2 0 0 0 0.00 0.00 3 130 5.19*10-6 1.56*10-5 0.38 1.28 4 258 1.03*10-5 3.09*10-5 0.76 2.54 5 773 3.08*10-5 9.25*10-5 2.29 7.62 6 757.8 3.02*10-5 9.07*10-5 2.24 7.47 7 435 1.74*10-5 5.21*10-5 1.29 4.29
c. 3 wt % Cu/TiO2 (Degussa P25)
Time
(h)
Peak
Area of
MeOH
%conc
MeOH in
liquid
Volume
of MeOH (ml) in 300
ml water
Micromole
of MeOH
Micromole
of
MeOH/gcat
0 0 0 0 0 0.00
1 229.2 9.1*10-6 2.74*10-5 0.68 2.26
2 1660.6 6.6*10-5 1.99*10-4 4.91 16.37
3 2283.5 9.1*10-5 2.73*10-4 6.75 22.52
4 1668 6.7*10-5 2.00*10-4 4.93 16.45
5 2652.2 1.1*10-4 3.17*10-4 7.85 26.15
6 1807.3 7.2*10-5 2.16*10-4 5.35 17.82
7 1815.7 7.2*10-5 2.17*10-4 5.37 17.90
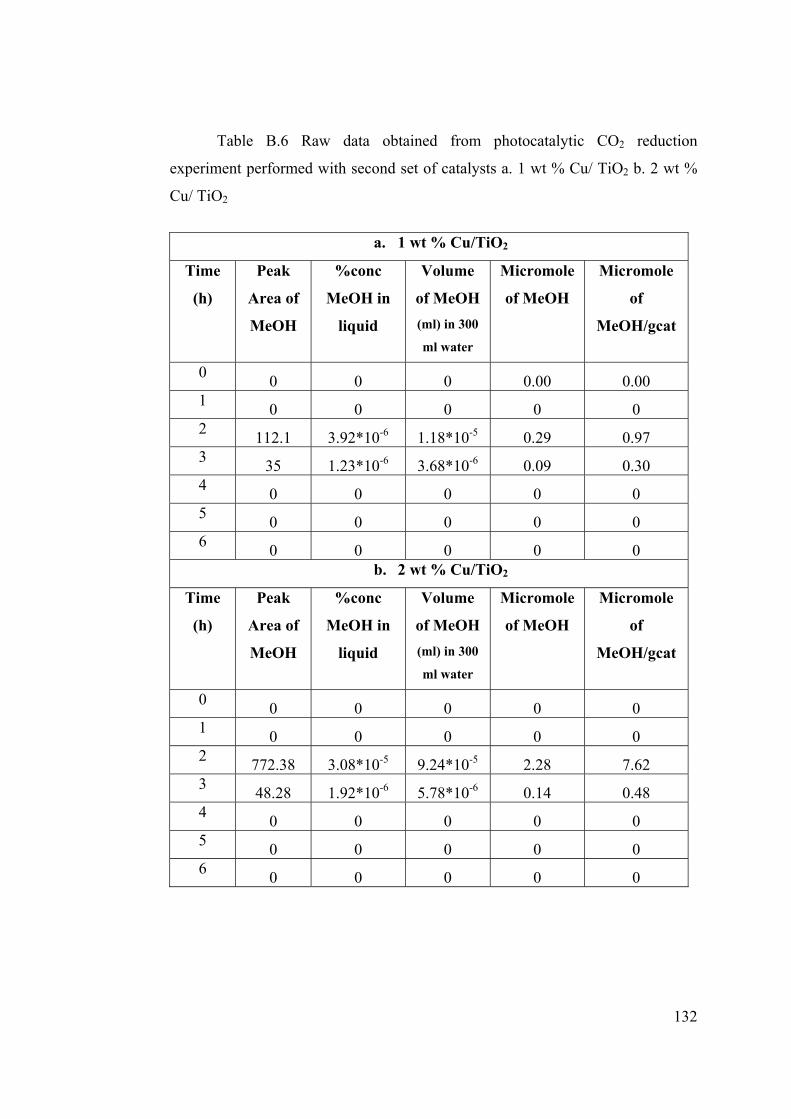
132
Table B.6 Raw data obtained from photocatalytic CO2 reduction
experiment performed with second set of catalysts a. 1 wt % Cu/ TiO2 b. 2 wt %
Cu/ TiO2
a. 1 wt % Cu/TiO2
Time
(h)
Peak
Area of
MeOH
%conc
MeOH in
liquid
Volume
of MeOH (ml) in 300
ml water
Micromole
of MeOH
Micromole
of
MeOH/gcat
0 0 0 0 0.00 0.00 1 0 0 0 0 0 2 112.1 3.92*10-6 1.18*10-5 0.29 0.97 3 35 1.23*10-6 3.68*10-6 0.09 0.30 4 0 0 0 0 0 5 0 0 0 0 0 6 0 0 0 0 0
b. 2 wt % Cu/TiO2
Time
(h)
Peak
Area of
MeOH
%conc
MeOH in
liquid
Volume
of MeOH (ml) in 300
ml water
Micromole
of MeOH
Micromole
of
MeOH/gcat
0 0 0 0 0 0 1 0 0 0 0 0 2 772.38 3.08*10-5 9.24*10-5 2.28 7.62 3 48.28 1.92*10-6 5.78*10-6 0.14 0.48 4 0 0 0 0 0 5 0 0 0 0 0 6 0 0 0 0 0

133
Table B.7 Raw data obtained from photocatalytic CO2 reduction
experiment performed with fourth set of catalyst (3 wt % Cu/ TiO2)
Time
(h)
Peak
Area of
MeOH
%conc
MeOH in
liquid
Volume
of MeOH (ml) in 300
ml water
Micromole
of MeOH
Micromole
of
MeOH/gcat
0 0 0 0 0 0 1 0 0 0 0 0 2 0 0 0 0 0 3 2376.2 9.48*10-5 2.84*10-4 7.03 23.43 4 1335.4 5.33*10-5 1.60*10-4 3.95 13.17 5 2799.1 1.12*10-4 3.35*10-4 8.28 27.60 6 1704.1 6.80*10-5 2.04*10-4 5.04 16.80 7 339.1 1.35*10-5 4.06*10-5 1.00 3.34
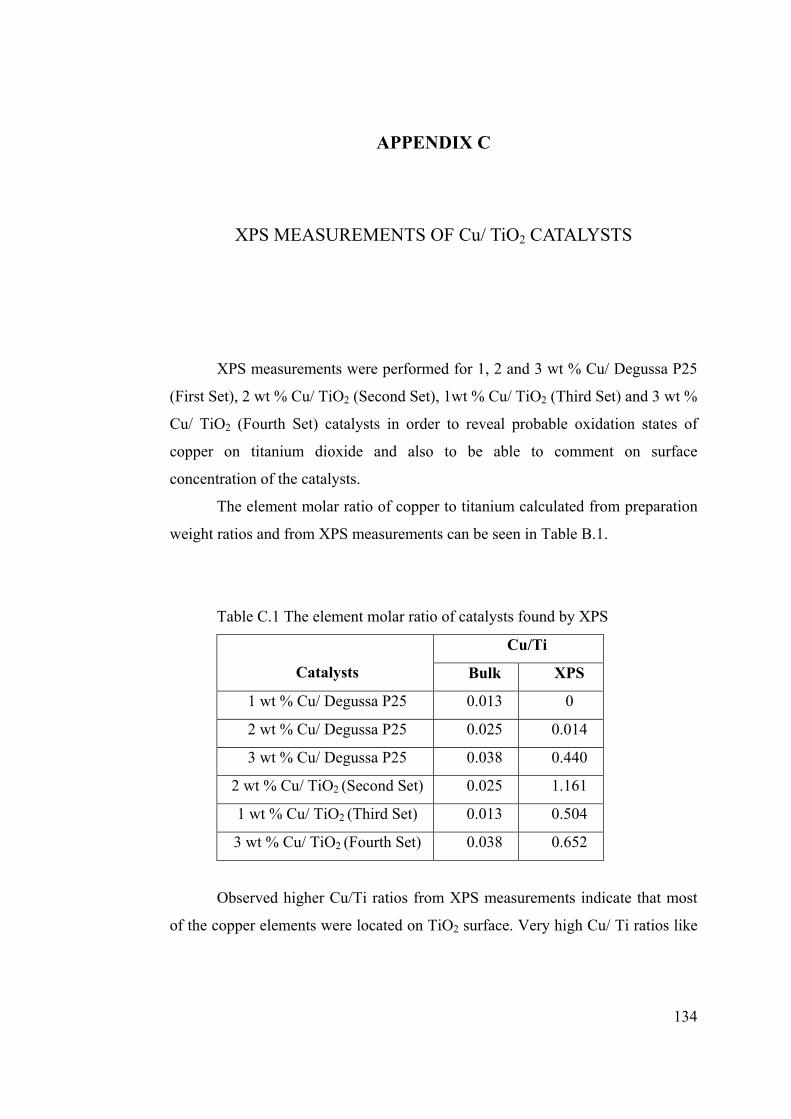
134
APPENDIX C
XPS MEASUREMENTS OF Cu/ TiO2 CATALYSTS
XPS measurements were performed for 1, 2 and 3 wt % Cu/ Degussa P25
(First Set), 2 wt % Cu/ TiO2 (Second Set), 1wt % Cu/ TiO2 (Third Set) and 3 wt %
Cu/ TiO2 (Fourth Set) catalysts in order to reveal probable oxidation states of
copper on titanium dioxide and also to be able to comment on surface
concentration of the catalysts.
The element molar ratio of copper to titanium calculated from preparation
weight ratios and from XPS measurements can be seen in Table B.1.
Table C.1 The element molar ratio of catalysts found by XPS
Catalysts
Cu/Ti
Bulk XPS
1 wt % Cu/ Degussa P25 0.013 0
2 wt % Cu/ Degussa P25 0.025 0.014
3 wt % Cu/ Degussa P25 0.038 0.440
2 wt % Cu/ TiO2 (Second Set) 0.025 1.161
1 wt % Cu/ TiO2 (Third Set) 0.013 0.504
3 wt % Cu/ TiO2 (Fourth Set) 0.038 0.652
Observed higher Cu/Ti ratios from XPS measurements indicate that most
of the copper elements were located on TiO2 surface. Very high Cu/ Ti ratios like

135
1.161 for 2 wt % Cu/ TiO2 catalyst suggest excess copper coverage of TiO2
surface which could result in inefficient light activation of the semiconductor.
Figure C.1 XPS spectra of Cu/ Degussa P25 catalysts prepared by incipient
wetness method
Figure C.1 shows XPS spectra of 1, 2 and 3 wt % Cu/ Degussa P25
catalysts prepared with incipient wetness method. The binding energies of Cu
2p3/2 and Cu 2p1/2, 933.8 and 953.6 eV respectively reveal the presence of CuO
species on catalyst surfaces.


