Download - Persistent effects of subsoil compaction on pore size distribution and gas transport in a loamy soil
Soil & Tillage Research 122 (2012) 42–51
Persistent effects of subsoil compaction on pore size distribution and gastransport in a loamy soil
F.E. Berisso a,*, P. Schjønning a, T. Keller b,c, M. Lamande a, A. Etana b, L.W. de Jonge a,B.V. Iversen a, J. Arvidsson b, J. Forkman d
a Aarhus University, Department of Agroecology, P.O. Box 50, DK-8830 Tjele, Denmarkb Swedish University of Agricultural Sciences, Department of Soil & Environment, Box 7014, SE-75007 Uppsala, Swedenc Agroscope Research Station ART, Reckenholzstrasse 191, Department of Natural Resources and Agriculture, CH-8046 Zurich, Switzerlandd Swedish University of Agricultural Sciences, Department of Crop Production Ecology, Box 7043, SE-75007 Uppsala, Sweden
A R T I C L E I N F O
Article history:
Received 13 October 2011
Received in revised form 14 February 2012
Accepted 16 February 2012
Keywords:
Subsoil
Compaction
Soil pore
Gas diffusivity
Air permeability
Persistency
A B S T R A C T
The ever-increasing weight of agricultural machines exacerbates the risk of subsoil compaction, a
condition believed to be persistent and difficult to alleviate by soil tillage and natural loosening
processes. However, experimental data on the persistency of subsoil compaction effects on soil pore
functioning are scarce. This study evaluated and quantified persistent effects of subsoil compaction on
soil pore structure and gas transport processes using intact cores taken at 0.3, 0.5, 0.7 and 0.9 m depth
from a loamy soil in a compaction experiment in southern Sweden (Brahmehem Farm). The treatments
included four repeated wheelings with �10 Mg wheel loads. Water retention characteristics (WRC), air
permeability (ka) and gas diffusivity (Ds/Do) were measured. A dual-porosity model fitted the WRC well,
and there was a reduction in the volume of macropores >30 mm in compacted compared with control
soil for all soil depths. Averaged for all sampling depths and also for some individual depths, both ka and
Ds/Do were significantly reduced by compaction. Gas transport measurements showed that the
experimental soil was poorly aerated, with local anoxic conditions at water regimes around field
capacity in all plots and depths, but with significantly higher percentage anoxia in compacted soil. Our
main findings were that: (1) commonly used agricultural machinery can compact the soil to 0.9 m depth,
(2) the effect may persist for at least 14 years, and (3) important soil functions are affected.
� 2012 Elsevier B.V. All rights reserved.
Contents lists available at SciVerse ScienceDirect
Soil & Tillage Research
jou r nal h o mep age: w ww.els evier . co m/lo c ate /s t i l l
1. Introduction
In recent decades, the weight of agricultural machines hasincreased in order to meet the demands of modern agriculture.This ever-increasing weight of agricultural machines causes stresspenetration to deeper soil layers (Carpenter et al., 1985; Kelleret al., 2007; Lamande et al., 2007; Lamande and Schjønning, 2011;Zink et al., 2010) which may result in compaction at greater depthsthan reported previously. Wet conditions in autumn, winter andspring in the Nordic countries aggravate the effect of heavymachinery and lead to serious subsoil quality degradation.Arvidsson et al. (2000) showed that the risk of subsoil compactionwith commonly used machinery in southern Sweden is 100% forspring slurry application and more than 60% after October in sugarbeet harvesting.
Compaction is a reduction in total porosity in a given soil mass.However, not all pores reduce proportionally. Various authors havereported a reduction due to compaction of primarily larger pores
* Corresponding author. Tel.: +45 8715 4756.
E-mail address: [email protected] (F.E. Berisso).
0167-1987/$ – see front matter � 2012 Elsevier B.V. All rights reserved.
doi:10.1016/j.still.2012.02.005
(Bullock et al., 1985; Dorner et al., 2010; Matthews et al., 2010;Richard et al., 2001; Schaffer et al., 2007). Such pores maycompletely disappear after repeated wheeling (Pagliai et al., 2003;Servadio et al., 2005; Startsev and McNabb, 2001). This preferentialloss of larger pores can potentially change many of the mostimportant soil ecological functions, such as transmission andstorage of water, and support of plant growth and microbialactivities (Ball, 1986).
Soil compaction reduces saturated hydraulic conductivity(Horn et al., 1995) and may thus trigger surface runoff and watererosion. It may also induce preferential flow in macropores (Kulliet al., 2003; Etana et al., In review), which has been shown tofacilitate colloid transport of otherwise immobile pollutants suchas phosphorus and pesticides to receiving water bodies (Jarvis,2007). Studies of the effect of compaction on unsaturated hydraulicconductivity have produced conflicting results. Richard et al.(2001) measured higher unsaturated hydraulic conductivity incompacted soil than in uncompacted. Zhang et al. (2006), on theother hand, did not observe any significant changes in unsaturatedhydraulic conductivity. Soil compaction reduces soil aeration(Czyz, 2004) and increases emissions of the greenhouse gas N2Othrough denitrification at anaerobic sites (Bakken et al., 1987;

F.E. Berisso et al. / Soil & Tillage Research 122 (2012) 42–51 43
Hansen et al., 1993; Simojoki et al., 1991). Poor root growth due todense and poorly aerated soil can reduce crop yield (Alakukku,1999; Hakansson and Reeder, 1994) and nutrient use efficiencyand hence induce leaching of soil nitrogen.
There are only limited experimental data on the persistency ofcompaction effects on functioning of soil pores. Most existingstudies have focused on the short-term compaction effect in thetopsoil and plough-pan layers. However, detrimental structuralchanges and associated adverse effects on transport propertiesmay be especially serious in the deeper subsoil, where regenera-tion through biological activity, wetting–drying and freeze–thawcycles occurs at a slower rate. Compaction of deeper layers isespecially problematic since it is invisible, cumulative andpersistent (Alakukku, 2000; Hakansson and Reeder, 1994; Hornet al., 1995; Voorhees, 2000).
The objective of this study was to examine whether subsoilcompaction induced by repeated traffic with �10 Mg wheel loadshad persisted 14 years after the compaction event. A further aimwas to quantify the compaction effect on the soil pore system andits gas transport properties.
2. Materials and methods
2.1. Soil
In 2009, we revisited a field soil compaction experimentestablished in 1995 at Brahmehem Farm (558490N, 138110E) nearKavlinge village, southern Sweden. The soil has developed onglacial till deposits and is classified as a Mollic Endogleyic Luvisolaccording to the FAO soil classification system (IUSS WorkingGroup WRB, 2006). The soil has a sandy clay loam texture, with aclay content ranging from 0.19 to 0.27 g g�1. The soil organicmatter content ranges from 0.003 to 0.024 g g�1. The sand contentranges from 0.45 to 0.54 g g�1. We observed high texturalvariability between experimental plots at 0.7 and 0.9 m depths(data not shown).
We fitted the Rosin–Rammler (1933) distribution function toour textural data in order to characterise the mass-size distributionof the soil:
PðX > xÞ ¼ 100e�ðx=aÞb
(1)
where P(X > x) is the percentage of particles by weight greater thanparticle size x, e is Euler’s number (base of natural logarithm), and aand b are adjustable parameters. The a parameter represents theparticle size corresponding to the 37.78th percentile of thecumulative probability distribution (Perfect et al., 1993). The greaterthe a value, the larger the soil fragment that dominates thedistribution and vice versa. The b value describes the spread ofthe particle size: the smaller the b value, the wider the spread of thefragment mass and vice versa.
For most combinations of plots and depths, the a and b valueswere in the range �73 to �128 and �0.3 to �0.48, respectively.However, there were two striking outliers, the soil samples from0.7 m depth (a = 218; b = 0.62) and 0.9 m depth (a = 330; b = 0.56)in a compacted plot, where the sand content dominated othertextural classes (data not shown). The combination of a and b forthese sampling spots indicates a relatively well-sorted, sandymaterial, and probably reflects local hydraulic conditions duringthe deposition of the glacial till material.
2.2. Compaction experiment
The original field experiment aimed to study the effect of trafficwith heavy sugar beet harvesters on soil physical properties andcrop yield (Arvidsson, 2001). The experiment had a randomised
block design with four replicate plots. A detailed description of theexperimental set-up can be found in Arvidsson (2001). In thepresent study, plots that were not wheeled during the experimentwere used as controls, while plots subjected to four repeatedwheelings (track-by-track to cover 100% of the area in the plots)with a 35 Mg sugar beet harvester in 1995 comprised thecompacted plots.
The plots were run as a field experiment until 1999 and thenreintegrated into the larger field, which had been managed accordingto local farming practices in a 7-year crop rotation (winter rape–winter wheat–sugar beet–spring wheat–winter wheat–sugar beet–spring barley). The tillage regime in the field includes mouldboardploughing (to �0.25 m depth), with occasional reduced tillage (toabout 0.1 m depth).
2.3. Vertical stress in the soil profile at the time of compaction
The sugar beet harvester used in 1995 was equipped with a0.8 m wide tyre inflated to 240 kPa and the wheel load was 10.4 Mg(Arvidsson, 2001). We estimated the vertical stresses in the soilprofile below such a tyre as follows. First we calculated the tyre–soil contact area and the stress distribution within the contact areausing the FRIDA model (Keller, 2005; Schjønning et al., 2008). Inputparameters for FRIDA were predicted from the tyre type, tyredimensions, wheel load, and actual and rated tyre inflationpressure (Table 13 in Schjønning et al., 2006). Finally, we useddata for stress distribution in the tyre–soil contact area as input,and calculated vertical stresses in the soil profile using the Sohnesummation procedure (Sohne, 1953) by setting a concentrationfactor (Frohlich, 1934) to 6 (for wet soil conditions; Sohne, 1953).
The calculated vertical stresses beneath the centre line of thesugar beet harvester wheel were 207, 160, 116 and 84 kPa at 0.3,0.5, 0.7 and 0.9 m depth, respectively. A range of studies inScandinavian soils at water contents close to field capacity haveshown that plastic strain (persistent compaction) of subsoil layersoften occurs if vertical stress exceeds approximately 50 kPa(Arvidsson et al., 2002; Keller et al., 2002; Keller and Arvidsson,2004). We noted from our calculations that the traffic event in1995 was likely to have induced vertical stresses higher than thisthreshold for all depths at which we calculated the verticalstresses. Our starting hypothesis in soil analysis was thus that wewould find compaction effects at these depths.
2.4. Sample collection
Sampling took place in May 2009, when the experimental fieldwas cropped with winter wheat. Prior to sampling, access pits ofapproximately 2 m by 2 m and 1.5 m deep were dug in each plotand horizontal planes were exposed in sequence for sampling at0.3, 0.5, 0.7 and 0.9 m depth. At each plot and sampling depth, weidentified three sub-areas of �0.5 m � 0.5 m each, locatedapproximately 1 m apart. From each sub-area we collected fourundisturbed soil cores and approximately 1 kg of bulk soil. Coredimensions (height [H] and diameter [D], m) were H = 0.05,D = 0.072 for two of the cores (�200 cm3; hereafter labelled coretype A), and H = 0.034, D = 0.061 for the two other (�100 cm3;hereafter labelled core type B).
A total of 384 core samples were taken (two treatments � fourblocks � four depths � three sub-areas � two replicate cores = 192of each core type). Both core types were collected by hammeringsharp-edged cylinders into the soil. The cylinders were then gentlyremoved from the bulk soil and roughly trimmed before lids werefitted at each end.
Before analyses, the cores were stored at 2 8C, while the bulksoil was air-dried at room temperature (25 8C). Type A soil coreswere used for determination of soil water retention, while air

F.E. Berisso et al. / Soil & Tillage Research 122 (2012) 42–5144
permeability and gas diffusivity were measured at selected matricpotentials on type B soil cores as described below. Bulk soil wasused for analysis of soil texture, total carbon content and particledensity.
2.5. Laboratory measurements and calculations
Soil texture was determined by a combination of wet sievingand hydrometer methods. Total carbon was determined using aFLASH 2000 organic elemental analyser coupled to a thermalconductivity detector (Thermo Fisher Scientific, MA, USA). Sub-samples from each combination of block (each block contained oneplot of each treatment) and depth were pooled for soil particledensity determination using a pycnometer.
In the laboratory, before the actual measurements, type A and Bsoil cores were treated identically. The cores were carefullytrimmed with a sharp-edged knife and the bottom ends fitted withnylon cloth and saturated step-wise with water from beneath.Type A soil cores were drained sequentially to �6, �10, �30, �50,�100, �500 and �1600 hPa matric potential on sand boxes andceramic plates to determine the water retention characteristics athigher (>�100 hPa) and lower (�500 hPa and �1600 hPa) matricpotentials, respectively. Finally, the samples were oven-dried at105 8C for 24 h. Samples were weighed at each matric potential andafter oven-drying to determine the water retention characteristics ofthe soil. The water retention at �1.5 MPa was determined ondisturbed (remoulded) soil samples in a pressure plate system.
The soil dry bulk density (BD) was calculated from the weight ofthe oven-dry soil and total soil volume. Total porosity wasdetermined from dry bulk density and particle density. Volumetricwater content at each matric potential was obtained fromgravimetric water content and bulk density. Air-filled porosity(ea) at a given matric potential was calculated as the differencebetween total porosity and volumetric water content.
Type B soil cores were sequentially drained to �6, �30 and�100 hPa matric potential on sand boxes. Air permeability (ka) wasmeasured at each matric potential by the steady state method asdescribed by Iversen et al. (2001), using a pressure head of 5 hPa.Prior to measurements, the soil at the extreme edge was gentlypressed to the edge of the metal ring to minimise leaking of airbetween the inner wall of the cylinder and the soil (Ball andSchjønning, 2002). A volumetric flow rate through the soil coreswas recorded at each matric potential and ka was calculated fromDarcy’s law.
Gas diffusion was measured at �100 hPa matric potential bythe non-steady state method suggested by Taylor (1949), usingequipment described by Schjønning (1985) and oxygen as thediffusing gas. In short, the soil cores were attached by an O-ring to adiffusion chamber that was flushed with oxygen-free nitrogen. Thediffusion through the soil core was followed by recording theoxygen concentration in the diffusion chamber every 2 min forapproximately 2 h. The diffusion coefficient, Ds, was calculatedaccording to Fick’s second law and converted to gas-independentdiffusivity by relating it to the diffusion of oxygen in air, Do
(0.205 cm2 s�1 at atmospheric pressure and 20 8C; SmithsonianPhysical Tables).
3. Model and statistics
3.1. Water retention characteristics and pore size distribution
We fitted the double-exponential equation proposed by Dexteret al. (2008) to our water retention data. The double-exponential(DE) model has five adjustable parameters, and can be written as:
u ¼ C þ A1eð�h=h1Þ þ A2eð�h=h2Þ (2)
where C is the asymptotic value of volumetric water content aspore water suction approaches infinity (i.e. the water content ash ! 1), A1 and h1 describe the first peak of pores, and A2 and h2
describe the second peak of pores. Dexter et al. (2008) related theA1 and h1 parameters to what they called textural porosity, whilethe pores described by A2 and h2 were interpreted as structuralpores. This model is convenient for soils displaying a dual porosityand the model parameters also have a physical meaning. In thisstudy, we regarded the sum of C and A1 as the pore volumedetermined primarily by soil texture, and we did not address thephysical meaning of the C parameter.
The parameters in the DE model were determined by fittingEq. (2) to measured water retention data by nonlinear regressionanalysis using the R software. The root mean square error (RMSE)and bias of prediction were calculated and used for evaluating thefit of predicted to measured data:
RMSE ¼
ffiffiffiffiffiffiffiffiffiffiffiffiffiffiffiffi1
n
Xn
i¼1
d2i
vuut (3a)
bias ¼ 1
n
Xn
1¼1
di (3b)
where di is the difference between predicted and measured valuesof water content, and n is the number of measurements. The poresize distribution predicted by the DE model was obtained bydifferentiating Eq. (2) with respect to matric potential as suggestedby Dexter et al. (2008).
3.2. Statistical analysis
At �6 and �30 hPa, some of the air permeability measurementswere below the detection limit of our equipment (0.3 ml s�1,which is equivalent to 0.15 mm2) and we obtained zero values.Zero values not only affect the means, but also bias the respectivestatistical analysis based on the means. Median values, observedper plot and depth, were used to handle this problem. Theapproach with median estimates per plot and depth was then usedfor all parameters.
Air-filled porosity, gas diffusivity and air permeability weretested for normality prior to statistical analysis using the Shapiro–Wilk test. Water retention and gas diffusivity values followed anormal distribution, while most air permeability values werefound to be positively skewed and not normally distributed. Forsubsequent analysis and to obtain a normal distribution, the airpermeability values were log-transformed. We also checked thenormality of residuals after fitting a statistical model (described inthe next paragraph) to our data in order to ensure that thenormality assumption of the model was satisfied.
The statistical analysis followed a completely randomised blockdesign. A linear mixed model with fixed treatment effects andnormally distributed block effects was fitted for each depth, usingthe MIXED procedure in SAS version 9.2 (Littell et al., 2006). TheKenward and Roger method was used for calculation of degrees offreedom in the statistical tests (Kenward and Roger, 1997). Toaccount for high textural variability at 0.7 and 0.9 m depth (seeSection 2), we made an analysis of covariance by including claycontent in the linear mixed model. The statistical analysis of the DEparameters followed the same procedure as for all other variablesin this study.
The overall effect of compaction on the whole subsoil layer(0.3–0.9 m depth) was analysed by a repeated measurementanalysis with plots as subjects. An autoregressive, AR(1), covari-ance structure was used to account for correlation betweensamples from the same plot at different depths.

F.E. Berisso et al. / Soil & Tillage Research 122 (2012) 42–51 45
4. Results and discussion
4.1. Effect of compaction on soil water retention and pore size
distribution
The compaction event 14 years prior to sampling significantlyreduced the volumetric water content at �6, �10, �30 and�50 hPa matric potential at all four depths studied except 0.3 m,where the differences were significant only at �6, �10 and�30 hPa (Fig. 1a–d). These results are in line with previousfindings, e.g. those of Startsev and McNabb (2001), who studiedthe effect of compaction by harvesting equipment on medium-textured soils. They collected soil from 14 sites across west-centralAlberta (USA) and reported a reduction in soil water retentionbetween saturation and �100 hPa matric potential in highlycompacted soil.
During curve-fitting to measured water retention data, wenoted that all the DE model parameters were significantly differentfrom zero at P < 0.001. This indicates that the model was not over-parameterised. We also noted that estimates for the modelparameters were in the range reported by Dexter et al. (2008).In almost all fits, the DE model was flexible enough to capture allpoints at the dryer and the wetter ends of the scale (Fig. 1a–d). Inaddition, bias was of a random nature (i.e. no systematic erroracross the matric potentials) and lay within the range �0.00004 to0.0006 m3 m�3 for all potentials.
(a)
Matric potential, h (- hPa)
100 10 1 10 2 10 3 10 4 10 5
Volu
met
ric
mois
ture
conte
nt(
m3
m-3
)
0.0
0.1
0.2
0.3
0.4
1
(c)
Matric potential, h (- hPa)
100 10 1 10 2 10 3 10 4 10 5
Volu
met
ric
mois
ture
conte
nt(
m3
m-3
)
0.0
0.1
0.2
0.3
0.4
1
RMSE =0.004
RMSE+=0.002
RMSE =0.002
RMSE+=0.001
Fig. 1. Measured volumetric moisture content for compacted (shaded circles) and co
compacted; dashed line, control) as a function of matric potential (h, �hPa) for soils sam
(RMSE) and compacted soil (RMSE+) were calculated for the whole range of matric potent
Averaged across the matric potentials in our study, we found aRMSE of 0.004 m3 m�3 for the DE model, while the full vanGenuchten (1980) equation, with five adjustable parameters,yielded a RMSE of 0.011 m3 m�3. This indicates that the waterretention characteristic (pore size distribution) of the soil at theexperimental site is better expressed with a bimodal model thanwith a unimodal model. The RMSE of the DE model for eachcombination of treatment and depth was calculated across allmatric potentials, and the values are shown in Fig. 1a–d. Thehighest (0.005 m3 m�3) and the lowest (0.001 m3 m�3) RMSE
values were obtained from the fit of the compacted soil at 0.5and 0.7 m depth, respectively. Generally, these values were alsolower than those obtained by fitting the van Genuchten (1980)equation (data not shown).
The bimodal nature of the pore system in the Brahmehem soil isalso illustrated in Fig. 2a–d. The curves in the diagrams correspondto pore size distribution, derived from water retention data asdescribed above (see Section 3). In general, we observed that thepeak corresponding to structural porosity (A2) in the Brahmehemsoil was smaller than the peak corresponding to textural porosity(A1).
Four repeated wheelings with the heavy sugar beet harvester(35 Mg) in 1995 reduced the peaks that correspond to structuraland textural pores at all four depths except the peak of texturalpores at 0.5 m depth (Table 1), and slightly shifted them to lowermatric potentials (shift of h1 and h2 from wetter to drier end;
(b)
Matric potential, h (- hPa)
00 10 1 10 2 10 3 10 4 10 5
Volu
met
ric
mois
ture
conte
nt(
m3
m-3
)
0.0
0.1
0.2
0.3
0.4
(d)
Matric potential, h (- hPa)
00 10 1 10 2 10 3 10 4 10 5
Volu
met
ric
mois
ture
conte
nt(
m3
m-3
)
0.0
0.1
0.2
0.3
0.4
RMSE =0.004
RMSE+=0.005
RMSE =0.003
RMSE+=0.003
ntrol (open circles) soils and fits of the double-exponential equation (solid line,
pled at (a) 0.3 m, (b) 0.5 m, (c) 0.7 m and (d) 0.9 m depth. The RMSE for control soil
ials for each treatment and depth. Significant differences are indicated by asterisks.

(a)
Matric potential, h (- hPa)
100 10 1 10 2 10 3 10 4 10 5 10 6
d/d
(log h
)
0.00
0.04
0.08
0.12
0.16
(b)
Matric potential, h (- hPa)
100 10 1 10 2 10 3 10 4 10 5 10 6
d/d
(log h
)
0.00
0.04
0.08
0.12
0.16
(c)
Matric potential, h (- hPa)
100 10 1 10 2 10 3 10 4 10 5 10 6
d/d
(log h
)
0.00
0.04
0.08
0.12
0.16
(d)
Matric potential, h (- hPa)
100 10 1 10 2 10 3 10 4 10 5 10 6
d/d
(log h
)
0.00
0.04
0.08
0.12
0.16
Fig. 2. Pore size distribution (du/d(log h)) as a function of matric potential at (a) 0.3, (b) 0.5, (c) 0.7 and (d) 0.9 m depth in the control (dashed lines) and compacted (solid lines)
soils. The pore size distribution equation, du/d(log h), was obtained by differentiating the double exponential equation (DE).
0.25
0.30
0.35
F.E. Berisso et al. / Soil & Tillage Research 122 (2012) 42–5146
Fig. 2a–d). However, the compaction effect was found to bestatistically significant only for the A2 parameter (Table 1). Thisindicates that the compaction treatment at the experimental sitereduced the soil structural porosity in particular.
The effect of compaction on the A2 parameter can also beassessed from the regression analysis of A2 and BD. As expected, anincrease in bulk density of the soil due to compaction resulted in adecrease in A2 (Fig. 3) and the relationship can be given by:
A2 ¼ 0:409ð�0:082Þ � 0:199ð�0:0488ÞBD;
R2 ¼ 0:35; P ¼ 0:0003 (4)
Table 1Estimates of parameters of the double-exponential model (Eq. (3)) and probability
values for tests of differences between treatments.
Depth
(m)
Treatment C
(m3 m�3)
A1
(m3 m�3)
A2
(m3 m�3)
h1 (m) h2 (m)
0.3 Control 0.136 0.156 0.067 57 0.64
Compacted 0.142 0.149 0.044 58 0.83
P-value 0.620 0.745 0.002 0.794 0.234
0.5 Control 0.153 0.131 0.084 29 0.46
Compacted 0.121 0.149 0.058 48 0.57
P-value 0.202 0.538 0.039 0.196 0.162
0.7 Control 0.147 0.137 0.083 30 0.56
Compacted 0.133 0.122 0.067 40 0.60
P-value 0.501 0.506 0.009 0.156 0.540
0.9 Control 0.108 0.153 0.082 47 0.69
Compacted 0.133 0.122 0.058 50 0.72
P-value 0.135 0.412 0.072 0.173 0.382
Here, and in the following equation, the figures in brackets indicatethe standard error.
From regression equation (4), we predicted the critical value ofBD at which the A2 parameter would reach zero, i.e. the BD at which
Bulk density (Mg m-3 )
1.55 1.60 1.65 1.70 1.75 1.80 1.85
A1+
C, A
2 (
m3
m-3
)
0.00
0.05
0.10
0.15
0.20
Fig. 3. Estimates for the DE model parameters (Dexter et al., 2008; Eq. (3)), A2 (open
circles) and A1 + C (shaded circles), as a function of bulk density.
F.E. Berisso et al. / Soil & Tillage Research 122 (2012) 42–51 47
all structural pores would be destroyed. Densities higher than thisvalue could only be attained through loss of textural porosity. Forthe Brahmehem soil, the critical BD was 2.055 (�0.27) Mg m�3. Thisvalue was higher than the critical BD values of 1.58 and 1.89 Mg m�3
reported by Dexter et al. (2008) for two soils with an average BD
of 1.39 Mg m�3 (Rogow soil; Dexter and Richard, 2009) and1.68 Mg m�3 (Babrowko soil; Dexter and Richard, 2009) respectively.
In Fig. 3, the A1 + C term, which we refer to here as ‘texturalporosity’, is also given as a function of bulk density, calculated as:
A1 þ C ¼ 0:524ð�0:096Þ � 0:144ð�0:059ÞBD;
R2 ¼ 0:13; P ¼ 0:022 (5)
Eq. (5) indicates a weak relationship between A1 + C and BD, asreflected by the low R2 value. However, the A1 + C term wassignificantly decreased (P = 0.022; Eq. (5)) with increased BD. Thisresult confirms findings by Coulon and Bruand (1989), whoreported a reduction in textural porosity in a sandy soil due tocompaction. However, we found that the effect of BD on A1 + C
(Eq. (5)) was smaller than its effect on A2 (Eq. (4)), suggesting thatBD (compaction) has a stronger effect on structural pores than ontextural pores.
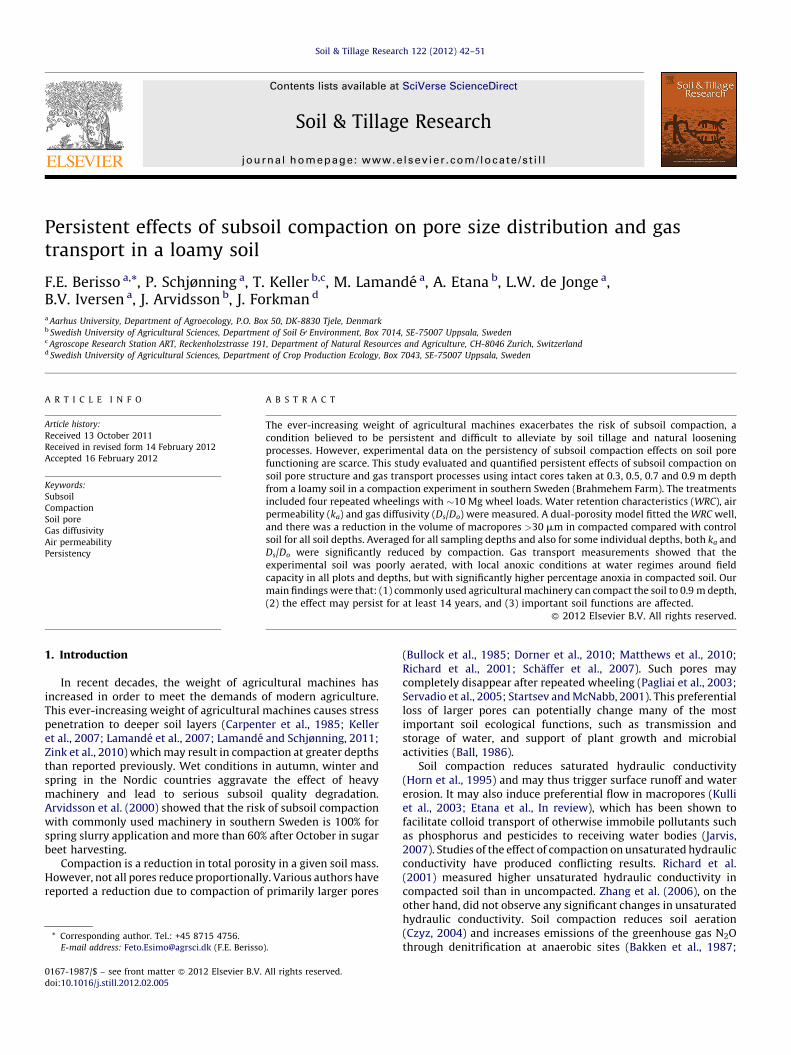
A comparison between the A2 parameter and the air-filledporosity at �100 hPa was also made. In the following, the air-filledporosity at �100 hPa is taken to represent the volume of pores>30 mm tube-equivalent diameter, in accordance with textbookson soil physics (e.g. Hillel, 1982). This comparison helps to relatethe A2 parameter to the classical categorisation of pore sizeaccording to subjectively defined fixed boundary values (e.g. poreslarger than 30 mm are often referred to as macropores). From thecomparison, we observed a positive linear relationship (R2 = 0.67)and a uniform scatter of points around a 1:1 line (Fig. 4). A similarcomparison (not shown) illustrated that the A2 parameter had alinear relationship with the volume of pores >6 mm. However, allthe points ended up further below the 1:1 line when the A2
parameter was plotted as a function of the volume of pores >6 mm.Kutılek et al. (2006) proposed a minimum equivalent radius of thestructural pore domain in the range 19–35 mm for sandy clay loam
A2 (m3
m-3 )
0.00 0.02 0.04 0.06 0.08 0.10 0.12
Po
res
> 3
0m
(m
3m
-3)
0.00
0.02
0.04
0.06
0.08
0.10
0.12
Fig. 4. Volume of pores >30 mm tube-equivalent diameter as a function of the A2
parameter of the double-exponential equation (Dexter et al., 2008; Eq. (3)) at all
depths (0.3–0.9 m) in control (open circles) and compacted (shaded circles) soils.
soil under different levels of uniaxial load. Our modelled dataconfirmed the validity of this proposal.
4.2. Total porosity and functioning of soil pores at �100 hPa matric
potential
The four repeated wheelings in 1995 reduced the total porosityat all four soil depths studied (Fig. 5a). This reduction wasstatistically significant at P < 0.1, except at 0.5 m depth. Thereduction in total porosity observed here confirms the increase inbulk density reported by Arvidsson (2001) in the same experiment3–5 years after the compaction event. Hence, there has been noincrease in total porosity of the compacted soil during the past 10years, indicating the persistency of subsoil compaction. Similarresults were reported by Alakukku (1996) for a clay and an organicsoil over the three successive years following experimental trafficin Finland. In another study, Ishaq et al. (2003) reported aconsiderable reduction in total porosity below 0.15 m depth fouryears after a compaction event on a sandy clay loam soil in atropical region of Pakistan.
The air-filled porosity values, ea, measured at �100 hPa weresignificantly lower in the compacted treatment than in the controltreatment at 0.3 m depth, and the same trend was found for theother depths studied (Fig. 5b). Our observed reductions in volumeof ea at �100 hPa (0.031, 0.020, 0.032 and 0.027 m3 m�3,respectively at 0.3, 0.5, 0.7 and 0.9 m depth) are similar to findingsby Alakukku (1996), who reported 0.03 and 0.02 m3 m�3 reduc-tions at 0.3–0.4 and 0.4–0.5 m depth, respectively, in a clay soil.However, that study found no reduction in total porosity at 0.5–0.6 m depth, possibly due to the smaller wheel load of 4.5 Mg usedin that study, compared with 10.4 Mg in the present study.
For most combinations of depth and experimental treatment,the ea values were below 10% (0.1 m3 m�3), the value suggested tobe the critical lower limit for plant growth (Grable and Siemer,1968). The low ea values in both control and compacted soilsindicate that the soil at the site was generally dense prior to thestart of the compaction experiment.
Diffusion is the main process taking gases to and from respiringroots and microbes in the soil profile. Stepniewski (1981)combined measurements of gas diffusion with literature reportsof lower thresholds of air-filled pore space for satisfactory plantgrowth and identified a critical Ds/Do band between 0.005 and 0.02,based on a range of soils. Schjønning et al. (2003) confirmed this foraerobic microbial activity and found the lower threshold to be validfor loamy soils, while sandy soils seemed to demand a higher Ds/Do.It can be seen from Fig. 5c that even the control soil at ourexperimental site exhibited diffusivity values close to or below theDs/Do threshold of 0.005. The compaction treatment decreased thediffusivity further for all four depths studied (Fig. 5c; statisticallysignificant at 0.3 m depth). A matric potential of �100 hPa isconsidered field capacity (e.g. Al Majou et al., 2008; Schjønning andRasmussen, 2000). Our results thus indicate that the compactedsoil at the experimental site is likely to experience critically lowoxygen concentrations in the soil profile, at least at water contentshigher than field capacity.
The changes in gas concentrations in the soil profile withgradients in soil respiration and with changes in soil water contentare dynamic and complex (e.g. Sierra and Renault, 1998;Bartholomeus et al., 2008). The diffusivity thresholds discussedabove are dependent on the oxygen consumption, which is likely tobe lower for subsoil layers than for topsoil. We applied a simplesteady-state model for calculation of oxygen concentration in thesoil profile based on soil respiration and the soil oxygen diffusioncoefficient (Glinski and Stepniewski, 1985; Schjønning, 1989).Because we had no knowledge of the respiration rates for theexperimental soil, we used data from Schjønning et al. (2003)

Total porosity (m3m-3 )
0.00 0.10 0.20 0.30 0.40
Soil
dep
th (
m)
0.3
0.5
0.7
0.9
0.0
Air filled pore space (m3m-3 )
0.00 0.04 0.08 0.12 0.16
Soil
dep
th (
m)
0.3
0.5
0.7
0.9
0.0
Relative diffusivity (-)
0.000 0.005 0.010 0.015 0.020
Soil
dep
th (
m)
0.3
0.5
0.7
0.9
0.0
log (Permeability, ( m2
))
0.0 0.4 0.8 1.2
Soil
dep
th (
m)
0.3
0.5
0.7
0.9
0.0
P=0.011
P=0.547
P=0.099
P=0.054
P=0.004
P=0.398
P=0.182
P=0.112
P=0.029
P=0.188
P=0.172
P=0.131
P=0.007
P=0.180
P=0.188
P=0.031
(a) (b)
(c) (d)
Fig. 5. (a) Total porosity, (b) air-filled pore space, (c) relative diffusivity and (d) air permeability measured at �100 hPa for compacted (shaded circles) and control treatments
(open circles). The values shown are least squares means of medians observed in four replicate blocks. P-values show the results of the linear mixed model tests on the
differences between control and compacted treatments.
F.E. Berisso et al. / Soil & Tillage Research 122 (2012) 42–5148
(topsoil) and Sierra and Renault (1998) (subsoil layers), while weused the oxygen diffusion coefficients obtained in this study. Thesesimulations indicated a decline in oxygen concentration from theatmospheric 0.209 m3 m�3 to �0.11 m3 m�3 at 1 m depth for thecontrol soil and �0.04 m3 m�3 at 1 m depth for the compacted soil(calculations and data not shown). Although recent research showsthat many factors affect root oxygen stress (Bartholomeus et al.,2008), our simulations indicate that the compaction-inducedreduction in the volume of air-filled macropores and gas diffusionmost probably had an important influence on aeration of the soilprofile at our experimental site. Compaction-induced effects on theoxygen concentration in a soil profile have been reportedpreviously (e.g. McAfee et al., 1989).
The compaction event 14 years prior to soil sampling reducedair permeability, ka, at �100 hPa matric potential at all four soildepths studied, although the trend was only statistically signifi-cant at 0.3 and 0.9 m depths (Fig. 5d). While the differencesbetween treatments were not significant at 0.5 and 0.7 m depth,the estimated values of ka were reduced by 25 and 30%,respectively. Fish and Koppi (1994) classified soil into fivepermeability classes based on field ka measurements and a scorefrom the visual assessment of soil morphological properties relatedto ka (e.g. abundance of biopores). According to this classification,all four depths of soil from our experimental site can be groupedinto the low permeability class (ka � 20 mm2). These low values ofka could reflect the nature of this soil, while our results indicatethat high mechanical stresses aggravated the problem.
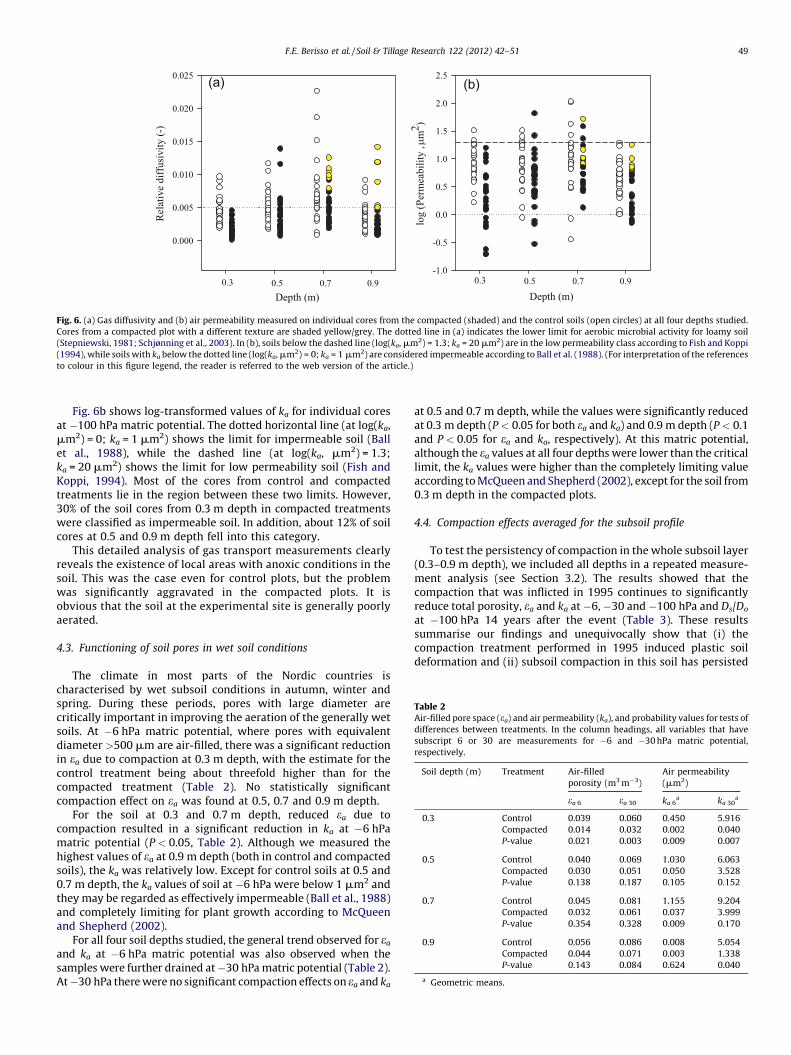
The individual soil cores collected at the experimental site canbe regarded as representative volumes of local soil in the soilprofile. Hence the distribution of Ds/Do and ka values for controland compacted soil adds an extra dimension to the estimatespresented in Fig. 5c and d. Fig. 6a shows Ds/Do measured onindividual cores at �100 hPa matric potential. The dottedhorizontal line (at Ds/Do = 0.005) indicates the lower limit foraerobic microbial activity in loamy soil (Schjønning et al., 2003;Stepniewski, 1981). For our control soils, Ds/Do exceeded thecritical value in 29, 46, 71 and 22% of cores taken at 0.3, 0.5, 0.7 and0.9 m depth, respectively. The corresponding values for compactedsoil were 0, 25, 58 and 25% of cores, i.e. the Ds/Do value was lowerthan this critical value for all compacted cores at 0.3 m depth.These results suggest that at field capacity, soil from 0.5 and 0.7 mdepth in control plots would be able to maintain the minimum gasdiffusion requirement for adequate soil aeration. However, most ofthe soil from 0.3, 0.5 and 0.9 m depth in compacted plots and 0.3and 0.9 m depth in control plots would need to be drained furtherto attain this minimum gas diffusion value for aerobic microbialactivity.
From Fig. 6a, it can also be seen that the Ds/Do values for thecores collected in the sorted, sandy soil of the plots with deviatingtexture (yellow/grey symbols) were generally higher than theother observations. At 0.7 and 0.9 m depth, when the values fromthe compacted plot with a different texture were ignored, thepercentage of cores with Ds/Do higher than the critical valuedecreased to 33 and 0%, respectively.
Depth (m)
Rel
ativ
e dif
fusi
vit
y (
-)
0.000
0.005
0.010
0.015
0.020
0.025
0.3 0.5 0.7 0.9
(a)
Depth (m)
log (
Per
mea
bil
ity ,
m2
)
-1.0
-0.5
0.0
0.5
1.0
1.5
2.0
2.5(b)
0.3 0.5 0.7 0.9
Fig. 6. (a) Gas diffusivity and (b) air permeability measured on individual cores from the compacted (shaded) and the control soils (open circles) at all four depths studied.
Cores from a compacted plot with a different texture are shaded yellow/grey. The dotted line in (a) indicates the lower limit for aerobic microbial activity for loamy soil
(Stepniewski, 1981; Schjønning et al., 2003). In (b), soils below the dashed line (log(ka, mm2) = 1.3; ka = 20 mm2) are in the low permeability class according to Fish and Koppi
(1994), while soils with ka below the dotted line (log(ka, mm2) = 0; ka = 1 mm2) are considered impermeable according to Ball et al. (1988). (For interpretation of the references
to colour in this figure legend, the reader is referred to the web version of the article.)
Table 2Air-filled pore space (ea) and air permeability (ka), and probability values for tests of
differences between treatments. In the column headings, all variables that have
subscript 6 or 30 are measurements for �6 and �30 hPa matric potential,
respectively.
Soil depth (m) Treatment Air-filled
porosity (m3 m�3)
Air permeability
(mm2)
ea 6 ea 30 ka 6a ka 30
a
0.3 Control 0.039 0.060 0.450 5.916
Compacted 0.014 0.032 0.002 0.040
P-value 0.021 0.003 0.009 0.007
0.5 Control 0.040 0.069 1.030 6.063
Compacted 0.030 0.051 0.050 3.528
P-value 0.138 0.187 0.105 0.152
0.7 Control 0.045 0.081 1.155 9.204
Compacted 0.032 0.061 0.037 3.999
P-value 0.354 0.328 0.009 0.170
0.9 Control 0.056 0.086 0.008 5.054
Compacted 0.044 0.071 0.003 1.338
P-value 0.143 0.084 0.624 0.040
a Geometric means.
F.E. Berisso et al. / Soil & Tillage Research 122 (2012) 42–51 49
Fig. 6b shows log-transformed values of ka for individual coresat �100 hPa matric potential. The dotted horizontal line (at log(ka,mm2) = 0; ka = 1 mm2) shows the limit for impermeable soil (Ballet al., 1988), while the dashed line (at log(ka, mm2) = 1.3;ka = 20 mm2) shows the limit for low permeability soil (Fish andKoppi, 1994). Most of the cores from control and compactedtreatments lie in the region between these two limits. However,30% of the soil cores from 0.3 m depth in compacted treatmentswere classified as impermeable soil. In addition, about 12% of soilcores at 0.5 and 0.9 m depth fell into this category.
This detailed analysis of gas transport measurements clearlyreveals the existence of local areas with anoxic conditions in thesoil. This was the case even for control plots, but the problemwas significantly aggravated in the compacted plots. It isobvious that the soil at the experimental site is generally poorlyaerated.
4.3. Functioning of soil pores in wet soil conditions
The climate in most parts of the Nordic countries ischaracterised by wet subsoil conditions in autumn, winter andspring. During these periods, pores with large diameter arecritically important in improving the aeration of the generally wetsoils. At �6 hPa matric potential, where pores with equivalentdiameter >500 mm are air-filled, there was a significant reductionin ea due to compaction at 0.3 m depth, with the estimate for thecontrol treatment being about threefold higher than for thecompacted treatment (Table 2). No statistically significantcompaction effect on ea was found at 0.5, 0.7 and 0.9 m depth.
For the soil at 0.3 and 0.7 m depth, reduced ea due tocompaction resulted in a significant reduction in ka at �6 hPamatric potential (P < 0.05, Table 2). Although we measured thehighest values of ea at 0.9 m depth (both in control and compactedsoils), the ka was relatively low. Except for control soils at 0.5 and0.7 m depth, the ka values of soil at �6 hPa were below 1 mm2 andthey may be regarded as effectively impermeable (Ball et al., 1988)and completely limiting for plant growth according to McQueenand Shepherd (2002).
For all four soil depths studied, the general trend observed for ea
and ka at �6 hPa matric potential was also observed when thesamples were further drained at �30 hPa matric potential (Table 2).At �30 hPa there were no significant compaction effects on ea and ka
at 0.5 and 0.7 m depth, while the values were significantly reducedat 0.3 m depth (P < 0.05 for both ea and ka) and 0.9 m depth (P < 0.1and P < 0.05 for ea and ka, respectively). At this matric potential,although the ea values at all four depths were lower than the criticallimit, the ka values were higher than the completely limiting valueaccording to McQueen and Shepherd (2002), except for the soil from0.3 m depth in the compacted plots.
4.4. Compaction effects averaged for the subsoil profile
To test the persistency of compaction in the whole subsoil layer(0.3–0.9 m depth), we included all depths in a repeated measure-ment analysis (see Section 3.2). The results showed that thecompaction that was inflicted in 1995 continues to significantlyreduce total porosity, ea and ka at �6, �30 and �100 hPa and Ds/Do
at �100 hPa 14 years after the event (Table 3). These resultssummarise our findings and unequivocally show that (i) thecompaction treatment performed in 1995 induced plastic soildeformation and (ii) subsoil compaction in this soil has persisted

Table 3Soil total porosity (utot), air-filled pore space (ea), relative diffusivity (Ds/Do) and air permeability (ka) for pooled data of all depths and the probability values for tests of
differences between treatments. In the column headings, all variables that have subscript 6 or 30 are measurements for �6 and �30 hPa matric potential, respectively.
Treatment Porosity and air-filled pore space (m3 m�3) Relative diffusivity (�) Air permeability (mm2)
utot ea 6 ea 30 ea 100 Ds/Do 100 ka 6a ka 30
a ka 100a
Control 0.3827 0.045 0.074 0.101 0.005 0.273 6.799 7.961
Compacted 0.3571 0.030 0.054 0.077 0.003 0.011 2.92 3.621
P-value 0.033 0.017 0.011 0.020 0.059 0.008 0.001 0.006
a Geometric means.
F.E. Berisso et al. / Soil & Tillage Research 122 (2012) 42–5150
for 14 years. Previous reports on persistent subsoil compaction inthe humid Nordic countries exist, but have focused on bulk densityand penetration resistance alone. For instance in Denmark,Schjønning and Rasmussen (1994) found significantly higherpenetration resistance in the compacted subsoil of a coarse sandyand a loamy soil five to six years after traffic with 5 Mg wheel loads.In a clay soil in Finland, Alakukku (1996) found persistent effects ofcompaction on total porosity/bulk density for nine years. Onexamining nine different field experiments in Sweden on soils withclay contents ranging from 6 to 85%, Etana and Hakansson (1994)observed persistence of subsoil compaction in terms of bulkdensity and penetration resistance by comparing results recordedone year and 11 years after experimental traffic.
5. Conclusions and perspectives
The upper 0.9 m of the agricultural soil studied here wasmechanically compacted by traffic with heavy machinery and thateffect had persisted for at least 14 years, with negative effects onsoil porosity and gas transport properties. The conditions foraeration of the soil profile were reduced to levels consideredcritical to aerobic microbial activity. This may promote increasedproduction and potential emissions of greenhouse gases such asN2O. The low permeabilities recorded in the compacted soil mayincrease the risk of preferential convective flow of water inperiods with high precipitation. This may affect even deeperlayers of the vadose zone and carry contaminants to receivingwater bodies.
The mechanisms responsible for the natural amelioration of soilcompaction are nearly absent in subsoil layers. There is reason tobelieve that the compaction effects documented here will persistfor decades or even longer. This demonstrates the urgent need toavoid subsoil compaction. It is generally accepted that the level ofvertical stress in deep soil layers is determined primarily by thewheel load. Therefore, to avoid subsoil compaction, wheel loadsneed to be reduced.
Acknowledgements
The technical assistance of B.B. Christensen, M. Koppelgaard,J.M. Nielsen, S.T. Rasmussen and C. Ohman is highly acknowl-edged. We thank A. Westlin, L. Evasdotter, E. Petersson and L.Borjesson for the assistance during field experimentation andsample collection. We also would like to thank G. Persson forallowing us to use his field for the experiment and Dr. SørenHøjsgaard and Dr. Ulrich Halekoh for their support in the use of theR software for statistics. This work is part of a Scandinaviancooperation on the effects of subsoil compaction on soil functions(www.poseidon-nordic.dk). The study reported here was fundedby the Danish Ministry of Food, Agriculture and Fisheries and theSwedish Research Council for Environment, Agricultural Sciencesand Spatial Planning (Formas) via the Nordic Joint Committee forAgricultural Research (NKJ). The PhD School SAFE at the Faculty ofAgricultural Sciences, Aarhus University, supported the PhD studyof the first author.
References
Al Majou, H., Bruand, A., Duval, O., 2008. The use of in situ volumetric water contentat field capacity to improve prediction of soil water retention properties. Can. J.Soil Sci. 88, 533–541.
Alakukku, L., 1996. Persistence of soil compaction due to high axle load traffic. 1.Short-term effects on the properties of clay and organic soils. Soil Till. Res. 37,211–222.
Alakukku, L., 1999. Subsoil compaction due to wheel traffic. Agric. Food Sci. Finland8, 333–351.
Alakukku, L., 2000. Response of annual crops to subsoil compaction in a fieldexperiment on clay soil lasting 17 years. In: Horn, R., van den Akker, J.J.H.,Arvidsson, J. (Eds.), Subsoil Compaction: Distribution, Processes andConsequences. Advances in Geoecology, vol. 32. pp. 205–208.
Arvidsson, J., 2001. Subsoil compaction caused by heavy sugar beet harvesters insouthern Sweden—I. Soil physical properties and crop yield in six field experi-ments. Soil Till. Res. 60, 67–78.
Arvidsson, J., Trautner, A., van den Akker, J., 2000. Subsoil compaction—risk assess-ment and economic consequences. In: Horn, R., van den Akker, J.J.H.,Arvidsson,J. (Eds.), Subsoil Compaction: Preface. Advances in Geoecology, vol. 32.pp. 3–12.
Arvidsson, J., Trautner, A., Keller, T., 2002. Influence of tyre inflation pressure onstress and displacement in the subsoil. Sustain. Land Manag.—Environ. Protect.35, 331–338.
Ball, B.C., 1986. Tools and techniques for strategic management—Mcnamee,Pb. Eur.J. Oper. Res. 26, 413.
Ball, B.C., O’Sullivan, M.F., Hunter, R., 1988. Gas diffusion, fluid flow and derived porecontinuity indices in relation to vehicle traffic and tillage. J. Soil Sci. 39, 327–339.
Ball, B.C., Schjønning, P., 2002. Air permeability. In: Dane, J.H., Topp, G.C. (Eds.),Methods of Soil Analysis: Part 1. Agronomy Monograph. 3rd ed. ASA and SSSA,Madison, pp. 1141–1158.
Bakken, L.R., B.Ø.Srresen, T., NjØ.Ss, A., 1987. Effect of soil compaction by tractortraffic on soil structure, denitrification, and yield of wheat (Triticum aestivum L.).J. Soil Sci. 38, 541–552.
Bartholomeus, R.P., Witte, J.P.M., van Bodegom, P.M., van Dam, J.C., Aerts, R., 2008.Critical soil conditions for oxygen stress to plant roots: substituting the Feddes-function by a process-based model. J. Hydrol. 360 (1–4), 147–165.
Bullock, P., Newman, A.C.D., Thomasson, A.J., 1985. Porosity aspects of the regener-ation of soil structure after compaction. Soil Till. Res. 5 (4), 325–341.
Carpenter, T.G., Fausey, N.R., Reeder, R.C., 1985. Theoretical effect of wheel loads onsubsoil stresses. Soil Till. Res. 6, 179–192.
Coulon, E., Bruand, A., 1989. Effects of compaction on the pore space geometry insandy soils. Soil Till. Res. 15, 137–151.
Czyz, E.A., 2004. Effects of traffic on soil aeration, bulk density and growth of springbarley. Soil Till. Res. 79, 153–166.
Dexter, A.R., Czyz, E.A., Richard, G., Reszkowska, A., 2008. A user-friendly waterretention function that takes account of the textural and structural pore spacesin soil. Geoderma 143, 243–253.
Dexter, A.R., Richard, G., 2009. The saturated hydraulic conductivity of soils with n-modal pore size distributions. Geoderma 154 (1–2), 76–85.
Dorner, J., Sandoval, P., Dec, D., 2010. The role of soil structure on the porefunctionality of an Ultisol. J. Soil Sci. Plant Nutr. 10 (4), 495–508.
Etana, A., Hakansson, I., 1994. Swedish experiments on the persistence of subsoilcompaction caused by vehicles with high axle load. Soil Till. Res. 29,167–172.
Etana, A., Keller, T., Larsbo, M., Arvidsson, J., Schjønning, P., Forkman, J., Jarvis, N.Persistent subsoil compaction and its effects on preferential flow patterns in asandy clay loam. Geoderma, In review.
Fish, A.N., Koppi, A.J., 1994. The use of a simple field air permeameter as a rapidindicator of functional soil pore space. Geoderma 63, 255–264.
Frohlich, O.K., 1934. Pressure Distribution in Foundation Soils. Springer-Verlag,Wien (in German).
Grable, A.R., Siemer, E.G., 1968. Effects of bulk density, aggregate size, and soil watersuction on oxygen diffusion, redox potentials, and elongation of corn roots. SoilSci. Soc. Am. J. 32, 180–186.
Glinski, J., Stepniewski, W., 1985. Soil Aeration and its Role for Plants. CRC Press,Boca Raton, FL, 229 pp.
Hakansson, I., Reeder, R.C., 1994. Subsoil compaction by vehicles with high axle loadextent. Persistence and crop response. Soil Till. Res. 29, 277–304.
Hansen, S., Mæhlum, J.E., Bakken, L.R., 1993. N2O and CH4 fluxes in soil influenced byfertilization and tractor traffic. Soil Biol. Biochem. 25, 621–630.

F.E. Berisso et al. / Soil & Tillage Research 122 (2012) 42–51 51
Hillel, D., 1982. Introduction to Soil Physics. Academic Press, p. 137.Horn, R., Domzzal, H., Slowinska-Jurkiewicz, A., van Ouwerkerk, C., 1995. Soil
compaction processes and their effects on the structure of arable soils andthe environment. Soil Till. Res. 35, 23–36.
Ishaq, M., Ibrahim, M., Lal, R., 2003. Persistence of subsoil compaction effectson soil properties and growth of wheat and cotton in Pakistan. Exp. Agric.39, 341.
IUSS Working Group WRB, 2006. World reference base for soil resources—a frame-work for international classification, correlation and communication. WorldSoil Resources Reports 103. International Union of Soil Sciences, ISRIC—WorldSoil Information and Food and Agriculture Organization of the United Nations,Rome.
Iversen, B.V., Moldrup, P., Schjønning, P., Loll, P., 2001. Air and water permeability indifferently textured soils at two measurement scales. Soil Sci. 166, 643–659.
Jarvis, N.J., 2007. A review of non-equilibrium water flow and solute transport in soilmacropores: principles, controlling factors and consequences for water quality.Eur. J. Soil Sci. 58, 523–546.
Keller, T., 2005. A model for the prediction of the contact area and the distribution ofvertical stress below agricultural tyres from readily available tyre parameters.Biosyst. Eng. 92, 85–96.
Keller, T., Arvidsson, J., 2004. Technical solutions to reduce the risk of subsoilcompaction: effects of dual wheels, tandem wheels and tyre inflation pressureon stress propagation in soil. Soil Till. Res. 79, 191–205.
Keller, T., Trautner, A., Arvidsson, J., 2002. Stress distribution and soil displacementunder a rubber-tracked and a wheeled tractor during ploughing, both on-landand within furrows. Soil Till. Res. 68, 39–47.
Keller, T., Defossez, P., Weisskopf, P., Arvidsson, J., Richard, G., 2007. SoilFlex: amodel for prediction of soil stresses and soil compaction due to agricultural fieldtraffic including a synthesis of analytical approaches. Soil Till. Res. 93, 391–411.
Kenward, M.G., Roger, J.H., 1997. Small sample inference for fixed effects fromrestricted maximum likelihood. Biometrics 53, 983–997.
Kulli, B., Gysi, M., Fluhler, H., 2003. Visualizing soil compaction based on flowpattern analysis. Soil Till. Res. 70, 29–40.
Kutılek, M., Jendele, L., Panayiotopoulos, K.P., 2006. The influence of uniaxialcompression upon pore size distribution in bi-modal soils. Soil Till. Res. 86,27–37.
Lamande, M., Schjønning, P., Togersen, F.A., 2007. Mechanical behaviour of anundisturbed soil subjected to loadings: effects of load and contact area. SoilTill. Res. 97, 91–106.
Lamande, M., Schjønning, P., 2011. Transmission of vertical stress in a real soilprofile. Part II: effect of tyre size, inflation pressure and wheel load. Soil Till. Res.14, 71–77.
Littell, R.C., Milliken, G.A., Stroup, W.W., Wolfinger, R.D., Shabenberger, O., 2006.SAS for Mixed Models, 2nd ed. SAS Institute Inc., Cary.
Matthews, G.P., Laudone, G.M., Gregory, A.S., Bird, N.R.A., Matthews, A.G.D., Whal-ley, W.R., 2010. Measurement and simulation of the effect of compaction on thepore structure and saturated hydraulic conductivity of grassland and arable soil.Water Resour. Res. 46 .
McAfee, M., Lindstrom, J., Johansson, W., 1989. Effects of pre-sowing compaction onsoil physical properties, soil atmosphere and growth of oats on a clay soil. J. SoilSci. 40, 707–717.
McQueen, D.J., Shepherd, T.G., 2002. Physical changes and compaction sensitivity ofa fine-textured, poorly drained soil (Typic Endoaquept) under varying durationsof cropping, Manawatu Region, New Zealand. Soil Till. Res. 63, 93–107.
Pagliai, M., Marsili, A., Servadio, P., Vignozzi, N., Pellegrini, S., 2003. Changes in somephysical properties of a clay soil in Central Italy following the passage of rubbertracked and wheeled tractors of medium power. Soil Till. Res. 73, 119–129.
Perfect, E., Kay, B.D., Ferguson, J.A., da Silva, A.P., Denholm, K.A., 1993. Comparison offunctions for characterizing the dry aggregate size distribution of tilled soil. SoilTill. Res. 28, 123–139.
Richard, G., Cousin, I., Sillon, J.F., Bruand, A., Guerif, J., 2001. Effect of compaction onthe porosity of a silty soil: influence on unsaturated hydraulic propertiesEuropean. J. Soil Sci. 52, 49–58.
Rosin, P., Rammler, E., 1933. Laws governing the finess of powdered cola. Inst. Fuel 7,29–36.
Schaffer, B., Stauber, M., Muller, R., Schulin, R., 2007. Changes in the macro-porestructure of restored soil caused by compaction beneath heavy agriculturalmachinery: a morphometric study. Eur. J. Soil Sci. 58 (5), 1062–1073.
Schjønning, P., 1985. A laboratory method for determination on of gas diffusion insoil. (In Danish with English summary.) Rep. S1773. Danish Inst. of Plant andSoil Sci., Tjele.
Schjønning, P., 1989. Long-term reduced cultivation. 2. Soil pore characteristics asshown by gas diffusivity and permeability and air-filled porosities. Soil Till. Res.15 (1–2), 91–103.
Schjønning, P., Rasmussen, K.J., 1994. Danish experiments on subsoil compaction byvehicles with high axle load. Soil Till. Res. 29, 215–227.
Schjønning, P., Lamande, M., Tøgersen, F.A., Pedersen, J., Hansen, P.O.M., 2006.Minimering af jordpakning.Størrelse og fordeling af stress i trædefladen mellemhjul og jord. DJF-Rapport Markbrug 127, Danmarks Jordbrugs-Forskning, Tjele.http://web.agrsci.dk/djfpublikation/djfpdf/djfma127.pdf (in Danish, with En-glish summary).
Schjønning, P., Lamande, M., Togersen, F.A., Arvidsson, J., Keller, T., 2008. Modellingeffects of tyre inflation pressure on the stress distribution near the soil–tyreinterface. Biosyst. Eng. 99, 119–133.
Schjønning, P., Rasmussen, K.J., 2000. Soil strength and soil pore characteristics fordirect drilled and ploughed soils. Soil Till. Res. 57, 69–82.
Schjønning, P., Thomsen, I.K., Moldrup, P., Christensen, B.T., 2003. Linking soilmicrobial activity to water- and air-phase contents and diffusivities. Soil Sci.Soc. Am. J. 67, 156–165.
Servadio, P., Marsili, A., Vignozzi, N., Pellegrini, S., Pagliai, M., 2005. Effects on somesoil qualities in central Italy following the passage of four wheel drive tractorfitted with single and dual tires. Soil Till. Res. 84 (1), 87–100.
Sierra, J., Renault, P., 1998. Temporal pattern of oxygen concentration in a hydro-morphic soil. Soil Sci. Soc. Am. J. 62 (5), 1398–1405.
Simojoki, A., Jaakkola, A., Alakukku, L., 1991. Effect of compaction on soil air in a potexperiment and in the field. Soil Till. Res. 19, 175–186.
Sohne, W., 1953. Pressure distribution in the soil and soil deformation under tractortyres. Grundlagender Landtechnik 5, 49–63 (in German).
Startsev, A.D., McNabb, D.H., 2001. Skidder traffic effects on water retention, pore-size distribution, and van Genuchten parameters of boreal forest soils. Soil Sci.Soc. Am. J. 65, 224–231.
Stepniewski, W., 1981. Oxygen diffusion and strength as related to soil compaction.II. Oxygen diffusion coefficient. Pol. J. Soil Sci. 14, 3–13.
Taylor, S.A., 1949. Oxygen diffusion as a measure of soil aeration. Soil Sci. Soc. Am.Proc. 44, 55–60.
van Genuchten, M.T., 1980. A closed-form equation for predicting the hydraulicconductivity of unsaturated soils. Soil Sci. Soc. Am. J. 44, 892–898.
Voorhees, W.B., 2000. Long-term effect of subsoil compaction on yield of maize. In:Horn, R.,van den Akker, J.J.H.,Arvidsson, J. (Eds.),Subsoil Compaction: Distribution,Processes and Consequences. Advances in Geoecology, vol. 32. pp. 331–338.
Zink, A., Fleige, H., Horn, R., 2010. Load risks of subsoil compaction and depths ofstress propagation in arable luvisols. Soil Sci. Soc. Am. J. 74, 1733–1742.
Zhang, S.L., Grip, H., Lovdahl, L., 2006. Effect of soil compaction on hydraulicproperties of two loess soils in China. Soil Till. Res. 90 (1–2), 117–125.


