Permission to Reproduce
Materials may be reproduced for personal, educational and/or non-profit activities, in part or in whole and by any means, without charge or further permission from the National Energy Board, the British Columbia Oil and Gas Commission, the Alberta Energy Regulator, or the British Columbia Ministry of Natural Gas Development, provided that due diligence is exercised in ensuring the accuracy of the information reproduced; that the National Energy Board, the British Columbia Oil and Gas Commission, the Alberta Energy Regulator, and the British Columbia Ministry of Natural Gas Development are identified as the source institutions; and that the reproduction is not represented as an official version of the information reproduced, nor as having been made in affiliation with or with the endorsement of the National Energy Board, the British Columbia Oil and Gas Commission, the Alberta Energy Regulator, or the British Columbia Ministry of Natural Gas Development. For permission to reproduce the information in this publication for commercial redistribution, please e-mail the National Energy Board at [email protected], the British Columbia Oil and Gas Commission at [email protected] the Alberta Energy Regulator at [email protected], or the British Columbia Ministry of Natural Gas Development at [email protected]. Autorisation de reproduction
Le contenu de cette publication peut être reproduit à des fins personnelles, éducatives et/ou sans but lucratif, en tout ou en partie et par quelque moyen que ce soit, sans frais et sans autre permission de l’Office national de l’énergie, de la British Columbia Oil and Gas Commission, de l’Alberta Energy Regulator ou du ministère de la Mise en valeur des ressources gazières de la Colombie-Britannique, pourvu qu’une diligence raisonnable soit exercée afin d’assurer l’exactitude de l’information reproduite, que l’Office national de l’énergie, la British Columbia Oil and Gas Commission, l’Alberta Energy Regulator ou le ministère de la Mise en valeur des ressources gazières de la Colombie-Britannique soient mentionnés comme les organismes sources, et que la reproduction ne soit présentée ni comme une version officielle ni comme une copie ayant été faite en collaboration avec l’Office national de l’énergie, la British Columbia Oil and Gas Commission, l’Alberta Energy Regulator ou le ministère de la Mise en valeur des ressources gazières de la Colombie-Britannique. Pour obtenir l’autorisation de reproduire l’information contenue dans cette publication à des fins commerciales, faire partenir un courriel à l'Office national de l'énergie à [email protected], à la British Columbia Oil and Gas Commission à [email protected], à l’Alberta Energy Regulator à [email protected], ou au ministère de la Mise en valeur des ressources gazières de la Colombie-Britannique à [email protected]. ISSN 1917-506X Published by: National Energy Board 444 Seventh Avenue S.W., Ground Floor Calgary, Alberta, T2P 0X8 E-Mail: [email protected] Fax: (403) 292-5576 or 1-877-288-8803 Phone: (403) 299-3562 or 1-800-899-1265 Web site: www.neb-one.gc.ca British Columbia Oil & Gas Commission #300, 398 Harbour Rd. Victoria, British Columbia V9A 0B7 Web site: www.bcogc.ca
Alberta Energy Regulator Suite 1000, 250 – 5th Street S.W. Calgary, Alberta T2P 0R4 E-Mail: [email protected] Fax: (403) 297-7336 Phone: (403) 297-8311 or 1-855-297-8311 Web site: www.aer.ca British Columbia Ministry of Natural Gas Development PO Box 9323 Stn Prov Govt 1810 Blanshard Street Victoria, British Columbia V8W 9N3 Web site: www.gov.bc.ca/mngd/
i
Table of Contents
Table of Contents ................................................................................................................. i
Foreword ............................................................................................................................. ii
Executive Summary ............................................................................................................ 1
Introduction ......................................................................................................................... 1
Geological Description ....................................................................................................... 2
Methodology ....................................................................................................................... 2
Assessment results and observations .................................................................................. 3
Appendix A - Methodology ................................................................................................ 7
ii
Foreword
National Energy Board
The National Energy Board is an independent federal regulator established to promote safety and security, environmental protection and economic interest within the mandate set by Parliament for the regulation of pipelines, energy development and trade. The Board's main responsibilities include regulating the construction and operation of interprovincial and international oil and natural gas pipelines, international power lines, and designated interprovincial power lines.
For oil and natural gas exports, the Board’s role is to evaluate whether the oil and natural gas proposed to be exported is surplus to reasonably foreseeable Canadian requirements, having regard to the trends in the discovery of oil or gas in Canada.
If a party wishes to rely on material from this report in any regulatory proceeding before the Board, it may submit the material, just as it may submit any public document. Under these circumstances, the submitting party in effect adopts the material and could be required to answer questions pertaining to its content. This report does not provide an indication about whether any application will be approved or not. The Board will decide on specific applications based on the material in evidence before it at that time.
British Columbia Oil and Gas Commission
The BC Oil and Gas Commission is the provincial regulatory agency with responsibilities for regulating oil and gas activities in British Columbia, including exploration, development, pipeline transportation and reclamation.
The Commission’s core services include reviewing and assessing applications for industry activity, consulting with First Nations, cooperating with partner agencies, and ensuring industry complies with provincial legislation and all regulatory requirements. The public interest is protected by ensuring public safety, respecting those affected by oil and gas activities, conserving the environment, and ensuring equitable participation in production.
Responding to the complex and often competing economic, environmental and social priorities driving the oil and gas industry, the Commission maintains a modern regulatory framework and proactively looks for innovative solutions for continued safe and sustainable oil and gas development in the province. In accordance with its mandate, the Commission strives to deliver fair and timely decisions on proposed projects, balancing firm oversight of operational safety and First Nations’ rights.
The Commission liaises with other provincial and federal government agencies in ensuring effective delivery of government policy, improved regulatory climate and cohesive application of existing regulations. It is of key importance for the Commission to stay fully apprised of the
iii
latest technological breakthroughs, and independent world-wide scientific research pertinent to the industry.
For general information about the Commission, please visit www.bcogc.ca or phone 250-794-5200.
Alberta Energy Regulator
The Alberta Energy Regulator (AER) ensures the safe, efficient, orderly, and environmentally responsible development of hydrocarbon resources over their entire life cycle. This includes allocating and conserving water resources, managing public lands, and protecting the environment while providing economic benefits for all Albertans. The AER succeeds the Energy Resources Conservation Board and takes on regulatory functions from the Ministry of Environment and Sustainable Resource Development that relate to public lands, water, and the environment. In this way, the AER provides full-lifecycle regulatory oversight of energy resource development in Alberta - from application and construction to abandonment and reclamation, and everything in between. The AER is authorized to make decisions on applications for energy development, monitoring for compliance assurance, decommissioning of developments, and all other aspects of energy resource activities (activities that must have an approval under one of the six provincial energy statutes). This authority extends to approvals under the public lands and environment statutes that relate to energy resource activities.
The Energy Resource Appraisal Group (ERA) is part of the Geology, Environment and Reserves Branch of the AER. The ERA generates knowledge and information related to the oil and gas geology and resource endowment of Alberta. Data provided by the AER for this report was data compiled and created by ERA. Much of the data used in this report has been previously published by ERA in AGS Open File Reports.1
For general information about the Alberta Energy Regulator, please visit www.aer.ca or phone toll-free 1-855-297-8311.
British Columbia Ministry of Natural Gas Development
The role of the British Columbia Ministry of Natural Gas Development is to guide the responsible development and ensure maximum economic benefits to British Columbians from the province’s natural gas resources and the province’s next new major industrial sector—that of liquefied natural gas (LNG).
Through teamwork and positive working relationships with its clients, the Ministry facilitates B.C.’s thriving, safe, environmentally responsible and competitive natural gas sector to create jobs and economic growth. In developing natural gas policies, legislation and guidelines, the
1 Available at: www.ags.gov.ab.ca/publications
iv
Ministry consults with other ministries and levels of government, energy companies, First Nations, communities, environmental and industry organizations, and the public.
A key component of the Ministry’s mandate is to develop tenure, royalty and regulatory policy for British Columbia’s natural gas industry, thereby promoting the effective and environmentally responsible management of the province’s natural gas resources.
The Ministry provides a range of natural gas related services, including the issuance of Crown subsurface resource rights, royalty programs, public geoscience and policies to address potential future resource opportunities, such as unconventional natural gas resource development. The Ministry’s LNG Secretariat reports to the new Cabinet Working Group on Liquefied Natural Gas, which will advise on budgets, structure, mandate and service plan goals.
The Ministry is also responsible for the British Columbia Oil and Gas Commission.
1
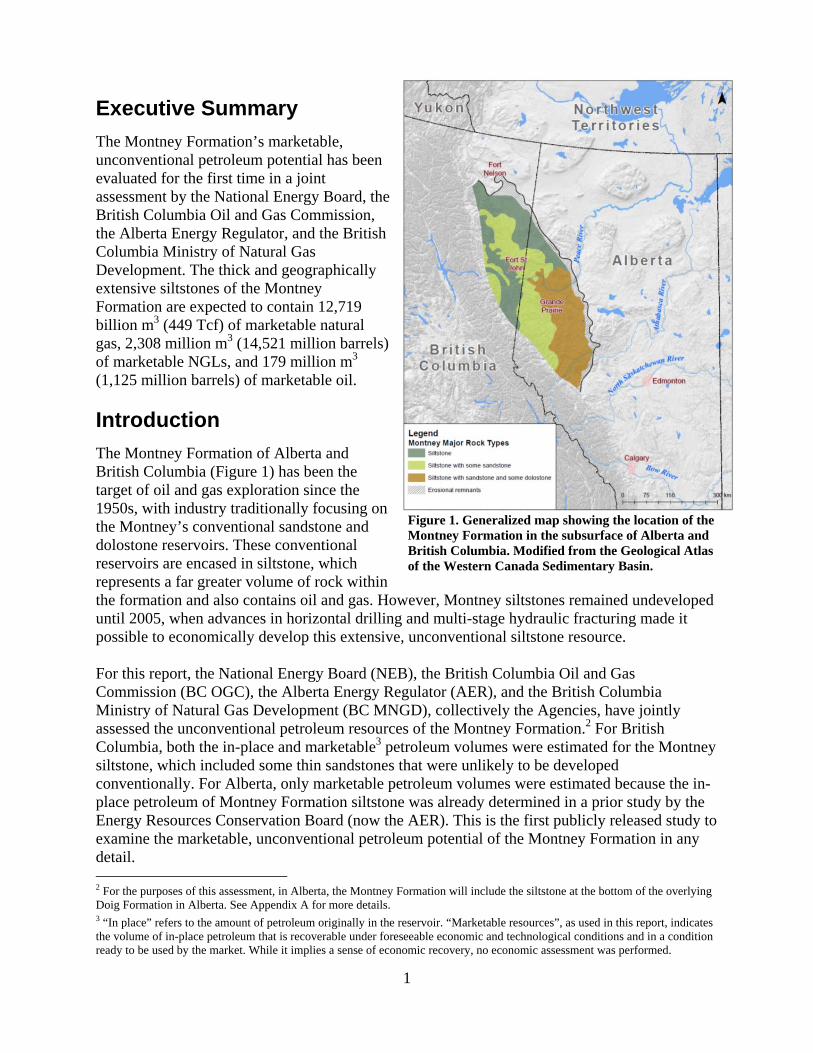
Executive Summary
The Montney Formation’s marketable, unconventional petroleum potential has been evaluated for the first time in a joint assessment by the National Energy Board, the British Columbia Oil and Gas Commission, the Alberta Energy Regulator, and the British Columbia Ministry of Natural Gas Development. The thick and geographically extensive siltstones of the Montney Formation are expected to contain 12,719 billion m3 (449 Tcf) of marketable natural gas, 2,308 million m3 (14,521 million barrels) of marketable NGLs, and 179 million m3 (1,125 million barrels) of marketable oil.
Introduction
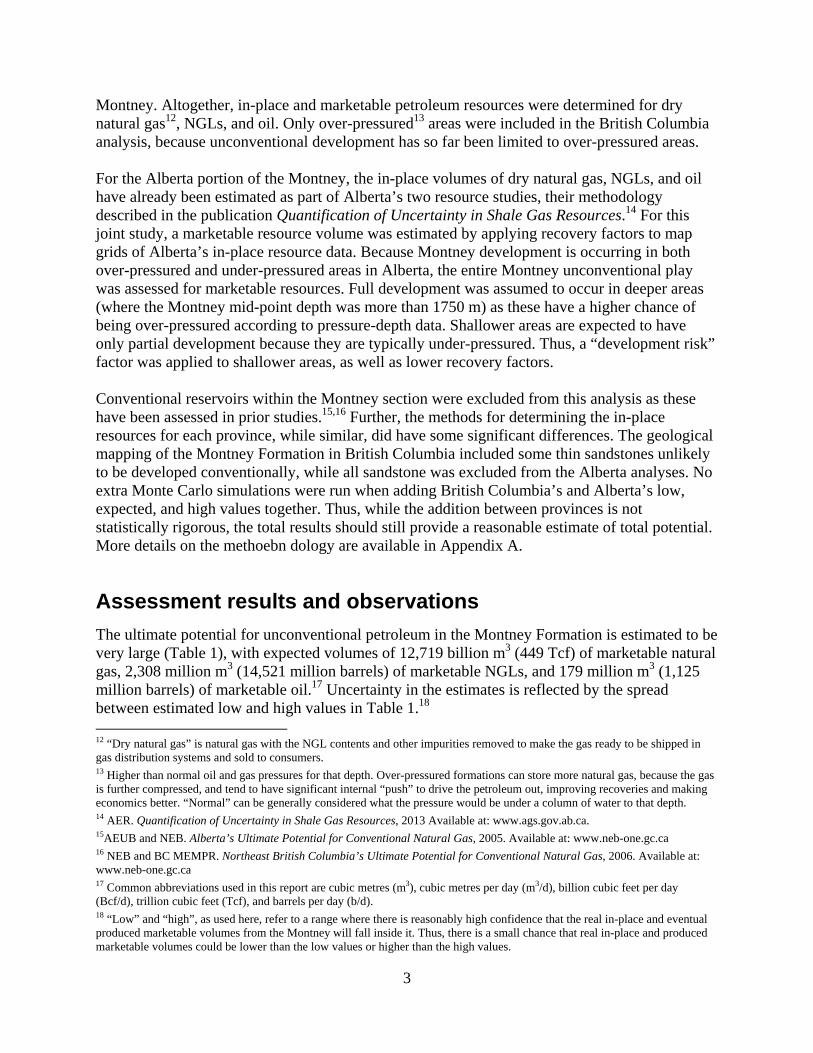
The Montney Formation of Alberta and British Columbia (Figure 1) has been the target of oil and gas exploration since the 1950s, with industry traditionally focusing on the Montney’s conventional sandstone and dolostone reservoirs. These conventional reservoirs are encased in siltstone, which represents a far greater volume of rock within the formation and also contains oil and gas. However, Montney siltstones remained undeveloped until 2005, when advances in horizontal drilling and multi-stage hydraulic fracturing made it possible to economically develop this extensive, unconventional siltstone resource. For this report, the National Energy Board (NEB), the British Columbia Oil and Gas Commission (BC OGC), the Alberta Energy Regulator (AER), and the British Columbia Ministry of Natural Gas Development (BC MNGD), collectively the Agencies, have jointly assessed the unconventional petroleum resources of the Montney Formation.2 For British Columbia, both the in-place and marketable3 petroleum volumes were estimated for the Montney siltstone, which included some thin sandstones that were unlikely to be developed conventionally. For Alberta, only marketable petroleum volumes were estimated because the in-place petroleum of Montney Formation siltstone was already determined in a prior study by the Energy Resources Conservation Board (now the AER). This is the first publicly released study to examine the marketable, unconventional petroleum potential of the Montney Formation in any detail. 2 For the purposes of this assessment, in Alberta, the Montney Formation will include the siltstone at the bottom of the overlying Doig Formation in Alberta. See Appendix A for more details. 3 “In place” refers to the amount of petroleum originally in the reservoir. “Marketable resources”, as used in this report, indicates the volume of in-place petroleum that is recoverable under foreseeable economic and technological conditions and in a condition ready to be used by the market. While it implies a sense of economic recovery, no economic assessment was performed.
Figure 1. Generalized map showing the location of the Montney Formation in the subsurface of Alberta and British Columbia. Modified from the Geological Atlas of the Western Canada Sedimentary Basin.
2
Geological Description
The Lower Triassic Montney Formation is aerially extensive, covering approximately 130,000 km2 (Figure 1). It is also thick, typically ranging from 100 m to 300 m, though thins to zero at its eastern and northeastern edges while increasing to over 300 m on its western side before it begins outcropping in the Rocky Mountains. Most of the formation consists of siltstone containing small amounts of sandstone that originally collected on the bottom of a deep sea, whereas more porous sandstones and shell beds were deposited in shallow water environments to the east. The depth of the formation also increases from northeast to southwest, generally along with increasing reservoir pressures and decreasing natural gas liquid4 (NGL) and oil content. Thus, reservoir characteristics vary widely across the formation. For a more detailed description of Montney geology in Alberta, please see Summary of Alberta’s Shale-and Siltstone-Hosted Hydrocarbon Resource Potential5 as well as the forthcoming assessment of the lowermost Doig siltstone’s resource potential.6 For more details on Montney geology in British Columbia, please see the Montney Formation Play Atlas NEBC.7 Other details about the Montney Formation are available in Chapter 16 of the Geological Atlas of the Western Canada Sedimentary Basin.8
Methodology
For British Columbia, the Montney was assessed using a process similar to one used in a 2011 study of the shale gas resources in the Horn River Basin.9 In the Horn River Basin assessment, the volumes of free gas and adsorbed gas10 were determined by connecting map grids of geological data to free gas and adsorbed gas equations. This way, gas volumes could be estimated by location and capture how the geological nature of the shales changed from place to place. Statistical distributions were applied to some variables in the equations and then Monte Carlo simulations were used to estimate low, expected, and high values.11 However, the Montney assessment was expanded to include NGLs and oil, which are not present in the Horn River Basin to any significant degree. Dissolved gas, which is gas that is dissolved in oil deep underground but is liberated at surface under lower pressures, was also estimated for the
4 For this study, NGLs are defined as ethane, propane, butane, pentane, and heavier hydrocarbons that are produced in the gas
stream out of a well. 5 ERCB. Summary of Alberta’s Shale- and Siltstone-Hosted Hydrocarbon Resource Potential, 2012. Available at:
www.ags.gov.ab.ca. 6 AER study, in preparation. Will be available at: www.ags.gov.ab.ca. 7 Available at: www.bcogc.ca/montney-formation-play-atlas-nebc. 8 Available at: www.ags.gov.ab.ca/publications/wcsb_atlas/atlas.html. 9 BC MEM and NEB. Ultimate Potential for Unconventional Natural Gas in Northeastern British Columbia’s Horn River Basin,
2011. Available at www.neb-one.gc.ca. 10 Free gas is gas found in a rock’s pore spaces; adsorbed gas is gas “stuck” to the side of any organic matter or clay present in the rock. 11 A Monte Carlo simulation is a computerized process where random numbers (as determined from a statistical distribution) are
picked hundreds to thousands of times to help determine a range of possibilities and uncertainty in an estimate.
3
Montney. Altogether, in-place and marketable petroleum resources were determined for dry natural gas12, NGLs, and oil. Only over-pressured13 areas were included in the British Columbia analysis, because unconventional development has so far been limited to over-pressured areas. For the Alberta portion of the Montney, the in-place volumes of dry natural gas, NGLs, and oil have already been estimated as part of Alberta’s two resource studies, their methodology described in the publication Quantification of Uncertainty in Shale Gas Resources.14 For this joint study, a marketable resource volume was estimated by applying recovery factors to map grids of Alberta’s in-place resource data. Because Montney development is occurring in both over-pressured and under-pressured areas in Alberta, the entire Montney unconventional play was assessed for marketable resources. Full development was assumed to occur in deeper areas (where the Montney mid-point depth was more than 1750 m) as these have a higher chance of being over-pressured according to pressure-depth data. Shallower areas are expected to have only partial development because they are typically under-pressured. Thus, a “development risk” factor was applied to shallower areas, as well as lower recovery factors. Conventional reservoirs within the Montney section were excluded from this analysis as these have been assessed in prior studies.15,16 Further, the methods for determining the in-place resources for each province, while similar, did have some significant differences. The geological mapping of the Montney Formation in British Columbia included some thin sandstones unlikely to be developed conventionally, while all sandstone was excluded from the Alberta analyses. No extra Monte Carlo simulations were run when adding British Columbia’s and Alberta’s low, expected, and high values together. Thus, while the addition between provinces is not statistically rigorous, the total results should still provide a reasonable estimate of total potential. More details on the methoebn dology are available in Appendix A.
Assessment results and observations
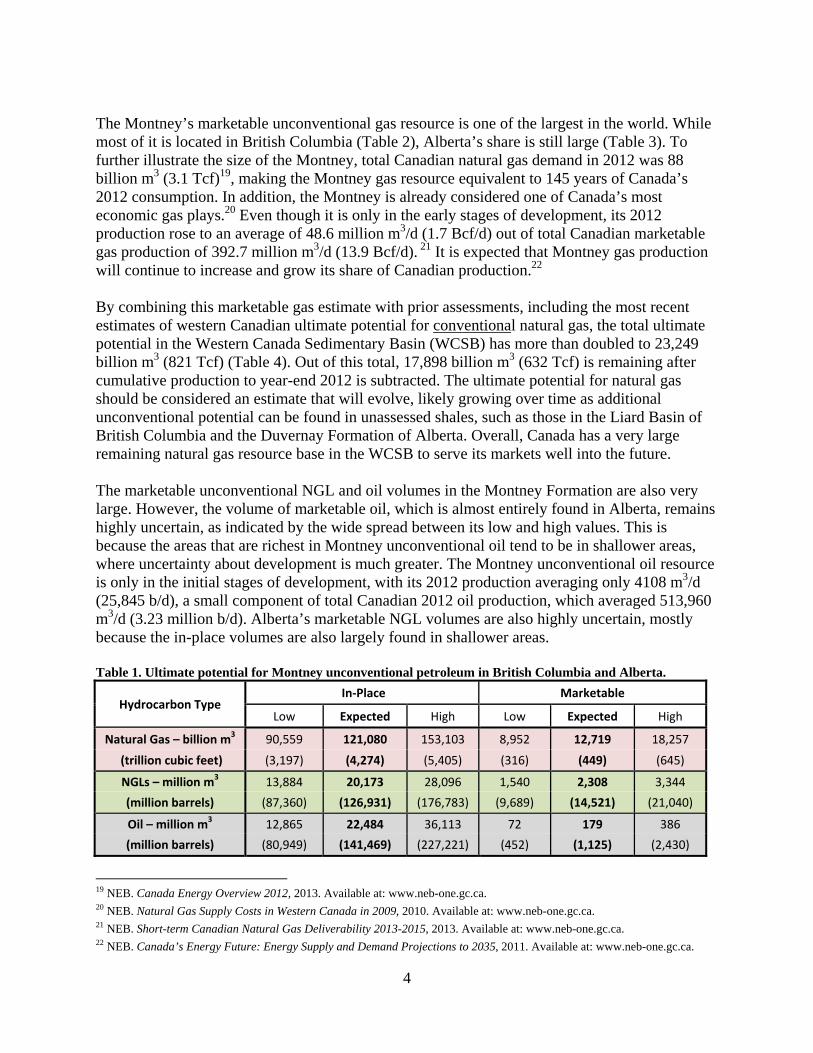
The ultimate potential for unconventional petroleum in the Montney Formation is estimated to be very large (Table 1), with expected volumes of 12,719 billion m3 (449 Tcf) of marketable natural gas, 2,308 million m3 (14,521 million barrels) of marketable NGLs, and 179 million m3 (1,125 million barrels) of marketable oil.17 Uncertainty in the estimates is reflected by the spread between estimated low and high values in Table 1.18 12 “Dry natural gas” is natural gas with the NGL contents and other impurities removed to make the gas ready to be shipped in gas distribution systems and sold to consumers. 13 Higher than normal oil and gas pressures for that depth. Over-pressured formations can store more natural gas, because the gas is further compressed, and tend to have significant internal “push” to drive the petroleum out, improving recoveries and making economics better. “Normal” can be generally considered what the pressure would be under a column of water to that depth. 14 AER. Quantification of Uncertainty in Shale Gas Resources, 2013 Available at: www.ags.gov.ab.ca. 15AEUB and NEB. Alberta’s Ultimate Potential for Conventional Natural Gas, 2005. Available at: www.neb-one.gc.ca 16 NEB and BC MEMPR. Northeast British Columbia’s Ultimate Potential for Conventional Natural Gas, 2006. Available at: www.neb-one.gc.ca 17 Common abbreviations used in this report are cubic metres (m3), cubic metres per day (m3/d), billion cubic feet per day (Bcf/d), trillion cubic feet (Tcf), and barrels per day (b/d). 18 “Low” and “high”, as used here, refer to a range where there is reasonably high confidence that the real in-place and eventual produced marketable volumes from the Montney will fall inside it. Thus, there is a small chance that real in-place and produced marketable volumes could be lower than the low values or higher than the high values.
4
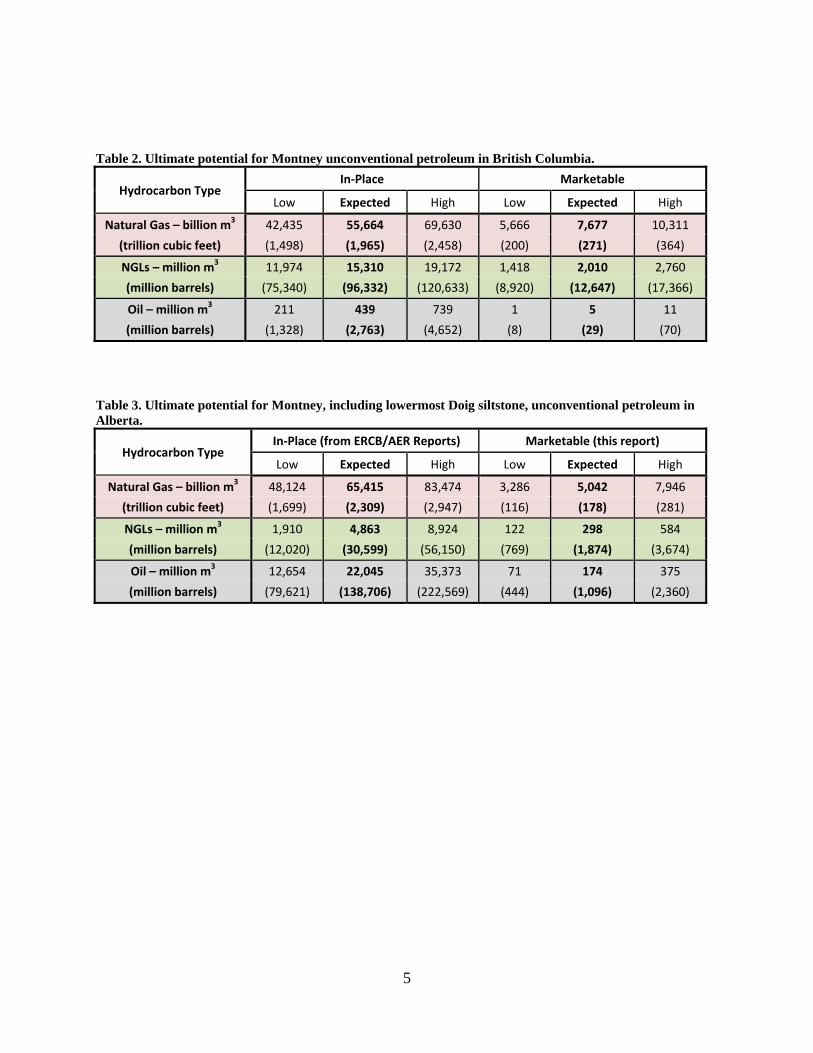
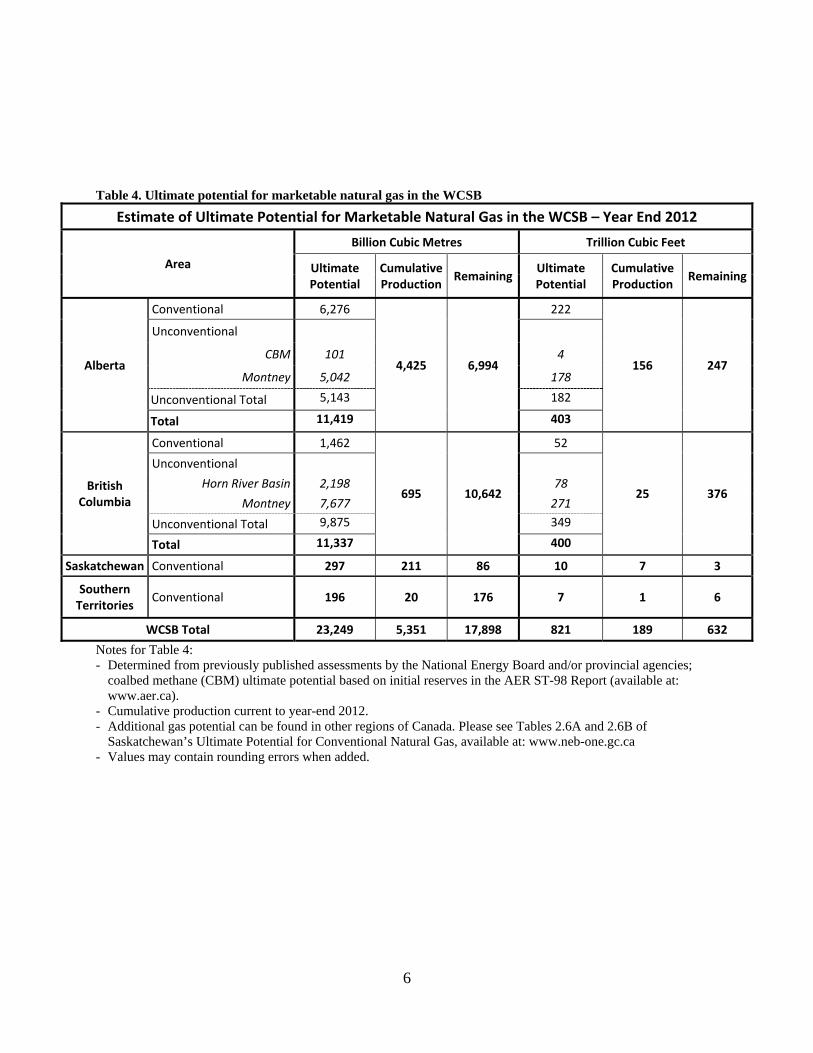
The Montney’s marketable unconventional gas resource is one of the largest in the world. While most of it is located in British Columbia (Table 2), Alberta’s share is still large (Table 3). To further illustrate the size of the Montney, total Canadian natural gas demand in 2012 was 88 billion m3 (3.1 Tcf)19, making the Montney gas resource equivalent to 145 years of Canada’s 2012 consumption. In addition, the Montney is already considered one of Canada’s most economic gas plays.20 Even though it is only in the early stages of development, its 2012 production rose to an average of 48.6 million m3/d (1.7 Bcf/d) out of total Canadian marketable gas production of 392.7 million m3/d (13.9 Bcf/d). 21 It is expected that Montney gas production will continue to increase and grow its share of Canadian production.22 By combining this marketable gas estimate with prior assessments, including the most recent estimates of western Canadian ultimate potential for conventional natural gas, the total ultimate potential in the Western Canada Sedimentary Basin (WCSB) has more than doubled to 23,249 billion m3 (821 Tcf) (Table 4). Out of this total, 17,898 billion m3 (632 Tcf) is remaining after cumulative production to year-end 2012 is subtracted. The ultimate potential for natural gas should be considered an estimate that will evolve, likely growing over time as additional unconventional potential can be found in unassessed shales, such as those in the Liard Basin of British Columbia and the Duvernay Formation of Alberta. Overall, Canada has a very large remaining natural gas resource base in the WCSB to serve its markets well into the future. The marketable unconventional NGL and oil volumes in the Montney Formation are also very large. However, the volume of marketable oil, which is almost entirely found in Alberta, remains highly uncertain, as indicated by the wide spread between its low and high values. This is because the areas that are richest in Montney unconventional oil tend to be in shallower areas, where uncertainty about development is much greater. The Montney unconventional oil resource is only in the initial stages of development, with its 2012 production averaging only 4108 m3/d (25,845 b/d), a small component of total Canadian 2012 oil production, which averaged 513,960 m3/d (3.23 million b/d). Alberta’s marketable NGL volumes are also highly uncertain, mostly because the in-place volumes are also largely found in shallower areas. Table 1. Ultimate potential for Montney unconventional petroleum in British Columbia and Alberta.
Hydrocarbon Type In-Place Marketable
Low Expected High Low Expected High
Natural Gas – billion m3 90,559 121,080 153,103 8,952 12,719 18,257 (trillion cubic feet) (3,197) (4,274) (5,405) (316) (449) (645)
NGLs – million m3 13,884 20,173 28,096 1,540 2,308 3,344 (million barrels) (87,360) (126,931) (176,783) (9,689) (14,521) (21,040)
Oil – million m3 12,865 22,484 36,113 72 179 386 (million barrels) (80,949) (141,469) (227,221) (452) (1,125) (2,430)
19 NEB. Canada Energy Overview 2012, 2013. Available at: www.neb-one.gc.ca. 20 NEB. Natural Gas Supply Costs in Western Canada in 2009, 2010. Available at: www.neb-one.gc.ca. 21 NEB. Short-term Canadian Natural Gas Deliverability 2013-2015, 2013. Available at: www.neb-one.gc.ca. 22 NEB. Canada’s Energy Future: Energy Supply and Demand Projections to 2035, 2011. Available at: www.neb-one.gc.ca.
5
Table 2. Ultimate potential for Montney unconventional petroleum in British Columbia.
Hydrocarbon Type In-Place Marketable
Low Expected High Low Expected High
Natural Gas – billion m3 42,435 55,664 69,630 5,666 7,677 10,311 (trillion cubic feet) (1,498) (1,965) (2,458) (200) (271) (364)
NGLs – million m3 11,974 15,310 19,172 1,418 2,010 2,760 (million barrels) (75,340) (96,332) (120,633) (8,920) (12,647) (17,366)
Oil – million m3 211 439 739 1 5 11 (million barrels) (1,328) (2,763) (4,652) (8) (29) (70)
Table 3. Ultimate potential for Montney, including lowermost Doig siltstone, unconventional petroleum in Alberta.
Hydrocarbon Type In-Place (from ERCB/AER Reports) Marketable (this report)
Low Expected High Low Expected High
Natural Gas – billion m3 48,124 65,415 83,474 3,286 5,042 7,946 (trillion cubic feet) (1,699) (2,309) (2,947) (116) (178) (281)
NGLs – million m3 1,910 4,863 8,924 122 298 584 (million barrels) (12,020) (30,599) (56,150) (769) (1,874) (3,674)
Oil – million m3 12,654 22,045 35,373 71 174 375 (million barrels) (79,621) (138,706) (222,569) (444) (1,096) (2,360)
6
Table 4. Ultimate potential for marketable natural gas in the WCSB
Estimate of Ultimate Potential for Marketable Natural Gas in the WCSB – Year End 2012
Area
Billion Cubic Metres Trillion Cubic Feet
Ultimate Potential
Cumulative Production Remaining Ultimate
Potential Cumulative Production Remaining
Alberta
Conventional 6,276
4,425 6,994
222
156 247
Unconventional
CBM 101 4
Montney 5,042 178
Unconventional Total 5,143 182
Total 11,419 403
British Columbia
Conventional 1,462
695 10,642
52
25 376
Unconventional Horn River Basin 2,198 78
Montney 7,677 271 Unconventional Total 9,875 349
Total 11,337 400
Saskatchewan Conventional 297 211 86 10 7 3
Southern Territories Conventional 196 20 176 7 1 6
WCSB Total 23,249 5,351 17,898 821 189 632 Notes for Table 4: - Determined from previously published assessments by the National Energy Board and/or provincial agencies;
coalbed methane (CBM) ultimate potential based on initial reserves in the AER ST-98 Report (available at: www.aer.ca).
- Cumulative production current to year-end 2012. - Additional gas potential can be found in other regions of Canada. Please see Tables 2.6A and 2.6B of
Saskatchewan’s Ultimate Potential for Conventional Natural Gas, available at: www.neb-one.gc.ca - Values may contain rounding errors when added.
7
Appendix A - Methodology
Introduction The methodology for the analysis of the British Columbia portion of the Montney petroleum resource is largely based on a prior study that examined the shale-gas resources in the Horn River Basin23, although it incorporates some new approaches to reflect geological differences in the reservoirs plus feedback received after the initial study. For the Alberta portion of the Montney petroleum resource, the in-place estimate had already been determined in two Alberta studies24,25 from which a recoverable estimate was extracted for this study. Please see the two Alberta studies as well as Quantification of Uncertainty in Shale Gas26 for more details on the AER’s methodologies and assumptions. Key Assumptions
1) In British Columbia, the petroleum resource was considered to be a resource play, pervasively distributed through the geologically defined area, though its constituents (oil, gas, and NGLs) could vary depending upon location. Thus, the chance of success at discovering petroleum with a well is 100 per cent. In Alberta’s assessments of in-place petroleum potential, the range of water saturations included the possibility of having water-saturated wells, thus the chance of petroleum discovery was not necessarily 100 per cent.
2) In British Columbia, thin sandstones unlikely to be targeted by conventional development were included within the siltstone section. In Alberta, all sandstones were excluded from the in-place evaluations and were therefore excluded from this assessment.
3) No study has been undertaken to determine the economics for marketable resources and the determination of what is economic is based on the view of the Agencies. Prior studies have estimated the supply cost of the Montney gas resource to be one of the lowest cost in western Canada, however.27
4) Recovery factors are based on existing technology, current trends in development, and limited production. No detailed analyses of technological advancements have been performed for this study. The recovery factors and levels of development could be different in the future as technology advances and the play matures, in particular in the shallower areas of Alberta and under-pressured areas of British Columbia.
23 BC MEM and NEB. Ultimate Potential for Unconventional Natural Gas in Northeastern British Columbia’s Horn River Basin, 2011. Available at www.neb-one.gc.ca. 24 ERCB. Summary of Alberta’s Shale- and Siltstone-Hosted Hydrocarbon Resource Potential, 2012. Available at: www.ags.gov.ab.ca.
25 AER study of lowermost Doig siltstone petroleum resources, in preparation. 26 AER. Quantification of Uncertainty in Shale Gas, 2013. Available at: www.ags.gov.ab.ca. 27 NEB. Natural Gas Supply Costs in Western Canada in 2009, 2010. Available at: www.neb-one.gc.ca.
8
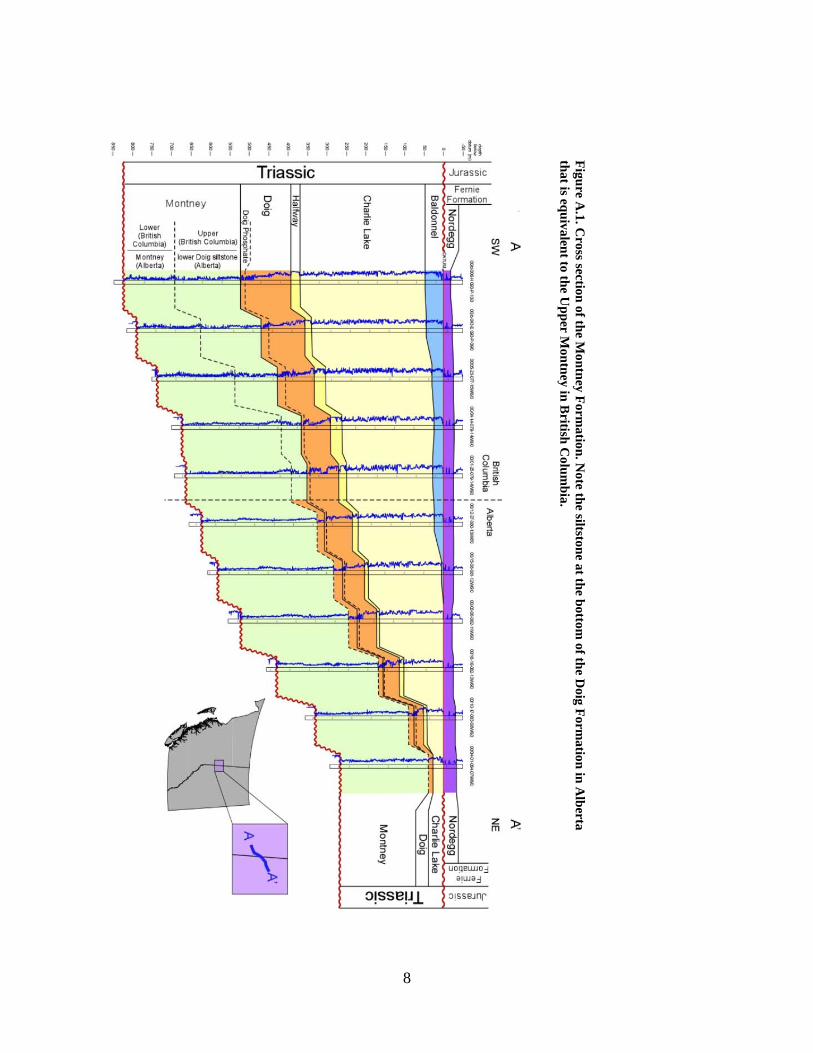
Figu
re A.1. C
ross section of th
e Montn
ey Form
ation. N
ote the siltston
e at the b
ottom of th
e Doig F
ormation
in A
lberta
that is eq
uivalen
t to the Up
per Mon
tney in
British
Colu
mb
ia.
9
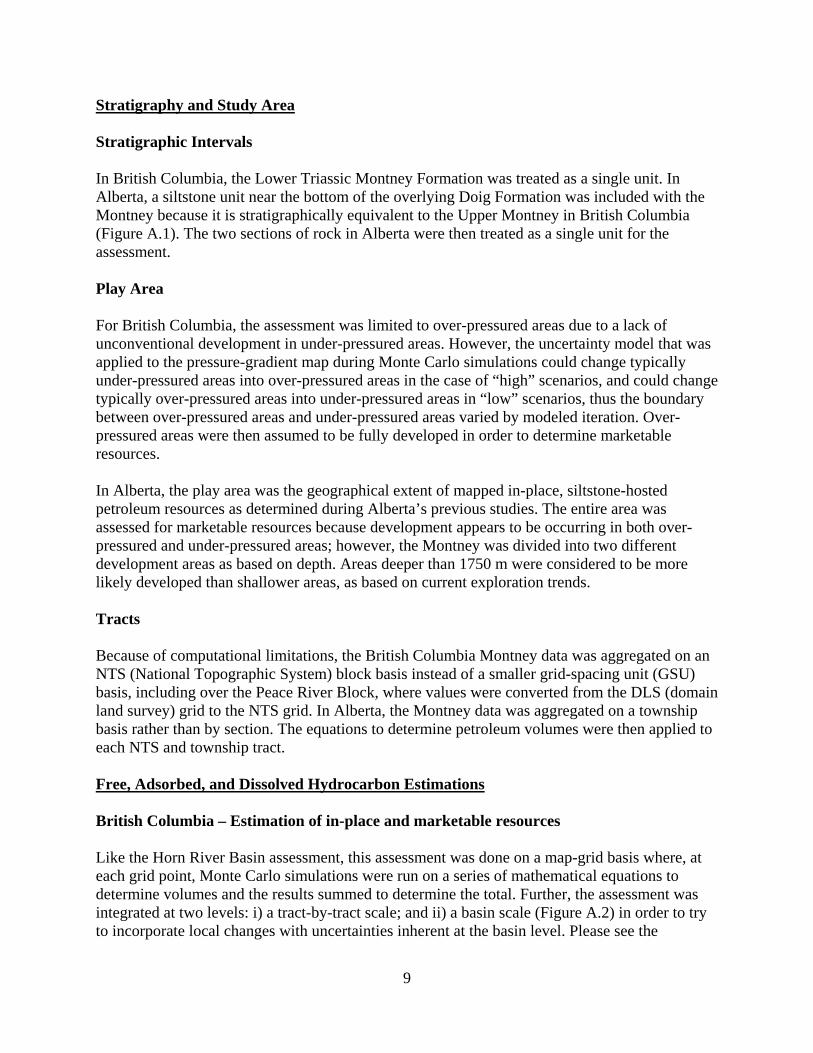
Stratigraphy and Study Area Stratigraphic Intervals In British Columbia, the Lower Triassic Montney Formation was treated as a single unit. In Alberta, a siltstone unit near the bottom of the overlying Doig Formation was included with the Montney because it is stratigraphically equivalent to the Upper Montney in British Columbia (Figure A.1). The two sections of rock in Alberta were then treated as a single unit for the assessment. Play Area For British Columbia, the assessment was limited to over-pressured areas due to a lack of unconventional development in under-pressured areas. However, the uncertainty model that was applied to the pressure-gradient map during Monte Carlo simulations could change typically under-pressured areas into over-pressured areas in the case of “high” scenarios, and could change typically over-pressured areas into under-pressured areas in “low” scenarios, thus the boundary between over-pressured areas and under-pressured areas varied by modeled iteration. Over-pressured areas were then assumed to be fully developed in order to determine marketable resources. In Alberta, the play area was the geographical extent of mapped in-place, siltstone-hosted petroleum resources as determined during Alberta’s previous studies. The entire area was assessed for marketable resources because development appears to be occurring in both over-pressured and under-pressured areas; however, the Montney was divided into two different development areas as based on depth. Areas deeper than 1750 m were considered to be more likely developed than shallower areas, as based on current exploration trends. Tracts Because of computational limitations, the British Columbia Montney data was aggregated on an NTS (National Topographic System) block basis instead of a smaller grid-spacing unit (GSU) basis, including over the Peace River Block, where values were converted from the DLS (domain land survey) grid to the NTS grid. In Alberta, the Montney data was aggregated on a township basis rather than by section. The equations to determine petroleum volumes were then applied to each NTS and township tract. Free, Adsorbed, and Dissolved Hydrocarbon Estimations British Columbia – Estimation of in-place and marketable resources Like the Horn River Basin assessment, this assessment was done on a map-grid basis where, at each grid point, Monte Carlo simulations were run on a series of mathematical equations to determine volumes and the results summed to determine the total. Further, the assessment was integrated at two levels: i) a tract-by-tract scale; and ii) a basin scale (Figure A.2) in order to try to incorporate local changes with uncertainties inherent at the basin level. Please see the
10
“Resource Modeling” section of the 2011 Horn River Basin assessment for more details on this “distribution of distributions” methodology. Figure A.2. One distribution applied upon another to create a “distribution of distributions”
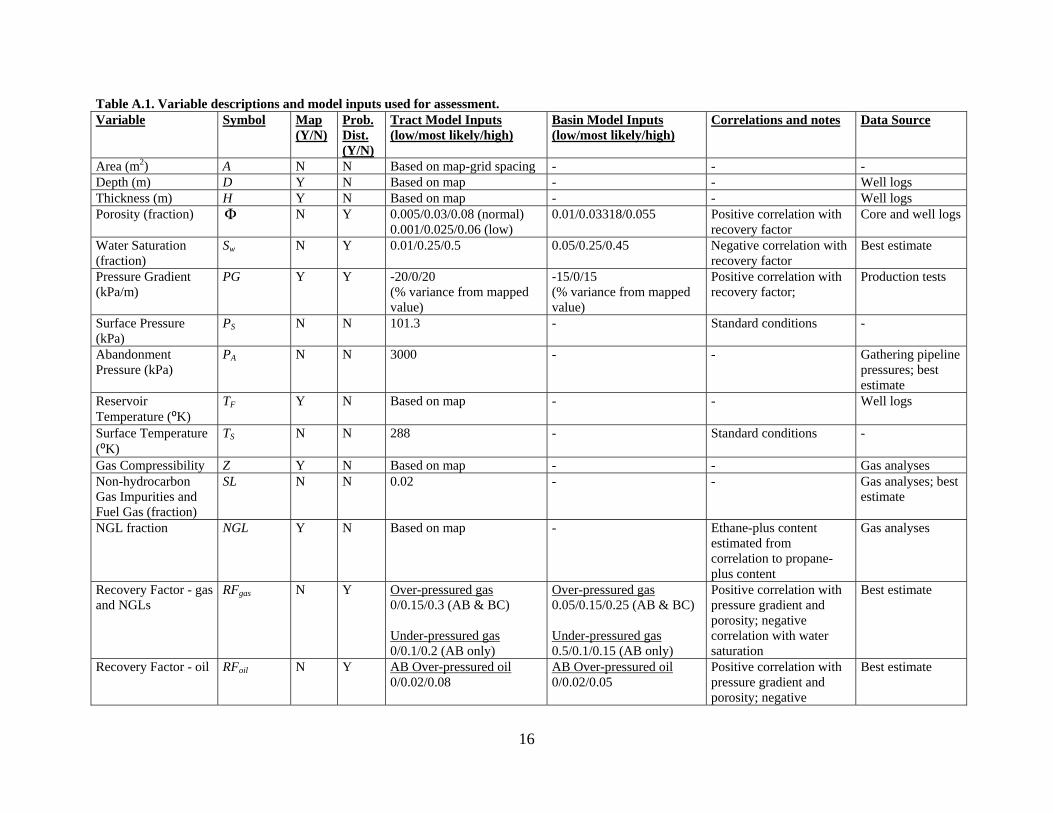
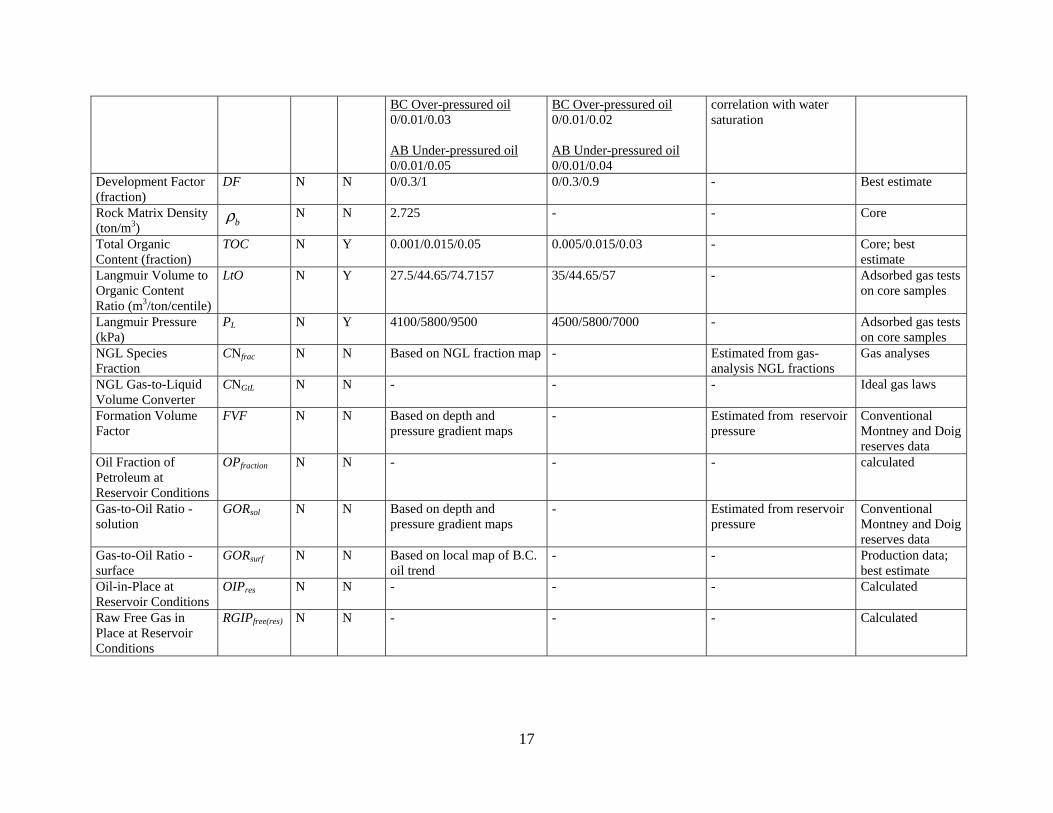
Most of the maps for the Montney Formation already exist in the Montney Formation Play Atlas NEBC28, such as depth, thickness, and pressure gradient maps. Other maps were constructed solely for this assessment, such as the gas compressibility and “propane plus” molar fraction maps. See Table A.1 for the variables in the assessment based on mapped data as well as the variables (both mapped and unmapped) that had distributions attached to them for the Monte Carlo simulations. Because the Montney Formation was treated as a single unit, variables like porosity, water saturation, and total organic content were applied as averages over the entire rock section. Unlike the Horn River Basin assessment, no net pay cutoff was used for the Montney in British Columbia. Sandstones, where present within the siltstone within British Columbia, were included in the unconventional play if those sandstones were unlikely to be developed conventionally. Porosities in less prospective areas were assigned lower average porosities than in more prospective areas (i.e., porosities were reduced where depth was greater than 2800 m, or where thickness was greater than 300 m and the tract was on the western half of the British Columbia map). To reduce potential skewing of distributions modeled on mapped data, “soft” maximums or minimums for distribution curves were used (i.e., the distribution’s low and high values wandered based on a percentage of the mapped “most likely” values) rather than “hard” maximum or minimums as long as the soft values did not exceed or fall below impossible values, such as creating negative numbers. Further, when applying the basin-scale distribution to the tract-scale distribution, variables that could have zero as a minimum (such as porosity or water saturation) always had their minimums tied to zero. As a result, not only did the maximums and most likely values vary for those distributions at the tract level, but the shape of the curve could also change. For distributions modeled on the pressure gradient, the range between a tract’s low and high values was reduced as determined by the number of reservoir pressure measurements in it, which increased certainty in the mapped pressures. Finally, typical solution gas ratios and formation volume factors from Montney and Doig oil pools in British Columbia, as well as gas-to-oil ratios obtained from production data, were
28 Available at: www.bcogc.ca/montney-formation-play-atlas-nebc.
11
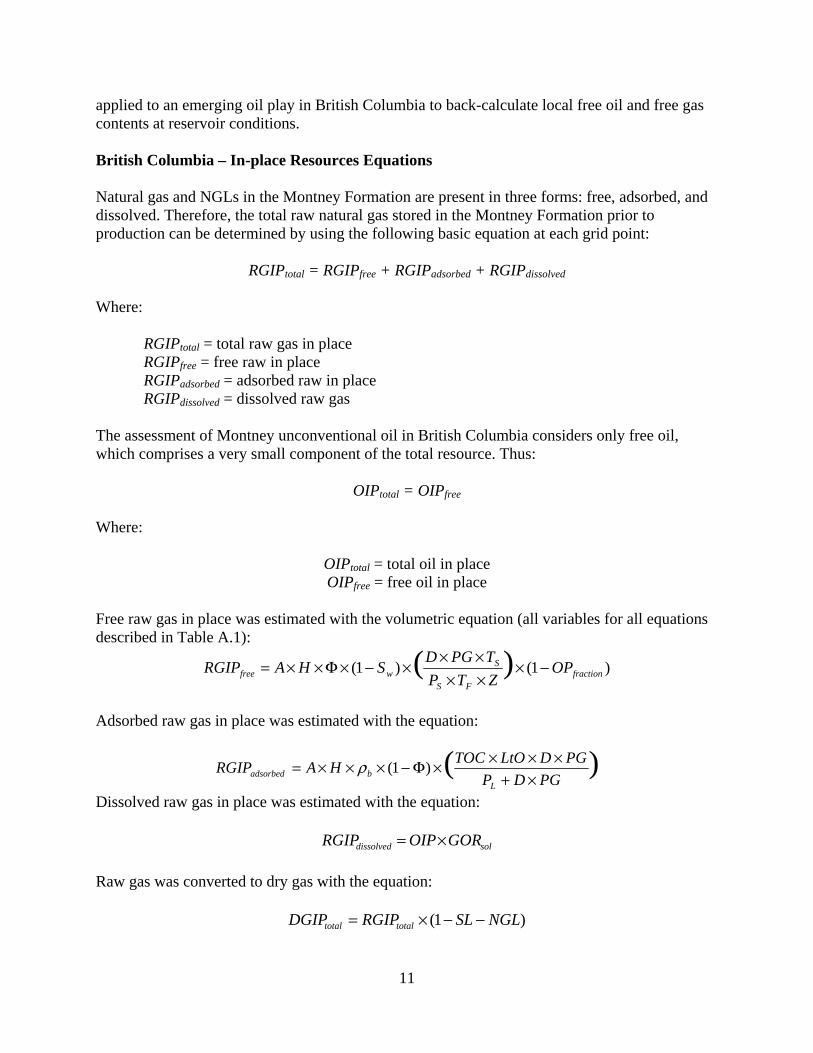
applied to an emerging oil play in British Columbia to back-calculate local free oil and free gas contents at reservoir conditions. British Columbia – In-place Resources Equations Natural gas and NGLs in the Montney Formation are present in three forms: free, adsorbed, and dissolved. Therefore, the total raw natural gas stored in the Montney Formation prior to production can be determined by using the following basic equation at each grid point:
RGIPtotal = RGIPfree + RGIPadsorbed + RGIPdissolved Where:
RGIPtotal = total raw gas in place RGIPfree = free raw in place RGIPadsorbed = adsorbed raw in place RGIPdissolved = dissolved raw gas
The assessment of Montney unconventional oil in British Columbia considers only free oil, which comprises a very small component of the total resource. Thus:
OIPtotal = OIPfree Where:
OIPtotal = total oil in place OIPfree = free oil in place
Free raw gas in place was estimated with the volumetric equation (all variables for all equations described in Table A.1):
)1()1( )( fractionFS
Swfree OP
ZTP
TPGDSHARGIP −×
××××
×−×Φ××=
Adsorbed raw gas in place was estimated with the equation:
)()1(PGDP
PGDLtOTOCHARGIP
Lbadsorbed ×+
××××Φ−×××= ρ
Dissolved raw gas in place was estimated with the equation:
soldissolved GOROIPRGIP ×=
Raw gas was converted to dry gas with the equation:
)1( NGLSLRGIPDGIP totaltotal −−×=
12
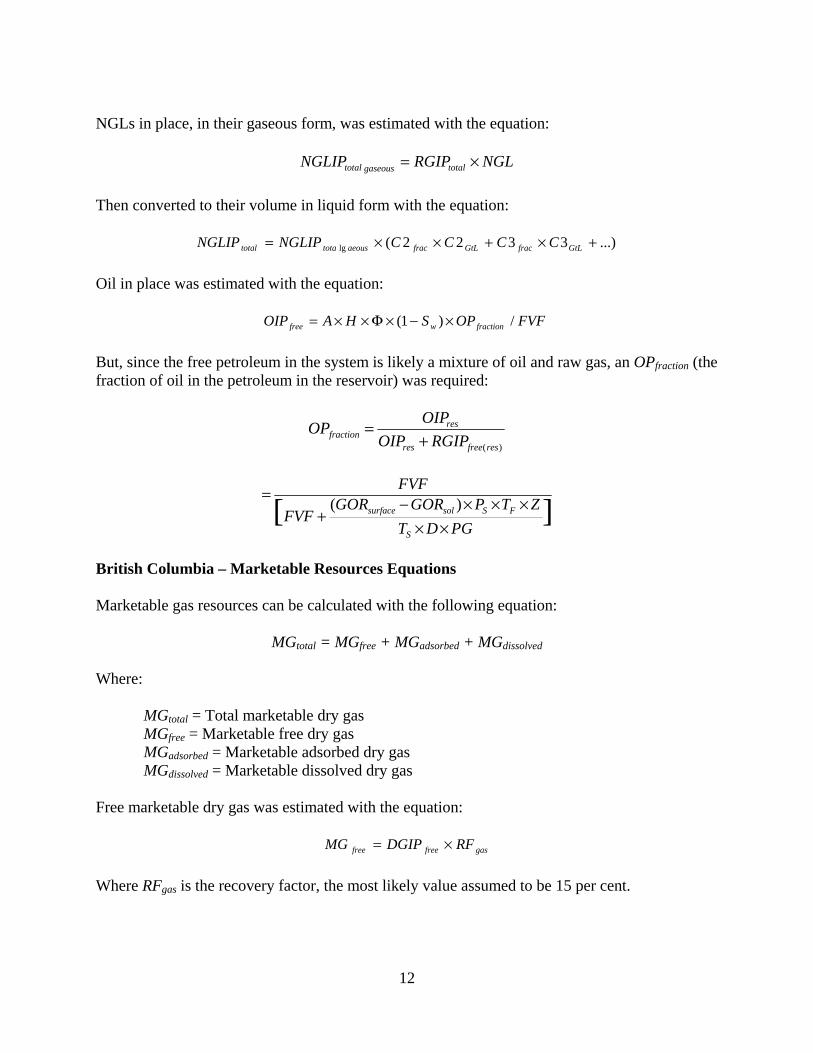
NGLs in place, in their gaseous form, was estimated with the equation:
NGLRGIPNGLIP totalgaseoustotal ×=
Then converted to their volume in liquid form with the equation:
...)3322(lg +×+××= GtLfracGtLfracaeoustotatotal CCCCNGLIPNGLIP
Oil in place was estimated with the equation:
FVFOPSHAOIP fractionwfree /)1( ×−×Φ××=
But, since the free petroleum in the system is likely a mixture of oil and raw gas, an OPfraction (the fraction of oil in the petroleum in the reservoir) was required:
)(resfreeres
resfraction RGIPOIP
OIPOP
+=
][ )(
PGDT
ZTPGORGORFVF
FVF
S
FSsolsurface
×××××−
+=
British Columbia – Marketable Resources Equations Marketable gas resources can be calculated with the following equation:
MGtotal = MGfree + MGadsorbed + MGdissolved
Where:
MGtotal = Total marketable dry gas MGfree = Marketable free dry gas MGadsorbed = Marketable adsorbed dry gas MGdissolved = Marketable dissolved dry gas
Free marketable dry gas was estimated with the equation:
gasfreefree RFDGIPMG ×=
Where RFgas is the recovery factor, the most likely value assumed to be 15 per cent.
13
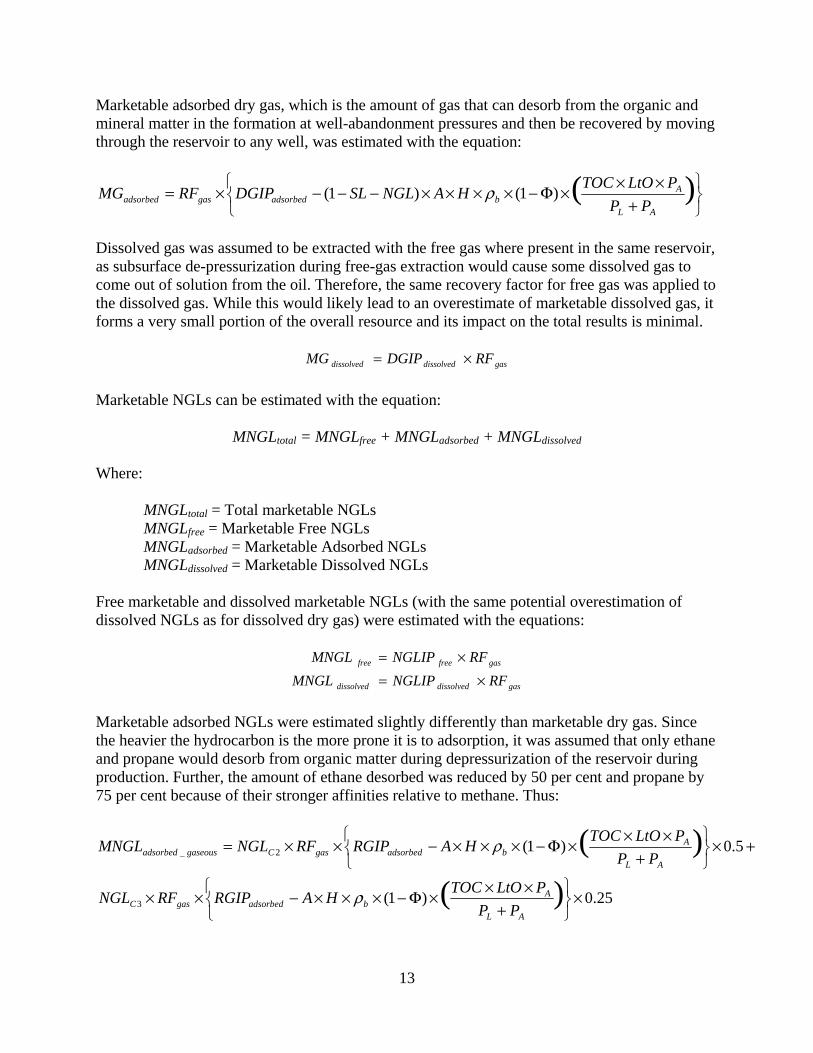
Marketable adsorbed dry gas, which is the amount of gas that can desorb from the organic and mineral matter in the formation at well-abandonment pressures and then be recovered by moving through the reservoir to any well, was estimated with the equation:
+××
×Φ−××××−−−×= )()1()1(AL
Abadsorbedgasadsorbed PP
PLtOTOCHANGLSLDGIPRFMG ρ
Dissolved gas was assumed to be extracted with the free gas where present in the same reservoir, as subsurface de-pressurization during free-gas extraction would cause some dissolved gas to come out of solution from the oil. Therefore, the same recovery factor for free gas was applied to the dissolved gas. While this would likely lead to an overestimate of marketable dissolved gas, it forms a very small portion of the overall resource and its impact on the total results is minimal.
gasdissolveddissolved RFDGIPMG ×=
Marketable NGLs can be estimated with the equation:
MNGLtotal = MNGLfree + MNGLadsorbed + MNGLdissolved Where:
MNGLtotal = Total marketable NGLs MNGLfree = Marketable Free NGLs MNGLadsorbed = Marketable Adsorbed NGLs MNGLdissolved = Marketable Dissolved NGLs
Free marketable and dissolved marketable NGLs (with the same potential overestimation of dissolved NGLs as for dissolved dry gas) were estimated with the equations:
gasfreefree RFNGLIPMNGL ×=
gasdissolveddissolved RFNGLIPMNGL ×=
Marketable adsorbed NGLs were estimated slightly differently than marketable dry gas. Since the heavier the hydrocarbon is the more prone it is to adsorption, it was assumed that only ethane and propane would desorb from organic matter during depressurization of the reservoir during production. Further, the amount of ethane desorbed was reduced by 50 per cent and propane by 75 per cent because of their stronger affinities relative to methane. Thus:
25.0)1(
5.0)1(
)(
)(
3
2_
×
+××
×Φ−×××−××
+×
+××
×Φ−×××−××=
AL
AbadsorbedgasC
AL
AbadsorbedgasCgaseousadsorbed
PP
PLtOTOCHARGIPRFNGL
PP
PLtOTOCHARGIPRFNGLMNGL
ρ
ρ
14
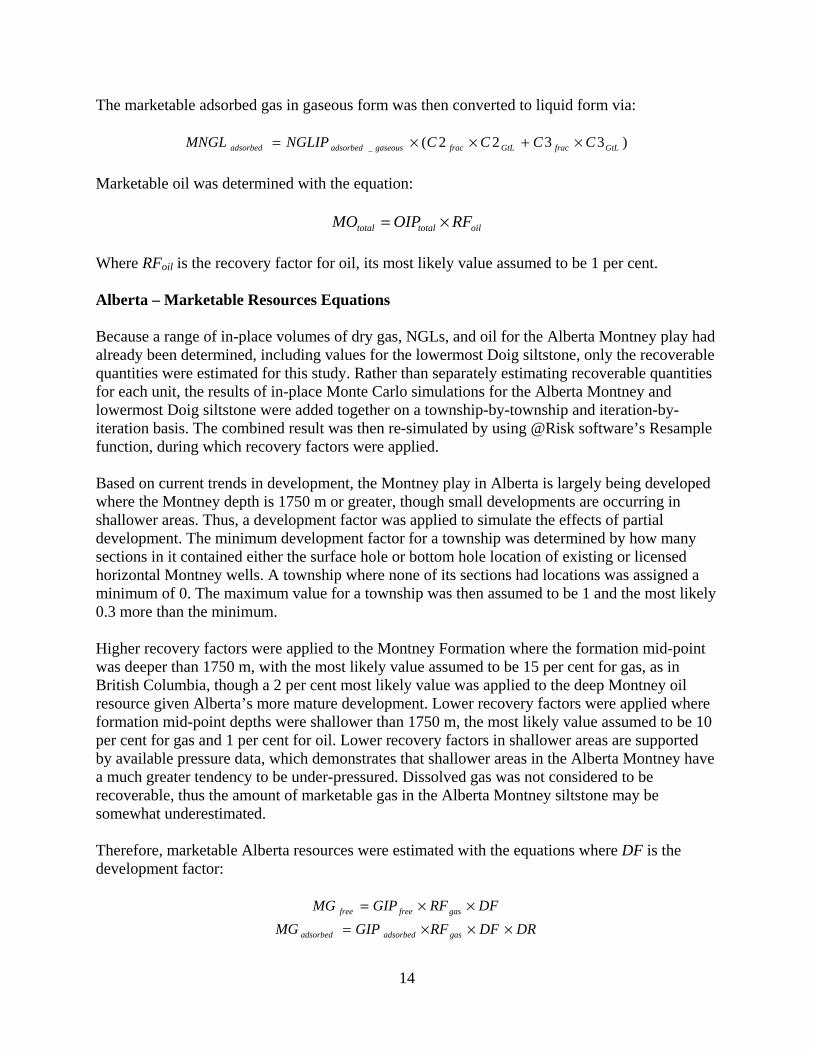
The marketable adsorbed gas in gaseous form was then converted to liquid form via:
)3322(_ GtLfracGtLfracgaseousadsorbedadsorbed CCCCNGLIPMNGL ×+××=
Marketable oil was determined with the equation:
oiltotaltotal RFOIPMO ×=
Where RFoil is the recovery factor for oil, its most likely value assumed to be 1 per cent. Alberta – Marketable Resources Equations Because a range of in-place volumes of dry gas, NGLs, and oil for the Alberta Montney play had already been determined, including values for the lowermost Doig siltstone, only the recoverable quantities were estimated for this study. Rather than separately estimating recoverable quantities for each unit, the results of in-place Monte Carlo simulations for the Alberta Montney and lowermost Doig siltstone were added together on a township-by-township and iteration-by-iteration basis. The combined result was then re-simulated by using @Risk software’s Resample function, during which recovery factors were applied. Based on current trends in development, the Montney play in Alberta is largely being developed where the Montney depth is 1750 m or greater, though small developments are occurring in shallower areas. Thus, a development factor was applied to simulate the effects of partial development. The minimum development factor for a township was determined by how many sections in it contained either the surface hole or bottom hole location of existing or licensed horizontal Montney wells. A township where none of its sections had locations was assigned a minimum of 0. The maximum value for a township was then assumed to be 1 and the most likely 0.3 more than the minimum. Higher recovery factors were applied to the Montney Formation where the formation mid-point was deeper than 1750 m, with the most likely value assumed to be 15 per cent for gas, as in British Columbia, though a 2 per cent most likely value was applied to the deep Montney oil resource given Alberta’s more mature development. Lower recovery factors were applied where formation mid-point depths were shallower than 1750 m, the most likely value assumed to be 10 per cent for gas and 1 per cent for oil. Lower recovery factors in shallower areas are supported by available pressure data, which demonstrates that shallower areas in the Alberta Montney have a much greater tendency to be under-pressured. Dissolved gas was not considered to be recoverable, thus the amount of marketable gas in the Alberta Montney siltstone may be somewhat underestimated. Therefore, marketable Alberta resources were estimated with the equations where DF is the development factor:
DFRFGIPMG gasfreefree ××=
DRDFRFGIPMG gasadsorbedadsorbed ×××=
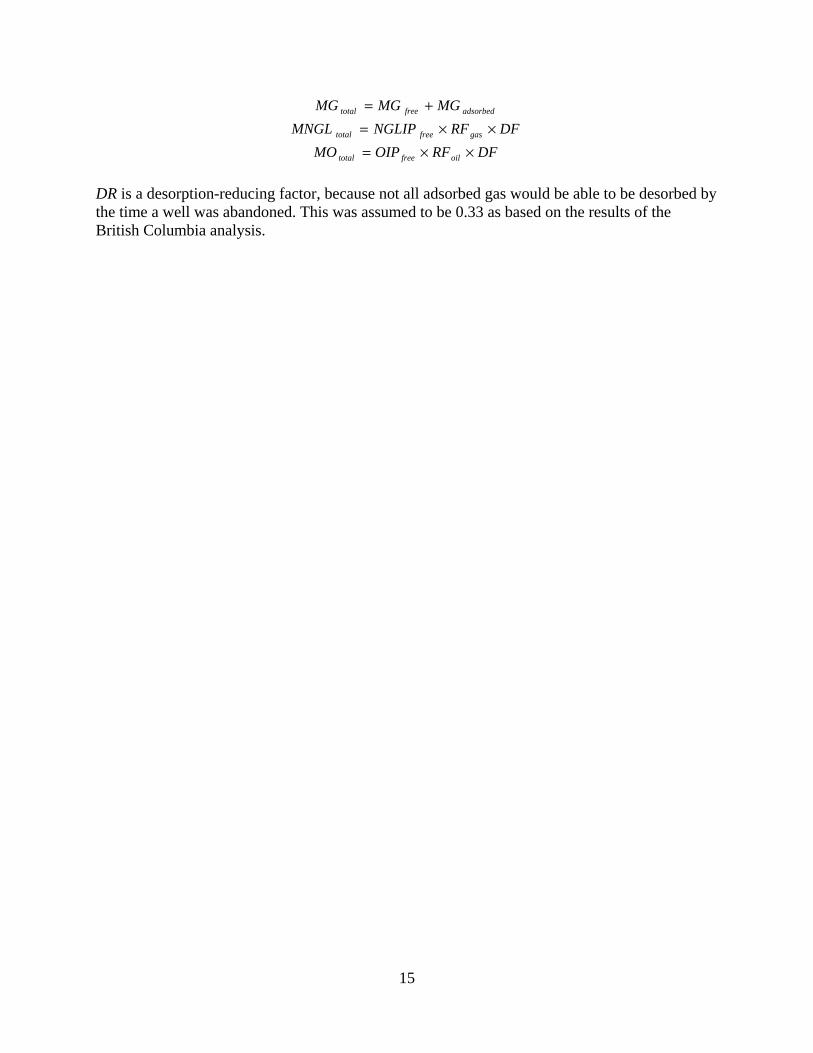
15
adsorbedfreetotal MGMGMG +=
DFRFNGLIPMNGL gasfreetotal ××=
DFRFOIPMO oilfreetotal ××=
DR is a desorption-reducing factor, because not all adsorbed gas would be able to be desorbed by the time a well was abandoned. This was assumed to be 0.33 as based on the results of the British Columbia analysis.
16
Table A.1. Variable descriptions and model inputs used for assessment. Variable Symbol Map
(Y/N) Prob. Dist. (Y/N)
Tract Model Inputs (low/most likely/high)
Basin Model Inputs (low/most likely/high)
Correlations and notes Data Source
Area (m2) A N N Based on map-grid spacing - - - Depth (m) D Y N Based on map - - Well logs Thickness (m) H Y N Based on map - - Well logs Porosity (fraction) Φ N Y 0.005/0.03/0.08 (normal)
0.001/0.025/0.06 (low) 0.01/0.03318/0.055 Positive correlation with
recovery factor Core and well logs
Water Saturation (fraction)
Sw N Y 0.01/0.25/0.5 0.05/0.25/0.45 Negative correlation with recovery factor
Best estimate
Pressure Gradient (kPa/m)
PG Y Y -20/0/20 (% variance from mapped value)
-15/0/15 (% variance from mapped value)
Positive correlation with recovery factor;
Production tests
Surface Pressure (kPa)
PS N N 101.3 - Standard conditions -
Abandonment Pressure (kPa)
PA N N 3000 - - Gathering pipeline pressures; best estimate
Reservoir Temperature (⁰K)
TF Y N Based on map - - Well logs
Surface Temperature (⁰K)
TS N N 288 - Standard conditions -
Gas Compressibility Z Y N Based on map - - Gas analyses Non-hydrocarbon Gas Impurities and Fuel Gas (fraction)
SL N N 0.02 - - Gas analyses; best estimate
NGL fraction NGL Y N Based on map - Ethane-plus content estimated from correlation to propane-plus content
Gas analyses
Recovery Factor - gas and NGLs
RFgas
N Y Over-pressured gas
0/0.15/0.3 (AB & BC) Under-pressured gas 0/0.1/0.2 (AB only)
Over-pressured gas 0.05/0.15/0.25 (AB & BC) Under-pressured gas 0.5/0.1/0.15 (AB only)
Positive correlation with pressure gradient and porosity; negative correlation with water saturation
Best estimate
Recovery Factor - oil RFoil
N Y AB Over-pressured oil
0/0.02/0.08
AB Over-pressured oil 0/0.02/0.05
Positive correlation with pressure gradient and porosity; negative
Best estimate
17
BC Over-pressured oil 0/0.01/0.03 AB Under-pressured oil 0/0.01/0.05
BC Over-pressured oil 0/0.01/0.02 AB Under-pressured oil 0/0.01/0.04
correlation with water saturation
Development Factor (fraction)
DF N N 0/0.3/1 0/0.3/0.9 - Best estimate
Rock Matrix Density (ton/m3) bρ N N 2.725 - - Core
Total Organic Content (fraction)
TOC N Y 0.001/0.015/0.05 0.005/0.015/0.03 - Core; best estimate
Langmuir Volume to Organic Content Ratio (m3/ton/centile)
LtO N Y 27.5/44.65/74.7157 35/44.65/57 - Adsorbed gas tests on core samples
Langmuir Pressure (kPa)
PL N Y 4100/5800/9500 4500/5800/7000 - Adsorbed gas tests on core samples
NGL Species Fraction
CNfrac N N Based on NGL fraction map - Estimated from gas-analysis NGL fractions
Gas analyses
NGL Gas-to-Liquid Volume Converter
CNGtL N N - - - Ideal gas laws
Formation Volume Factor
FVF N N Based on depth and pressure gradient maps
- Estimated from reservoir pressure
Conventional Montney and Doig reserves data
Oil Fraction of Petroleum at Reservoir Conditions
OPfraction N N - - - calculated
Gas-to-Oil Ratio - solution
GORsol N N Based on depth and pressure gradient maps
- Estimated from reservoir pressure
Conventional Montney and Doig reserves data
Gas-to-Oil Ratio - surface
GORsurf N N Based on local map of B.C. oil trend
- - Production data; best estimate
Oil-in-Place at Reservoir Conditions
OIPres N N - - - Calculated
Raw Free Gas in Place at Reservoir Conditions
RGIPfree(res) N N - - - Calculated


