
Performance Pricing Covenants and Corporate Loan Spreads
Kamphol Panyagometh National Institute of Development Administration (NIDA), Thailand
floor 8 Boonchana – Autthakorn, 118 Moo3, Sereethai Road Khwaeng Klong-Chan, Khet Bangkapi,
Bangkok, Thailand 10240 Email: [email protected]
Gordon S. Roberts – Corresponding Author Schulich School of Business, York University
4700 Keele Street, Toronto, Ontario Canada M5P1H6
Phone: 1 416 736-2100, Extension 77953 Fax: 1 416 736-5687
Email: [email protected]
Aron A. Gottesman Lubin School of Business, Pace University 1 Pace Plaza, New York, N.Y., USA 10038
Email: [email protected]
Mehdi Beyhaghi Schulich School of Business, York University
Email: [email protected]
This version: December 2012
We explore the relation between corporate loan spreads and performance pricing covenants (PPCs) which automatically adjustment interest-rate spread when a change occurs in the borrower’s subsequent performance. We pioneer separate measurement of the impact of performance pricing depending on whether it is based on accounting ratios such debt-to-EBITDA (common practice for smaller, riskier borrowers) or on the borrower’s debt rating. Applying a matched-pairs technique holding borrower and lending syndicate constant, we find that over 90% of PPCs are accounting-based and for this sub-sample the average spread reduction is 45.8 basis points. In contrast, debt-rating-based PPCs result in spreads that are only 3-4 basis points lower a difference that is only weakly statistically significant. We distinguish between interest-increasing and decreasing PPCs. Identifying the latter as a tight covenant in the covenant signaling framework of Demiroglu and James (2010), we show that such covenants are associated with significantly greater spread reduction.
EFMA classification code: 510 – Depository Institutions - Management Keywords: Covenants, Performance pricing, Loan pricing

Performance Pricing Covenants and Corporate Loan Spreads
This version: December 2012
We explore the relation between corporate loan spreads and performance pricing covenants (PPCs) which automatically adjustment interest-rate spread when a change occurs in the borrower’s subsequent performance. We pioneer separate measurement of the impact of performance pricing depending on whether it is based on accounting ratios such debt-to-EBITDA (common practice for smaller, riskier borrowers) or on the borrower’s debt rating. Applying a matched-pairs technique holding borrower and lending syndicate constant, we find that over 90% of PPCs are accounting-based and for this sub-sample the average spread reduction is 45.8 basis points. In contrast, debt-rating-based PPCs result in spreads that are only 3-4 basis points lower a difference that is only weakly statistically significant. We distinguish between interest-increasing and decreasing PPCs. Identifying the latter as a tight covenant in the covenant signaling framework of Demiroglu and James (2010), we show that such covenants are associated with significantly greater spread reduction.
EFMA classification code: 510 – Depository Institutions - Management Keywords: Covenants, Performance pricing, Loan pricing
2

Performance Pricing Covenants and Corporate Loan Spreads
1. Introduction
Performance pricing covenants (PPCs) in bank loans specify adjustments to the interest-
rate spread when some measure of the borrower’s subsequent performance changes. PPCs
employ two alternative performance metrics: accounting-based measures, such as the debt-to-
EBITDA ratio, and debt-ratings-based performance measures, such as the Moody’s or Standard
& Poor’s rating of the borrower’s bonds or commercial paper. They also differ in the direction
of spread adjustment: interest-increasing PPCs specify higher spreads should borrower credit
quality decline offering automatic protection to the lending bank. Interest-decreasing PPCs
provide for narrower spreads should credit quality improve. By presenting an alternative to
prepaying or renegotiating loans in such circumstances, PPCs offer reduced transactions costs to
both parties.
PPCs are of interest because they provide an opportunity to study the value of accounting
information vs. debt ratings. The accuracy of debt ratings has received considerable attention in
light of the criticism of bond rating agencies in the wake of the recent financial crisis (Fridson
(2010)). Further, as an innovation in covenant design, PPCs represent an opportunity for further
testing of the signaling theory of covenants developed by Gerleanu and Zwiebel (2006) and
Demiroglu and James (2010).
The central task of this paper is to measure how the introduction of a performance pricing
covenant influences loan spreads. In a close antecedent to our work, Asquith, Beatty and Weber
(2005) employ a joint model of the decision to introduce either interest-increasing or interest-
decreasing performance pricing and the LIBOR spread. Our tests differ from theirs in several
3

important respects. First, we pioneer separate measurement of the impact of performance pricing
depending on whether it is accounting- or debt-rating-based. This distinction matters because
firms with accounting-based performance are riskier (have higher initial spreads and greater
volatility of credit risk during the loan’s life), borrow at longer maturities, are smaller, and are
more likely to secure loans. In contrast, firms choosing to structure performance pricing based on
credit ratings are larger and more complex. As a result, their accounting numbers require greater
adjustment and are thus less suitable to simple rules in accounting-based performance pricing
covenants. Accordingly, such firms prefer bond ratings as a performance-pricing benchmark as
these are considered to be a comprehensive measure of credit risk. Further, the greater volatility
of credit risk for these borrowers increases the value of the lender’s option (in the case of
interest-increasing performance pricing). Expected recontracting costs are higher for such firms
and their lenders. As a result, we hypothesize that performance pricing (whether interest-
increasing or decreasing) should have a greater impact on the initial spread when it is accounting
based.
Second, we reexamine the theoretical rationale given in Asquith et al. for distinguishing
between interest-increasing and decreasing performance pricing. That paper argues that because
an interest-increasing PPC has value to the lender, the bank must compensate borrowers with a
lower rate. They report a rate differential of just under 26 basis points. For interest-decreasing
PPCs, Asquith et al. note that such contracts allow borrowers with improved credit quality to
enjoy lower rates automatically without either side incurring the costs of loan prepayment or
renegotiation. Because the benefit from lower costs may go to either side, they leave it to
empirical testing to determine the impact on spreads. They report an economically small and
4

marginally significant, positive coefficient, interpreting this as evidence that “borrowers may
gain slightly more than lenders by decreasing the renegotiation costs” (p124).
Our separation of PPCs according to the measure of performance allows us to draw on
Doyle (2003) for insight on how interest-decreasing PPC should impact spread. It is likely that
for higher risk firms choosing accounting-based performance pricing, bargaining power is low;
hence the main saving in recontracting costs goes to the lender. This suggests that interest-
increasing performance pricing reduces the initial spread. Put another way, for accounting-based
PPC, we hypothesize that introduction of PPC reduces spread regardless of whether it is interest-
increasing or decreasing.
Demiroglu and James (2010) analyze covenants as a signaling mechanism designed to
attenuate information asymmetry.1 In their framework, borrowers have private information about
their future prospects. By accepting loan terms with tight covenants, the borrower signals that it
believes its financial state will improve. Consistent with this covenant-signaling hypothesis, they
find that firms with tight covenants display stronger future operating performance. Further,
announcements of loans to such firms have higher than average positive stock market reaction.
Both results are supportive of the signaling view of covenant design.
Viewed in the covenant signaling framework of Demiroglu and James (2010), interest-
decreasing performance pricing is generally a tighter covenant than its interest-increasing
counterpart. We illustrate the distinction with a hypothetical example of a company that is
borrowing at LIBOR plus 100 basis points and currently has a debt/EBITDA ratio of three.2
Using an interest-increasing, accounting-based PPC, the company would agree to increase its
spread to 125 basis point should debt / EBITDA rise to 3.5 and to 150 basis points for a ratio of
5
1 Related prior theoretical research motivates the existence of PPC as a device to reduce the agency costs of debt (Tchistyi (2005). 2 Our example draws on Asquith et al. (2005), Beatty, Dichev and Weber (2002) and Demiroglu and James (2010).

4.0. Beyond debt/EBITDA of 4.5, the loan becomes due on demand. This is a relaxed covenant
as it gives the company slack should its debt ratio deteriorate. In contrast, with a tight covenant:
borrowing at LIBOR as before, the company would now agree that the loan becomes due on
demand if its debt/EBITDA ratio should rise to 3.5. Further interest-reducing provisions would
state that the spread would narrow to 75 basis points if the ratio falls to 2.5 and to 50 basis points
for a ratio of two.
The tighter covenant package consisting of a lower same-variable covenant provision and
an interest-decreasing PPC constitutes a signal that the firm expects its financial strength to
improve. Such signals are quite common. In their empirical study, Asquith et al. report that
interest-decreasing PPC is almost twice as prevalent as interest-increasing. As a positive signal,
we predict that interest-decreasing PPC should be associated with lower spreads. We report
strong empirical evidence supporting this prediction.
Third, we use matched pairs methodology and take advantage of a natural experiment to
control for self-selection bias that likely arises because, as discussed above, firm risk
characteristics influence the decision to introduce performance pricing as well as the selection of
design features: interest-increasing or decreasing, accounting or debt-rating-based. The natural
experiment arises from the common practice of structuring loan deals consisting of multiple loan
facilities issued on the same day with a common lead bank and set of participant lenders. Since
some of the facilities in a loan deal contain a PPC and others do not, we can compare the impact
of the PPC while holding borrower and lender characteristics constant. In employing matching
techniques, we follow earlier papers in the literature such as Helwege and Turner (1999),
Bharath (2002), and Gottesman and Roberts (2004 and 2007), among others.
6

Our study uses the Loan Pricing Corporation DealScan database of loans initiated from
1994 to 1999.3 Our key results are as follows. First, our pooled sample tests reveal that the
presence of a PPC of any type results in spreads that are 24.6 basis points lower than they would
be without the PPC. Similarly to prior studies, we also find that there are important differences in
borrower characteristics between loan facilities with and without PPCs.
Applying our matching technique we find that in its more refined control setting, the
presence of any PPC is associated with a reduction in spread of 40.4 basis points. Of the 1,078
matched pairs in our sample, 941 include an accounting-based PPC. For this set of pairs, the
average spread is 45.8 basis points lower with the PPC. In contrast, debt-rating-based PPCs
result in spreads that are only approximately 3-4 basis points lower than they would be without
the PPC, a difference that is only weakly statistically significant. We conclude that the rate
spread benefits associated with PPCs are mainly limited to accounting-based-PPCs. Our results
also provide compelling evidence that estimating the effect of loan contract terms such as PPCs
using pooled regressions can lead to estimation errors.
The rest of the paper is organized as follows. Section 2 discusses the data extraction and
matching methodology. Sections 3 and 4 present the univariate and multivariate tests,
respectively. Section 5 concludes.
2. Data extraction and matching methodology
7
3 Our study employs the Thomson Reuters Loan Pricing Corporation DealScan database of loans observed from 1994 to 1999. As mentioned in Carey and Nini (2007), LPC’s DealScan data collection efforts were focused primarily on the U.S. loan market until the late 1990s, thus our study should not be affected by European discount results identified in that paper.

We form two samples to examine the impact of PPCs on loan spreads. The first is a
pooled sample similar to Asquith et al. (2005). The second is a matched sample, the formation of
which we will describe below. We extract loan data from Loan Pricing Corporation’s DealScan
(LPC) database which contains numerous loan deals, each between a syndicate of lenders, or a
single lender, and a single borrower. Loan deals are typically composed of several individual
loan facilities that can differ based on size, security, maturity, spreads, covenants, and other loan
characteristics. The database reports 66,491 loan facilities. Of these, we eliminate all loan
facilities for which the key measure of loan spreads is missing: RATEAISD is defined as the
basis point coupon spread over LIBOR plus the annual fee and upfront fee, spread over the life
of the loan. Further, we eliminate any observation prior to 1994; as Asquith et al. (2005) note,
LPC reports comprehensive information about performance pricing beginning in 1994. As a
result of this filtering, 31,459 loan facilities remain, all with initiation dates during the time
period 1994 through 1999, inclusive. We designate this as the “pooled sample.”
For each of these loan facilities, we identify whether it has an accounting-based PPC
(ACCPPC), debt-rating-based PPC (DEBTPPC) or no PPC. Control variables encompass both
borrower and loan characteristics. Borrower characteristics include BWMD, the Moody’s senior
debt rating, where the non-missing ratings of Aaa through C are translated into an ordinal scale
ranging from 28 to 8.4 BONDRATE is an indicator variable that equals unity if the borrower has
a bond rating and zero otherwise. TICKER is an indicator variable that is equal to unity if the
borrower is publicly listed, as indicated through the availability of a ticker symbol on the LPC
database. BWSSIZE is the borrower’s sales size.
8
Loan characteristics include TFCMAT, months to maturity and AMTFCSIZ, the facility
size. The remaining loan characteristics are indicator variables. REVOLVER equals unity if the
4 All loan facilities in our sample are senior.

loan is a revolving loan. SYND equals unity if the loan is syndicated. The securitization status is
missing for a large proportion of observations; hence, we include both the SECURED and
SECUREDMISS variables, where SECURED is equal to unity if the loan is designated as
secured by the database and zero otherwise, while SECUREDMISS is equal to unity if the
securitization status is missing. We also extract controls for financial covenants. FCOVENT1-12
are indicator variables that are equal to unity if there is are coverage covenants based on the
fixed charge (FCOVENT1); debt service (FCOVENT2); interest (FCOVENT3); cash interest
(FCOVENT4); leverage ratio (FCOVENT5); debt-to-cash flow (FCOVENT6); senior debt-to-
cash flow (FCOVENT7); debt-to-tangible net worth (FCOVENT8); debt-to-equity
(FCOVENT9); current ratio (FCOVENT10); tangible net worth (FCOVENT11); and net worth
(FCOVENT12).5
We next create a matched sample, through identifying pairs of facilities that are
associated with a single loan deal, where one facility includes a PPC and the other does not. As
stated above, forming such pairs allows us to control for lender, borrower, and temporal
characteristics, as both elements of the pair are associated with the same lender(s), a single
borrower, and a single date. If a single loan deal consists of more than two facilities, then a
separate matched pair is identified for every combination of two facilities that differ on the basis
of the existence of a PPC. Following this methodology, we identify a matched sample of 1,078
pairs consisting of 941 pairs that contain a loan facility element that is identified as ACCPPC,
and 137 pairs that contain an element that is identified as DEBTPPC.
While the matched sample controls for all lender, borrower, and temporal characteristics,
it does not control for loan characteristics, and differences in such characteristics remain across
9
5 The DealScan database reports many additional loan contract variables, such as whether the loan represents refinancing, loan option, amendments, and general covenants. However, because these variables are reported for only a small proportion of the sample, we do not include them in our tests.

the two elements of the matched sample. One difference is welcomed - by design each pair
consists of one facility with a PPC, and another without. Other dissimilarities in loan
characteristics must be controlled, to ensure that differences between the two element groupings
are attributable to the status of the PPC alone. We control for differences in loan characteristics
through the inclusion of control variables in our multivariate tests.6
Our matching methodology offers a valuable alternative lens for viewing PPC along with
the potential to sharpen the focus of the study by Asquith et al. In particular, while they control
for the self-selection that may be introduced by the propensity to establish either interest-
increasing or interest decreasing performance pricing, such controls may be incomplete. Further,
they do not recognize any differences between accounting- and debt-rating based features and
their sample includes both. As a result, differences in risk unobservable to the econometrician
may persist. Should such risk differences be correlated with the choice of covenant type, they
may lead to biased results.
Descriptive statistics are presented in Table 1 for the full pooled and matched samples
tabulated by credit metric in Panel A and broken down between interest increasing and
decreasing in Panels B and C. The descriptive statistics in Panel A indicate that of the pooled
sample of 31,459 observations, 27% contain a PPC. More specifically, 22% have an ACCPPC
while only 5.% have a DEBTPPC. The matched sample consists of 2,156 observations, or two
for each of our 1,078 pairs. By construction, half of these observations have a PPC. Only 21% of
the borrowers in the pooled sample and 41% of the matched sample loan facilities are rated and
our multivariate tests will be performed separately for the rated and unrated facilities.
10
6 The results in this paper are also generally robust to unreported refinements whereby the matched sample is limited to those pairs where both elements share identical loan characteristics, such as securitization status, syndication, financial covenants, loan options, and loan type.

Panels B and C of Table 1 separate PPCs by the direction of adjustment. In Panel B, we
see that for accounting-based PPC, the majority of contracts are interest decreasing both for the
pooled and matched samples. The sample size declines because of missing information on the
specifics of the interest grids. In contrast, for debt-based PPC, Panel C reveals a balanced
distribution between interest-increasing and interest-decreasing PPC. More detailed discussion of
these results appears later in the paper.
TABLE 1 HERE
Table 2 reports the number of loan facility observations that we identify for each year,
the proportion of these observations with or without PPCs, and the proportion that are ACCPPC
and DEBTPPC. Depending on the year, as low as 18.66% (1994) and as high a 31.7% (1995) of
our loan facilities have a PPC. While ACCPPC does not show any temporal trend, the presence
of DEBTPCC in our sample exhibits a monotonic decrease from 7.53% in 1995 to 3.65% in
1999. This result might indicate decreasing usefulness of DEBTPCC compared to ACCPPC as
predicted above.
Table 2 shows the percentage of interest-increasing and decreasing PPC by year. There
does not appear to be any temporal trend.
TABLE 2 HERE
3. Univariate analysis
3.1. Impact of any performance pricing covenant
We begin our measurement of the impact of introducing any PPC with mean of difference tests
for the pooled sample of loan facility observations. Next we refine these results for a subsample
of matched pairs.
11

3.1.1. Pooled sample tests
For each variable, we calculate the difference of the mean variable value between those loan
facilities without PPCs and those with, and compute the Student’s t-statistic and Wilcoxon
Signed Rank statistic to determine whether any identified differences are significant. The results
of these tests are reported in Table 3. Our key finding is that loan facilities without PPCs are
associated with spreads that are 24.631 basis points higher than loan facilities with PPCs,
significant at the 1% level for both the t and Wilcoxon statistics.
TABLE 3 HERE
We find significant differences between the two groups of loan facilities for almost all other
variables as well. These differences are all at the 1% level forthe t and Wilcoxon tests with the
exception of some financial covenants. We find that lower risk borrowers with higher bond
ratings are more likely to avoid PPCs consistent with the covenant signaling hypothesis. This
result is clouded by the fact that loan facilities without PPCs are more commonly associated with
borrowers whose bond rating is missing; hence the full risk effect is uncertain. We find that loan
facilities without PPCs are less frequently associated with publicly traded firms, and are
associated with smaller borrowers. We also find that loan facilities without PPCs are shorter and
smaller than loan facilities with PPCs, and less often are revolvers or syndicated loans. These
pooled sample results are generally consistent with Asquith, et al. (2005). They indicate that
performance pricing tends to be included in loans with higher re-contracting, adverse selection,
and moral hazard costs, such as syndicated loans, revolving loan facilities, loans used for
takeover purpose, and loans with longer maturities.
Further, loan facilities without PPCs are less often secured. But as we found for rating, this
result is blurred by the tendency for loan facilities without PPCs to be associated with borrowers
12

whose securitization status is missing; hence the full securitization effect is uncertain. Finally,
we find that loan facilities without PPCs are generally less likely to include financial covenants.
This is consistent with Beatty, et al. (2002) who report that the typical contract sets the initial
pricing at the high-cost end of the performance pricing grid to handle credit improvements, while
a same-variable covenant is set tightly beyond the top of the grid to handle credit deteriorations.
In brief, while the results in Table 3 constitute strong evidence that loan facilities without
PPCs have higher spreads than their counterparts with PPCs, the two samples are widely
disparate. To control for disparities related to borrower characteristics as well as for unobserved
lender differences, we turn to matched pair tests.
3.1.2 Matched pairs tests
Difference of means tests using our matched sample control more effectively for non-spread
differences between loan facilities without and with PPCs. The results of these tests for all PPC
are reported in Table 4 (columns 1-3). By construction, there is no difference in all borrowers’
characteristics (BWMD, BONDRATE, TICKER, and BWSSIZE) between the elements in any
pair. Further, within each pair, the lead bank and participant lenders are identical so we also
control for any unobserved variation in lender features.
TABLE 4 HERE
Since some matched samples contain a small number of observations possibly resulting in a
violation of the assumption of normality underlying the parametric Student’s t test, we also
conduct nonparametric Wilcoxon tests. The key result of higher spreads for loan facilities
without PPCs reported for the pooled sample holds more strongly for the sample of all PPC
matches: the mean difference in spread for the matched sample here is 40.420 basis points in
comparison to 24.631 basis points for the pooled sample in Table 3. While our matched sample
13

methodology controls for borrower characteristics, we continue to identify significant differences
between the two groups of loan facilities for other variables besides the spread. For the sample of
all matches, opposite to our finding for the pooled sample, we find that loan facilities without
PPCs bear longer maturities than loan facilities with PPCs, significant at the 1% level for both
the t and Wilcoxon statistics. Similarly to our finding for the pooled sample, loan facilities
without PPCs are smaller than loan facilities with PPCs, and are less likely to be revolvers,
significant at the 1% level for both the t and Wilcoxon statistics. We do not find significant
differences for syndication.
To summarize, the difference of means tests for the matched sample demonstrate that loan
facilities without PPCs are associated with even higher spreads under the refined control setting
associated with matched pairs. Finally, there continue to be significant loan characteristic
differences between loan facilities with and without PPCs. In Section 4 we perform multivariate
tests to control for these differences.
3.2. Accounting-based vs. debt-rating based performance pricing covenants
Table 1 supports Doyle’s (2003) characterization of firms with ACCPPC as riskier with
higher average spreads and lower bond ratings than borrowers with DEBTPPC. Further,
borrowers with ACCPPC are less likely to have a bond rating or to be listed on a stock exchange.
These borrowers are also smaller and more likely to borrow on a secured basis. These differences
are statistically significant for both the pooled and matched samples.
Based on the riskier profile of borrowers using ACCPPC, the covenant signaling hypothesis
suggests that the inclusion of a PPC will reduce spreads by a greater amount than for borrowers
with DEBTPPC. The results in Table 4 support this hypothesis: for ACCPPC matches, loan
14

facilities without PPCs are associated with spreads that are 45.762 basis points higher than loan
facilities with PPCs, significant at the 1% level of the t and Wilcoxon statistics. But for
DEBTPPC matches, loan facilities without PPCs are associated with spreads that are only 3.728
basis points higher than loan facilities without PPCs. Further, this result is only significant for
the t-statistic, and at the 5% level. While these results support our hypothesis, it remains for
multivariate tests to control for differences within pairs on loan characteristics also documented
in Table 4.
3.3 Interest-increasing vs. interest-decreasing performance pricing covenants As stated above, tearsheets describing the pricing grids are required to identify interest-
increasing (INTINCR) and interest-decreasing (INTDECR) features in PPCs. These are available
for a subset of loan facilities for which summary statistics appear in Table 1, sorted by ACCPPC
(panel B) and DEBTPPC (panel C). Interest-decreasing PPC is more far more common and the
imbalance is due to the far larger ACCPCC subset: there are a total of 429 cases of INTINCR
and 787 observations of INTDECR in the pooled sample and 24 INTINCR and 230 INTDECR
for the matched pairs. In contrast, for DEBTPPC, the two types are fairly evenly matched with
134 INTINCR and 140 INDECR in the pooled sample and 8 INTINCR and 12 INTDECR in the
paired sample. This imbalance is similar to that reported in Asquith et al .(2005).
15

We show earlier that ACCPPC borrowers are riskier. Taken with their preponderant use
of INTDECR over INTINCR PPC, this suggests that INCTDECR borrowers are riskier. Table 1
verifies this idea: in the ACCPPC subsample in panel B, we see that borrowers with INTDECR
have higher spreads, lower bond ratings and are more likely to use security – all consistent with
higher risk.
Further, the descriptive statistics support the view that, of the two types of PPC,
INTDECR represents a tighter constraint especially for the ACCPPC subset. For more relaxed
INTINC PPC, most cases (89% for the pooled sample and 88% for the matched sample) also
include an INTDECR provision indicating that the accounting variable can move in either
direction before reaching the end of the grid and a constraining covenant. In contrast, for
INTDECR, far fewer cases also include an INTINCR provision (48% for the pooled sample and
only 9% for the matched sample). This means that most INTDECR PPCs lack an interest-
increasing provision and are set at the edge of the grid tightly bounded by a same-variable
covenant.
As a tight covenant, we predict that inclusion of an INDECR PPC is expected to reduce
spreads according to the covenant signaling hypothesis. The matched pair tests in Table 4, Panel
B support our prediction: INTDECR PPC is associated with a lower spread of 50.4 basis points
while for INTINCR PPC the spread is lower by only 28.2 basis points. The samples in Table 4,
Panel B include both ACCPPC and DEBTPPC. The 32 INTCR pairs include 24 ACCPPC and 8
DEBTPPC. For INTDECR, the numbers are 230 and 12, respectively. The predominance of
ACCPPC suggests that the spread-decreasing role of INTDECR PPC derives from the features of
borrowers selecting ACCPPC as discussed above. Table 4, Panel B also shows that the signaling
effect exceeds the magnitude of the credit adjustment option which imparts a positive value to
16

INTINCR PPC. While this reinforces the importance of covenant signaling, we must interpret
the comparison of magnitudes with caution because the INTDECR subsample contains a larger
weighting of ACCPPC for which the effect should be stronger.
Overall, this section of our matched pairs tests reinforces the results in Asquith et al.
(2005) assigning a spread-reducing role to INTINCR PPC. This type of PPC provides a valuable
option to lenders for which borrowers are compensated. For INTDECR PPC, however, our
results are opposite to those of Asquith et al. who report a small positive impact of INTDECR on
spreads which they attribute to charging borrowers for lower renegotiation costs. In contrast, we
find a negative influence strongly significant both statistically and economically and consistent
with the covenant signaling hypothesis. In particular, by separating ACCPPC and DEBTPPC in
our tests, we show that the higher risk profile of borrowers using ACCPPC reinforces the
covenant signaling effect. While this separation of different PPC types in pricing tests constitutes
a unique contribution of the present paper, it cannot explain why we obtain results opposite to
those of Asquith et al. because their sample also includes predominantly ACCPPC. Rather, the
difference must lie in the effectiveness of risk controls.
Such controls are necessary due to the higher risk profiles of borrowers with INTDECR
documented above. To control for selection bias that could arise due to different risk levels,
Asquith et al. employ probit regressions predicting the propensity to use INTINCR and
INTDECR PPC. In this paper, we control for risk differences through matched pairing. Our
approach improves on Asquith et al. by allowing for perfect controls of borrower risk as well as
of unobserved lender risk. This suggests that the positive coefficient on INTDECR (increasing
spread) in their study may be due to unobservable risk imperfectly controlled. An alternative
explanation is that our finding that INTDECR PPC is associated with lower spreads is biased due
17

to imperfect controls for differences in loan features such as maturity and security. To
distinguish between these explanations requires multivariate testing.
3.4 Nonparametric univariate counting tests
The results of the univariate tests discussed so far demonstrate that through using the
matched pair methodology, we are able to create two groups that are highly similar. The
parametric difference of means tests discussed above provide strong evidence that loan facilities
without ACCPPCs have spreads that are approximately 45.762 basis points higher than loan
facilities with ACCPPCs, while the difference between loan facilities without and with
DEBTPPCs is only 3.728 basis points. These results in Table 4 remain significant at the 99%
level employing nonparametric Wilcoxon tests. For further checking, we next count the number
of times that the loan facility without PPCs of the matched pairs is associated with higher,
identical, or lower spreads, than the paired loan facility with the PPC. We report the results of
these counting tests in panels A (all matched pairs), B (ACCPPC) and C (DEBTPPC) of Table 5
separately for matched pairs associated with borrower Moody’ senior debt ratings of A, B, C,
and unrated. We also tabulate the percentage higher, identical, lower, and the number of pairs for
each sample.
TABLE 5 HERE
For the all PPC and ACCPPC matched pair samples in Table 5, we find further strong
evidence that loan facilities without PPCs are associated with higher spreads than the those with
PPCs. Overall, for 71% of all matched pairs and 79% of ACCPPC matched pairs, the loan
facility without the PPC is associated with higher spreads than the loan facility with the PPC,
while the reverse is true for only 10% and 9% of the matched pairs, respectively. We find similar
18

results for the A, B, C, and unrated borrower cases, with the exception of the A-rated case for the
all PPC matched pair sample. In this case, we find a very large proportion where spreads are
identical for both elements in the pair. This indicates that performance pricing is not as beneficial
to high quality borrowers.
The results for the DEBTPPC matched pair sample are more ambiguous, and correspond
to our findings for the parametric difference of means tests. Overall, 12% of matched pairs
exhibit higher spreads for the loan facility without the PPC over the loan facility with the PPC,
while the reverse is true in 18% of the matched pairs. More interestingly, spreads are identical in
70% of the matched pairs. These results are generally consistent for borrowers rated A, B, and
unrated. There are no observations in this sample where the borrower is rated C.
In summary, the nonparametric counting tests in Table 5 confirm that loan spreads are
typically higher for loans without PPC (Panel A), and without ACCPPC matched pairs (Panel B),
and typically identical for DEBTPPC matched pairs (Panel C). Counting tests also reinforce the
greater impact on spreads of interest-decreasing PPC (Panel E).
4. Multivariate tests
This section reports our multivariate tests. Table 6 presents the correlations between the
variables used in the regression tests.
TABLE 6 HERE
To test the core spread-PPC relation, all of the regression tests use spreads as the
dependent variable, and include indicator variables for the presence of the PPCs as independent
variables, as well as other independent variables that are included as controls. For each sample,
we estimate three regression models imposing different restrictions in turn. The first model tests
19

the relation between the dependent variable and all variables. The second removes the control for
loan facility maturity, TFCMAT. The third model reinstates TFCMAT and removes the controls
for securitization, SECURED and SECUREDMISS. The justification for excluding maturity and
security from some regressions is that they are jointly determined along with the spread and the
inclusion and type of performance pricing. We therefore exclude these variables from some
regressions to ensure that our results are robust in the possible presence of endogeneity.
We perform the regressions separately for the pooled, ACCPPC, and DEBTPPC matched
pair samples as well as for the matched interest-increasing and decreasing samples. We further
refine the regressions through testing the model for two groupings of facilities; those for which
debt rating is provided (Table 7), and those loan facilities that are unrated (Table 8). Hence the
regressions in Table 7 exclude the BONDRATE variable, as all loan facility observations tested
in this table are rated. Similarly, the regressions in Table 8 exclude both the BWMD and
BONDRATE variables, as all observations tested in this table are unrated.
TABLE 7 HERE
TABLE 8 HERE
4.1. Regression tests, pooled sample
The results for the pooled sample are reported in columns 1-3 of Tables 7, Panel A
(rated) and Table 8, Panel A (unrated). For both groupings, there is strong evidence that both
ACCPPC and DEBTPPC covenants reduce spreads. The results are similar when all controls are
used and when TFCMAT is excluded, columns (1) and (2), respectively. For the rated grouping
(Table 7), the coefficients associated with ACCPPC are –24.56 and –22.12 when all controls are
used and when TFCMAT is excluded, respectively, while the coefficients associated with
20

DEBTPPC are –26.21 and –27.27 when all controls are used and when TFCMAT is excluded.
These results are significant at the 1% level. For the unrated grouping (Table 8), the coefficients
associated with ACCPPC are –27.72 and –29.21 when all controls are used and when TFCMAT
is excluded, respectively, while the coefficient associated with DEBTPPC is –29.64 and –30.36
when all controls are used and when TFCMAT is excluded. These results are significant at the
1% level. When SECURED and SECUREDMISS are excluded, column (3), spreads remain
lower in the presence of both ACCPPC and DEBTPPC, though smaller in magnitude for
ACCPPC and larger in magnitude for DEBTPPC. For the rated grouping (Table 7), the
coefficient values are –7.14 and –29.89 for ACCPPC and DEBTPPC, respectively, significant at
the 1% level. For the unrated grouping (Table 8), the coefficient values are –11.58 and –43.64
for ACCPPC and DEBTPPC, respectively, significant at the 1% level.
4.2. Regression tests, ACCPPC and DEBTPPC matched samples
The above results suggest that both ACCPPC and DEBTPPC are associated with lower
spreads than are loan facilities without PPCs. Yet as we demonstrated in Section 3, there are
many important differences between the with- and without-PPC samples; hence even in a
multivariate setting these results may be attributable to differences unrelated to the presence or
absence of PPCs. If, however, as hypothesized, these results flow the presence of PPCs, then
they should continue to hold in the more refined control setting that we created using our
matching methodology.
The results for the ACCPPC matched sample are presented in columns 4-6 of Table 7,
Panel A (rated) and Table 8, Panel A (unrated) and provide strong evidence that ACCPPC results
in lower spreads. For the rated grouping (Table 7), the coefficients associated with ACCPPC are
21

–29.98 and –36.92 when all controls are used (column 4) and when TFCMAT is excluded
(column 5), respectively, while the coefficient associated with ACCPPC for the unrated grouping
(Table 8) is –36.26 and –42.92 when all controls are used and when TFCMAT is excluded.
These results are significant at the 1% level. When SECURED and SECUREDMISS are
excluded, column (6), the coefficient values associated with ACCPPC are –28.67 and –27.93 for
the rated and unrated groupings, respectively, significant at the 1% level.
The results for the DEBTPPC matched sample are presented in columns 7-9 of Table 7,
Panel A (rated) and Table 8, Panel A (unrated). These findings provide strong evidence that
DEBTPPC does not result in lower spreads, similar to our results for the univariate tests. The
significance associated with the DEBTPPC coefficient in the pooled sample tests vanishes in the
matched sample consistent with the view that DEBTPCC does not have significant loan spread
effects. Loan spread differences found in the pooled sample are attributable to differences in
other variables, such as lender and borrower characteristics, thus, after controlling for these
differences in our matched samples, loan spread effects disappear for DEBTPCC. . This result
provides strong support for our contention that the matched sample represents a refinement of
the pooled sample tests, and clearly indicates that the spread advantage associated with PPCs is
limited to ACCPPs.
4.3. Regression tests, INTINCR and INTDECR matched samples
We also conduct similar regressions for the matched samples of INTINCR and INTDECR
PPC for the rated (Table 7, Panel B) and unrated samples (Table 8, Panel B). The results for
interest-increasing PPC are in columns 1-3 of Panel B of the respective tables. For the rated
subsample, none of the INTINCR coefficients is significant: for the INTDECR subsample, the
ACCPPC coefficients are similar to those for all ACCPPC in Panel A of Table 7. This reinforces
22

two earlier conclusions: first, interest-decreasing PPC has a greater impact on spreads and
second, accounting-based PPC is more effective in controlling information asymmetry and
reducing spreads.
Turning to the unrated subsample (Table 8, Panel B) , the conclusions are similar: only one of
three coefficients for INTINCR is significant at the 99% level while INTDECR PPC generally is
associated with a significantly lower spread for ACCPPC.
4.4 Control variables
As expected, in Tables 7 and 8 we find that spreads are lower for higher rated, publicly
traded, and larger borrowers, though the coefficients associated with the variable that measures
public trading, TICKER, is generally insignificant for the ACCPPC matched sample, for both
rated and unrated groupings, and is generally insignificant for the DEBTPPC matched sample,
for the unrated grouping. We also generally find a positive relation between spreads and facility
maturity for the rated grouping. For the pooled sample and ACCPPC matched sample, we find
strong evidence of lower spreads associated with revolvers, and find weak evidence of a positive
relation between spreads and syndication for the pooled sample. We find strong evidence of
higher spreads associated with securitization, reflecting the earlier literature, and also find broad
evidence of higher spreads for facilities for which securitization status is missing. Finally,
spreads are generally unrelated to financial covenants, with some exceptions.
5. Conclusions
Performance pricing covenants (PPC) are predicted to reduce loan spreads as they serve
to control costs associated with asymmetric information, adverse selection, moral hazard and
recontracting (Asquith et al. (2005)). This paper tests and supports this view using a carefully
23

matched sample of loan facilities initiated between 1994 and 1999 and documented in the Loan
Pricing Corporation DealScan database.
Our main new result is that the type of performance pricing matters: compared against
controls, loans with accounting-based performance pricing enjoy significantly lower spreads
while we detect only small and weakly significant differences in loans which base performance
pricing on debt ratings. After controlling for borrower and lender characteristics, accounting-
based PPC results in spreads that are approximately 45 basis points lower than they would be
without the PPC in univariate tests, and ranges from 30-35 in subsequent multivariate tests. In
contrast, debt-rating-based PPC results in spreads that are only approximately 5 basis points
lower than without the PPC, a difference that is statistically significant at a lower confidence
level and which is largely insignificant in subsequent multivariate tests of the debt-rating based
PPC matched pair sample. These results reflect the role of PPC in resolving information
asymmetry which is more prevelant in riskier borrowers more likely to employ accounting-based
covenants. Further, they are also consistent with Doyle (2003) who suggests that accounting
ratios are more timely reflectors of changes in credit quality. While accounting ratios are updated
quarterly, debt ratings are revised at most every six months except when a firm experiences a
crisis. Accordingly, accounting ratios are more sensitive and better reflect changes in borrowers’
credit risk and therefore, accounting-based performance pricing adds more value than debt-rating
based. .
In addition, our paper identifies interest-decreasing PPC as a tight covenant in the
covenant signaling framework of Demiroglu and James (2010) in which firms take on tight
covenants as a signal that their financial condition will improve. This leads to the prediction,
24

strongly supported in our tests, that interest-decreasing PPC should be associated with lower
spreads.
Finally, our matching methodology uncovers an interesting empirical regularity. Firms
often take out several loan facilities from the same lenders on the same day and typically include
a performance pricing feature in the shorter-maturity loan only. This finding contrasts with
Asquith et al. (2005) who report that the probability of employing performance-pricing increases
with maturity. According to our results, performance pricing tends most often to be a feature of
loans with shorter maturities. This is consistent with the notion that borrowers have limited
ability to predict their performance far into the future. Thus, for longer-maturity loans, borrowers
might be unwilling to reduce their initial borrowing costs by including performance pricing
fearing that, if their performance deteriorated in the future, loan spreads would increase resulting
in higher ex post borrowing costs. For loans with shorter maturities, borrowers are likely able to
predict their companies’ performance with more confidence and if they think that their
companies’ performance will get better, or at least not get worse, they will be willing to include
performance pricing in their loan contracts and obtain lower loan spreads. Put another way, firms
balance the signaling benefits of performance pricing against the danger of facing higher costs in
future if the signal is false. Since uncertainty in forecasts increases with the time horizon, there is
a point beyond which performance pricing is seen as too risky. Testing this conjecture is left for
future research.
Further, we find that firms enjoy significant spread reduction from usage of performance
pricing covenants, particularly accounting based PPCs, and this raises the question why firms do
not use PPCs more extensively. . In addition, it is worth examining whether there are any firms
25

utilizing both accounting based and debt-rating based performance pricing covenants within the
same deal package. We leave these interesting issues for future research.
Acknowledgements
The authors received helpful comments from Andy Naranjo and from audiences at Concordia
University and the Financial Management Association 2011 European Conference. The Social
Sciences and Humanities Research Council provided financial support for this research.
26

References
Asarnow, E. 1995. Measuring the Hidden Risks in Corporate Loans. Commercial Lending Review 10. 24-32.
Asquith, P., A. Beatty, J. Weber. 2002. Performance Pricing in Debt Contracts. Journal of
Accounting and Economics 40 (Issues 1-3, December), 101-128. Beatty, A., I.D. Dichev, J. Weber. 2002. The Role and Characteristics of Accounting-Based
Performance pricing in Private Debt Contracts. Working Paper. Penn State University, University of Michigan, and MIT. June.
Bharath, Sreedhar T. 2002. Agency costs, bank specialness and renegotiation, Working Paper,
New York University. Carey, M., and G.Nini. 2007. Is the Corporate Loan Market Globally Integrated? A Pricing
Puzzle. Journal of Finance 62(6), 2969-3007. Demiroglu, Cem and Christopher M. James. 2010. The Information Content of Bank Loan
Covenants. Review of Financial Studies 23 (10), 3700-3737. Doyle, J.T. 2003. Credit Risk Measurement and Pricing in Performance pricing-Based Debt
Contracts. Working Paper. University of Michigan. Fridson, Martin. 2010. Bond Rating Agencies: Conflicts and Competence. Journal of Applied
Corporate Finance, Vol. 22, Issue 3, pp. 56-64, Summer . Gottesman. A.A., and G.S. Roberts. 2004. Maturity and Corporate Loan Pricing. Financial
Review (February). ---, 2007. Loan Rates and Collateral. Financial Review 42, 401-427. Helwege, Jean and Christopher M. Turner. 1999. The slope of the credit yield curve for
speculative-grade issuers, Journal of Finance 54 (October), 1869-1884. Loomis, F.A. 1991. Performance-Based Loan Pricing Techniques. Journal of Commercial Bank
Lending 74. 2. 7-11. Panyagometh, K., and G.S. Roberts. 2010. Do Lead Banks Exploit Syndicate Participants?
Evidence from Ex Post Risk. Financial Management (Spring), 273-299. Tchistyi, Alexei, Security Design with Correlated Hidden Cash Flows: The Optimality of
Performance Pricing (October 3, 2005). Available at SSRN: http://ssrn.com/abstract=875900
27
28
Table 1: Descriptive statistics for each variable. The number of observations, mean value and standard deviation for each variable are reported for both the full and matched paired samples, for the following samples: For all observations, ACCPPC, and DEBTPPC (Panel A); for observations that are both ACCPPC and INTINCR and observations that are both ACCPPC and INTDECR (Panel B); and for observations that are both DEBTPPC and INTINCR and observations that are both DEBTPPC and INTDECR (Panel C). Variable definitions are as follows: All PPC is an indicator variable that is equal to unity if the loan facility has a performance pricing covenant (PPC). ACCPPC and DEBTPPC are indicator variables that are equal to unity if the loan facility has an accounting-based PPC or debt-rating-based PPC, respectively. INTINCR and INTDECR are indicator variables that are equal to unity if the loan facility’s PPC is interest increasing or interest decreasing, respectively. RATEAISD is the basis point coupon spread over LIBOR plus the annual fee and upfront fee, spread over the life of the loan. BWMD is the Moody’s senior debt rating, where the nonmissing ratings of Aaa through C are translated into an ordinal scale ranging from 28 to 8. BONDRATE is an indicator variable that equals unity if the borrower has a bond rating. TICKER is an indicator variable that is equal to unity if the borrower has a ticker symbol. BWSSIZE is the borrower’s sales size. TFCMAT is the months to maturity. AMTFCSIZ is the facility size. REVOLVER and SYND are indicator variables that equal unity if the loan is a revolving loan or syndicated, respectively. SECURED and SECUREDMISS are indicator variables that equal to unity if the loan is designated as secured by the database or if the securitization status is missing, respectively. FCOVENT1-12 are indicator variables that are equal to unity if there is are coverage covenants based on the fixed charge (FCOVENT1); debt service (FCOVENT2); interest (FCOVENT3); cash interest (FCOVENT4); leverage ratio (FCOVENT5); debt-to-cash flow (FCOVENT6); senior debt-to-cash flow (FCOVENT7); debt-to-tangible net worth (FCOVENT8); debt-to-equity (FCOVENT9); current ratio (FCOVENT10); tangible net worth (FCOVENT11); and net worth (FCOVENT12).

Panel A: All observations, ACCPPC observations, and DEBTPPC observations. Pooled Sample Matched Sample All ACCPPC DEBTPPC All ACCPPC DEBTPPC Number Mean Std. Number Mean Std. Number Mean Std. Number Mean Std. Number Mean Std. Number Mean Std.
All PPC 31,459 0.27 0.45 6,894 1.00 0.00 1,679 1.00 0.00 2,156 0.50 0.50 941 1.00 0.00 137 1.00 0.00 ACCPPC 31,459 0.22 0.41 6,894 1.00 0.00 1,679 0.00 0.00 2,156 0.44 0.50 941 1.00 0.00 137 0.00 0.00 DEBTPPC 31,459 0.05 0.22 6,894 0.00 0.00 1,679 1.00 0.00 2,156 0.06 0.24 941 0.00 0.00 137 1.00 0.00 INTINCR 1,022 0.56 0.50 836 0.51 0.50 151 0.89 0.32 245 0.13 0.34 233 0.10 0.30 12 0.67 0.49 INTDECR 1,022 0.94 0.24 836 0.94 0.24 151 0.93 0.26 245 0.99 0.11 233 0.99 0.11 12 1.00 0.00 RATEAISD 31,459 183.78 125.06 6,894 188.97 91.50 1,679 71.01 58.22 2,156 240.29 109.01 941 241.25 71.25 137 74.66 87.09 BWMD 6,679 18.12 3.75 1,726 15.95 2.48 1,182 20.24 2.54 888 16.53 3.40 344 15.20 2.14 100 21.09 2.97 BONDRATE 31,459 0.21 0.41 6,894 0.25 0.43 1,679 0.70 0.46 2,156 0.41 0.49 941 0.37 0.48 137 0.73 0.45 TICKER 31,459 0.39 0.49 6,894 0.56 0.50 1,679 0.73 0.44 2,156 0.49 0.50 941 0.45 0.50 137 0.75 0.43 log(BWSSIZE) 20,737 19.68 1.88 6,036 19.54 1.38 1,555 21.31 1.58 1,850 20.12 1.68 798 19.82 1.50 127 21.95 1.59 TFCMAT 26,725 51.35 107.66 6,781 57.88 25.47 1,667 43.44 22.91 2,119 68.84 31.42 925 67.71 25.58 136 57.14 31.34 log(AMTFCSIZ) 31,459 17.97 1.62 6,894 18.04 1.34 1,679 19.73 1.15 2,156 18.30 1.36 941 18.18 1.18 137 20.01 1.18 REVOLVER 31,459 0.58 0.49 6,894 0.64 0.48 1,679 0.71 0.45 2,156 0.33 0.47 941 0.53 0.50 137 0.85 0.36 SYND 31,407 0.88 0.33 6,894 0.92 0.27 1,679 0.99 0.08 2,156 0.97 0.18 941 0.97 0.17 137 0.96 0.21 SECURED 31,459 0.39 0.49 6,894 0.70 0.46 1,679 0.16 0.36 2,156 0.75 0.43 941 0.85 0.35 137 0.12 0.33 SECUREDMISS 31,459 0.51 0.50 6,894 0.17 0.38 1,679 0.31 0.46 2,156 0.18 0.38 941 0.13 0.33 137 0.42 0.49 FCOVENT1 31,459 0.05 0.21 6,894 0.05 0.22 1,679 0.07 0.25 2,156 0.05 0.22 941 0.05 0.22 137 0.09 0.29 FCOVENT2 31,459 0.03 0.16 6,894 0.03 0.17 1,679 0.04 0.19 2,156 0.03 0.17 941 0.03 0.17 137 0.02 0.15 FCOVENT3 31,459 0.05 0.22 6,894 0.05 0.23 1,679 0.06 0.23 2,156 0.05 0.22 941 0.05 0.22 137 0.07 0.25 FCOVENT4 31,459 0.00 0.05 6,894 0.00 0.06 1,679 0.00 0.05 2,156 0.00 0.04 941 0.00 0.05 137 0.01 0.12 FCOVENT5 31,459 0.02 0.15 6,894 0.03 0.16 1,679 0.03 0.16 2,156 0.03 0.16 941 0.03 0.18 137 0.04 0.19 FCOVENT6 31,459 0.05 0.22 6,894 0.06 0.24 1,679 0.07 0.26 2,156 0.06 0.23 941 0.06 0.24 137 0.09 0.29 FCOVENT7 31,459 0.01 0.10 6,894 0.01 0.11 1,679 0.01 0.10 2,156 0.01 0.11 941 0.01 0.10 137 0.01 0.09 FCOVENT8 31,459 0.03 0.17 6,894 0.03 0.18 1,679 0.04 0.20 2,156 0.03 0.18 941 0.03 0.18 137 0.01 0.12 FCOVENT9 31,459 0.00 0.05 6,894 0.00 0.06 1,679 0.00 0.05 2,156 0.01 0.08 941 0.01 0.09 137 0.01 0.09 FCOVENT10 31,459 0.02 0.15 6,894 0.02 0.16 1,679 0.03 0.17 2,156 0.03 0.16 941 0.03 0.17 137 0.01 0.12 FCOVENT11 31,459 0.04 0.20 6,894 0.05 0.21 1,679 0.06 0.23 2,156 0.04 0.21 941 0.04 0.19 137 0.03 0.17 FCOVENT12 31,459 0.03 0.18 6,894 0.04 0.19 1,679 0.05 0.21 2,156 0.04 0.21 941 0.05 0.22 137 0.01 0.12
29

Panel B: observations that are both ACCPPC and INTINCR and observations that are both ACCPPC and INTDECR. Pooled Sample Matched Sample
ACCPPC and INTINCR ACCPPC and INTDECR ACCPPC and INTINCR ACCPPC and INTDECR
Number Mean Std. Number Mean Std. Number Mean Std. Number Mean Std. All PPC 429 1.00 0.00 787 1.00 0.00 24 1.00 0.00 230 1.00 0.00 ACCPPC 429 1.00 0.00 787 1.00 0.00 24 1.00 0.00 230 1.00 0.00 DEBTPPC 429 0.00 0.00 787 0.00 0.00 24 0.00 0.00 230 0.00 0.00 INTINCR 429 1.00 0.00 787 0.48 0.50 24 1.00 0.00 230 0.09 0.29 INTDECR 429 0.89 0.32 787 1.00 0.00 24 0.88 0.34 230 1.00 0.00 RATEAISD 429 137.57 70.87 787 183.04 77.97 24 188.85 96.25 230 242.72 46.43 BWMD 151 16.66 2.53 346 15.93 2.28 7 14.14 1.46 105 15.40 1.39 BONDRATE 429 0.35 0.48 787 0.44 0.50 24 0.29 0.46 230 0.46 0.50 TICKER 429 0.64 0.48 787 0.60 0.49 24 0.54 0.51 230 0.44 0.50 log(BWSSIZE) 409 20.49 1.06 754 20.39 1.14 22 20.42 0.66 215 20.50 1.37 TFCMAT 426 62.79 19.27 783 66.07 18.49 24 51.58 19.28 229 67.03 13.60 log(AMTFCSIZ) 429 19.00 0.89 787 18.83 0.95 24 18.55 0.72 230 18.62 1.01 REVOLVER 429 0.63 0.48 787 0.56 0.50 24 0.63 0.49 230 0.47 0.50 SYND 429 1.00 0.00 787 1.00 0.04 24 1.00 0.00 230 1.00 0.00 SECURED 429 0.68 0.47 787 0.80 0.40 24 0.79 0.41 230 0.96 0.20 SECUREDMISS 429 0.11 0.31 787 0.09 0.28 24 0.17 0.38 230 0.04 0.20 FCOVENT1 429 0.03 0.18 787 0.04 0.19 24 0.00 0.00 230 0.05 0.21 FCOVENT2 429 0.03 0.16 787 0.02 0.15 24 0.08 0.28 230 0.01 0.09 FCOVENT3 429 0.04 0.19 787 0.04 0.19 24 0.00 0.00 230 0.05 0.22 FCOVENT4 429 0.00 0.05 787 0.01 0.07 24 0.00 0.00 230 0.00 0.00 FCOVENT5 429 0.03 0.17 787 0.02 0.15 24 0.00 0.00 230 0.03 0.17 FCOVENT6 429 0.03 0.17 787 0.04 0.19 24 0.04 0.20 230 0.04 0.20 FCOVENT7 429 0.00 0.07 787 0.00 0.06 24 0.00 0.00 230 0.00 0.00 FCOVENT8 429 0.04 0.21 787 0.04 0.19 24 0.21 0.41 230 0.02 0.15 FCOVENT9 429 0.00 0.05 787 0.01 0.07 24 0.00 0.00 230 0.03 0.16 FCOVENT10 429 0.02 0.14 787 0.02 0.14 24 0.13 0.34 230 0.01 0.11 FCOVENT11 429 0.05 0.23 787 0.04 0.19 24 0.21 0.41 230 0.03 0.17 FCOVENT12 429 0.03 0.17 787 0.03 0.16 24 0.00 0.00 230 0.09 0.28
30

Panel C: observations that are both DEBTPPC and INTINCR and observations that are both DEBTPPC and INTDECR. Pooled Sample Matched Sample
DEBTPPC and INTINCR DEBTPPC and INTDECR DEBTPPC and INTINCR DEBTPPC and INTDECR
Number Mean Std. Number Mean Std. Number Mean Std. Number Mean Std. All PPC 134 1.00 0.00 140 1.00 0.00 8 1.00 0.00 12 1.00 0.00 ACCPPC 134 0.00 0.00 140 0.00 0.00 8 0.00 0.00 12 0.00 0.00 DEBTPPC 134 1.00 0.00 140 1.00 0.00 8 1.00 0.00 12 1.00 0.00 INTINCR 134 1.00 0.00 140 0.88 0.33 8 1.00 0.00 12 0.67 0.49 INTDECR 134 0.92 0.28 140 1.00 0.00 8 1.00 0.00 12 1.00 0.00 RATEAISD 134 64.55 49.53 140 79.39 70.73 8 83.44 79.54 12 166.04 141.75BWMD 96 19.38 1.90 93 19.24 1.89 5 20.60 3.29 5 20.60 3.29 BONDRATE 134 0.72 0.45 140 0.66 0.47 8 0.63 0.52 12 0.42 0.51 TICKER 134 0.74 0.44 140 0.72 0.45 8 0.63 0.52 12 0.58 0.51 log(BWSSIZE) 130 21.66 1.27 135 21.63 1.30 8 21.31 1.68 12 20.94 1.46 TFCMAT 134 45.19 21.32 140 46.14 21.84 8 53.88 21.24 12 61.83 21.85 log(AMTFCSIZ) 134 20.12 0.92 140 20.04 0.96 8 20.28 1.31 12 19.52 1.58 REVOLVER 134 0.67 0.47 140 0.66 0.47 8 0.75 0.46 12 0.67 0.49 SYND 134 0.99 0.09 140 0.99 0.08 8 1.00 0.00 12 1.00 0.00 SECURED 134 0.12 0.33 140 0.19 0.39 8 0.13 0.35 12 0.42 0.51 SECUREDMISS 134 0.15 0.36 140 0.15 0.36 8 0.25 0.46 12 0.17 0.39 FCOVENT1 134 0.07 0.26 140 0.09 0.29 8 0.00 0.00 12 0.00 0.00 FCOVENT2 134 0.02 0.15 140 0.02 0.15 8 0.00 0.00 12 0.00 0.00 FCOVENT3 134 0.03 0.17 140 0.05 0.22 8 0.00 0.00 12 0.08 0.29 FCOVENT4 134 0.00 0.00 140 0.00 0.00 8 0.00 0.00 12 0.00 0.00 FCOVENT5 134 0.02 0.15 140 0.02 0.15 8 0.00 0.00 12 0.00 0.00 FCOVENT6 134 0.04 0.21 140 0.06 0.23 8 0.00 0.00 12 0.00 0.00 FCOVENT7 134 0.02 0.15 140 0.02 0.15 8 0.00 0.00 12 0.00 0.00 FCOVENT8 134 0.04 0.19 140 0.04 0.19 8 0.00 0.00 12 0.00 0.00 FCOVENT9 134 0.00 0.00 140 0.00 0.00 8 0.00 0.00 12 0.00 0.00 FCOVENT10 134 0.04 0.21 140 0.04 0.20 8 0.00 0.00 12 0.08 0.29 FCOVENT11 134 0.06 0.24 140 0.05 0.22 8 0.00 0.00 12 0.00 0.00 FCOVENT12 134 0.03 0.17 140 0.03 0.17 8 0.00 0.00 12 0.00 0.00
31

Table 2. Percentage of loan facilities with performance pricing covenants. The number of loan facility observations, the percentage without performance pricing covenants (No PPC), with PPC (All PPC), with accounting-based PPC (ACCPPC), with debt-rating-based PPC (DEBTPPC), with interest increasing PPC (INTINCR), and with interest decreasing PPC (INTDECR) are reported for the entire sample, and separately for every year within our sample period.
Year
Number of loan facility observations
No PPC
All PPC
ACCPPC
DEBTPPC
INTINCR
INTDECR Total 31,459 72.75% 27.25% 21.91% 5.34% 1.83% 3.04% 1994 3,575 81.34% 18.66% 13.31% 5.34% 0.67% 1.15% 1995 3,666 68.30% 31.70% 24.17% 7.53% 2.45% 3.41% 1996 5,135 69.56% 30.44% 23.82% 6.62% 1.91% 3.43% 1997 6,826 72.24% 27.76% 22.33% 5.44% 1.82% 2.84% 1998 6,308 68.53% 31.47% 26.97% 4.50% 2.43% 4.17% 1999 5,949 78.13% 21.87% 18.22% 3.65% 1.46% 2.66%
32

Table 3. Difference of means tests, pooled sample. We present the difference of the mean variable value between those loan facilities without PPCs and those with, and calculate the Student’s T-statistic and Wilcoxon Signed Rank statistic. Variable definitions are as follows: RATEAISD is the basis point coupon spread over LIBOR plus the annual fee and upfront fee, spread over the life of the loan. BWMD is the Moody’s senior debt rating, where the nonmissing ratings of Aaa through C are translated into an ordinal scale ranging from 28 to 8. BONDRATE is an indicator variable that equals unity if the borrower has a bond rating. TICKER is an indicator variable that is equal to unity if the borrower has a ticker symbol. BWSSIZE is the borrower’s sales size. TFCMAT is the months to maturity. AMTFCSIZ is the facility size. REVOLVER and SYND are indicator variables that equal unity if the loan is a revolving loan or syndicated, respectively. SECURED and SECUREDMISS are indicator variables that equal to unity if the loan is designated as secured by the database or if the securitization status is missing, respectively. FCOVENT1-12 are indicator variables that are equal to unity if there is are coverage covenants based on the fixed charge (FCOVENT1); debt service (FCOVENT2); interest (FCOVENT3); cash interest (FCOVENT4); leverage ratio (FCOVENT5); debt-to-cash flow (FCOVENT6); senior debt-to-cash flow (FCOVENT7); debt-to-tangible net worth (FCOVENT8); debt-to-equity (FCOVENT9); current ratio (FCOVENT10); tangible net worth (FCOVENT11); and net worth (FCOVENT12).
***, **, and * indicate statistical significance at the 0.01, 005, and 0.10 level.
Without
PPCWithPPC
Meandifference T-stat
Wilcoxon Statistic
RATEAISD 22,886 8,573 24.631 17.899*** 126515437.5***BWMD 3,771 2,908 0.755 8.419*** 9163705.5***BONDRATE 22,886 8,573 -0.174 -30.758*** -151965142.5***TICKER 22,886 8,573 -0.278 -45.289*** -162097822***log(BWSSIZE) 13,146 7,591 -0.359 -14.15*** -84627600.5***TFCMAT 18,277 8,448 -5.387 -5.42*** -124943780***log(AMTFCSIZ) 22,886 8,573 -0.558 -28.982*** -153433955.5***REVOLVER 22,886 8,573 -0.110 -18.07*** -145660310.5***SYND 22,834 8,573 -0.082 -23.297*** -142702285***SECURED 22,886 8,573 -0.280 -45.645*** -162289853***SECUREDMISS 22,886 8,573 0.425 78.997*** 93124092***FCOVENT1 22,886 8,573 -0.009 -3.305*** -135749015.5***FCOVENT2 22,886 8,573 -0.006 -3.081*** -135489457.5***FCOVENT3 22,886 8,573 -0.008 -2.838*** -135643565.5***FCOVENT4 22,886 8,573 -0.001 -1.636 -134963655.5*FCOVENT5 22,886 8,573 -0.005 -2.323** -135304731**FCOVENT6 22,886 8,573 -0.011 -3.873*** -135978541.5***FCOVENT7 22,886 8,573 -0.001 -0.702 -134943037FCOVENT8 22,886 8,573 -0.005 -1.985** -135295592.5**FCOVENT9 22,886 8,573 -0.001 -2.105** -134987921**FCOVENT10 22,886 8,573 -0.004 -1.896* -135221834**FCOVENT11 22,886 8,573 -0.006 -2.16** -135415567**FCOVENT12 22,886 8,573 -0.006 -2.528** -135443157***
33

Table 4. Difference of means tests, matched sample. We present separately the difference of the mean variable value between those loan facilities without PPCs and those with for the matched pair sample where one element is an accounting-based performance pricing covenants (ACCPPC); the corresponding debt-rating-based performance pricing covenants (DEBTPPC) case; the interest increasing (INTINCR) case; and the interest decreasing (INTDECR) case. We calculate the Student’s T-statistic and Wilcoxon Signed Rank statistic. Variable definitions are as follows: RATEAISD is the basis point coupon spread over LIBOR plus the annual fee and upfront fee, spread over the life of the loan. BWMD is the Moody’s senior debt rating, where the nonmissing ratings of Aaa through C are translated into an ordinal scale ranging from 28 to 8. BONDRATE is an indicator variable that equals unity if the borrower has a bond rating. TICKER is an indicator variable that is equal to unity if the borrower has a ticker symbol. BWSSIZE is the borrower’s sales size. TFCMAT is the months to maturity. AMTFCSIZ is the facility size. REVOLVER and SYND are indicator variables that equal unity if the loan is a revolving loan or syndicated, respectively. SECURED and SECUREDMISS are indicator variables that equal to unity if the loan is designated as secured by the database or if the securitization status is missing, respectively. FCOVENT1-12 are indicator variables that are equal to unity if there is are coverage covenants based on the fixed charge (FCOVENT1); debt service (FCOVENT2); interest (FCOVENT3); cash interest (FCOVENT4); leverage ratio (FCOVENT5); debt-to-cash flow (FCOVENT6); senior debt-to-cash flow (FCOVENT7); debt-to-tangible net worth (FCOVENT8); debt-to-equity (FCOVENT9); current ratio (FCOVENT10); tangible net worth (FCOVENT11); and net worth (FCOVENT12). Panel A: All PPC, ACCPPC, and DEBTPPC
All PPC
(pairs = 1,078) ACCPPC
(pairs = 941) DEBTPPC
(pairs = 137) (1) (2) (3) (4) (5) (6) (7) (8) (9)
Mean
difference
T-stat Wilcoxon Statistic
Mean difference
T-stat
Wilcoxon Statistic
Mean difference
T-stat
WilcoxonStatistic
RATEAISD 40.420 19.734*** 149069*** 45.762 20.077*** 135590*** 3.728 2.014** 56BWMD 0 N/A N/A 0 N/A N/A 0 N/A N/ABONDRATE 0 N/A N/A 0 N/A N/A 0 N/A N/ATICKER 0 N/A N/A 0 N/A N/A 0 N/A N/Alog(BWSSIZE) 0 N/A N/A 0 N/A N/A 0 N/A N/ATFCMAT 4.898 4.974*** 70975*** 10.332 11.379*** 100177.5*** -31.581 -10.334*** -2989***log(AMTFCSIZ) -0.214 -7.472*** -63895*** -0.196 -6.325*** -43669*** -0.338 -4.582*** -1540***REVOLVER -0.480 -27.66*** -77291.5*** -0.442 -23.843*** -50856*** -0.737 -17.123*** -2777.5***SYND -0.002 -0.577 -6.5 -0.004 -1.265 -11 0.014 1.419 1.5SECURED -0.017 -3.195*** -148.5*** -0.021 -3.676*** -155*** 0.014 1.419 1.5SECUREDMISS 0.026 4.356*** 301*** 0.023 4.049*** 170.5*** 0.043 1.745* 19.5FCOVENT1 -0.006 -0.734 -161 -0.002 -0.229 -38.5 -0.036 -1.294 -20FCOVENT2 0 N/A N/A -0.003 -0.412 -40.5 0.022 1 7.5FCOVENT3 -0.002 -0.204 -48.5 -0.002 -0.221 -41.5 0 N/A N/AFCOVENT4 -0.004 -2.003** -5 -0.002 -1.415 -1.5 -0.014 -1.419 -1.5FCOVENT5 -0.012 -1.787* -175.5* -0.010 -1.313 -108 -0.029 -1.643 -7FCOVENT6 -0.019 -2.052** -556.5** -0.015 -1.511 -304.5 -0.050 -1.615 -35FCOVENT7 0.004 0.784 27 0.004 0.816 25 0 N/A N/AFCOVENT8 0.008 1.116 148.5 0.003 0.404 42 0.043 1.915* 16.5FCOVENT9 -0.003 -0.774 -12 -0.002 -0.534 -7.5 -0.007 -1 -0.5FCOVENT10 -0.004 -0.566 -51 -0.004 -0.59 -47 0 0 0FCOVENT11 0.015 1.791* 324* 0.012 1.344 187 0.036 1.391 17.5FCOVENT12 -0.006 -0.639 -133.5 -0.006 -0.654 -127.5 0 N/A N/A
***, **, and * indicate statistical significance at the 0.01, 005, and 0.10 level.
34

Panel B: INTINCR and INTDECR
INTINCR
(pairs = 32) INTDECR
(pairs = 242) (1) (2) (3) (4) (5) (6)
Mean
difference
T-stat Wilcoxon Statistic
Mean difference
T-stat
Wilcoxon Statistic
RATEAISD 28.203 2.997*** 80.5*** 50.3719 24.389*** 11757.5*** BWMD 0 N/A N/A 0 N/A N/A BONDRATE 0 N/A N/A 0 N/A N/A TICKER 0 N/A N/A 0 N/A N/A log(BWSSIZE) 0 N/A N/A 0 N/A N/A TFCMAT 5.781 0.926 60.5 16.65833 14.971*** 10948.5*** log(AMTFCSIZ) -0.436 -2.448** -88** -0.03922 -0.718 -936.5 REVOLVER -0.625 -6.387*** -115*** -0.46281 -13.741*** -3332*** SYND 0 N/A N/A 0 N/A N/A SECURED 0 N/A N/A -0.02893 -2.679*** -14** SECUREDMISS 0.031 1 0.5 0.028926 2.679*** 14** FCOVENT1 0.031 1 0.5 0 0 0 FCOVENT2 0 0 0 0.053719 3.213*** 58.5*** FCOVENT3 0.063 1.438 1.5 -0.00826 -0.446 -10.5 FCOVENT4 0 N/A N/A 0 N/A N/A FCOVENT5 0 N/A N/A -0.00826 -0.577 -6.5 FCOVENT6 -0.031 -1 -0.5 -0.00826 -0.499 -8.5 FCOVENT7 0 N/A N/A 0.016529 2.013** 5 FCOVENT8 -0.094 -1.359 -4.5 0.028926 1.816* 28 FCOVENT9 0 N/A N/A -0.02479 -2.475** -10.5** FCOVENT10 -0.031 -0.571 -1 0.008264 0.706 4.5 FCOVENT11 -0.125 -2.104** -5 -0.00826 -0.632 -5.5 FCOVENT12 0.031 1.000 0.5 -0.00826 -0.342 -17.5
***, **, and * indicate statistical significance at the 0.01, 005, and 0.10 level.
35

Table 5. Counting tests, matched sample. The number of times that the facility without a performance pricing covenant (PPC) of a matched pair has a higher, identical, or lower value for the rates all in spread (RATEAISD) variable relative to the facility with a PPC is reported. These values are reported for all matched pairs (Panel A), matched pairs where the facility with a PPC is an accounting-based PPC (ACCPPC), matched pairs where the facility with a PPC is a debt-rating-based PPC (DEBTPPC), matched pairs where the facility with a PPC is interest increasing (INTINCR), and matched pairs where the facility with a PPC is a interest decreasing (INTDECR). These results are reported for all rating categories, and are reported separately for matched pairs associated with borrower with Moody’ senior debt ratings of A, B, C, and unrated. We also report the percentage higher, identical, lower, and the number of paired observations for each sample. Panel A: All performance pricing covenants matched sample
All A-Rated B-Rated C-Rated Unrated
Pairs % Pairs % Pairs % Pairs % Pairs %
ΔRATEAISD > 0 760 71% 7 13% 293 79% 10 67% 450 71%
ΔRATEAISD = 0 210 19% 46 82% 51 14% 1 7% 112 18%
ΔRATEAISD < 0 108 10% 3 5% 29 8% 4 27% 72 11%
Total 1078 100% 56 100% 373 100% 15 100% 634 100% Panel B: Accounting-based performance pricing covenants matched sample
All A-Rated B-Rated C-Rated Unrated
Pairs % Pairs % Pairs % Pairs % Pairs %
ΔRATEAISD > 0 744 79% 6 67% 285 89% 10 67% 443 74%
ΔRATEAISD = 0 114 12% 2 22% 21 7% 1 7% 90 15%
ΔRATEAISD < 0 83 9% 1 11% 14 4% 4 27% 64 11%
Total 941 100% 9 100% 320 100% 15 100% 597 100% Panel C: Debt-rating-based performance pricing covenants matched sample
All A-Rated B-Rated C-Rated Unrated
Pairs % Pairs % Pairs % Pairs % Pairs %
ΔRATEAISD > 0 16 12% 1 2% 8 15% 0 N/A 7 19%
ΔRATEAISD = 0 96 70% 44 94% 30 57% 0 N/A 22 59%
ΔRATEAISD < 0 25 18% 2 4% 15 28% 0 N/A 8 22%
Total 137 100% 47 100% 53 100% 0 N/A 37 100%
36

Panel D: Interest increasing performance pricing covenants matched sample
All A-Rated B-Rated C-Rated Unrated
Pairs % Pairs % Pairs % Pairs % Pairs %
ΔRATEAISD > 0 18 56% - 0% 6 75% - 0% 12 60%
ΔRATEAISD = 0 10 31% 1 50% 2 25% - 0% 7 35%
ΔRATEAISD < 0 4 13% 1 50% - 0% 2 100% 1 5%
Total 32 100% 2 100% 8 100% 2 100% 20 100% Panel E: Interest decreasing performance pricing covenants matched sample
All A-Rated B-Rated C-Rated Unrated
Pairs % Pairs % Pairs % Pairs % Pairs %
ΔRATEAISD > 0 216 89% - 0% 97 92% 3 100% 116 88%
ΔRATEAISD = 0 20 8% 1 50% 7 7% - 0% 12 9%
ΔRATEAISD < 0 6 2% 1 50% 1 1% - 0% 4 3%
Total 242 100% 2 100% 105 100% 3 100% 132 100%
37

38
Table 6. Correlations. Correlations between variables for the pooled sample are presented. Variable definitions are as follows: ACCPPC and DEBTPPC are indicator variables that are equal to unity if the loan facility has an accounting-based performing pricing covenant (PPC) or debt-rating-based PPC, respectively. INTINCR and INTDECR are indicator variables that are equal to unity if the loan facility’s PPC is interest increasing or interest decreasing, respectively. RATEAISD is the basis point coupon spread over LIBOR plus the annual fee and upfront fee, spread over the life of the loan. BWMD is the Moody’s senior debt rating, where the nonmissing ratings of Aaa through C are translated into an ordinal scale ranging from 28 to 8. BONDRATE is an indicator variable that equals unity if the borrower has a bond rating. TICKER is an indicator variable that is equal to unity if the borrower has a ticker symbol. BWSSIZE is the borrower’s sales size. TFCMAT is the months to maturity. AMTFCSIZ is the facility size. REVOLVER and SYND are indicator variables that equal unity if the loan is a revolving loan or syndicated, respectively. SECURED and SECUREDMISS are indicator variables that equal to unity if the loan is designated as secured by the database or if the securitization status is missing, respectively. FCOVENT1-12 are indicator variables that are equal to unity if there is are coverage covenants based on the fixed charge (FCOVENT1); debt service (FCOVENT2); interest (FCOVENT3); cash interest (FCOVENT4); leverage ratio (FCOVENT5); debt-to-cash flow (FCOVENT6); senior debt-to-cash flow (FCOVENT7); debt-to-tangible net worth (FCOVENT8); debt-to-equity (FCOVENT9); current ratio (FCOVENT10); tangible net worth (FCOVENT11); and net worth (FCOVENT12).
[1] [2] [3] [4] [5] [6] [7] [8] [9] [10] [11] [12] [13] [14] [15] [16] [17] [18] [19] [20] [21] [22] [23] [24] [25] [26]ACCPP C 1][ DEBTPPC [2] -0.13INTINCR [3] -0.22 0.27INTDECR [4] 0.04 -0.02 -0.23RATEAISD [5] 0.02 -0.21 -0.55 0.18BWMD [6] -0.34 0.26 0.36 -0.24 -0.67 BONDRATE [7] 0.05 0.29 -0.06 0.04 -0.14 n.a.TICKER [8] 0.18 0.17 0.10 0.02 -0.05 0.13 0.29log(BWSSIZE) [9] -0.05 0.25 0.15 -0.08 -0.51 0.52 0.41 0.18TFCMAT [10] 0.04 -0.02 -0.22 0.10 0.01 -0.26 -0.01 -0.05 0.01log(AMTFCSIZ) [11] 0.02 0.26 0.26 -0.09 -0.52 0.51 0.33 0.05 0.68 0.03REVOLVER [12] 0.07 0.07 0.14 -0.01 -0.08 0.03 -0.03 0.08 -0.09 -0.02 0.00SYND [13] 0.07 0.08 0.01 -0.01 -0.31 0.11 0.15 -0.07 0.44 0.07 0.58 -0.08SECURED [14] 0.34 -0.11 -0.33 0.18 0.41 -0.53 -0.01 0.18 -0.37 -0.01 -0.35 0.03 -0.33SECUREDMISS [15] -0.36 -0.09 0.05 -0.05 -0.27 0.31 -0.08 -0.28 0.26 0.03 0.24 -0.07 0.29 -0.82FCOVENT1 [16] 0.01 0.02 0.01 0.02 -0.01 -0.02 0.01 0.00 0.00 0.00 0.00 0.03 -0.02 0.02 -0.03FCOVENT2 [17] 0.01 0.02 0.01 -0.04 -0.02 0.01 0.00 0.01 0.00 0.00 0.00 0.01 -0.01 0.02 -0.03 0.06FCOVENT3 [18] 0.01 0.01 -0.01 -0.01 -0.03 0.02 0.01 0.01 0.00 0.00 0.01 0.02 -0.01 0.01 -0.03 0.30 0.14FCOVENT4 [19] 0.01 0.00 -0.04 0.02 0.00 0.00 -0.01 0.00 0.00 0.00 0.00 0.00 0.00 0.01 -0.01 0.06 0.05 0.02FCOVENT5 [20] 0.01 0.01 0.07 0.04 -0.01 0.02 0.01 0.00 0.01 0.00 0.01 0.01 0.00 0.01 -0.02 0.25 0.07 0.26 0.04FCOVENT6 [21] 0.01 0.02 -0.04 0.01 -0.01 -0.02 0.00 0.00 0.00 0.00 -0.01 0.02 -0.02 0.03 -0.04 0.54 0.17 0.53 0.12 0.16FCOVENT7 [22] 0.00 0.00 0.03 -0.03 -0.01 -0.01 0.00 0.00 0.01 0.00 0.00 0.00 -0.01 0.01 -0.02 0.25 0.11 0.24 0.09 0.07 0.31FCOVENT8 [23] 0.00 0.01 0.05 0.00 -0.01 0.01 0.00 0.00 0.00 0.00 0.00 0.02 -0.01 0.02 -0.03 0.13 0.31 0.13 0.01 -0.01 0.05 0.00FCOVENT9 [24] 0.01 0.00 -0.04 0.02 0.00 0.00 0.00 0.00 0.01 0.00 0.01 0.00 0.00 0.01 -0.02 0.02 0.07 0.05 0.00 0.01 0.02 0.00 0.00FCOVENT10 [25] 0.01 0.01 0.03 0.01 -0.01 0.01 0.00 0.00 0.00 0.00 0.00 0.01 -0.01 0.02 -0.03 0.16 0.23 0.16 0.01 0.12 0.14 0.06 0.35 0.09FCOVENT11 [26] 0.00 0.02 0.07 -0.03 -0.02 0.02 0.01 0.00 0.01 0.00 0.01 0.01 -0.01 0.01 -0.03 0.20 0.27 0.18 0.03 0.16 0.13 0.02 0.51 0.04 0.35FCOVENT12 [27] 0.01 0.01 0.01 -0.03 -0.02 0.01 0.01 0.01 0.01 0.00 0.01 0.02 -0.01 0.02 -0.03 0.31 0.12 0.29 0.05 0.22 0.35 0.15 0.09 0.07 0.12 -0.04

Table 7: Regression tests, rated subsample. RATEAISD is the dependent variables. Independent variables are as follows: ACCPPC and DEBTPPC are indicator variables that are equal to unity if the loan facility has an accounting-based performance pricing covenant (PPC) or debt-rating-based PPC, respectively. INTINCR and INTDECR are indicator variables that are equal to unity if the loan facility’s PPC is interest increasing or interest decreasing, respectively. RATEAISD is the basis point coupon spread over LIBOR plus the annual fee and upfront fee, spread over the life of the loan. BWMD is the Moody’s senior debt rating, where the nonmissing ratings of Aaa through C are translated into an ordinal scale ranging from 28 to 8. TICKER is an indicator variable that is equal to unity if the borrower has a ticker symbol. BWSSIZE is the borrower’s sales size. TFCMAT is the months to maturity. AMTFCSIZ is the facility size. REVOLVER and SYND are indicator variables that equal unity if the loan is a revolving loan or syndicated, respectively. SECURED and SECUREDMISS are indicator variables that equal to unity if the loan is designated as secured by the database or if the securitization status is missing, respectively. FCOVENT1-12 are indicator variables that are equal to unity if there is are coverage covenants based on the fixed charge (FCOVENT1); debt service (FCOVENT2); interest (FCOVENT3); cash interest (FCOVENT4); leverage ratio (FCOVENT5); debt-to-cash flow (FCOVENT6); senior debt-to-cash flow (FCOVENT7); debt-to-tangible net worth (FCOVENT8); debt-to-equity (FCOVENT9); current ratio (FCOVENT10); tangible net worth (FCOVENT11); and net worth (FCOVENT12). YEAR1995-1999 are indicator variables that are equal to unity if the observation is associated with the given year. The year 1994 is the reference year.
39

40
Panel A: Pooled Sample, Matched Sample ACCPPC, and Matched Sample DEBTPPC. Pooled sample Matched sample, ACCPPC Matched sample, DEBTPPC (1) (2) (3) (4) (5) (6) (7) (8) (9)
Intercept 699.71*** 739.35*** 842.57*** 534.22*** 464.38*** 700.19*** 454.60*** 451.93*** 520.36*** ACCPPC -24.56*** -22.12*** -7.14*** -29.98*** -36.92*** -28.67*** DEBTPPC -26.21*** -27.27*** -29.89*** 2.13 0.62 -6.20 BWMD -12.88*** -14.30** -15.57*** -5.63*** -5.22*** -7.00*** -6.91*** -6.46*** -10.62*** TICKER -6.21*** -11.71*** -4.86** -3.89 -6.52 -2.80 -28.99*** -31.77*** -33.86*** log(BWSSIZE) -6.90*** -8.10*** -8.59*** -5.80*** -4.70** -6.33*** -14.46*** -15.29*** -15.89*** TFCMAT 0.49*** 0.60*** 0.54*** 0.62*** -0.32* 0.09 log(AMTFCSIZ) -10.73*** -9.20*** -12.6*** -10.60** -8.46*** -11.60*** 2.74 3.10 5.98 REVOLVER -23.2*** -23.1*** -25.36*** -15.76*** -18.14*** -15.96*** 6.46 -3.87 -1.71 SYND 5.46 15.67*** -0.52 -15.84 3.33 -13.66 12.21 16.15 6.77 SECURED 60.99*** 62.46*** 131.83*** 157.67*** 120.93*** 113.56*** SECUREDMISS 2.62 6.95** 114.77*** 133.95*** 23.90*** 23.67*** FCOVENT1 1.31 -0.04 1.11 11.35 12.33 9.73 -6.19 -2.71 7.55 FCOVENT2 0.88 0.15 -1.70 -8.59 -9.76 -7.08 9.77 19.28 11.15 FCOVENT3 -8.81* -6.54 -8.83* 4.40 6.95 3.70 8.80 8.96 10.18 FCOVENT4 -30.38 -29.52 -18.06 -30.31 -19.74 -29.89 27.09 36.77 35.08 FCOVENT5 5.16 5.29 5.30 31.81* 28.76* 34.53** -12.43 -22.98 -32.77 FCOVENT6 10.23* 9.38* 10.61* 22.19* 16.01 23.71* -12.96 -14.48 -17.57 FCOVENT7 -13.98 -15.47 -13.00 6.99 5.71 9.28 32.02 22.07 22.81 FCOVENT8 -1.23 -0.11 -1.48 -16.28 -11.87 -17.48 -11.69 -21.24 -43.38 FCOVENT9 17.90 21.88 25.46 4.81 3.07 0.60 FCOVENT10 1.50 2.27 1.93 -2.42 -6.68 -1.39 3.77 10.98 20.96 FCOVENT11 -5.22 -7.58 -4.87 -0.97 -8.60 -1.53 6.40 9.97 19.46 FCOVENT12 -5.67 -9.02 -7.94 -21.27 -18.40 -22.57 -44.89 -55.48 -73.82 YEAR1995 -1.33 -1.81 -4.17 -1.24 3.60 2.89 9.29 6.49 9.64 YEAR1996 -0.96 1.09 -0.40 9.17 12.82 15.45* 15.89 10.97 11.04 YEAR1997 -12.05*** -11.55*** -12.33*** -13.16 -10.85 -6.92 13.17 10.03 4.45 YEAR1998 1.74 0.94 1.46 -3.33 1.04 1.87 25.81** 24.68** 31.56*** YEAR1999 33.21*** 26.87*** 34.23*** 22.73** 22.70** 29.60*** 95.72*** 92.01*** 147.3*** # Obs 5,578 6,033 5,578 627 632 627 186 188 186 Adj-R2 0.65 0.61 0.62 0.34 0.31 0.33 0.82 0.82 0.75
***, **, and * indicate statistical significance at the 0.01, 005, and 0.10 level

41
Panel B: Matched Sample INTINCR, and Matched Sample INTDECR.
Matched sample, INTINCR Matched sample, INTDECR (1) (2) (3) (4) (5) (6)
Intercept -1204.05 -1337.11 841.17*** 223.83** 332.22*** 535.34*** ACCPPC 1.33 -4.69 19.76 -30.98*** -46.38*** -25.88*** DEBTPPC -54.86 -24.93 -47.63 -36.47** -39.21** -68.59*** BWMD 8.08 10.50 -15.79** -2.01 -4.21** -8.52*** TICKER -124.69* -95.27 -75.01* -7.36 3.81 -12.04* log(BWSSIZE) 33.44 37.13 -20.47** -6.08 -9.64** -6.81* TFCMAT 1.11 1.28* 1.09*** 1.33*** log(AMTFCSIZ) 21.66 21.31 2.63 -4.24 -1.33 -5.42* SECURED 306.66 369.21 187.11*** 225.74*** SECUREDMISS -62.96 -43.34 167.30*** 174.66*** FCOVENT1 17.70 29.29 -7.92 FCOVENT3 28.87* 42.81** 15.31 FCOVENT6 -5.55 -9.33 10.64 FCOVENT8 28.33 63.29** 3.20 FCOVENT11 -72.02** -151.12*** -36.59 FCOVENT12 -16.33 -23.48 2.86 YEAR1995 62.59*** 61.01*** 41.65** YEAR1996 26.08** 18.83 22.11* YEAR1997 -0.87 -3.48 -13.70 YEAR1998 10.08 4.67 5.37 YEAR1999 44.00*** 24.98* 35.72** # Obs 20 20 20 216 216 216 Adj-R2 0.85 0.83 0.86 0.71 0.64 0.61
***, **, and * indicate statistical significance at the 0.01, 005, and 0.10 level

42
Table 8: Regression tests, unrated subsample. RATEAISD is the dependent variables. Independent variables are as follows: ACCPPC and DEBTPPC are indicator variables that are equal to unity if the loan facility has an accounting-based performance pricing covenant (PPC) or debt-rating-based PPC, respectively. INTINCR and INTDECR are indicator variables that are equal to unity if the loan facility’s PPC is interest increasing or interest decreasing, respectively. RATEAISD is the basis point coupon spread over LIBOR plus the annual fee and upfront fee, spread over the life of the loan. TICKER is an indicator variable that is equal to unity if the borrower has a ticker symbol. BWSSIZE is the borrower’s sales size. TFCMAT is the months to maturity. AMTFCSIZ is the facility size. REVOLVER and SYND are indicator variables that equal unity if the loan is a revolving loan or syndicated, respectively. SECURED and SECUREDMISS are indicator variables that equal to unity if the loan is designated as secured by the database or if the securitization status is missing, respectively. FCOVENT1-12 are indicator variables that are equal to unity if there is are coverage covenants based on the fixed charge (FCOVENT1); debt service (FCOVENT2); interest (FCOVENT3); cash interest (FCOVENT4); leverage ratio (FCOVENT5); debt-to-cash flow (FCOVENT6); senior debt-to-cash flow (FCOVENT7); debt-to-tangible net worth (FCOVENT8); debt-to-equity (FCOVENT9); current ratio (FCOVENT10); tangible net worth (FCOVENT11); and net worth (FCOVENT12). YEAR1995-1999 are indicator variables that are equal to unity if the observation is associated with the given year. The year 1994 is the reference year.
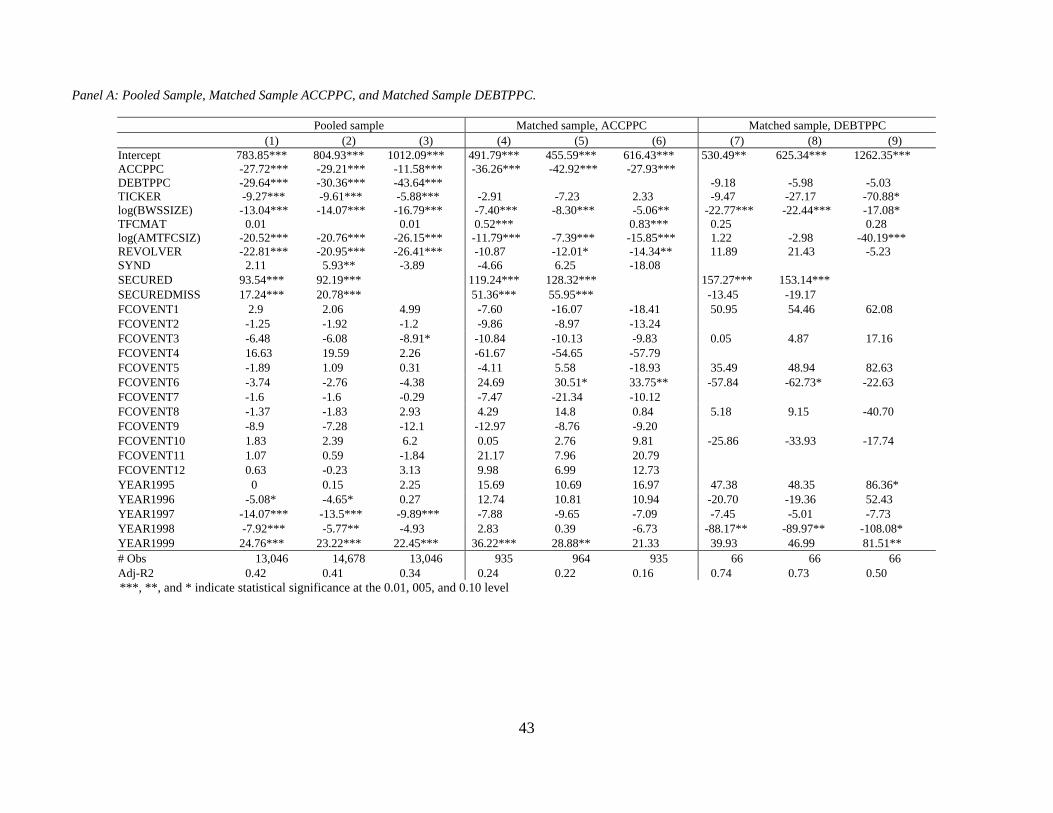
43
Panel A: Pooled Sample, Matched Sample ACCPPC, and Matched Sample DEBTPPC.
Pooled sample Matched sample, ACCPPC Matched sample, DEBTPPC (1) (2) (3) (4) (5) (6) (7) (8) (9)
Intercept 783.85*** 804.93*** 1012.09*** 491.79*** 455.59*** 616.43*** 530.49** 625.34*** 1262.35*** ACCPPC -27.72*** -29.21*** -11.58*** -36.26*** -42.92*** -27.93*** DEBTPPC -29.64*** -30.36*** -43.64*** -9.18 -5.98 -5.03 TICKER -9.27*** -9.61*** -5.88*** -2.91 -7.23 2.33 -9.47 -27.17 -70.88* log(BWSSIZE) -13.04*** -14.07*** -16.79*** -7.40*** -8.30*** -5.06** -22.77*** -22.44*** -17.08* TFCMAT 0.01 0.01 0.52*** 0.83*** 0.25 0.28 log(AMTFCSIZ) -20.52*** -20.76*** -26.15*** -11.79*** -7.39*** -15.85*** 1.22 -2.98 -40.19*** REVOLVER -22.81*** -20.95*** -26.41*** -10.87 -12.01* -14.34** 11.89 21.43 -5.23 SYND 2.11 5.93** -3.89 -4.66 6.25 -18.08 SECURED 93.54*** 92.19*** 119.24*** 128.32*** 157.27*** 153.14*** SECUREDMISS 17.24*** 20.78*** 51.36*** 55.95*** -13.45 -19.17 FCOVENT1 2.9 2.06 4.99 -7.60 -16.07 -18.41 50.95 54.46 62.08 FCOVENT2 -1.25 -1.92 -1.2 -9.86 -8.97 -13.24 FCOVENT3 -6.48 -6.08 -8.91* -10.84 -10.13 -9.83 0.05 4.87 17.16 FCOVENT4 16.63 19.59 2.26 -61.67 -54.65 -57.79 FCOVENT5 -1.89 1.09 0.31 -4.11 5.58 -18.93 35.49 48.94 82.63 FCOVENT6 -3.74 -2.76 -4.38 24.69 30.51* 33.75** -57.84 -62.73* -22.63 FCOVENT7 -1.6 -1.6 -0.29 -7.47 -21.34 -10.12 FCOVENT8 -1.37 -1.83 2.93 4.29 14.8 0.84 5.18 9.15 -40.70 FCOVENT9 -8.9 -7.28 -12.1 -12.97 -8.76 -9.20 FCOVENT10 1.83 2.39 6.2 0.05 2.76 9.81 -25.86 -33.93 -17.74 FCOVENT11 1.07 0.59 -1.84 21.17 7.96 20.79 FCOVENT12 0.63 -0.23 3.13 9.98 6.99 12.73 YEAR1995 0 0.15 2.25 15.69 10.69 16.97 47.38 48.35 86.36* YEAR1996 -5.08* -4.65* 0.27 12.74 10.81 10.94 -20.70 -19.36 52.43 YEAR1997 -14.07*** -13.5*** -9.89*** -7.88 -9.65 -7.09 -7.45 -5.01 -7.73 YEAR1998 -7.92*** -5.77** -4.93 2.83 0.39 -6.73 -88.17** -89.97** -108.08* YEAR1999 24.76*** 23.22*** 22.45*** 36.22*** 28.88** 21.33 39.93 46.99 81.51** # Obs 13,046 14,678 13,046 935 964 935 66 66 66 Adj-R2 0.42 0.41 0.34 0.24 0.22 0.16 0.74 0.73 0.50 ***, **, and * indicate statistical significance at the 0.01, 005, and 0.10 level

44
Panel B: Matched Sample INTINCR, and Matched Sample INTDECR.
Matched sample, INTINCR Matched sample, INTDECR (1) (2) (3) (4) (5) (6)
Intercept 569.74 726.54* 769.25** 158.75 76.13 304.59*** ACCPPC -56.20 -50.35 -137.66*** -33.94*** -64.63*** -7.56 DEBTPPC 56.73* 39.02 46.34 -11.41 8.84 -64.11*** TICKER 12.95 18.22 7.87 -26.86*** -25.65*** -30.82*** log(BWSSIZE) 1.49 2.57*** -1.85 -0.84 -1.08 TFCMAT -47.09 -55.11* -50.90* 1.47*** 2.39*** log(AMTFCSIZ) 569.74 726.54* 769.25** -3.14 1.11 -5.67 SECURED 100.11* 86.32 175.6*** 254.17*** SECUREDMISS 25.86 -38.45 87.93*** 162.22*** FCOVENT1 1.26 2.44 0.17 FCOVENT3 -5.63 -16.23 7.17 FCOVENT6 17.84 20.62 21.48 FCOVENT8 -27.63* -25.38 -21.08 FCOVENT11 -41.62** -38.79* -46.3** FCOVENT12 -0.75 -3.09 -0.4 YEAR1995 -41.53* -9.98 -63.36** YEAR1996 -42.04* -1.90 -86.15*** YEAR1997 -66.23*** -37.68 -96.23*** YEAR1998 -28.15 -5.09 -59.69** YEAR1999 -0.34 20.4 -31.41 # Obs 20 20 20 235 238 235 Adj-R2 0.67 0.66 0.57 0.59 0.52 0.44
***, **, and * indicate statistical significance at the 0.01, 005, and 0.10 level


