International Research Journal of Engineering and Technology (IRJET) e-ISSN: 2395 -0056
Volume: 04 Issue: 05 | May -2017 www.irjet.net p-ISSN: 2395-0072
© 2017, IRJET | Impact Factor value: 5.181 | ISO 9001:2008 Certified Journal | Page 3190
Performance Evaluation of Grid Connected Solar PV Plant Using PVsyst
Deepansh Nirwan, Electrical Engineering Department, PEC University of Technology
Chandigarh, India
Dr Tilak Thakur , Electrical Engineering Department, PEC University of Technology
Chandigarh, India ---------------------------------------------------------------------***---------------------------------------------------------------------
Abstract— Chandigarh is an emerging Solar City with a
target of 50 MW solar PV by 2022.As per CREST data 7.7
MWp of grid connected Solar has already been
commissioned by December 2016.In this paper 1 MW
gird connected solar plant installed and commissioned at
PEC University of Technology which is the largest in
Chandigarh is studied and its Performance is Evaluated
using PVsyst software. The average global horizontal
irradiation is 5.26 KWh/m2/day and annual average
temperature is 20.9 degrees centigrade. The study
includes performance evaluation at the tilt angle for
which the plant is installed and comparing it with the
optimum tilt according to the site with and without the
Horizon considerations.
Keywords— Grid Connected Solar Plant, Pvsyst,Performance ratio,Annual energy yield.
1. Introduction
India has a very huge Solar potential with almost
250-300 clear sunny days in a year. Almost all parts of
India receive 4–7 kWh of solar radiation per sq. metre
due to its geographical location [1].It receives around
5000 trillion kWh of energy every year. With the
increasing demand of power and high solar potential,
government of India aims a target of 100,000 MW grid
connected solar power projects by 2021-22 under the
National solar mission [2].
The Government has set 50 MW as target for Chandigarh administration to be achieved by 2022.Chandigarh has rooftop solar plants installed and commissioned on the buildings of all the government colleges (11) and schools (59) and also at other government buildings accounting to a total of 140 government buildings with total capacity of 7.782 MWp [3].
B. Shiva Kumar et al. [1] studied the performance of a
10 MW solar plant at NTPC Ramagundam. The plant is
designed to operate with a seasonal tilt. In this study
the solar PV plant design aspects along with its annual
performance is elaborated. The various types of power
losses (temperature, internal network, power
electronics, grid connected etc.) and performance ratio
are also calculated. The performance results of the
plant are also compared with the simulation values
obtained from PVsyst and PV-GIS software. Kanchan
Matiyali et al. [4] evaluated the performance of a
proposed 400 KW grid connected solar PV plant at
Dhalipur. Performance ratio and several types of power
losses were calculated. Value of the performance ratio
obtained was 78.1% from the results practicality of the
solar photovoltaic power plant was discussed. Ali
Malek et al. [5] studied the feasibility of photovoltaic
power plant situated at an Algerian site. In the study
performance of fixed tilt was compared with the
seasonal tilt and it was observed that the seasonal tilt
gives 5 % more energy as compared to fixed tilt.
Mounir Bouzguenda et al. [6] study revealed that even
though solar energy resources were abundant in the
summer, high ambient temperatures drastically
hindered the overall system performance for the given
system components and reduced the solar cell
efficiency by up to 16%. Shading losses varied between
0.70% and 4.2% according to the panel spacing and
field location.
2. Description of solar pv-grid system
2.1. Geographical Location and climatic Resource
The PEC University solar power plant is located at latitude of 30.73 degrees North and longitude of 76.77 East at an altitude of 344 metres.
International Research Journal of Engineering and Technology (IRJET) e-ISSN: 2395 -0056
Volume: 04 Issue: 05 | May -2017 www.irjet.net p-ISSN: 2395-0072
© 2017, IRJET | Impact Factor value: 5.181 | ISO 9001:2008 Certified Journal | Page 3191
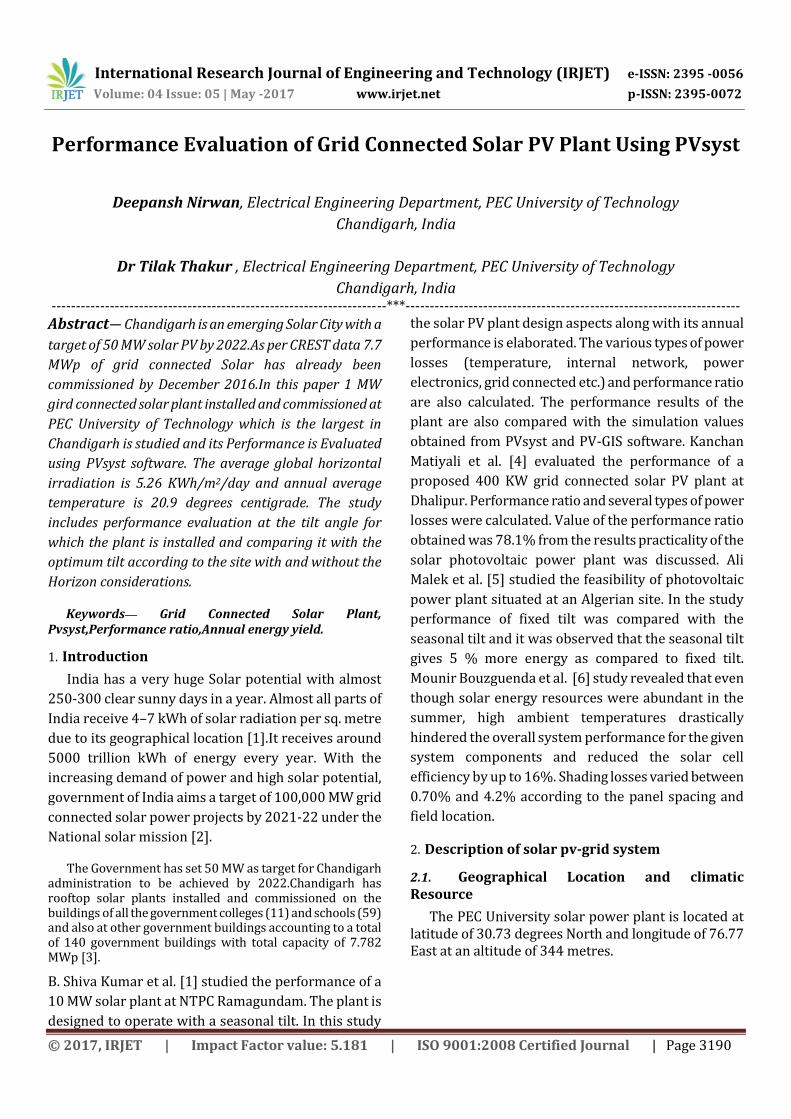
Chart 1. Trajectory of Sun at Chandigarh with Horizon outline
To estimate the Irradiation, temperature and Horizon data of the location, PVGIS solar resource database [7] has been used via internet.
2.2. Plant Layout
The total rating of the plant is of 1 MW and it covers a total rooftop area of about 3 acres. The plant is divided in 13 different buildings of the University. Thus shading losses are not considered in this study. Each building has different solar generation capacity according to the rooftop area available and all of them combine to give total generation capacity of 1 MW.
The plant utilizes a total of 4000 solar panels and 35 three phase inverters which includes 30 inverters of 30 KW and 5 inverters of 20 KW. These inverters are used for DC to AC conversion and the output is fed to the 11 KV grid.
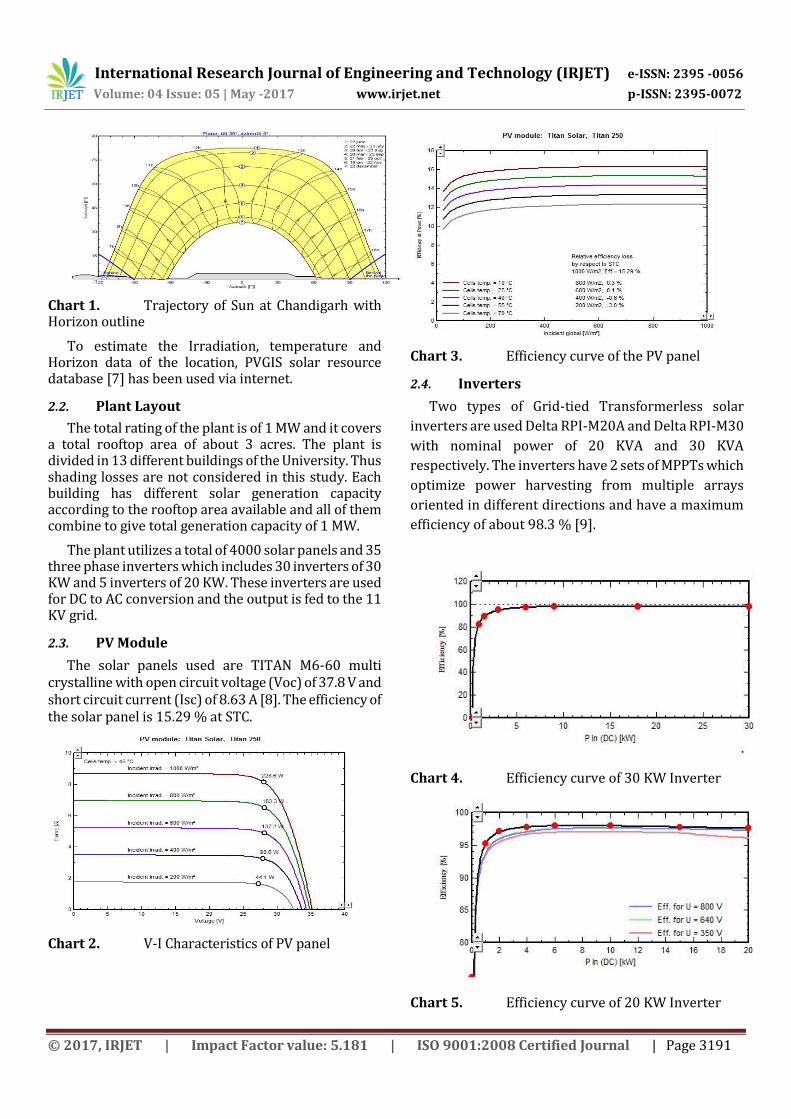
2.3. PV Module
The solar panels used are TITAN M6-60 multi crystalline with open circuit voltage (Voc) of 37.8 V and short circuit current (Isc) of 8.63 A [8]. The efficiency of the solar panel is 15.29 % at STC.
Chart 2. V-I Characteristics of PV panel
Chart 3. Efficiency curve of the PV panel
2.4. Inverters
Two types of Grid-tied Transformerless solar
inverters are used Delta RPI-M20A and Delta RPI-M30
with nominal power of 20 KVA and 30 KVA
respectively. The inverters have 2 sets of MPPTs which
optimize power harvesting from multiple arrays
oriented in different directions and have a maximum
efficiency of about 98.3 % [9].
Chart 4. Efficiency curve of 30 KW Inverter
Chart 5. Efficiency curve of 20 KW Inverter
International Research Journal of Engineering and Technology (IRJET) e-ISSN: 2395 -0056
Volume: 04 Issue: 05 | May -2017 www.irjet.net p-ISSN: 2395-0072
© 2017, IRJET | Impact Factor value: 5.181 | ISO 9001:2008 Certified Journal | Page 3192
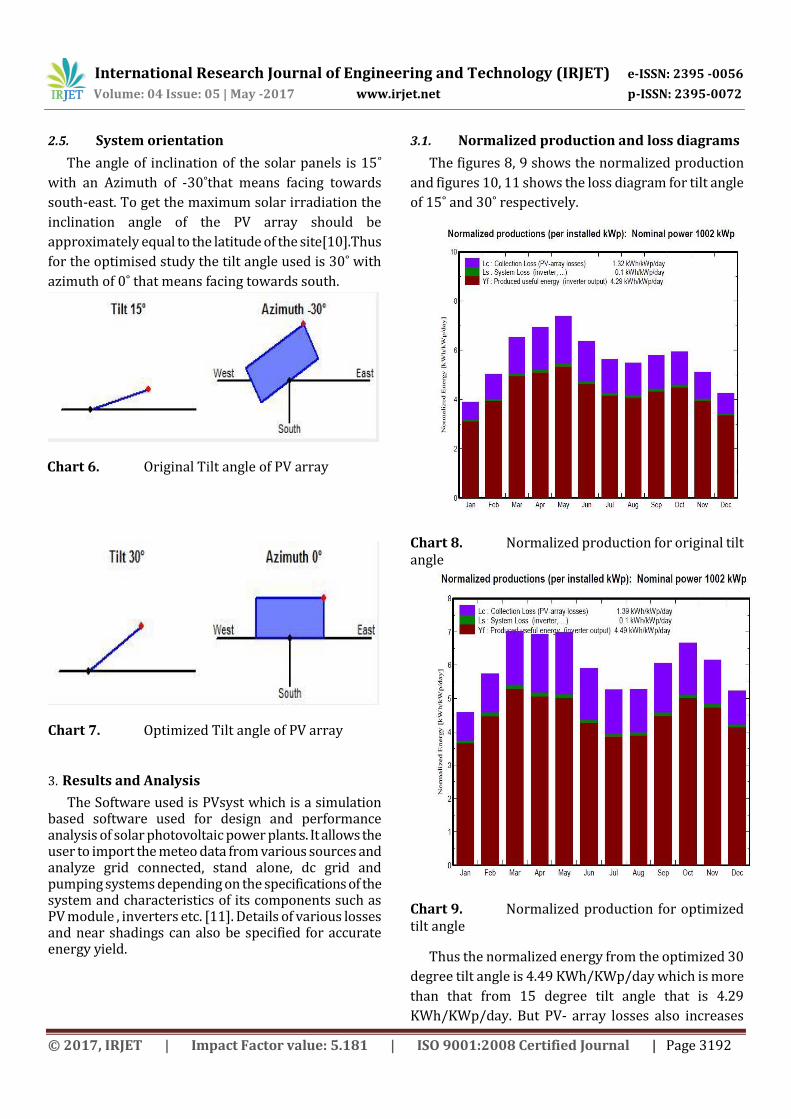
2.5. System orientation
The angle of inclination of the solar panels is 15˚
with an Azimuth of -30˚that means facing towards
south-east. To get the maximum solar irradiation the
inclination angle of the PV array should be
approximately equal to the latitude of the site[10].Thus
for the optimised study the tilt angle used is 30˚ with
azimuth of 0˚ that means facing towards south.
Chart 6. Original Tilt angle of PV array
Chart 7. Optimized Tilt angle of PV array
3. Results and Analysis
The Software used is PVsyst which is a simulation based software used for design and performance analysis of solar photovoltaic power plants. It allows the user to import the meteo data from various sources and analyze grid connected, stand alone, dc grid and pumping systems depending on the specifications of the system and characteristics of its components such as PV module , inverters etc. [11]. Details of various losses and near shadings can also be specified for accurate energy yield.
3.1. Normalized production and loss diagrams
The figures 8, 9 shows the normalized production
and figures 10, 11 shows the loss diagram for tilt angle
of 15˚ and 30˚ respectively.
Chart 8. Normalized production for original tilt angle
Chart 9. Normalized production for optimized tilt angle
Thus the normalized energy from the optimized 30
degree tilt angle is 4.49 KWh/KWp/day which is more
than that from 15 degree tilt angle that is 4.29
KWh/KWp/day. But PV- array losses also increases
International Research Journal of Engineering and Technology (IRJET) e-ISSN: 2395 -0056
Volume: 04 Issue: 05 | May -2017 www.irjet.net p-ISSN: 2395-0072
© 2017, IRJET | Impact Factor value: 5.181 | ISO 9001:2008 Certified Journal | Page 3193
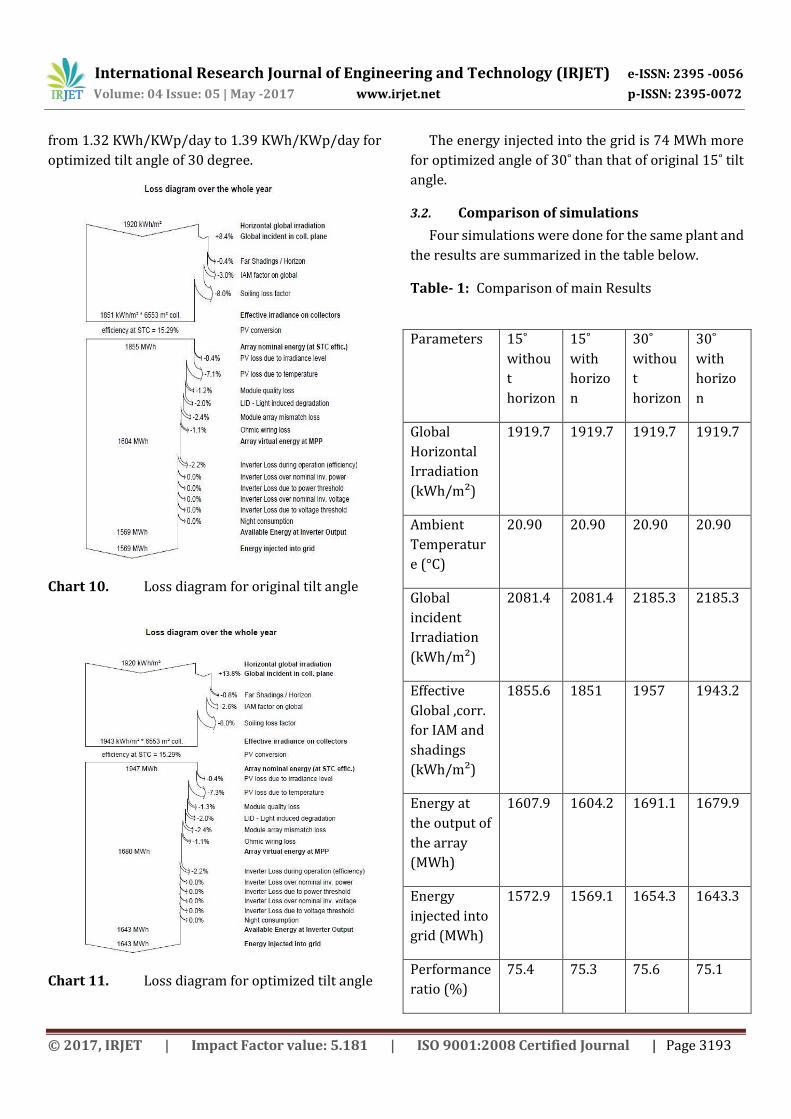
from 1.32 KWh/KWp/day to 1.39 KWh/KWp/day for
optimized tilt angle of 30 degree.
Chart 10. Loss diagram for original tilt angle
Chart 11. Loss diagram for optimized tilt angle
The energy injected into the grid is 74 MWh more
for optimized angle of 30˚ than that of original 15˚ tilt
angle.
3.2. Comparison of simulations
Four simulations were done for the same plant and
the results are summarized in the table below.
Table- 1: Comparison of main Results
Parameters 15˚
withou
t
horizon
15˚
with
horizo
n
30˚
withou
t
horizon
30˚
with
horizo
n
Global
Horizontal
Irradiation
(kWh/m²)
1919.7 1919.7 1919.7 1919.7
Ambient
Temperatur
e (°C)
20.90 20.90 20.90 20.90
Global
incident
Irradiation
(kWh/m²)
2081.4 2081.4 2185.3 2185.3
Effective
Global ,corr.
for IAM and
shadings
(kWh/m²)
1855.6 1851 1957 1943.2
Energy at
the output of
the array
(MWh)
1607.9 1604.2 1691.1 1679.9
Energy
injected into
grid (MWh)
1572.9 1569.1 1654.3 1643.3
Performance
ratio (%)
75.4 75.3 75.6 75.1
International Research Journal of Engineering and Technology (IRJET) e-ISSN: 2395 -0056
Volume: 04 Issue: 05 | May -2017 www.irjet.net p-ISSN: 2395-0072
© 2017, IRJET | Impact Factor value: 5.181 | ISO 9001:2008 Certified Journal | Page 3194
3.3. Economic Analysis
The total energy fed to the grid by the solar plant is
1569 MWh which is 1569000 units per year. The cost
per unit of solar power as per Joint Electricity
Regulatory commission for UTs is Rs 8.51 without
subsidy and Rs 6.14 with capital subsidy of 30 % [3].
The total cost of the plant is Rs 8 crores .
Thus by using above data we get the payback period
as 6 years for 15˚ tilt angle.
4. Conclusion
The study of the solar photovoltaic power plant
using PVsyst shows that the 1 MW plant produces
more energy for optimized tilt angle equal to the
latitude of the site i.e. 30 degree as compared to the
energy produced at original tilt angle of 15 degree. The
energy produced is 4.71 % more in case of optimized
tilt and thus while designing the plant this factor
should be considered.
References
[1] B. S. Kumar and K. Sudhakar, “Performance evaluation of 10 MW grid connected solar photovoltaic power plant in India,” Energy Reports, vol. 1, pp. 184–192, 2015.
[2] Ministry of New and Renewable Energy. Available at http://www.mnre.gov.in
[3] Chandigarh Renewable Energy and Science & Technology Promotion Society. www.crestchd.org.in
[4] Kanchan Matiyali, Alaknanda Ashok, “Performance Evaluation of Grid Connected Solar pv plant,” IEEE, pp. 1–5, 2016.
[5] R. Tallab and A. Malek, “Predict System E fficiency of 1 MWc Photovoltaic Power Plant Interconnected to the Distribution Network using PVSYST Software,” IEEE, pp. 5–8, 2015.
[6] M. Bouzguenda, A. Al Omair, A. Al Naeem, M. Al-muthaffar, and O. B. Wazir, “Design of an Off-Grid 2 kW Solar PV System,” IEEE, pp. 1–6, 2014.
[7] Solar Radiation Databases PVGIS. http:/re.jrc.ec.europa.eu/pvgis/imaps
[8] Titan Energy Systems Ltd. at www.titan-energy.com [9] www.deltaww.com [10] M. Benghanem, “Optimization of tilt angle for
solar panel : Case study for Madinah , Saudi Arabia,” Appl. Energy - ELSEVIER, vol. 88, no. 4, pp. 1427–1433, 2013.
[11] PVsyst Software available at www.pvsyst.com


