
Iowa Pork Industry Ce
Pelvic Organ Prolapse: An update & next steps from 104 farms
collaborating on NPB project
Jason Ross, Amanda Chipman, Chris Rademacher, Colin Johnson, Ken Stalder, Anna Johnson, Aileen Keating, John Patience, Nick Gabler, Daniel Linhares, Kent Schwartz,
Suzanne Millman, Zoe Kiefer, Stephan Schmitz-Esser, Gustavo Silva
National Pork Industry ConferenceJuly 9, 2018

Iowa Pork Industry Ce
SU Investigators
Amanda Chipman, Extension
Colin Johnson, Extension
Chris Rademacher, Swine disease and production veterinarian
Ken Stalder, Genetics and statistics
Anna Johnson, Welfare and behavior
Aileen Keating, Reproductive toxicology
John Patience, Nutritionist
Nick Gabler, Nutrition and physiology
Daniel Linhares, Epidemiologyand statistics
Kent Schwartz, Diagnostic veterinarian
Suzanne Millman, Welfare
Jason Ross, Reproductive physiology

Iowa Pork Industry Ce
ackground
Sow mortality, especially due to prolapses, has increasethe past 5 years in the US swine industry.It has become a significant welfare and production issueNo good understanding of root causes are known at thistime.National Pork Board Released an RFP in October, 2017

Iowa Pork Industry Ce
meline for Sow Prolapse Study
Submitted proposal
ved the est for osals
Notification of funding
Interviews for Extension Program Specialist
Conference calls with
collaborators to enlist sow
farms
Amanda Chipman start date‐Project
Leader
Visited first integrated production company to
discuss project
~50 farms committed to being on the project. Open forum at Iowa Pork Congress
104 Sow Farms
enlisted on the project
ept 2017 Oct 2017 Nov 2017 Dec 2017 Jan 2018 Feb 2018 March 2018 April 20
62 ovi
com
On farm data
collection begins
Iowa Pork Industry Ce
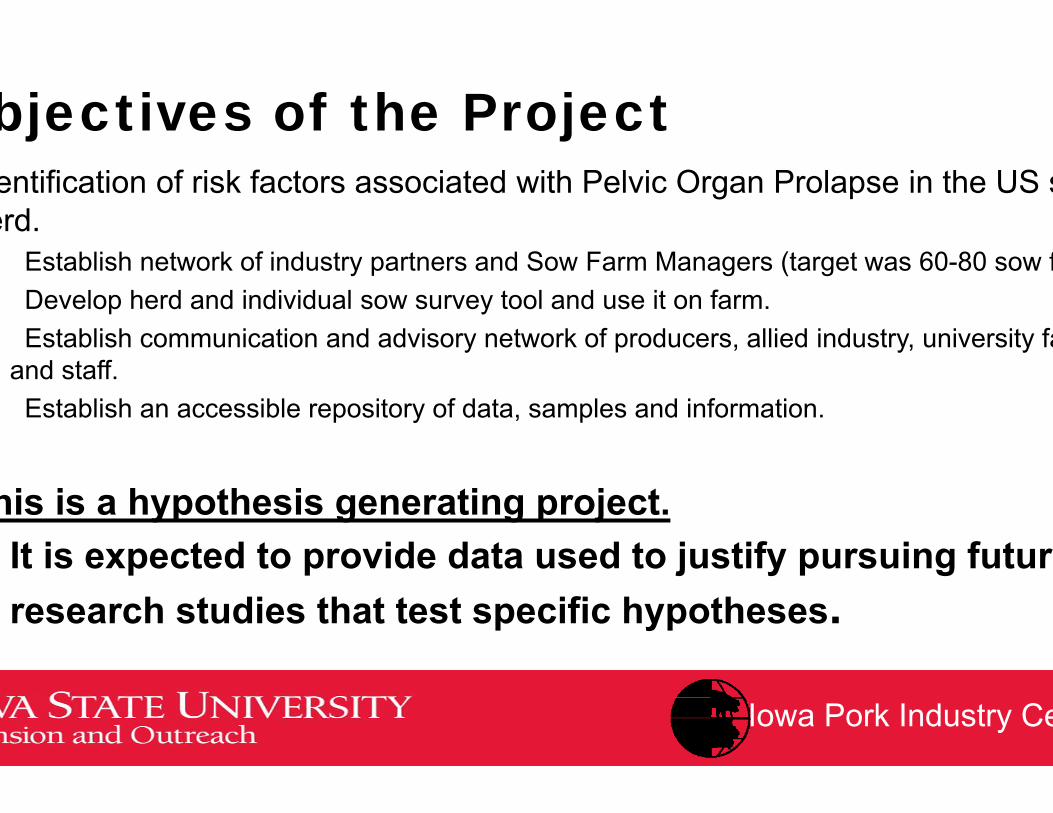
bjectives of the Projectentification of risk factors associated with Pelvic Organ Prolapse in the US serd.
Establish network of industry partners and Sow Farm Managers (target was 60-80 sow fDevelop herd and individual sow survey tool and use it on farm.Establish communication and advisory network of producers, allied industry, university fa
and staff.Establish an accessible repository of data, samples and information.
his is a hypothesis generating project. – It is expected to provide data used to justify pursuing future
research studies that test specific hypotheses.
Iowa Pork Industry Ce
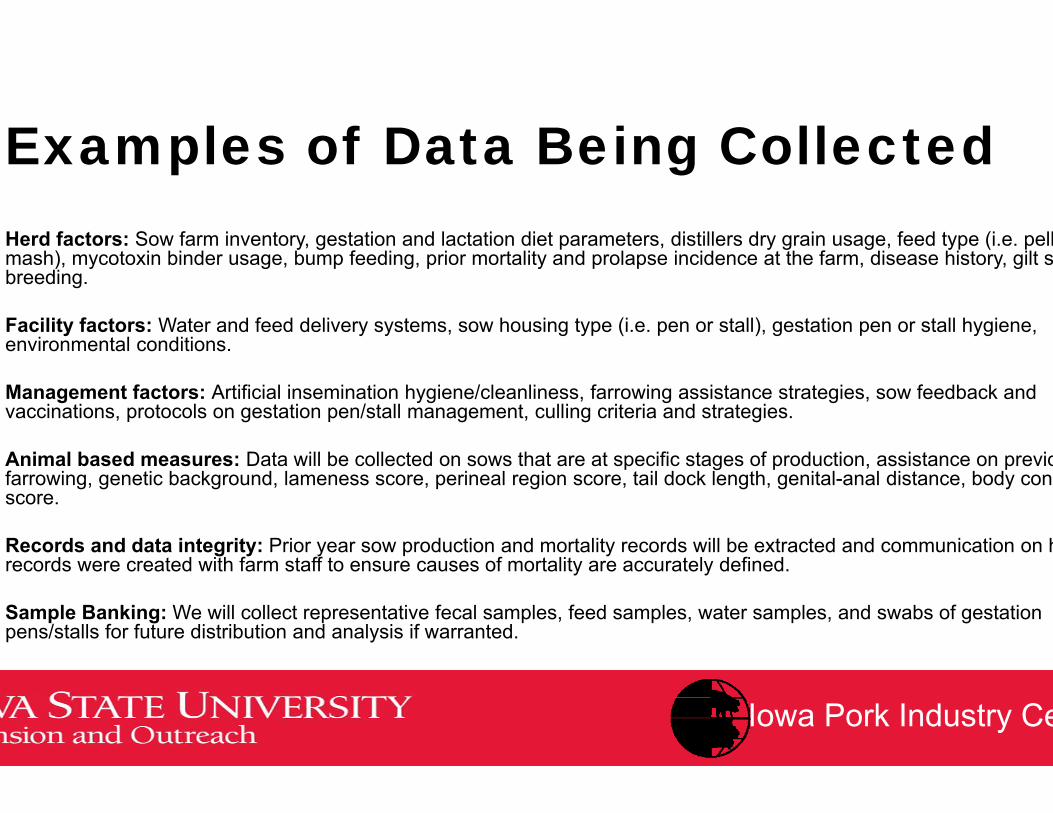
Examples of Data Being CollectedHerd factors: Sow farm inventory, gestation and lactation diet parameters, distillers dry grain usage, feed type (i.e. pellmash), mycotoxin binder usage, bump feeding, prior mortality and prolapse incidence at the farm, disease history, gilt sbreeding.
Facility factors: Water and feed delivery systems, sow housing type (i.e. pen or stall), gestation pen or stall hygiene, environmental conditions.
Management factors: Artificial insemination hygiene/cleanliness, farrowing assistance strategies, sow feedback and vaccinations, protocols on gestation pen/stall management, culling criteria and strategies.
Animal based measures: Data will be collected on sows that are at specific stages of production, assistance on previofarrowing, genetic background, lameness score, perineal region score, tail dock length, genital-anal distance, body condscore.
Records and data integrity: Prior year sow production and mortality records will be extracted and communication on hrecords were created with farm staff to ensure causes of mortality are accurately defined.
Sample Banking: We will collect representative fecal samples, feed samples, water samples, and swabs of gestation pens/stalls for future distribution and analysis if warranted.

Iowa Pork Industry Ce
Mortality and Prolapse Record Sheet
Scope of the projectWeekly mortality and prolapse data submitted weekly by:
104 Farms 85 farms in 13 larger systems 19 independents
Almost 400,000 sows15 states
Iowa Pork Industry Ce
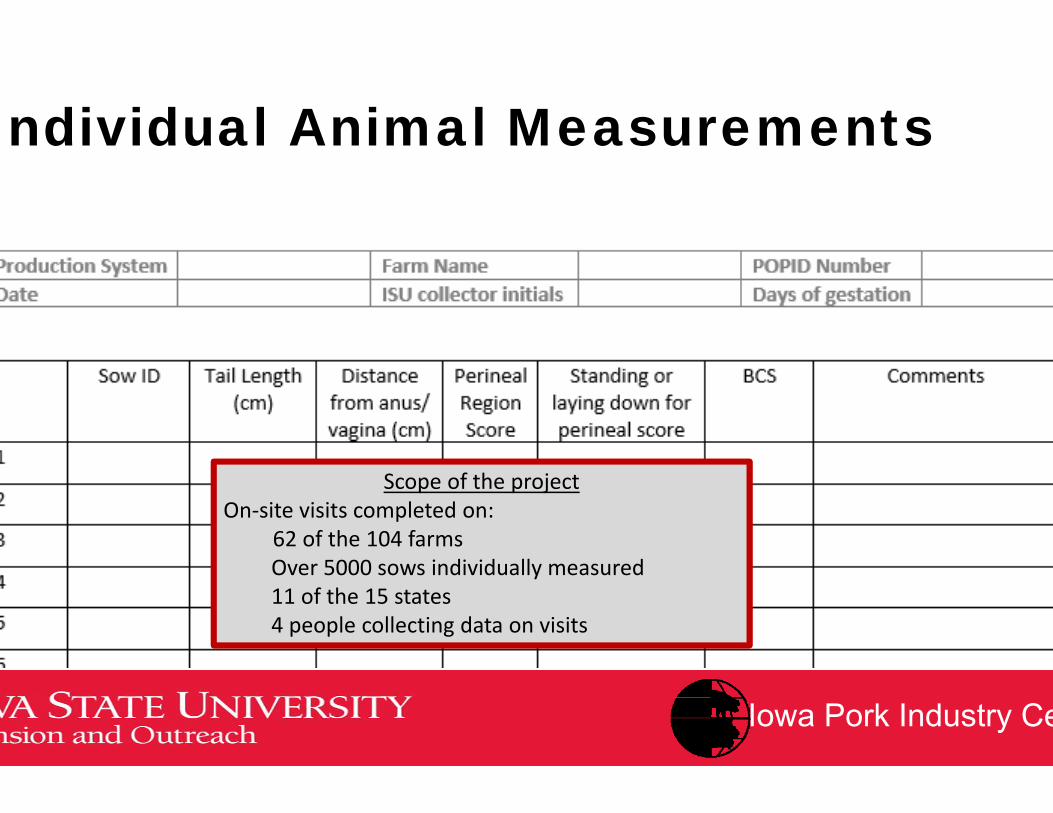
Individual Animal Measurements
Scope of the projectOn‐site visits completed on:
62 of the 104 farmsOver 5000 sows individually measured11 of the 15 states4 people collecting data on visits

Iowa Pork Industry Ce
erineal Scoring: Score 1
Iowa Pork Industry Ce
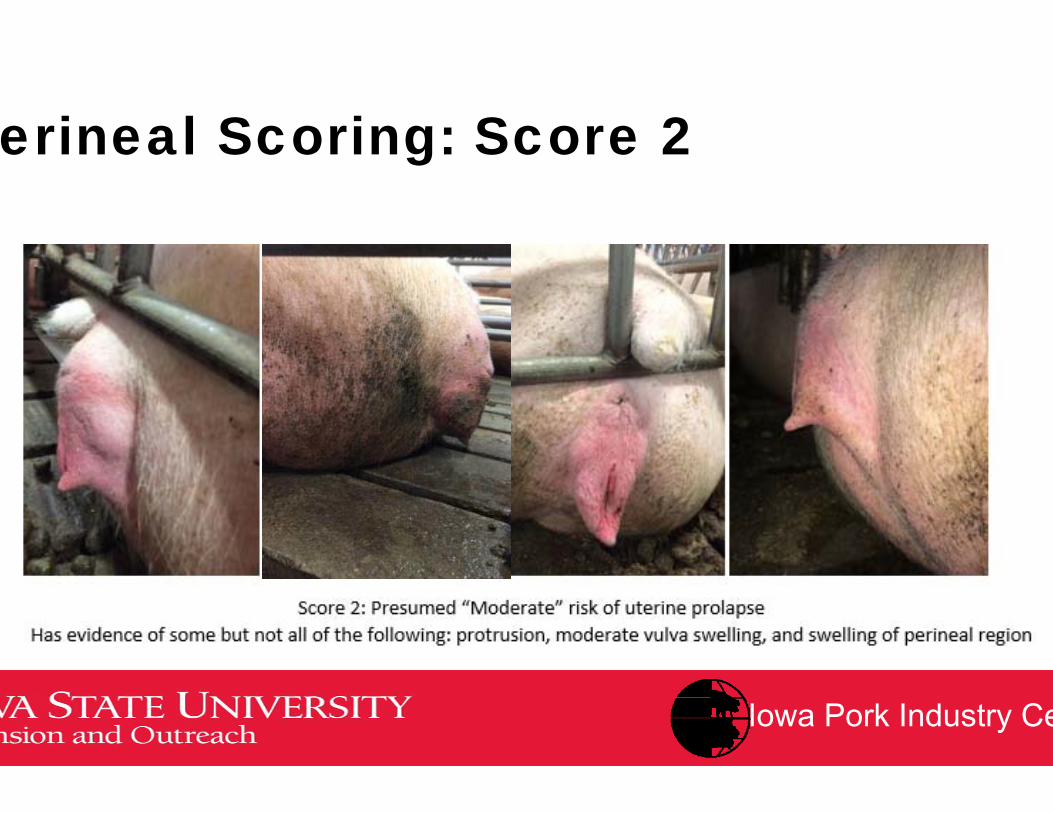
erineal Scoring: Score 2

Iowa Pork Industry Ce
erineal Scoring: Score 3

Iowa Pork Industry Ce
Currently in Progress
eed sample analysis in progress– Proximate analysis (CP, Ca, P, Na, NDF, Se, Zn, etc.)– Particle size– Mycotoxin analysis ontinuing to collect information for each farm (i.e. historical production-means clustering to characterize patterns in POP incidenceaboratory analysis on a few biological samplesontinued collection of weekly prolapse and morality dataevelopment of a less subjective vulva score

Iowa Pork Industry Ce
his is PRELIMINARY ANALYSIS. . .
NO JUMPING TO CONCLUSIONS!

Iowa Pork Industry Ce
eek 6-23 Trends:Average POP Rate for 104 farms
85 83 26 79 87 60 86 37 5 99 102 77 23 88 25 19 22 36 48 41 2 57 100
101 8 56 6 11 72 97 71 78 1 82 80 21 65 42 10 108 98 105
109 74 73 4 9 34 94 62 35 29 81 58 91 20 14 7 95 13 27 30 12 107 39 90 24 54 103 40 33 104 66 32 68 28 49 59 47 45 31 106
113 15 44 70 92 111 93 96 18 43 112 75 17
Farm ID
Prelimina

Iowa Pork Industry Ce
Week 6 to 23 Trends:Mortality Average of All Farms
0%2%4%6%8%
10%12%14%16%
4‐Feb‐18
11‐Feb
‐18
18‐Feb
‐18
25‐Feb
‐18
4‐Mar‐18
11‐M
ar‐18
18‐M
ar‐18
25‐M
ar‐18
1‐Ap
r‐18
8‐Ap
r‐18
15‐Apr‐18
22‐Apr‐18
29‐Apr‐18
6‐May‐18
13‐M
ay‐18
20‐M
ay‐18
27‐M
ay‐18
3‐Jun‐18
Annu
alize
d Mortality (%
)
Week
Weeks 6‐23 Annualized Total Mortality
Prelimina

Iowa Pork Industry Ce
Week 6 to 23 Trends:Prolapse Average of All Farms
0.0%0.5%1.0%1.5%2.0%2.5%3.0%3.5%4.0%4.5%
4‐Feb‐18
11‐Feb
‐18
18‐Feb
‐18
25‐Feb
‐18
4‐Mar‐18
11‐M
ar‐18
18‐M
ar‐18
25‐M
ar‐18
1‐Ap
r‐18
8‐Ap
r‐18
15‐Apr‐18
22‐Apr‐18
29‐Apr‐18
6‐May‐18
13‐M
ay‐18
20‐M
ay‐18
27‐M
ay‐18
3‐Jun‐18
Annu
alize
d PO
P (%
)
Week
Weeks 6‐23 Annualized Prolapse Rate
Prelimina

Iowa Pork Industry Ce
Causes of Mortality
Prelimina
16%5%
2%
6%
2%
3%28%
38%
akdown of Week 4‐23 Causes of Mortality
Uterine Prolapse Rectal/Anal Prolapse
tal and Vaginal/Uterine Prolapse Difficulty Farrowing/Retained Pig(s)
Intestinal (Ulcer) Complications
ured/Downer Unknown/Other
0%
10%
20%
30%
40%
50%
60%
70%
80%
90%
100%
wee
k 4
wee
k 5
wee
k 6
wee
k 7
wee
k 8
wee
k 9
wee
k 10
wee
k 11
wee
k 12
wee
k 13
wee
k 14
wee
k 15
wee
k 16
wee
k 17
wee
k 18
wee
k 19
wee
k 20
wee
k21
Causes of Mortality by Week
Vaginal/Uterine Prolapse Rectal/Anal Prolapse Both Rectal and Vaginal/Uterine P
Difficulty Farrowing/Retained Pig(s) Disease Intestinal (Ulcer) Complications
Lame/Injured/Downer Unknown/Other

Iowa Pork Industry Ce
gnificant Variation Across Farms Exis
0%
5%
10%
15%
20%
25%
30%
Annu
alized
Mortality (%
)
Annualized Total Mortality
Best 20% Average 60% Worst 20%
Prelimina
Iowa Pork Industry Ce
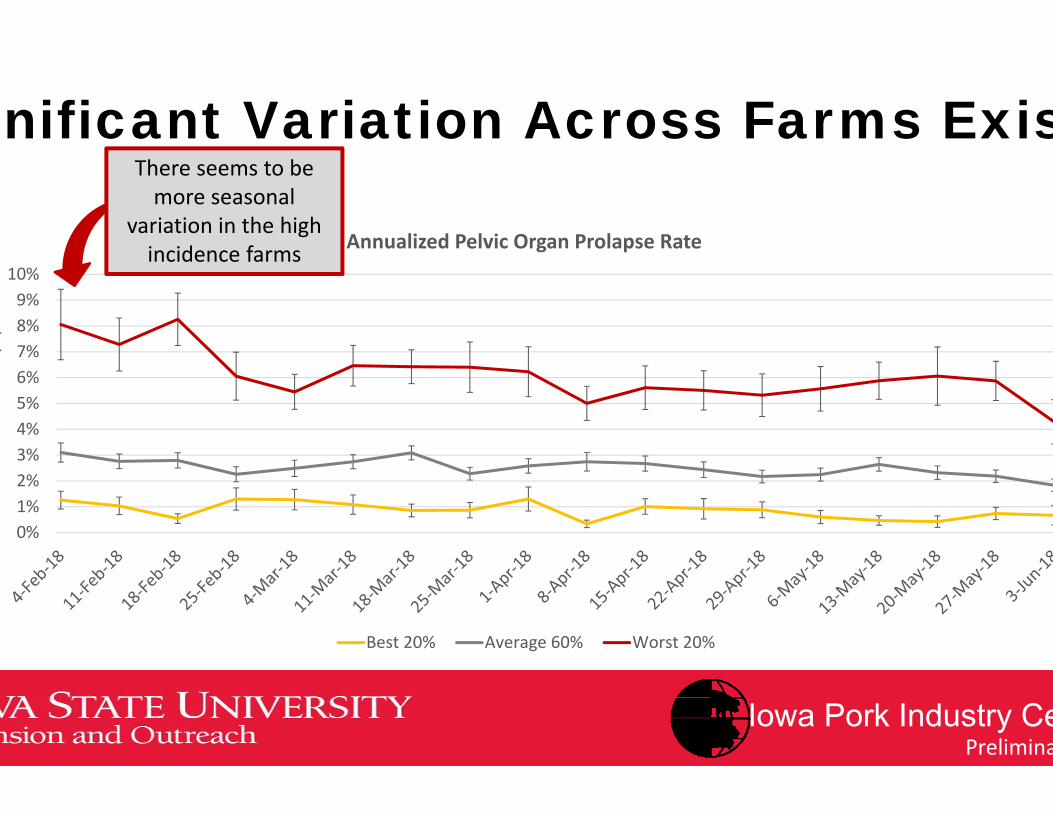
gnificant Variation Across Farms Exis
0%1%2%3%4%5%6%7%8%9%
10%
()
Annualized Pelvic Organ Prolapse Rate
Best 20% Average 60% Worst 20%
Prelimina
There seems to be more seasonal
variation in the high incidence farms

Iowa Pork Industry Ce
Means Clustering- Using the Weekly cidence of POP/1,000 Sows
Number of farms Freq. %49 52.1%36 38.3%9 9.6%
rms 94 100.0%
Average Sd Min Q1 median Q3 max0.29 0.33 0 0 0.23 0.46 1.630.76 0.52 0 0.44 0.73 1.09 2.681.58 0.82 0 0.93 1.52 2.08 4.19
descriptive stats of the POP incidence by 1,000 sows
tribution by cluster
Prelimina
Farms dividclusters basetrends of the
POP incid

Iowa Pork Industry Ce
ow, Medium, and High Incidence Clusters for Weekly POP Incidence
6 7 8 9 10 11 12 13 14 15 16 17 18 6 7 8 9 10 11 12 13 14 15 16 17 18 6 7 8 9 10 11 12 13 14 15 16 17 18
Prelimina

Iowa Pork Industry Ce
Cluster Average of POP Incidence
6 7 8 9 10 11 12 13 14 15 16 17 18
Prelimina
Cluster 1
Cluster 2
Cluster 3
Week
POP Incide
nce / 1
000 So
ws 2.5
2.0
1.5
1.0
0.5

Iowa Pork Industry Ce
Relationship between POP and Mortality
Prelimina
R² =
0%
2%
4%
6%
8%
10%
12%
14%
0% 5% 10% 15%An
nualize
d PO
P Ra
te (%
)Annualized Non‐POP Mortality (%)
Non‐POP Mortality and Prolapse Incidence
P
R² = 0.4038
% 5% 10% 15% 20% 25%Annualized Total Mortality (%)
Total Mortality and Prolapse Incidence
P < 0.0001

Iowa Pork Industry Ce
Score 1
Score 3
Score 2
Prelimina
R² = 0.1634
0.0
0.5
1.0
1.5
2.0
2.5
1.0 1.2 1.4 1.6 1.8 2.0 2.2
POP/10
00 Sow
s/wee
k
Perineal Score
Whole Farm Average‐ Perineal Score
P = 0.0011
Average Number of AnimalsScoring a 3 Correlates to Higher Prolapse Incidence

Iowa Pork Industry Ce
Perineal Score in Late Gestation as an Indicator ofPOP Risk
Total scored animals
Animalsprolapsed
Percentprolapsed
Score 1 1310 15 1.1%Score 2 1361 12 0.9%Score 3 235 17 7.2%Total 2906 44 1.5%
Score 1
Score 3
Score 2
1.1% 0.9%
7.2%
0.0%
2.0%
4.0%
6.0%
8.0%
1 2 3
Percen
t Prolapsed
Perineal Score
Percent of Sows Prolapsed According to Perineal Score
Prelimina

Iowa Pork Industry Ce
Body Condition Score in Late Gestation as an Indicator of POP Risk
Total scored animals
Animalsprolapsed
Percentprolapsed
BCS 1 586 16 2.7%BCS 2 2050 26 1.3%BCS 3 215 2 0.9%Total 2851 44 1.5%
0.0%
0.5%
1.0%
1.5%
2.0%
2.5%
3.0%
1 2 3
Percen
t Prolapsed
Body Condition Score
Prolapses by BCS
Prelimina

Iowa Pork Industry Ce
CS and Perineal Score as an Indicator POP Risk
Score 1 2 3
1 2 3 1 2 3 1 2 3
mals 206 966 113 308 941 81 72 141 21
d animals 5 9 1 4 7 1 7 10 0
prolapsed 2.4% 0.9% 0.9% 1.3% 0.7% 1.2% 9.7% 7.1% 0.0%
0%
2%
4%
6%
8%
10%
PS1, BCS1 PS1, BCS2 PS1, BCS3 PS2, BCS1 PS2, BCS2 PS2, BCS3 PS3, BCS1 PS3, BCS2 PS3, BCS3
Percen
t Prolapsed
Perineal Score and Body Condition Scores
Prelimina
Iowa Pork Industry Ce
Questions We Are Still Working On rying to Answer . . . Nutrition Nutrient composition Ingredient levels and sources Mycotoxins Laxatives Antibiotic pulses in the feed
GeneticsDisease outbreaks and health status Parity and performance information like total born Relaxin and other endocrine factors

Iowa Pork Industry Ce
Discussion and Thoughts for the utureA lot has been done in 6 months and a lot more to do…Significant analysis remains to be done on A LOT of data-some still being collected. Conduct additional projects on high and low incidence farms Endocrine assays Genetic approaches Nutritional contributions Etc.
Ultimately to design and employ on farm mitigation studies.

Iowa Pork Industry Ce
hank you to our MANY industry
ollaborators!


