
Non-Invasive Assessment of Liver Fibrosis
Patricia Slev, PhD University of Utah Department of Pathology

Disclosure
• Patricia Slev has no relevant financial relationships to disclose
Outline
• Chronic liver disease & pathogenesis of liver fibrosis • Non-invasive serum markers for assessing liver
fibrosis • Compare and contrast currently available surrogate
serum marker assays for different chronic liver disease etiologies
• Combination algorithms of serum biomarkers or serum biomarkers and elastrography for increased accuracy for assessing liver fibrosis

Chronic Liver Disease
Hepatitis B
Hepatitis C
Non-Alcoholic Fatty Liver Disease (NAFLD)
Alcoholic Liver Disease
Chronic Liver Disease Progressive Fibrosis (reversible)
Cirrhosis
HepatoCellular Carcinoma (HCC)
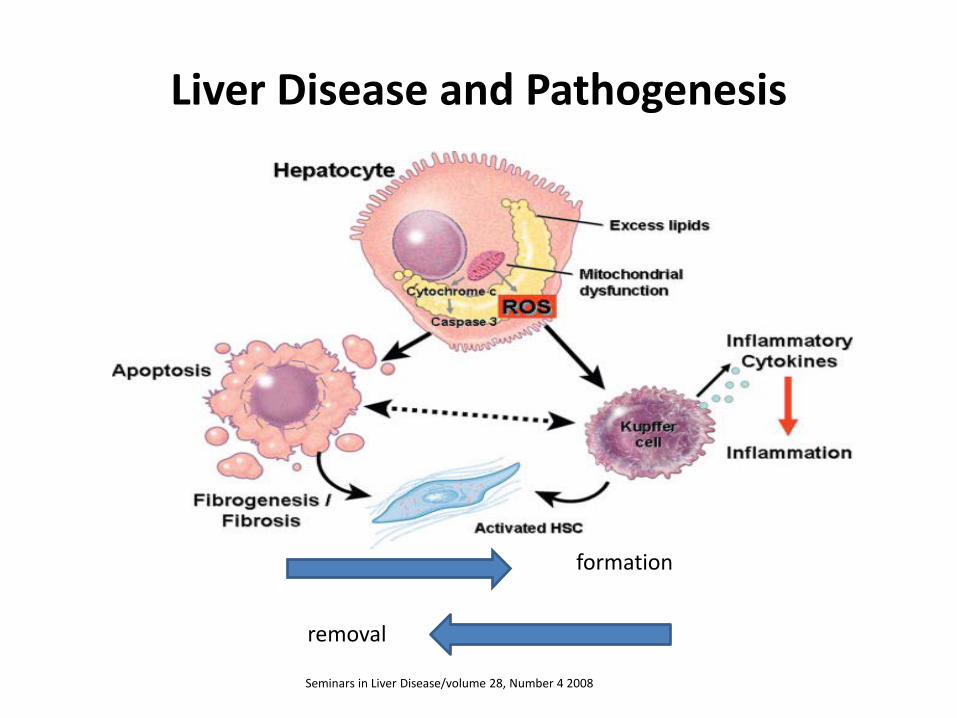
Liver Disease and Pathogenesis
Seminars in Liver Disease/volume 28, Number 4 2008
formation
removal
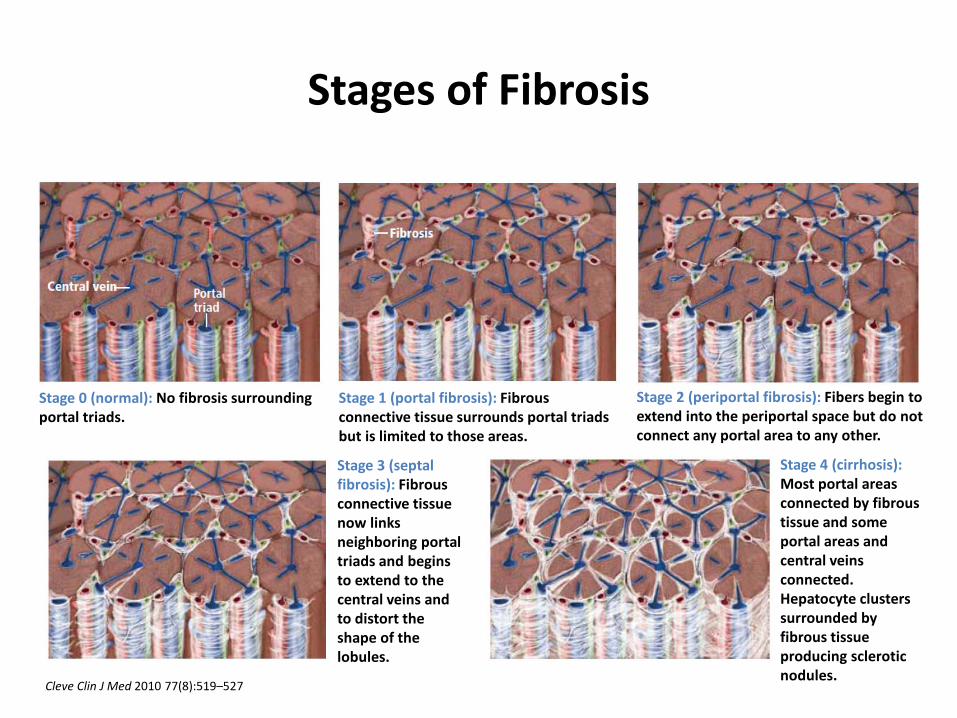
Stages of Fibrosis
Stage 0 (normal): No fibrosis surrounding portal triads.
Stage 1 (portal fibrosis): Fibrous connective tissue surrounds portal triads but is limited to those areas.
Stage 2 (periportal fibrosis): Fibers begin to extend into the periportal space but do not connect any portal area to any other.
Stage 3 (septal fibrosis): Fibrous connective tissue now links neighboring portal triads and begins to extend to the central veins and to distort the shape of the lobules.
Stage 4 (cirrhosis): Most portal areas connected by fibrous tissue and some portal areas and central veins connected. Hepatocyte clusters surrounded by fibrous tissue producing sclerotic nodules.
Cleve Clin J Med 2010 77(8):519–527
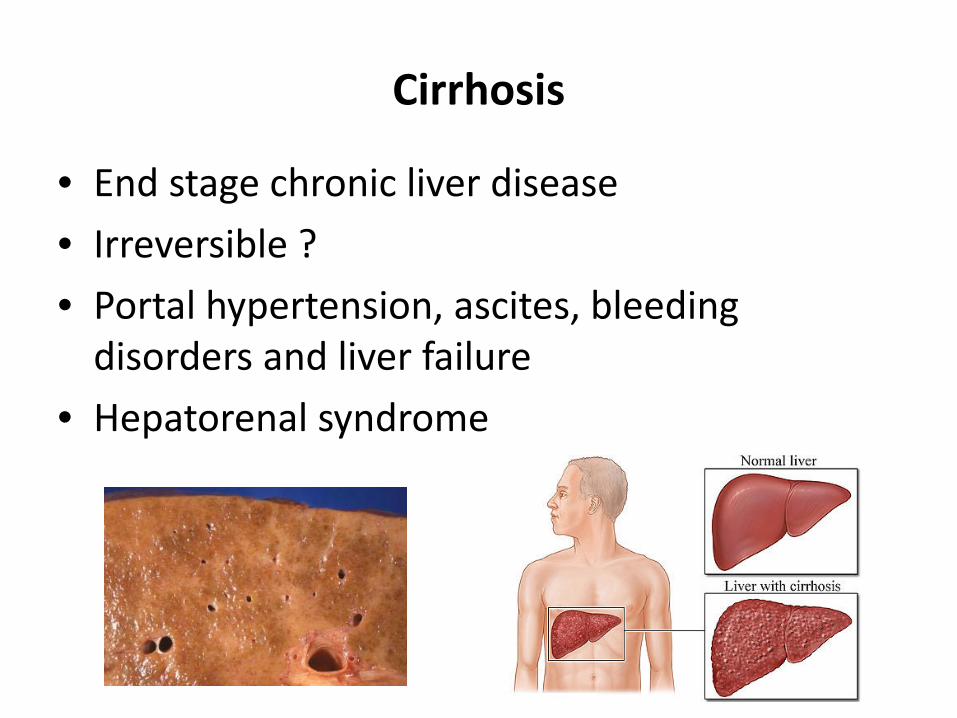
Cirrhosis
• End stage chronic liver disease • Irreversible ? • Portal hypertension, ascites, bleeding
disorders and liver failure • Hepatorenal syndrome

The Reference Standard - Biopsy
• Histological assessment for management of liver disease
diagnosis stage prognosis
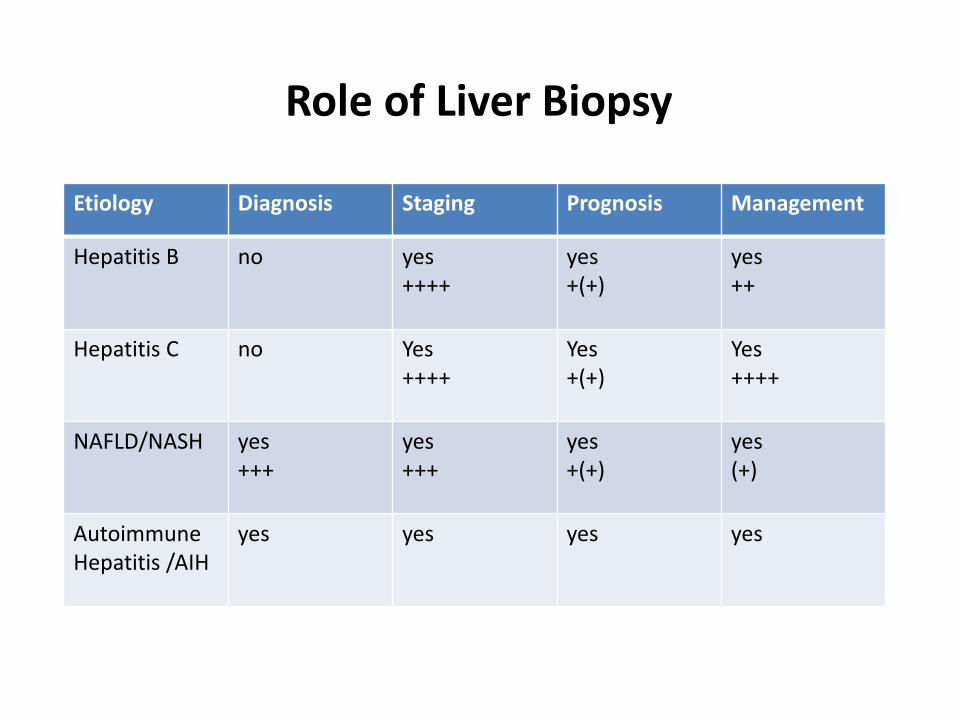
Role of Liver Biopsy
Etiology Diagnosis Staging Prognosis Management
Hepatitis B no yes ++++
yes +(+)
yes ++
Hepatitis C no Yes ++++
Yes +(+)
Yes ++++
NAFLD/NASH yes +++
yes +++
yes +(+)
yes (+)
Autoimmune Hepatitis /AIH
yes yes yes yes
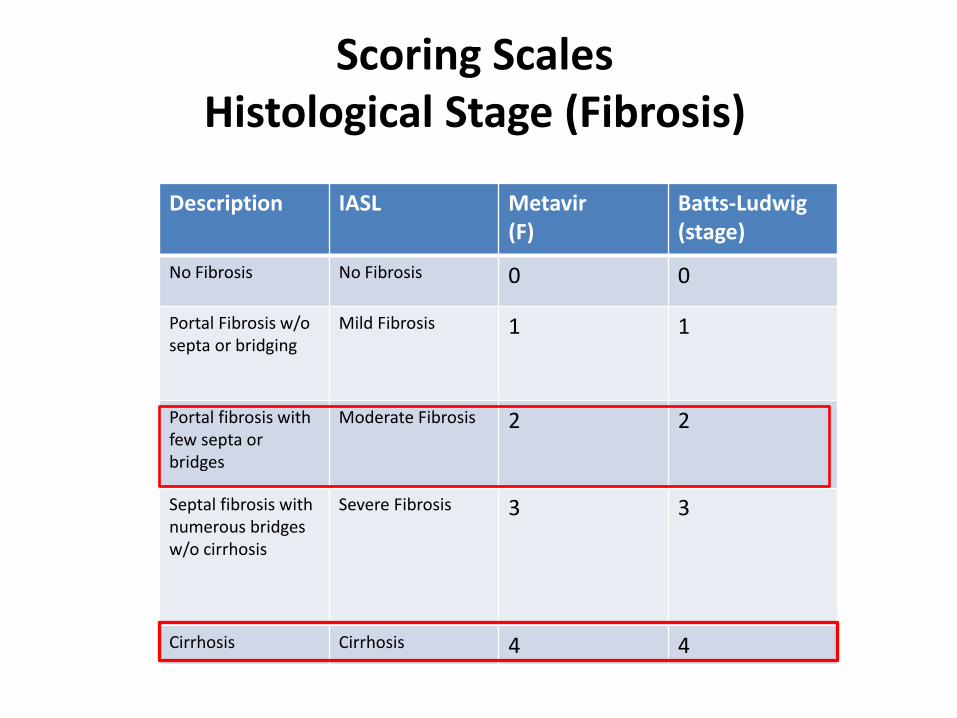
Scoring Scales Histological Stage (Fibrosis)
Description IASL
Metavir (F)
Batts-Ludwig (stage)
No Fibrosis No Fibrosis 0 0
Portal Fibrosis w/o septa or bridging
Mild Fibrosis 1 1
Portal fibrosis with few septa or bridges
Moderate Fibrosis 2 2
Septal fibrosis with numerous bridges w/o cirrhosis
Severe Fibrosis 3 3
Cirrhosis Cirrhosis 4 4

Scoring Scales Histological Grade (Inflammation)
Description IASL Metavir Batts-
Ludwig
No inflammation No activity
Minimal chronic hepatitis
A0 0
Mild inflammation Mild activity
Mild chronic hepatitis
A1 1
Moderate inflammation Moderate activity
Moderate chronic hepatitis
A2 2
Severe Inflammation Severe activity
Severe chronic hepatitis
A3 3
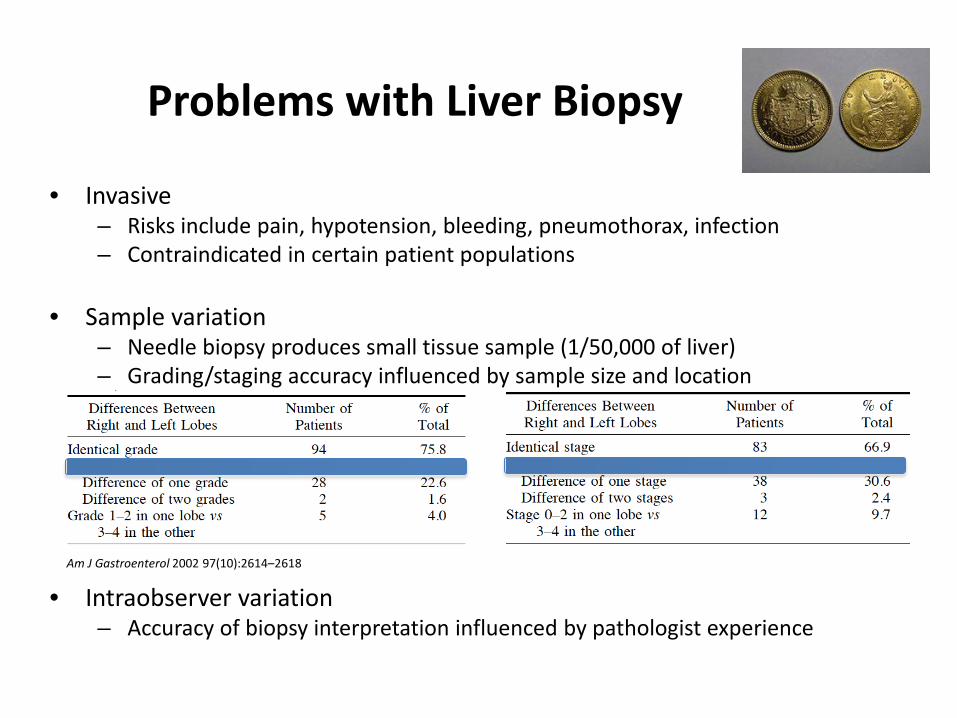
• Invasive – Risks include pain, hypotension, bleeding, pneumothorax, infection – Contraindicated in certain patient populations
• Sample variation
– Needle biopsy produces small tissue sample (1/50,000 of liver) – Grading/staging accuracy influenced by sample size and location
• Intraobserver variation – Accuracy of biopsy interpretation influenced by pathologist experience
Problems with Liver Biopsy
Am J Gastroenterol 2002 97(10):2614–2618
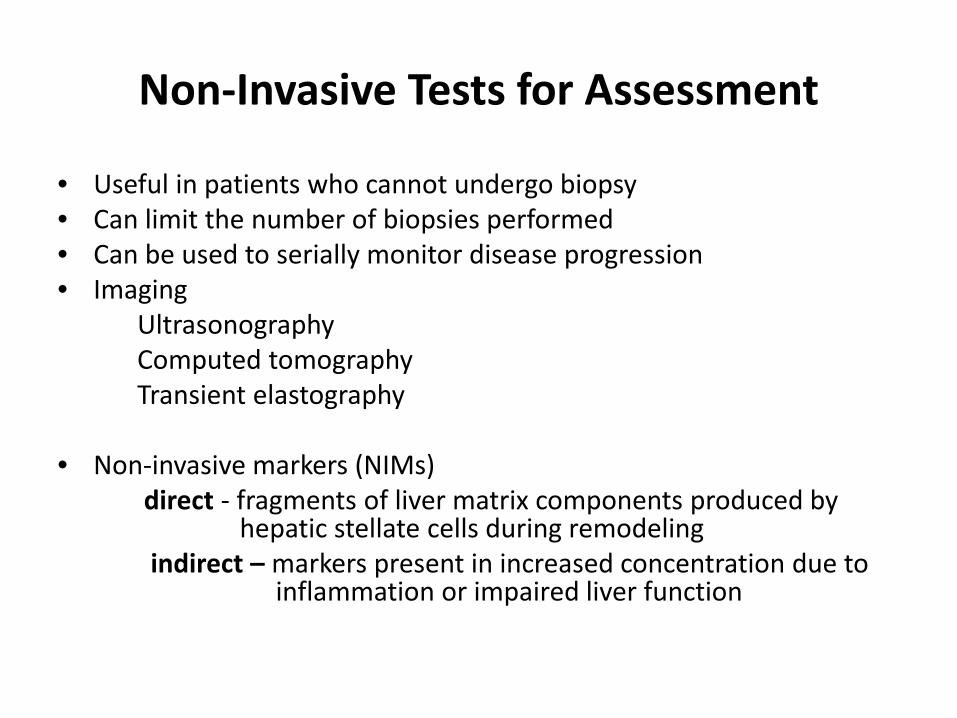
• Useful in patients who cannot undergo biopsy • Can limit the number of biopsies performed • Can be used to serially monitor disease progression • Imaging Ultrasonography Computed tomography Transient elastography • Non-invasive markers (NIMs) direct - fragments of liver matrix components produced by hepatic stellate cells during remodeling indirect – markers present in increased concentration due to inflammation or impaired liver function
Non-Invasive Tests for Assessment

Liver biopsy Non-invasive test
Advantages Direct; semi-quantitative; evaluation of co-existing pathologies
Measurement of global fibrosis; suitable for serial observations
Limitations Sampling error; intra-observer variability; possible hospitalization
Indirect
Risks Pain; bleeding; pneumothorax; hemothorax; infection
None
Cost Expensive Varies but usually less than biopsy
Contraindications Uncooperative patient; severe coagulopathy; extrahepatic biliary obstruction; ascites; morbid obesity
Non-hepatic influences on biomarkers (hemolysis, Gilbert’s syndrome; thrombocytopenia, etc.)
Biopsy vs. Non-invasive Test Comparison

Category Examples
ECM enzymes • Prolyl-hydroxylase • Lysyl-oxidase • Collagen peptidase
Fragments of collagen degradation • Procollagen type I, type III , IV and VI
Glycoproteins & MMPs • Laminin • MMP-2 • Vitronectin • ICAM • VCAM • TIMP-1 and TIMP-2
Glycosaminoglycans • Hyaluronic acid
Cytokines • TGF-β
Direct Tests Tests not routinely performed in clinical lab
ECM Remodeling

Indirect Tests Markers that reflect the functional alterations of the liver impairment inflamamtion
Tests commonly performed in clinical lab (some exceptions) Test name Constituents
AST/ALT ratio • AST • ALT
AST/Platelet ratio • AST • Platelet count
FibroSure (FibroTest)
• GGT • ALT • Bilirubin
• Haptoglobin • Apo A1 • α2 macroglobulin
HepaScore • GGT • Bilirubin
• α2 macroglobulin • Hyaluronic acid
FibroMeter (viral/ALD/NAFLD)
• Platelet count • PT index • ALT • AST • GGT
• α2 macroglobulin • Hyaluronic acid • Ferritin • Glucose • Urea
Coag Factors

Combined Biomarkers & Algorithms
• APRI • Fibrotest/Fibrosure • Fibrospect II • Fibrometer • Others – HepaScore, Fib-4, Forns and
European Liver Fibrosis (ELF)

• Derived and validated from chronic HCV
• Best at excluding significant fibrosis and cirrhosis
AST/Platelet Ratio Index (APRI)
Significant Fibrosis (47% prevalence)
Cirrhosis (15% prevalence)
Rule in >1.5 (PPV 88%)
>2.0 (PPV 57%)
Rule out <0.5 (NPV 86%)
<1.0 (NPV 98%)
Hepatology 2003 38(2):518–526
Hepatology 2007 46(3):912-921
@50% prevalence NPV is 75% @30% prevalence NPV is 86%
@15% prevalence NPV is 91%
Avoids ~30% of biopsies

Fibr
oSur
e Te
st
Age
Gen
der
Hei
ght
Wei
ght
α2-m
acro
glob
ulin
Hap
togl
obin
Apo
A1
Bilir
ubin
GG
T
ALT
AST
Chol
este
rol
Trig
lyce
ride
Glu
cose
HCV ✔ ✔ ✔ ✔ ✔ ✔ ✔ ✔
ASH & NASH
✔ ✔ ✔ ✔ ✔ ✔ ✔ ✔ ✔ ✔ ✔ ✔ ✔ ✔
Fibrosure Test Family
Each test type util izes proprietary algorithms that evaluates surrogate biomarker concentration and provide a score indicative of fibrosis stage and grade

Fibrosure Scale
Comp Hepatol 2004 3(1):8
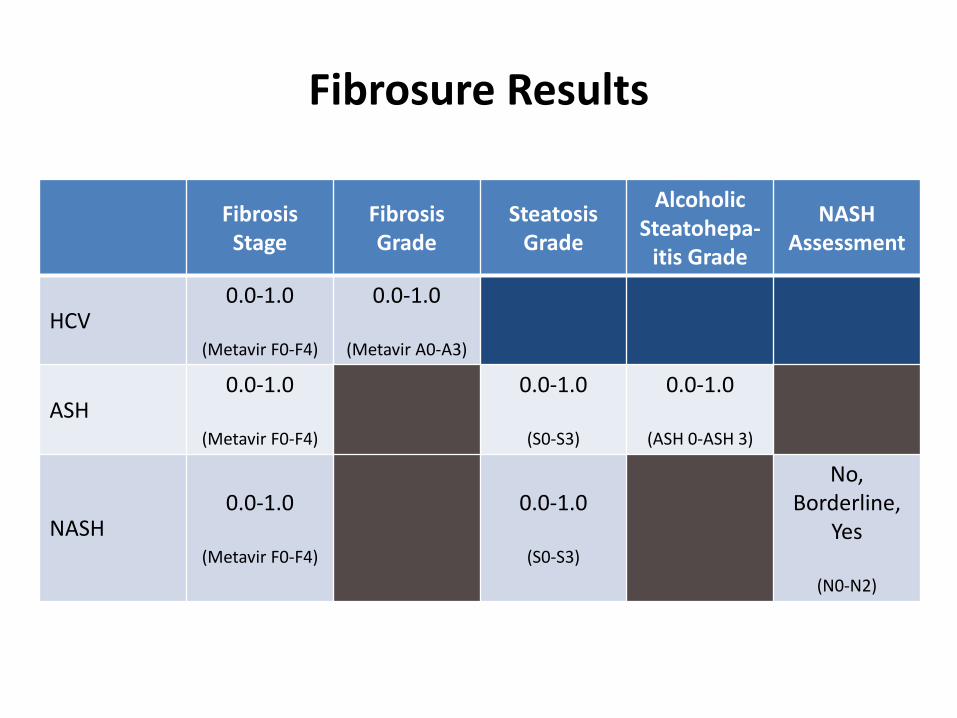
Fibrosis Stage
Fibrosis Grade
Steatosis Grade
Alcoholic Steatohepa-
itis Grade
NASH Assessment
HCV 0.0-1.0
(Metavir F0-F4)
0.0-1.0
(Metavir A0-A3)
ASH 0.0-1.0
(Metavir F0-F4)
0.0-1.0
(S0-S3)
0.0-1.0
(ASH 0-ASH 3)
NASH 0.0-1.0
(Metavir F0-F4)
0.0-1.0
(S0-S3)
No, Borderline,
Yes
(N0-N2)
Fibrosure Results

Fibr
osur
e Pa
nel AUROC Sensitivity (%) Specificity (%) PPV (%) NPV (%)
≥F2 F4 ≥F2 F4 ≥F2 F4 ≥F2 F4 ≥F2 F4
HCV 0.74-0.87 0.71-0.87 65-77 50-87 72-91 70-93 76-80 58-93 67-87 44-91
HBV 0.78-0.85 0.76 54-81 56 80-90 96 53-96 90 64-81 87
ASH 0.79-0.89 0.94-0.95 55-84 91-100 66-93 50-87 82-93 47-76 70-53 96-99
NASH 0.75-0.86 NA 71-83 NA 74-78 NA 53-56 NA 84-94 NA
HIV/HCV HIV/HBV 0.77-0.85 0.87 66-97 75-100 65-92 65-85 80-86 30-50 61-93 94-99
Fibrosure Performance by Panel
Clin Chem Lab Med 2011 49(1):13-32
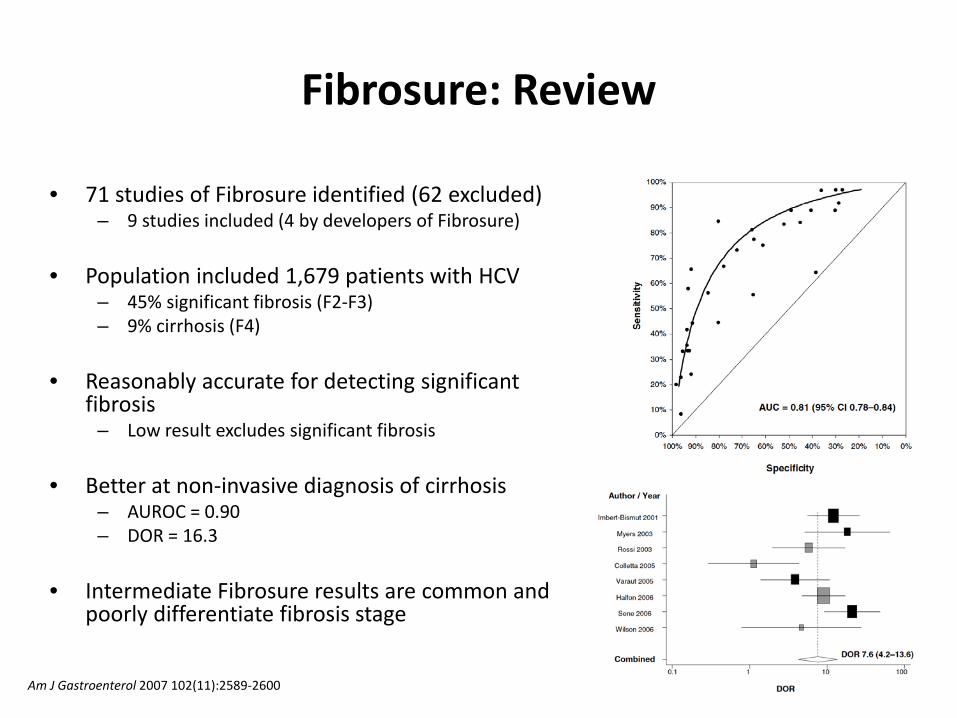
• 71 studies of Fibrosure identified (62 excluded) – 9 studies included (4 by developers of Fibrosure)
• Population included 1,679 patients with HCV
– 45% significant fibrosis (F2-F3) – 9% cirrhosis (F4)
• Reasonably accurate for detecting significant
fibrosis – Low result excludes significant fibrosis
• Better at non-invasive diagnosis of cirrhosis
– AUROC = 0.90 – DOR = 16.3
• Intermediate Fibrosure results are common and
poorly differentiate fibrosis stage
Fibrosure: Review
Am J Gastroenterol 2007 102(11):2589-2600

• False positive results – Hemolysis
• Decreased haptoglobin • Ribavirin therapy for HCV
– Extrahepatic cholestasis; Gilbert’s syndrome
• Increased bilirubin – Inflammation
• Increased α2-macroglobulin – Acute hepatitis
• False negative results
– Inflammation • Increased haptoglobin
Fibrosure Limitations
ALT A2-macroglobulin Bilirubin GGT
Apo A1 Haptoglobin
• Developed at the University of Angers (France) and first described in 1997 – 2nd generation test in 2005 – 3rd generation test in 2010
• Available only in Europe and now in the US
– Lab performs the tests and send results to Echosens for score calculation
• 3 FibroMeter Assays – Chronic viral hepatitis (HBC, HCV, HIV-coinfection) – Alcoholic liver disease – Non-alcoholic fatty liver disease
• Provides scores for
– Fibrosis stage (Metavir) – Inflammation – Area of fibrosis (percent)
• Results evaluated by an “expert system” to detect discordant results of component tests
– Eliminates analyte from algorithm to correct possible false-positive/negative results
Fibrometer

FibroMeter Parameter
Age
Gen
der
Wei
ght
α2 m
acro
Hyal
uron
ic a
cid
PT In
dex
Plat
elet
s
AST
Ure
a
GGT
ALT
Ferr
itin
Glu
cose
Viral
Fibrosis score ✔ ✔ ✔ ✔ ✔ ✔ ✔ ✔ ✔
Cirrhosis score ✔ ✔ ✔ ✔ ✔ ✔ ✔ ✔ ✔
Activity score ✔ ✔ ✔ ✔
ALD Fibrosis score ✔ ✔ ✔ ✔ ✔
Area of fibrosis ✔ ✔ ✔ ✔
NAFLD Fibrosis score ✔ ✔ ✔ ✔ ✔ ✔ ✔ ✔
Area of fibrosis ✔ ✔ ✔ ✔ ✔ ✔
Fibrometer Test Family
Hyaluronic acid is used for NAFLD for estimating liver fibrosis area

Fibrometer Performance
Hepatology 2005 42(6):1373-1381
Viral ALD 0.5 cutoff Viral ALD
Sens (%) 81 92
Spec (%) 84 93
PPV (%) 86 97
NPV (%) 78 83
For stage ≥F2
AURO
C

Fibrometer Performance
• Area of fibrosis estimated by FM showed less variability than when done by biopsy
Hepatology 2005 42(6):1373-1381
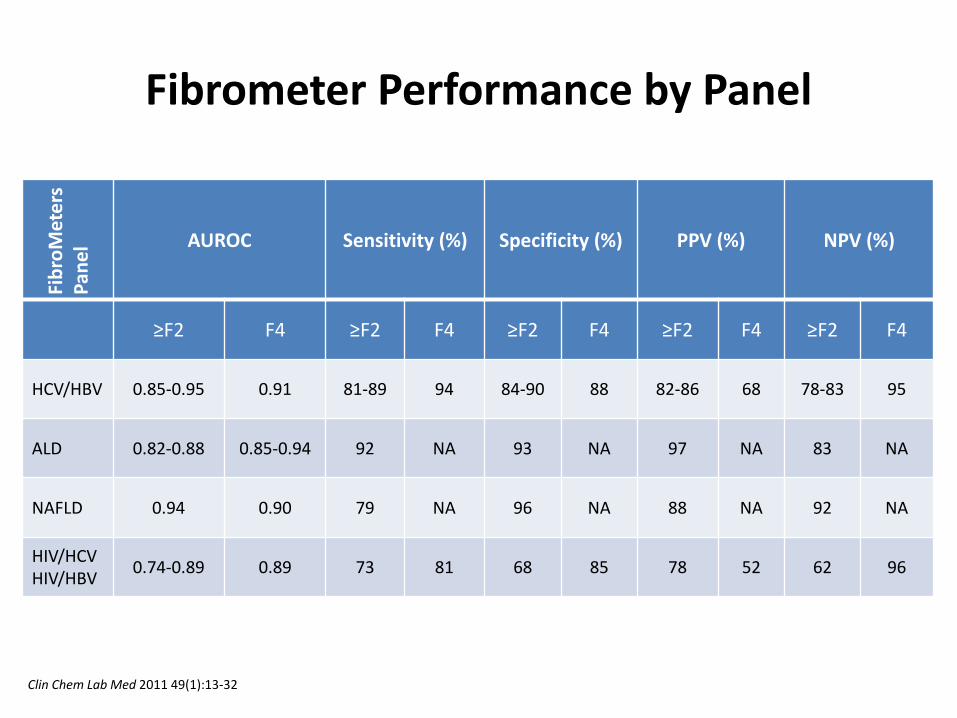
Fibr
oMet
ers
Pane
l AUROC Sensitivity (%) Specificity (%) PPV (%) NPV (%)
≥F2 F4 ≥F2 F4 ≥F2 F4 ≥F2 F4 ≥F2 F4
HCV/HBV 0.85-0.95 0.91 81-89 94 84-90 88 82-86 68 78-83 95
ALD 0.82-0.88 0.85-0.94 92 NA 93 NA 97 NA 83 NA
NAFLD 0.94 0.90 79 NA 96 NA 88 NA 92 NA
HIV/HCV HIV/HBV 0.74-0.89 0.89 73 81 68 85 78 52 62 96
Fibrometer Performance by Panel
Clin Chem Lab Med 2011 49(1):13-32

Fibrometer vs Fibrotest(sure)
J Hepatol 2007 46(3):395-402
• Tests that include HA (FM and HS) had highest likelihood ratios and narrower score ranges for stages F3 and F4
• FT better than FM at stage F1 (19 vs. 30% misclassification rate)
• FM better than FT at all other stages, particularly F4
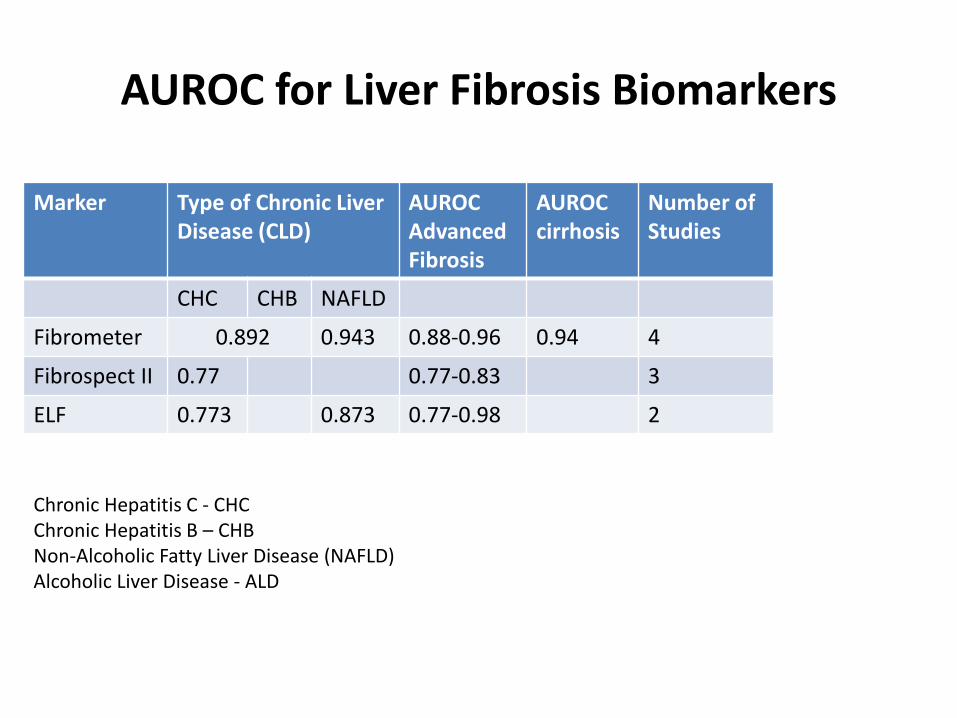
AUROC for Liver Fibrosis Biomarkers
Marker Type of Chronic Liver Disease (CLD)
AUROC Advanced Fibrosis
AUROC cirrhosis
Number of Studies
CHC CHB NAFLD
Fibrometer 0.892 0.943 0.88-0.96 0.94 4
Fibrospect II 0.77 0.77-0.83 3
ELF 0.773 0.873 0.77-0.98 2
Chronic Hepatitis C - CHC Chronic Hepatitis B – CHB Non-Alcoholic Fatty Liver Disease (NAFLD) Alcoholic Liver Disease - ALD

• Non-invasive markers of do not surpass 75–80% diagnostic accuracy which limits their implementation in clinical practice
• Accuracy may be improved by combining non-invasive tests into diagnostic algorithms – Limit biopsy to those patients in which noninvasive markers have
reduced accuracy
• Sequential Algorithm for Fibrosis Evaluation (SAFE) – 2,035 HCV patients undergoing biopsy
• 46% with significant fibrosis • 9% with cirrhosis
– APRI + Fibrosure performed on blood collected at biopsy
Non-invasive test algorithms
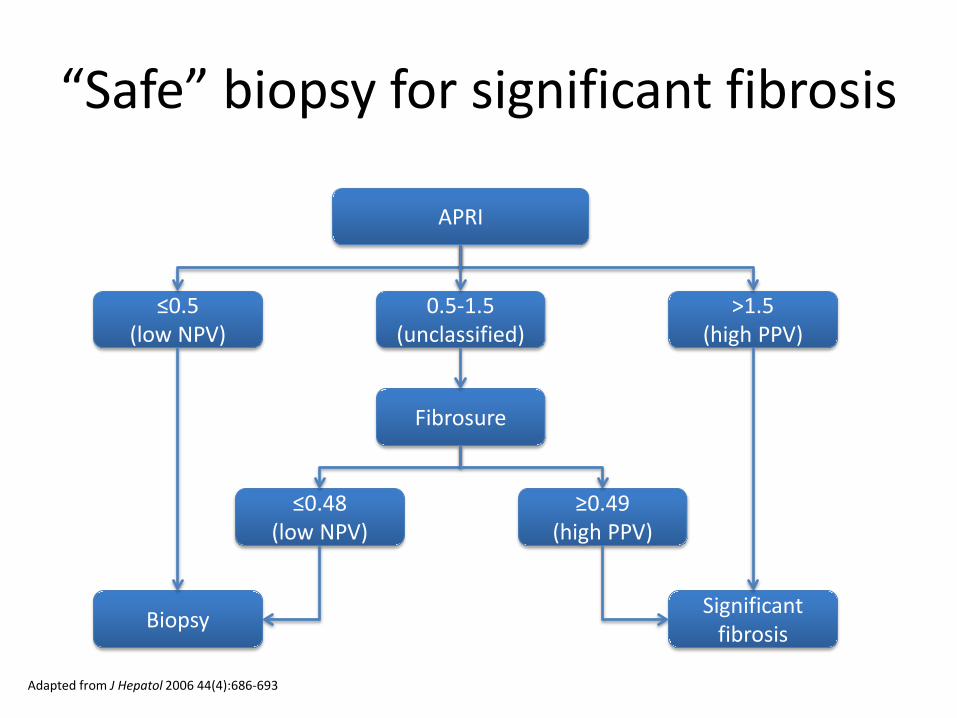
“Safe” biopsy for significant fibrosis
APRI
≤0.5 (low NPV)
0.5-1.5 (unclassified)
>1.5 (high PPV)
Biopsy
Fibrosure
≥0.49 (high PPV)
≤0.48 (low NPV)
Significant fibrosis
Adapted from J Hepatol 2006 44(4):686-693
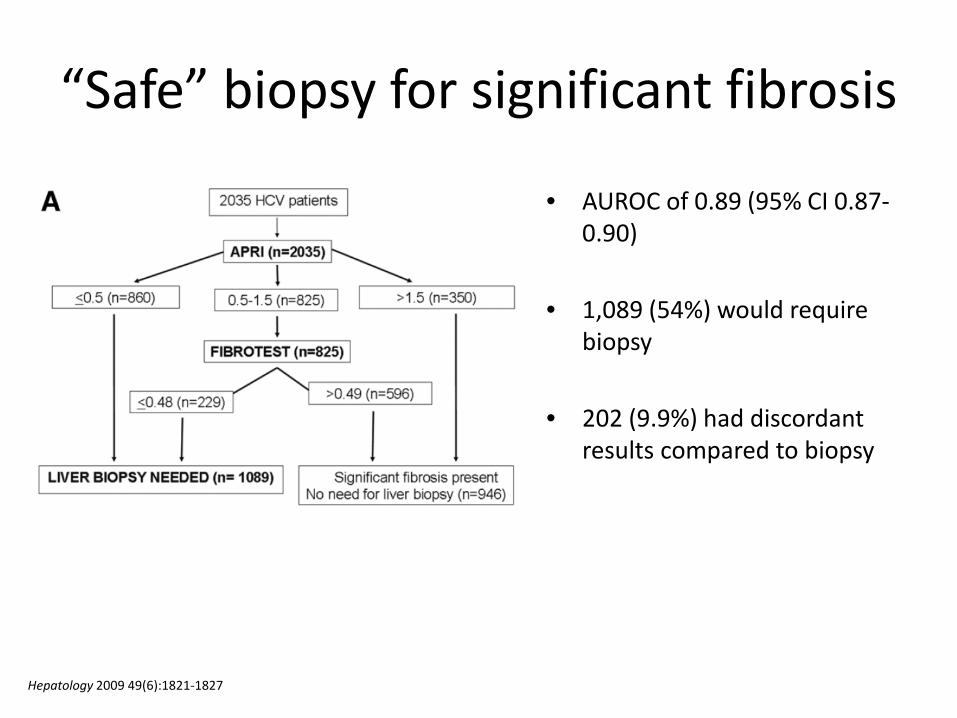
• AUROC of 0.89 (95% CI 0.87-0.90)
• 1,089 (54%) would require biopsy
• 202 (9.9%) had discordant results compared to biopsy
“Safe” biopsy for significant fibrosis
Hepatology 2009 49(6):1821-1827

“Safe” biopsy for cirrhosis
APRI
≤1 (high NPV)
1-2 (unclassified)
>2 (low PPV)
No cirrhosis
Fibrosure
0.49-0.74 (low NPV)
≥0.75 (high PPV)
≤0.48 (high NPV)
Biopsy Cirrhosis
Adapted from J Hepatol 2006 44(4):686-693
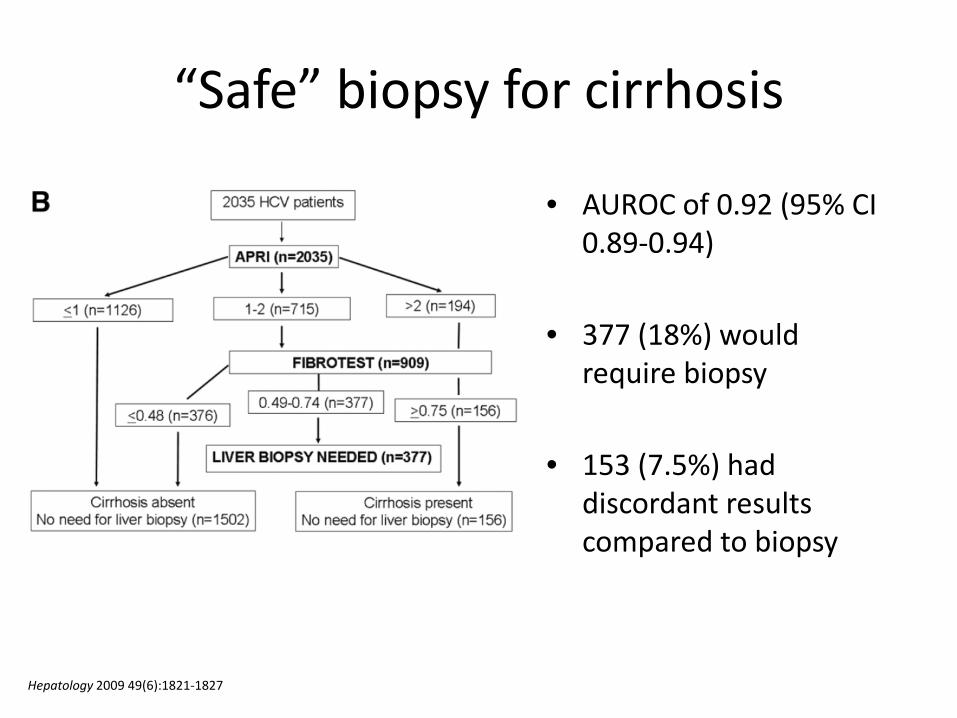
“Safe” biopsy for cirrhosis
• AUROC of 0.92 (95% CI 0.89-0.94)
• 377 (18%) would require biopsy
• 153 (7.5%) had discordant results compared to biopsy
Hepatology 2009 49(6):1821-1827

Liver Fibrosis Assessment
biopsy serum biomarkers
transient elastography

• Ultrasound-based measurement of liver stiffness
• Transducer probe mounted on axis of a vibrator
• Vibrator induces an elastic shear wave that propagates through underlying tissue
• Pulse-echo ultrasound measures velocity of shear wave which is directly related to tissue stiffness
• The stiffer the tissue, the faster the shear wave propagates
• Patented device marketed as FibroScan (Echosens, Paris, France) • FDA-cleared
Transient Elastography

• Liver stiffness values range from 2.5 to 75 kPa
• Result interpreted against cut-offs (vary by study) – No fibrosis <5 kPa – Significant fibrosis 7.1–8.7 kPa – Cirrhosis 12.5–14.5 kPa
• FibroScan accuracy similar to blood-based tests and is best for the
diagnosis of cirrhosis – Meta-analysis concluded that TE is not sufficiently sensitive for the diagnosis
of significant fibrosis (J Heptaol 2011 45:650-659)
• Measurement limitations
– Difficult in obese patients or in those with narrow intercostal space – Impossible in patients with ascites
Transient Elastography
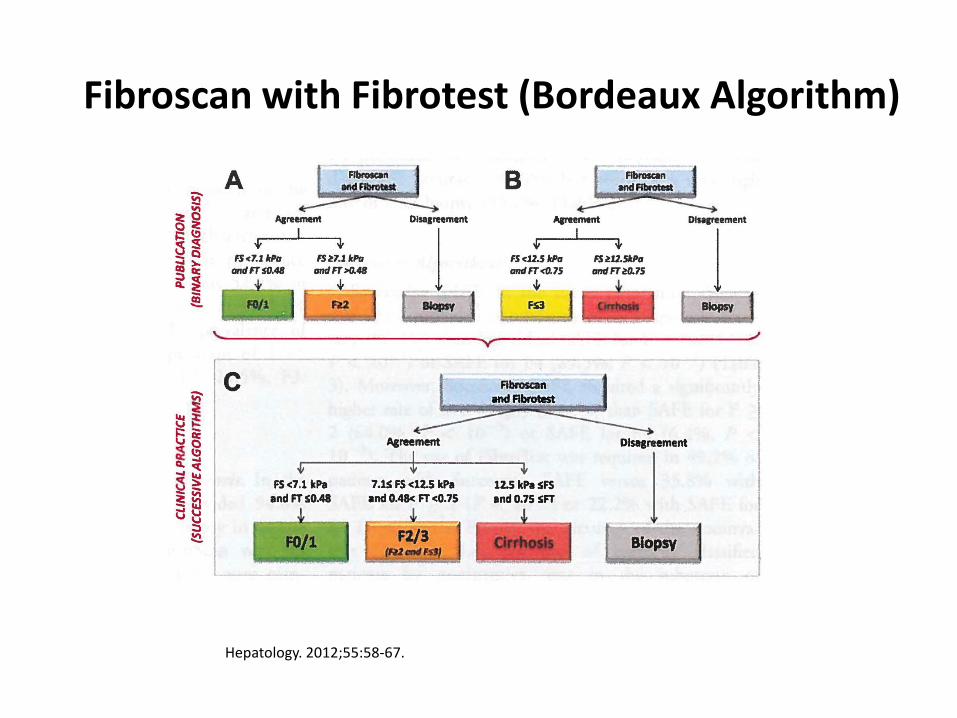
Fibroscan with Fibrotest (Bordeaux Algorithm)
Hepatology. 2012;55:58-67.

Fibrometer and Fibroscan
Fibrometer + Fibroscan Hepatology. 2012;55:58-67.
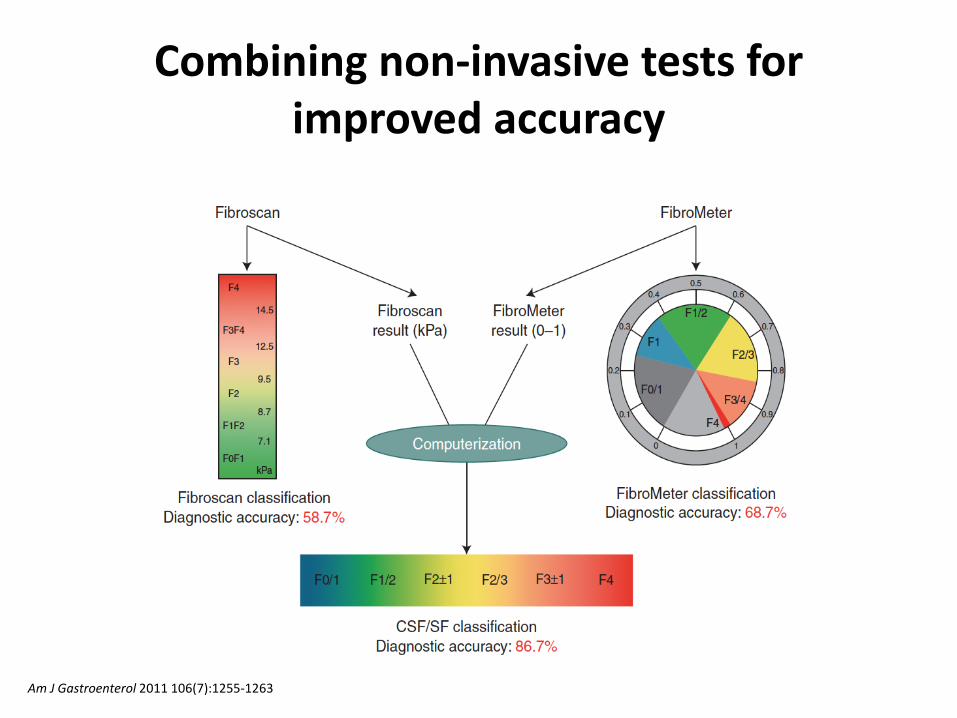
Combining non-invasive tests for improved accuracy
Am J Gastroenterol 2011 106(7):1255-1263

Combining Non-invasive Tests for Improved Accuracy
Diagnosis Test AUROC
Significant fibrosis (≥F2)
FibroScan 0.791
FibroMeter 0.813
CSF-index 0.846
Severe fibrosis (≥F3)
FibroScan 0.847
FibroMeter 0.829
SF-index 0.875
Cirrhosis (F4)
FibroScan 0.905
FibroMeter 0.861
C-index 0.921
Am J Gastroenterol 2011 106(7):1255-1263
• Combined tests (indexes) performed better than individual components

HCV Management Guidelines
• AASLD/IDSA guidance[1] – Most efficient strategy combines serum biomarkers and
transient liver elastography[2]
– Consider biopsy for any patient with discordant results between 2 testing methods if the information will affect clinical decisions
1. AASLD/IDSA HCV Management Guidance. October 2014. 2. Boursier J, et al. Hepatology. 2012;55:58-67.
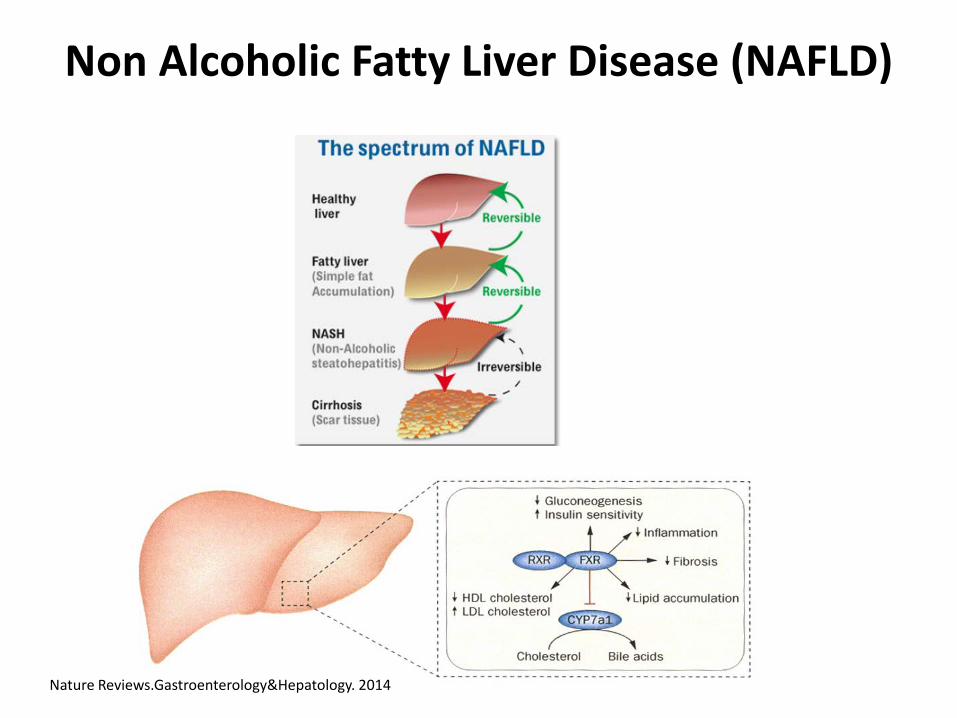
Non Alcoholic Fatty Liver Disease (NAFLD)
Nature Reviews.Gastroenterology&Hepatology. 2014

Author Test N AUROC Se SPE
Rosenberg ELF 61 0.87 89 96
Ratziu Fibrotest 267 0.81 77 77
Cales Fibrometer 235 0.943 78.5 95.9
Accuracy of Diagnostic Panels for Advanced Fibrosis in NAFLD
Biomarker Research, 2013.1:7

Summary
• Liver biopsy is the cornerstone of managing patients with chronic liver disease and remains the reference method for assessing liver fibrosis
• Non-invasive biomarker panels do not have sufficient accuracy to replace biopsy
• Non-invasive biomarker assays combined with transient elastography provides increased accuracy
• Algorithms that combine two or more serum biomarker assays or biomarker assay and transient elastography can be used to provide enough accuracy for staging liver fibrosis and reduce the number of biopsies needed

Acknowledgements
• Dr. David Grenache


