
2-3 April. 2015
By Edlyn Surya Abu Bakar
Indah Water Konsortium Sdn Bhd
Past, Present & Future
Regional Policy Workshop on Wastewater Management and Sanitation in South-East Asia
2-3 April. 2015
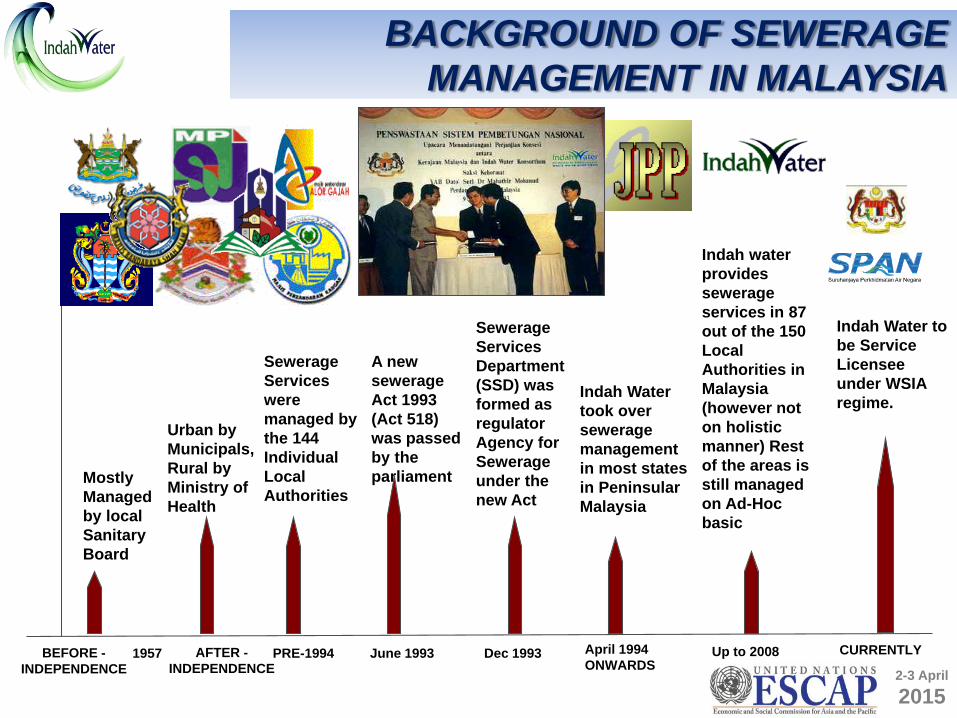
MostlyManaged by local Sanitary Board
Urban by Municipals, Rural by Ministry of Health
A new sewerage Act 1993 (Act 518) was passed by the parliament
Sewerage Services Department (SSD) was formed as regulator Agency for Sewerage under the new Act
Indah Water took over sewerage management in most states in Peninsular Malaysia
Indah water provides sewerage services in 87 out of the 150 Local Authorities in Malaysia (however not on holistic manner) Rest of the areas is still managed on Ad-Hoc basic
BEFORE -INDEPENDENCE
AFTER -INDEPENDENCE
PRE-1994 June 1993 Dec 1993
Sewerage Services were managed by the 144 Individual Local Authorities
April 1994 ONWARDS
CURRENTLY1957 Up to 2008
Indah Water to be Service Licensee under WSIA regime.
BACKGROUND OF SEWERAGE MANAGEMENT IN MALAYSIA

2-3 April. 2015
Ministry of Finance
Regulator of Sewerage Services
Regulator of Effluent
Standards
Ministry of Natural Resources & Environment
Ministry of Energy, Green Technology &
Water
• 100% Equity• Govt. Support Loan & Subsidy
1. Sewerage Services2. Operator in 87 Local
Authority Areas. 3. Sewerage Services Billing
& Collection. 4. Undertakes
Refurbishment/ Upgrading Projects Funded by Govt.
Policy & Control of National Sewerage
Agenda
GOVERNANCE STRUCTURE OF SEWERAGE SERVICES IN MALAYSIA

2-3 April. 2015
IWK covers most parts of Malaysia for operation and maintenance whilst providingtechnical expertise to the remaining un-serviced area.
IWK Coverage21 Unit Offices87 Local Authority from 149 Local Authority in Malaysia
IWK – MALAYSIA’S NATIONAL SEWERAGE COMPANY

2-3 April. 2015
EVOLUTION OF SEWERAGE SYSTEMS
Year
Technology
1950-s 1970-s 1980-s 1990-s 2000
Primitive / Primary Treatment Partial / Full Secondary Treatment
1960-s
Pour Flush Septic Tank Imhoff Tank OP/ALActivated Sludge/Biological Filters
Fully MechanisedRegionalised Plant
Address Public Health Address River Pollution Address Environment
Tertiary Treatment
2-3 April. 2015
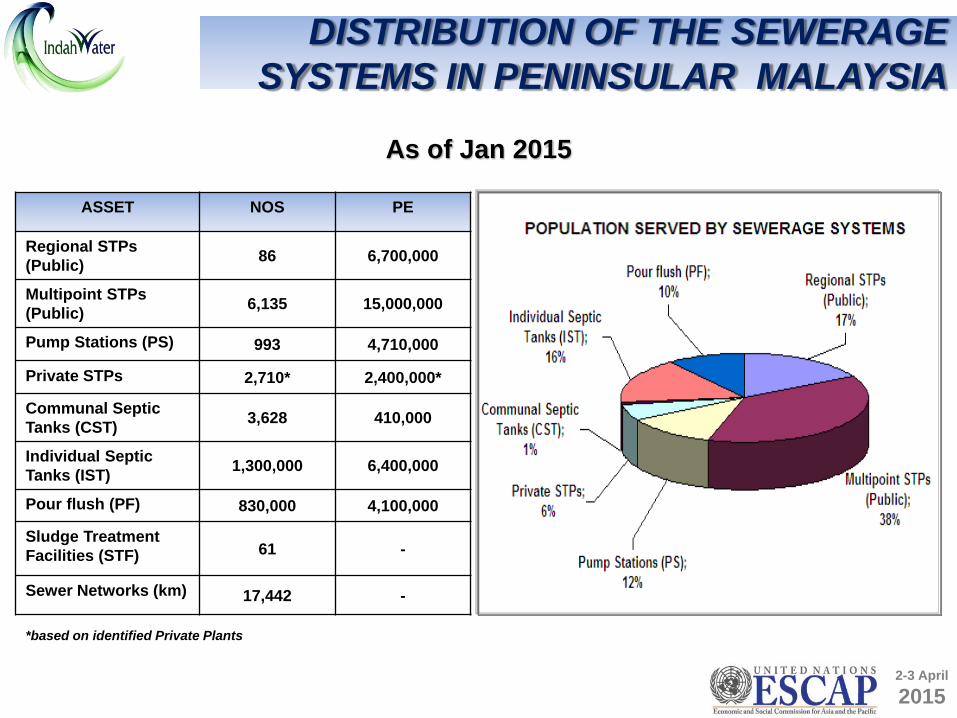
DISTRIBUTION OF THE SEWERAGE SYSTEMS IN PENINSULAR MALAYSIA
ASSET NOS PE
Regional STPs (Public) 86 6,700,000
Multipoint STPs (Public) 6,135 15,000,000
Pump Stations (PS) 993 4,710,000
Private STPs 2,710* 2,400,000*
Communal Septic Tanks (CST) 3,628 410,000
Individual Septic Tanks (IST) 1,300,000 6,400,000
Pour flush (PF) 830,000 4,100,000
Sludge Treatment Facilities (STF) 61 -
Sewer Networks (km) 17,442 -
*based on identified Private Plants
As of Jan 2015
2-3 April. 2015
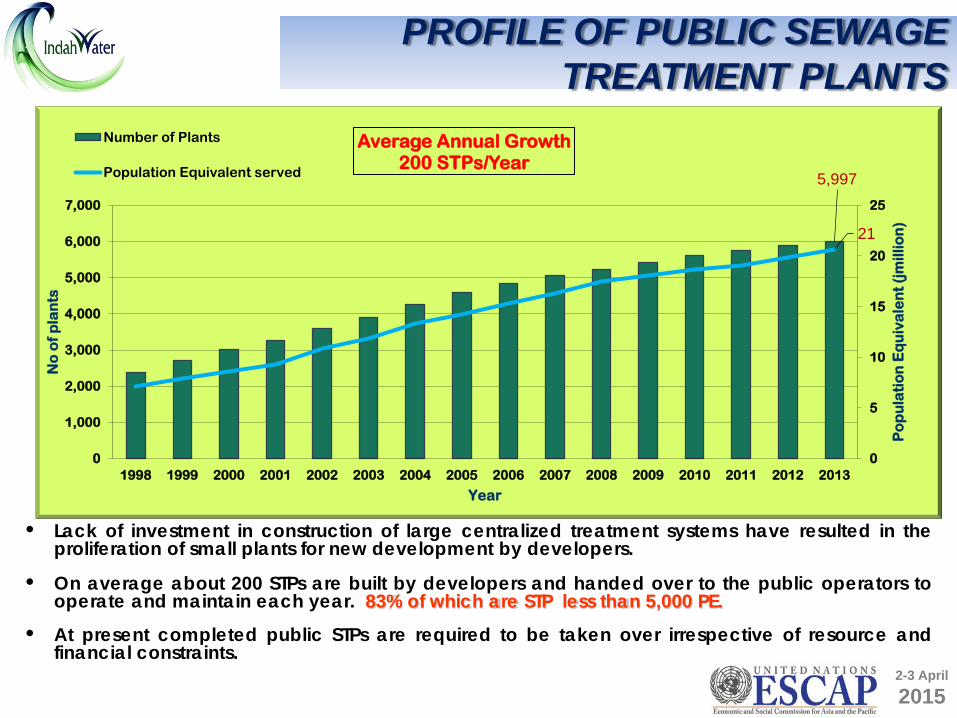
PROFILE OF PUBLIC SEWAGE TREATMENT PLANTS
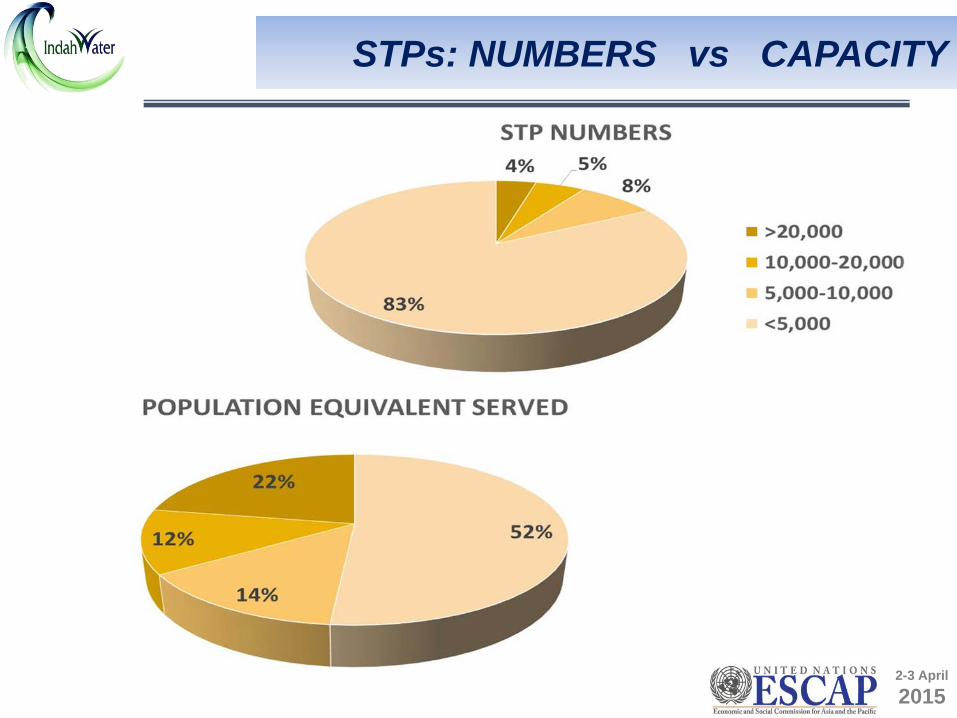
• Lack of investment in construction of large centralized treatment systems have resulted in theproliferation of small plants for new development by developers.
• On average about 200 STPs are built by developers and handed over to the public operators tooperate and maintain each year. 83% of which are STP less than 5,000 PE.
• At present completed public STPs are required to be taken over irrespective of resource andfinancial constraints.
5,997
21
0
5
10
15
20
25
0
1,000
2,000
3,000
4,000
5,000
6,000
7,000
1998 1999 2000 2001 2002 2003 2004 2005 2006 2007 2008 2009 2010 2011 2012 2013
Po
pu
lati
on
Eq
uiv
ale
nt
(jm
illio
n)
No
of
pla
nts
Year
Average Annual Growth 200 STPs/Year
Number of Plants
Population Equivalent served

2-3 April. 2015
All Plants ConnectedPE
Cost Per PE
Direct O&MCost(RM)
Total SewerageManagement Cost
(RM)
PE range > 50k 6,100,000 X Y
PE range 20k – 50k 2,900,000 1.9X 1.8Y
PE range 10k -20k 3,100,000 2.2X 1.9Y
PE range 5k-10k 2,800,000 2.5X 3.3Y
PE range 2k-5k 3,100,000 3.0X 2.7Y
PE range <2k 3,100,000 5.5X 5.3Y
Total 21,100,000 2.5X 2.4Y
COST IMPLICATION OF MANAGING CENTRALIZED & DECENTRALIZED SYSTEM
• Direct O&M Cost – Overhead Cost• Total Sewerage Management Cost- Includes Recharge Cost
2-3 April. 2015
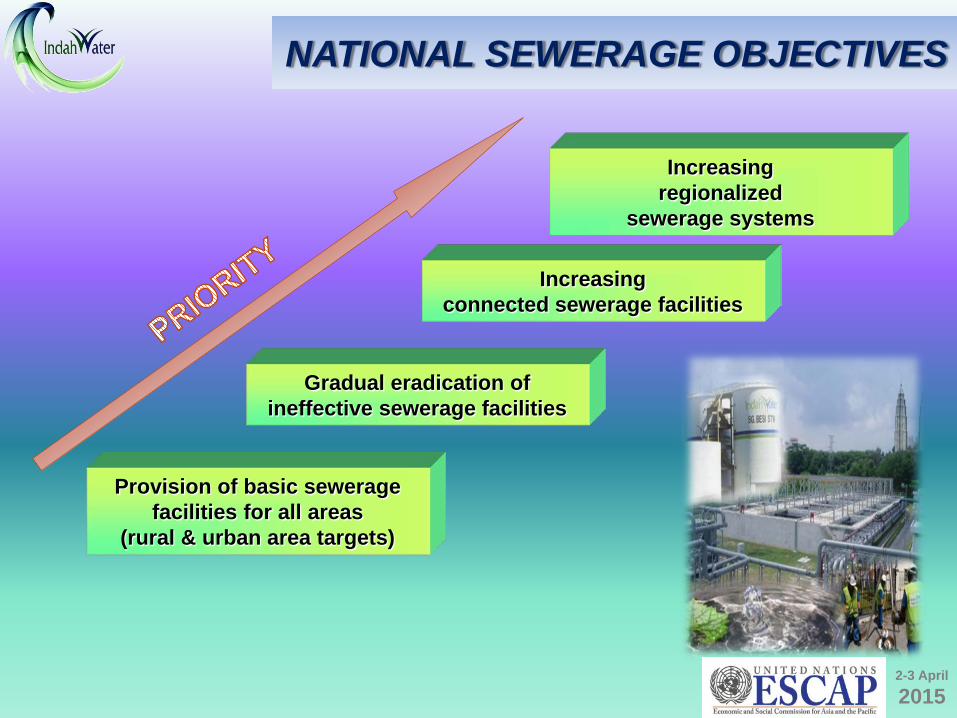
Provision of basic sewerage facilities for all areas
(rural & urban area targets)
Gradual eradication of ineffective sewerage facilities
Increasing connected sewerage facilities
Increasing regionalized
sewerage systems
NATIONAL SEWERAGE OBJECTIVES
2-3 April. 2015
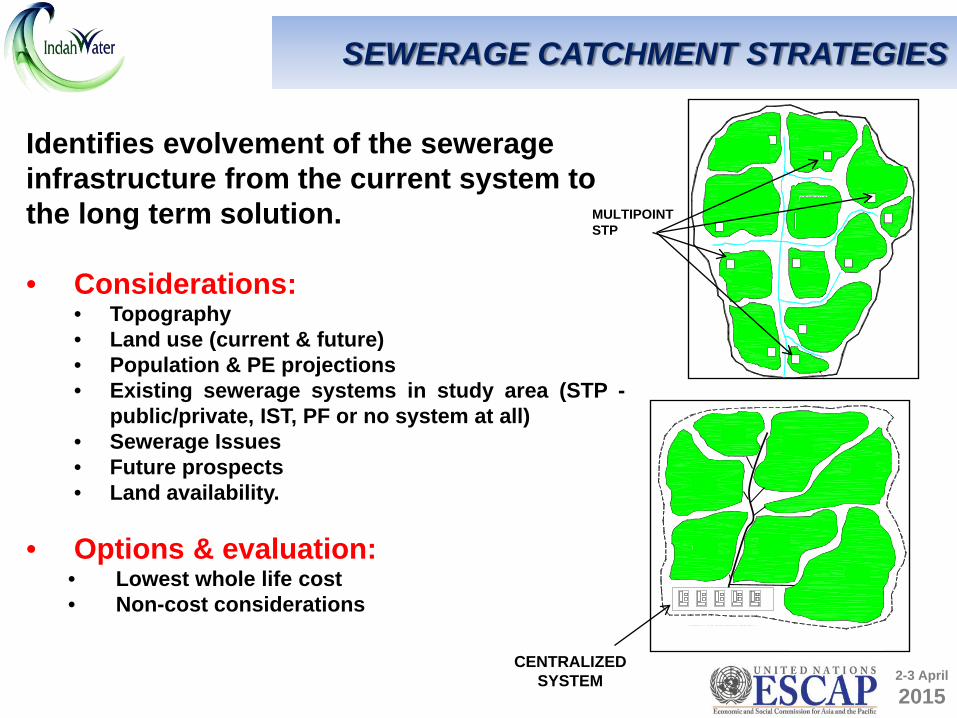
SEWERAGE CATCHMENT STRATEGIES
PHASE 1
PHASE 2
PHASE 7
PHASE 6
PHASE 1
PHASE 3
PHASE 2
MODULAR CONSTRUCTIONOF TREATMENT PLANT NOTE :
SUFFICIENT LAND MUST BEPUT ASIDE TO CATER FOR ALLTHE STAGES
CENTRALIZED SYSTEM
PROPOSEDNEW DEVELOPMENT
SECTION 10
PROPOSEDNEW DEVELOPMENT
SECTION 9SECTION 5
SECTION 4
SECTION 8SECTION 2
SECTION 3
MULTIPOINT STP
Identifies evolvement of the sewerageinfrastructure from the current system tothe long term solution.
• Considerations:• Topography• Land use (current & future)• Population & PE projections• Existing sewerage systems in study area (STP -
public/private, IST, PF or no system at all)• Sewerage Issues• Future prospects• Land availability.
• Options & evaluation:• Lowest whole life cost• Non-cost considerations
2-3 April. 2015
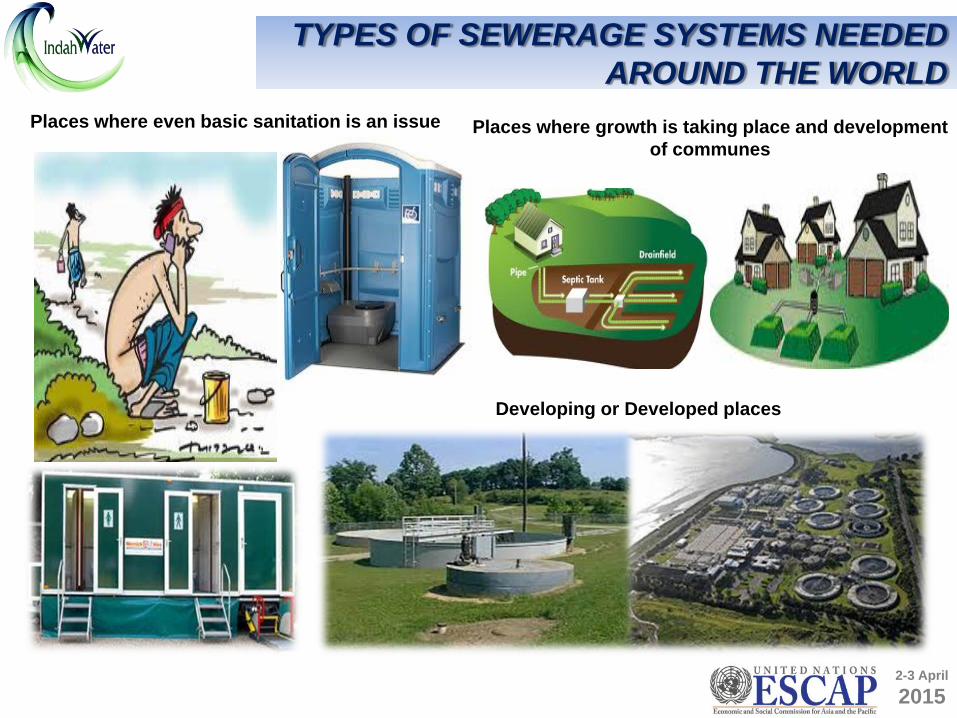
TYPES OF SEWERAGE SYSTEMS NEEDED AROUND THE WORLD
Places where even basic sanitation is an issue Places where growth is taking place and development of communes
Developing or Developed places
2-3 April. 201512
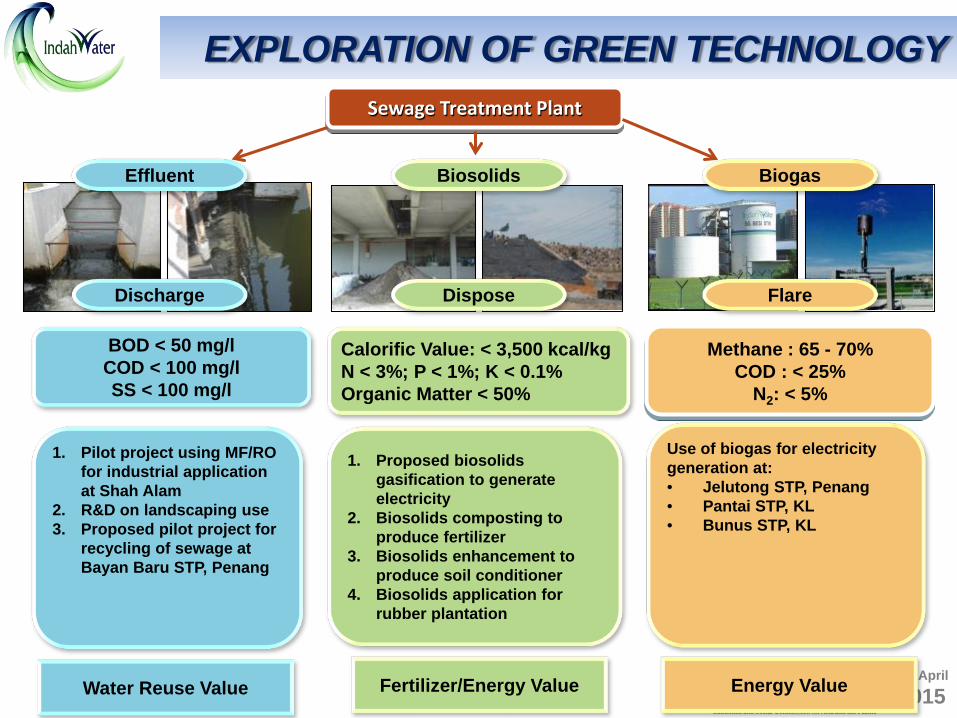
Sewage Treatment Plant
Effluent
Discharge
Biosolids
Dispose
Biogas
Flare
1. Pilot project using MF/RO for industrial application at Shah Alam
2. R&D on landscaping use 3. Proposed pilot project for
recycling of sewage at Bayan Baru STP, Penang
1. Proposed biosolidsgasification to generate electricity
2. Biosolids composting to produce fertilizer
3. Biosolids enhancement to produce soil conditioner
4. Biosolids application for rubber plantation
Use of biogas for electricity generation at:• Jelutong STP, Penang• Pantai STP, KL• Bunus STP, KL
BOD < 50 mg/lCOD < 100 mg/lSS < 100 mg/l
Calorific Value: < 3,500 kcal/kgN < 3%; P < 1%; K < 0.1%Organic Matter < 50%
Methane : 65 - 70%COD : < 25%
N2: < 5%
12Water Reuse Value Fertilizer/Energy Value Energy Value
EXPLORATION OF GREEN TECHNOLOGY

2-3 April. 2015
• To eliminate primitive systems• To reduce IST in priority areas by
property connection in priorityareas
• To upgrade and standardization ofSTPs in priority areas
• To rationalise multipoint STPs byRegionalisation
Way Forward
2-3 April. 2015
SUMMARY • Clear policy direction by the government• Strategies need to crafted to steer the policy
direction• Planning infrastructure to follow• Willing to pay• Full cost recovery not possible to achieve• Subsidy needed• Benefits are increase in productivity, economic
growth, tourism, community benefits• In future energy recovery, resources recovery
may achieve full cost recovery


2-3 April. 2015
DEFINITIONS
ON SITE:
• Located within the housecompound
• Frequently visible• Potential odour, overflow, pest,
aesthetic issues• Needs periodic desludging• Tanker movement• Installation easy, low cost –
preferred by developer
2-3 April. 2015
DEFINITIONS
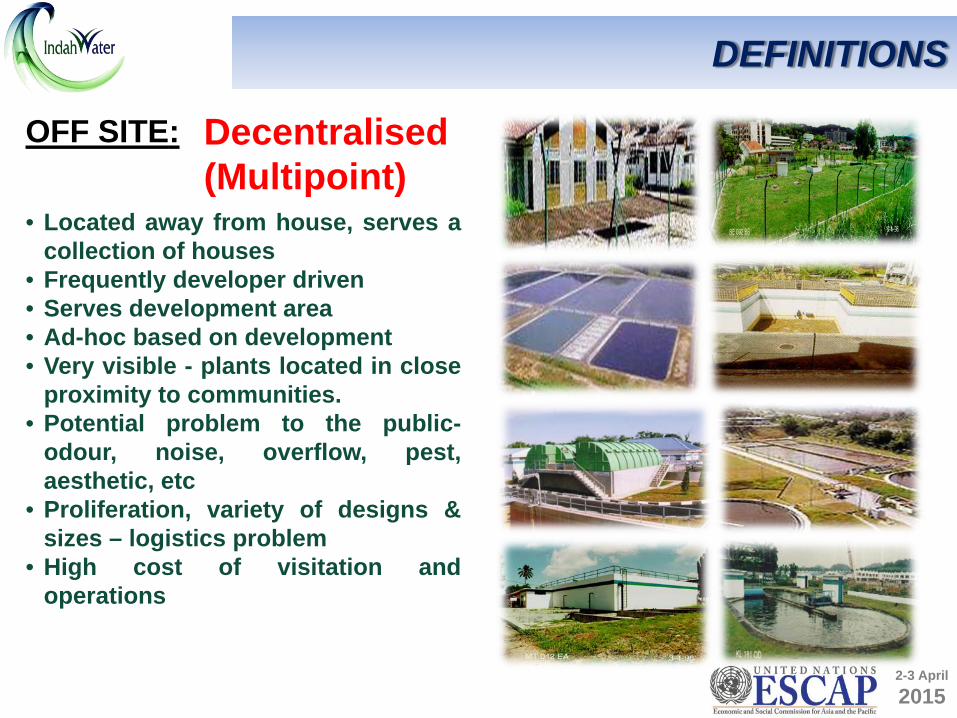
OFF SITE:
• Located away from house, serves acollection of houses
• Frequently developer driven• Serves development area• Ad-hoc based on development• Very visible - plants located in close
proximity to communities.• Potential problem to the public-
odour, noise, overflow, pest,aesthetic, etc
• Proliferation, variety of designs &sizes – logistics problem
• High cost of visitation andoperations
Decentralised (Multipoint)

2-3 April. 2015
DEFINITIONS
OFF SITE:
• Serves a large area• Catchment strategy driven• Planned based on catchmentdevelopment & growth•High reliability• Opportunity to rationalize smallinefficient STPs and on-site systems• High construction cost• Requires big land area• O&M cost is focused on coreactivities rather than logistics andtravelling
Centralised
2-3 April. 2015
STPs: NUMBERS vs CAPACITY

2-3 April. 2015
• Sustainable design balances human needs (rather than humanwants) with the carrying capacity of natural and culturalenvironments.
• In that context, sizing of STPs (in terms of centralized anddecentralized system) in Malaysia depends on the area, the needsand the existing development and facilities.
• The main drivers for proper sizing of STPS are:a) Sewerage Catchment area/strategiesb) Economic Transformation Plansc) Population & PE Projectiond) Buffere) Land Use/Land Availabilityf) Logistics
SUSTAINABLE SEWERAGE SYSTEM

2-3 April. 2015
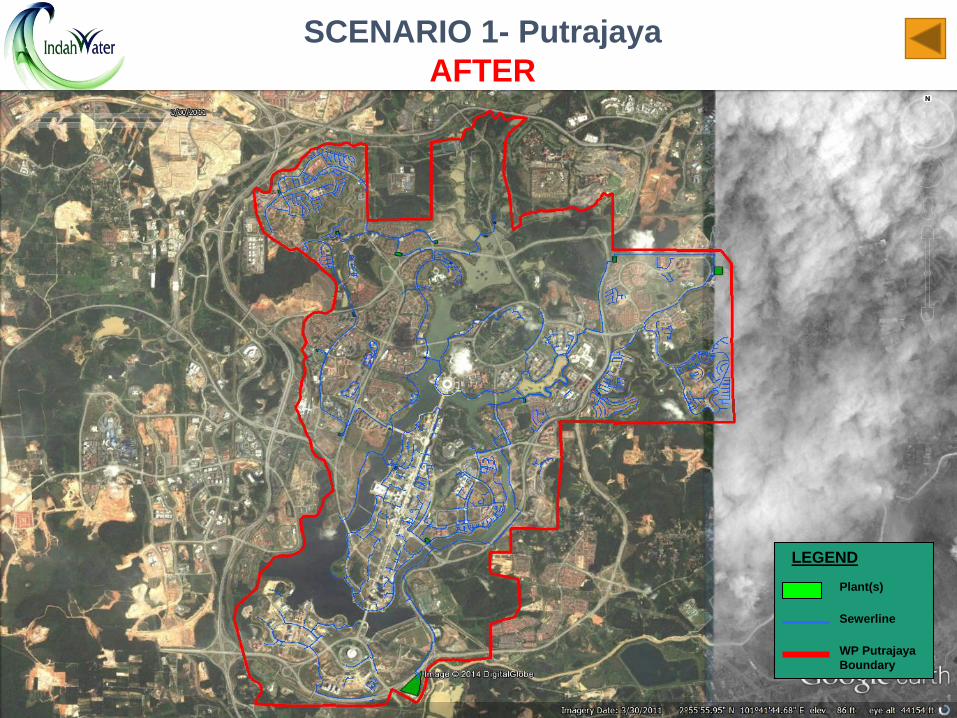
Scenario 1: New Sewerage Systems for Greenfield Developments
• Sewerage systems constructed at areas which have nodevelopment initially.
• Planning for sewerage infrastructure can be doneconcurrently with development.
• Centralised sewerage system are easily implemented,the cost is lower and disruption will be minimal.Thecost will be absorbed as part of development costs.
• Eg: Cyberjaya, Putrajaya, Proton City• Sizing of STPs can be determined upfront from 100,000
PE – 600,000 PE which is focused on centralizedsystem.
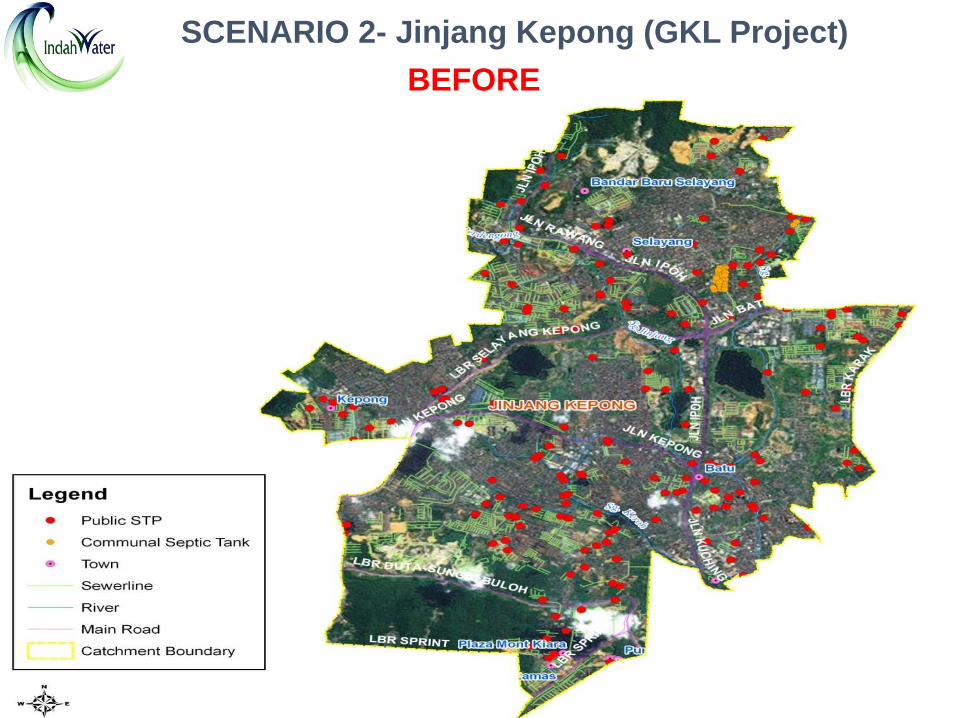
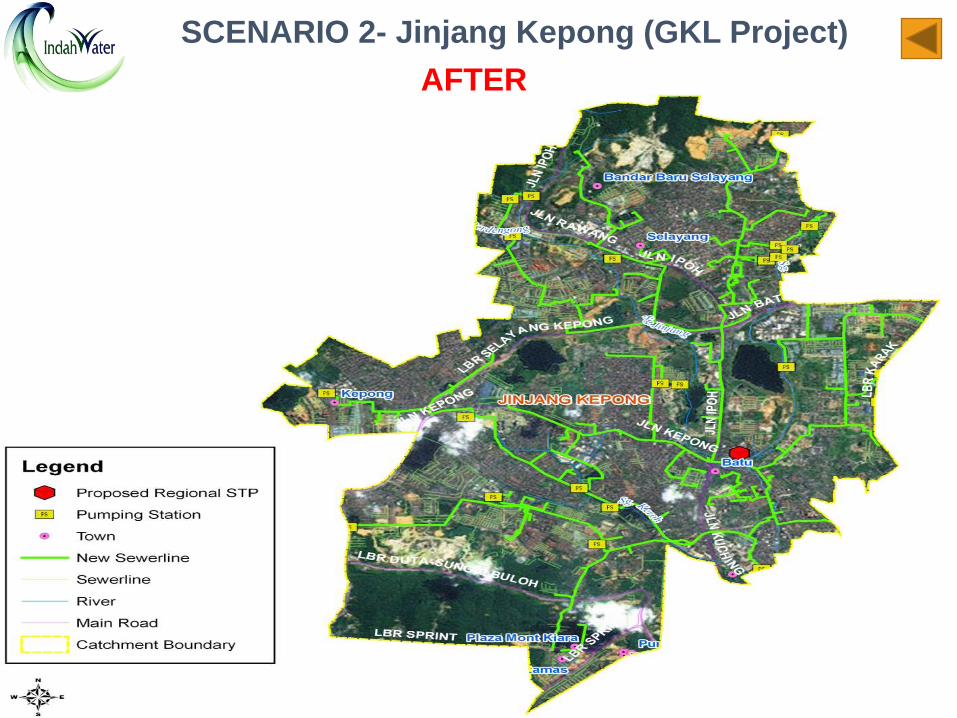
Scenario 2: Existing Sewerage Infrastructure in Developed Areas
• Existing systems which was serving one area has nowexpanded in serving another area as well as increaseddensity.
• Driven by Economic Transformation Plans andenviromental concerns.
• Correcting poor sewerage planning strategies exercisedin the past.
• High stakeholders expectations on the enviroment.Needs phased program consisting of upgradingsystems, renewal, refurbishment as well as newfacilities – more expensive and disruptive
• Eg: Pantai Catchment , Bunus and JinjangKepong(kuala Lumpur)
• Sizing of STPs may vary with priority of land availabilityand technology from 200,000 PE – 1.8 million PE.
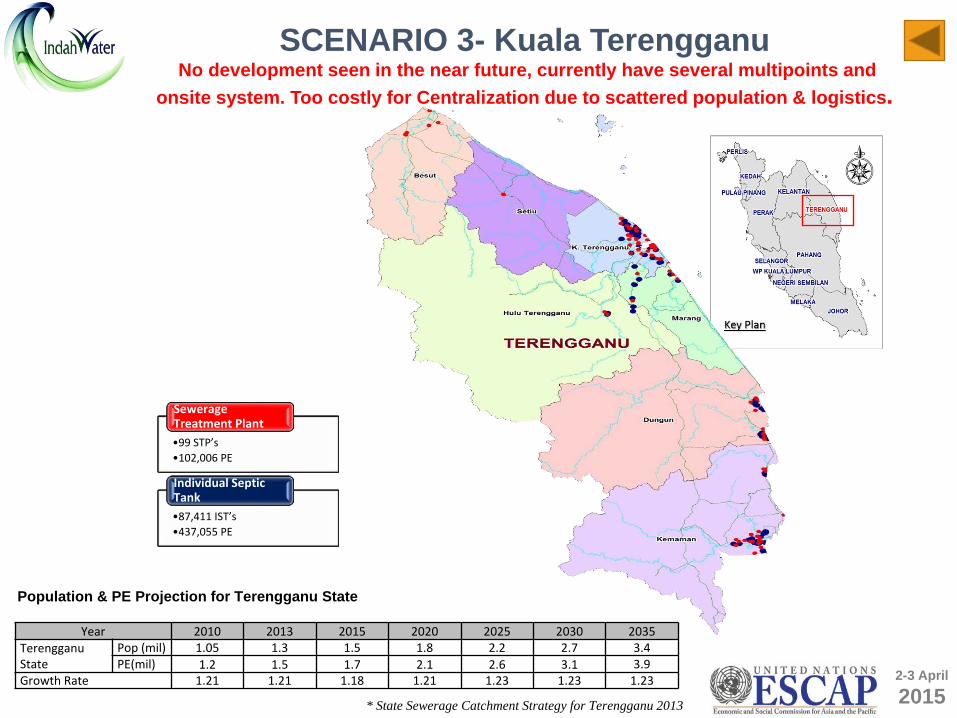
Scenario 3: Sewerage Infrastructure for Slow Paced Development Area and Rural Communities• No proper drive to build a regional sewerage system
as the development is very slow paced
• Minimal impact to the enviroment.
• Not in water catchment areas
• Sizing is determined to meet development needswhich can vary from septic tanks to small scale plants2000- 5,000 PE.
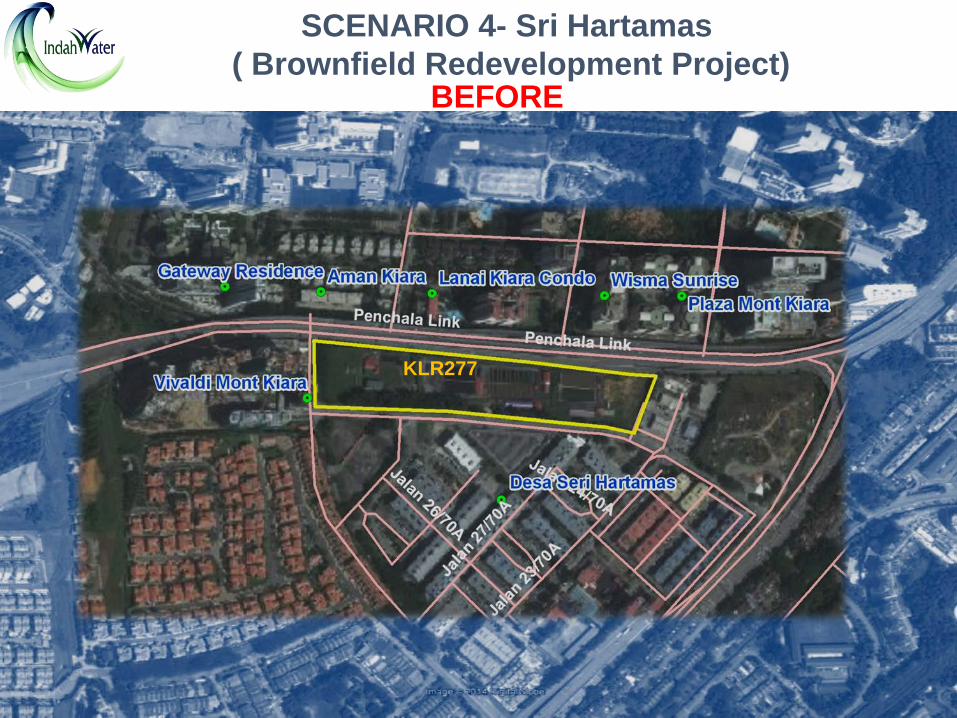
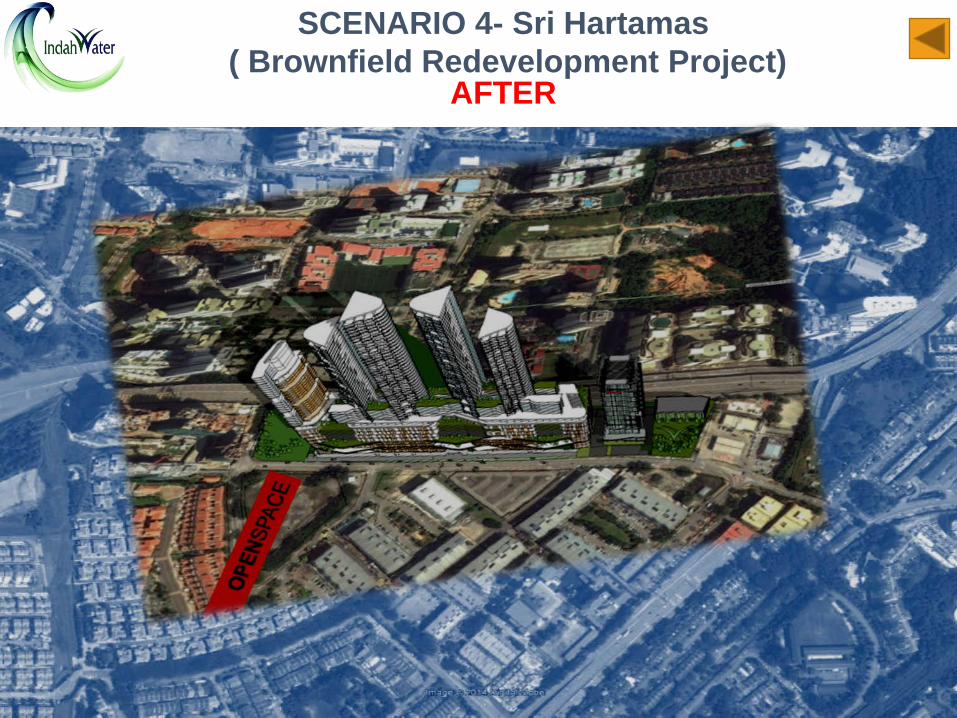
Scenario 4: Sewerage Infrastructure to Unlock Brown Field Redevelopments
• A need for high rate mechanised centralised regionalsewerage system to fit in lower STP footprint.
• Encouraged by Private Public participationcollarbration.
• Modern MBR/SBR Biological Nutrient Removalsystem is used.
• Oportunities are in highly commercial and residentialareas.
• Returns to goverment is GBI building, landconversion premiums.
• Ex. Sri Hartamas area. 6.3 acres released fordevelopement from 8.6 acres STP site.
APPROPRIATE TYPE OF SEWERAGE SYSTEMS BASED ON 4 SCENARIOS- Under Malaysia Context

2-3 April. 2015
SEWERAGE SYSTEM SELECTION MATRIX
CRITERIA SUBCRITERIA UPGRADE -DECENTRALISED
MOVE TOWARDS CENTRALISED
STATUS QUO
POPULATION DENSITY HIGH /LOW /
LAND STATUS/AVAILABILITY GOVERNMENT LAND /PRIVATE LAND /
ECONOMIC GROWTH AREA HIGH /
LOWPOPULATION GROWTH PE HIGH /
LOW /POLLUTION LOAD HIGH /
LOWLOCATED UPSTREAM OF WIP YES
NO /LOCATED UPSTREAM OF SENSITIVE WATER
RECEIVING AREASYES NO /
SENSITIVITY LOCATION YES (LOCATED WITHIN 30M FROM THE STP) /
NO (NOT LOCATED WITHIN 30 M FROM THE STP)
COMPLAINTS HIGH (≥5 times in a year) / /MODERATE (4-2 times in a year)
LOW (<2 times in a year)O&M COST HIGH /
MODERATELOW
NPV (CENTRALISATION) HIGHLOW /
TOTAL COUNT 3 9 3
Sample that leads to Scenario 2( Move Towards Centralised System)
2-3 April. 2015
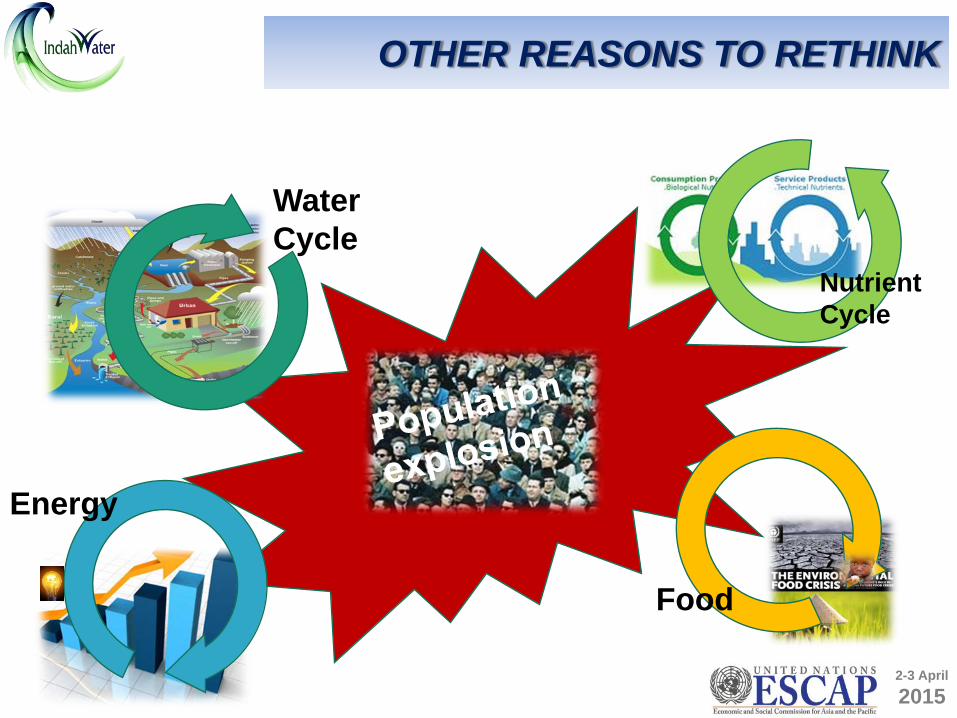
Water Cycle
Nutrient Cycle
Food
Energy
OTHER REASONS TO RETHINK

2-3 April. 2015
0%10%20%30%40%50%60%
Electricity cost as % direct costs
Electricity costs for treatment
- 2.00 4.00 6.00 8.00
10.00 12.00 14.00
Electricity costs / PE
OTHER REASONS TO RETHINK Depletion of Phosphate
2010 World Reserves, Millions of Metric Tonnes Source : US Geological Survey, Mineral Commodity Summaries, Jan 2011)
Water Shortage

2-3 April. 2015
SCENARIO 1- Putrajaya
LEGENDWP Putrajaya Boundary
BEFORE
2-3 April. 2015
LEGEND
WP Putrajaya Boundary
Sewerline
Plant(s)
SCENARIO 1- PutrajayaAFTER
2-3 April. 2015
SCENARIO 2- Jinjang Kepong (GKL Project)BEFORE
2-3 April. 2015
SCENARIO 2- Jinjang Kepong (GKL Project)AFTER
2-3 April. 2015
•99 STP’s•102,006 PE
Sewerage Treatment Plant
•87,411 IST’s•437,055 PE
Individual Septic Tank
Year 2010 2013 2015 2020 2025 2030 2035Terengganu State
Pop (mil) 1.05 1.3 1.5 1.8 2.2 2.7 3.4PE(mil) 1.2 1.5 1.7 2.1 2.6 3.1 3.9
Growth Rate 1.21 1.21 1.18 1.21 1.23 1.23 1.23
Population & PE Projection for Terengganu State
* State Sewerage Catchment Strategy for Terengganu 2013
SCENARIO 3- Kuala TerengganuNo development seen in the near future, currently have several multipoints and
onsite system. Too costly for Centralization due to scattered population & logistics.
2-3 April. 2015
SCENARIO 4- Sri Hartamas( Brownfield Redevelopment Project)
BEFORE
KLR277
2-3 April. 2015
SCENARIO 4- Sri Hartamas( Brownfield Redevelopment Project)
AFTER


