Pan-African Genetic Structure in the African Buffalo(Syncerus caffer): Investigating Intraspecific DivergenceNathalie Smitz1*, Cecile Berthouly2, Daniel Cornelis2, Rasmus Heller3, Pim Van Hooft4,
Philippe Chardonnet5, Alexandre Caron2,6,7, Herbert Prins8, Bettine Jansen van Vuuren9, Hans De
Iongh10, Johan Michaux1,11
1 Departement of Life Sciences- Conservation Genetics, University of Liege, Liege, Belgium, 2 Centre de Cooperation Internationale en Recherche Agronomique pour le
Developpement (CIRAD), Campus International de Baillarguet, Montferrier-le-Lez, France, 3 Department of Biology- Bioinformatics, University of Copenhagen,
Copenhagen, Denmark, 4 Resource Ecology Group, Wageningen University, Wageningen, The Netherlands, 5 International Foundation for the Conservation of Wildlife
(IGF), Paris, France, 6 Department Environment and Societies- Centre de Cooperation Internationale en Recherche Agronomique pour le Developpement (CIRAD),
University of Zimbabwe, Harare, Zimbabwe, 7 Department of Zoology and Entomology- Mammal Research Institute, University of Pretoria, Pretoria, South Africa,
8 Tropical Nature Conservation and Vertebrate Ecology Group, Wageningen University, Wageningen, The Netherlands, 9 Department of Zoology- Centre for Invasion
Biology, University of Johannesburg, Johannesburg, South Africa, 10 Institute of Environmental Sciences, Leiden University, Leiden, The Netherlands, 11 Centre de
Biologie et de Gestion des Populations (CBGP), Campus International de Baillarguet, Montferrier-le-Lez, France
Abstract
The African buffalo (Syncerus caffer) exhibits extreme morphological variability, which has led to controversies about thevalidity and taxonomic status of the various recognized subspecies. The present study aims to clarify these by inferring thepan-African spatial distribution of genetic diversity, using a comprehensive set of mitochondrial D-loop sequences fromacross the entire range of the species. All analyses converged on the existence of two distinct lineages, corresponding to agroup encompassing West and Central African populations and a group encompassing East and Southern Africanpopulations. The former is currently assigned to two to three subspecies (S. c. nanus, S. c. brachyceros, S. c. aequinoctialis)and the latter to a separate subspecies (S. c. caffer). Forty-two per cent of the total amount of genetic diversity is explainedby the between-lineage component, with one to seventeen female migrants per generation inferred as consistent with theisolation-with-migration model. The two lineages diverged between 145 000 to 449 000 years ago, with strong indicationsfor a population expansion in both lineages, as revealed by coalescent-based analyses, summary statistics and a star-liketopology of the haplotype network for the S. c. caffer lineage. A Bayesian analysis identified the most probable historicalmigration routes, with the Cape buffalo undertaking successive colonization events from Eastern toward Southern Africa.Furthermore, our analyses indicate that, in the West-Central African lineage, the forest ecophenotype may be a derived formof the savanna ecophenotype and not vice versa, as has previously been proposed. The African buffalo most likelyexpanded and diverged in the late to middle Pleistocene from an ancestral population located around the current-dayCentral African Republic, adapting morphologically to colonize new habitats, hence developing the variety ofecophenotypes observed today.
Citation: Smitz N, Berthouly C, Cornelis D, Heller R, Van Hooft P, et al. (2013) Pan-African Genetic Structure in the African Buffalo (Syncerus caffer): InvestigatingIntraspecific Divergence. PLoS ONE 8(2): e56235. doi:10.1371/journal.pone.0056235
Editor: Michael Hofreiter, University of York, United Kingdom
Received April 30, 2012; Accepted January 11, 2013; Published February 21, 2013
Copyright: � 2013 Smitz et al. This is an open-access article distributed under the terms of the Creative Commons Attribution License, which permitsunrestricted use, distribution, and reproduction in any medium, provided the original author and source are credited.
Funding: This study is supported by research grants from the FRS-FNRS of Belgium (Fond National pour la Recherche Scientifique) provided to J.R. Michaux (A5/5-MCF/BIC-11561) and N.M.R. Smitz (F3/5/5-MCF/ROI/BC-20.003) (http://www1.frs-fnrs.be/). The funders had no role in study design, data collection and analysis,decision to publish, or preparation of the manuscript.
Competing Interests: The authors have declared that no competing interests exist.
* E-mail: [email protected]
Introduction
The phylogeographic pattern of most of the savanna mammals
distributed across Africa can be partitioned into two to four main
lineages. These lineages are typically associated with a West-
Central, Eastern, Southern and/or South-East African distribu-
tion. For example, the hartebeest (Alcelaphus buselaphus) and the
common warthog (Phacochoerus africanus) comprise three lineages
associated with West-Central, Eastern and Southern Africa [1,2].
The wildebeest (Connochaetes taurinus), the topi (Damaliscus lunatus),
the greater kudu (Tragelaphus strepsiceros), and the wild dog (Lycaon
pictus) comprise at least two lineages associated with Eastern and
Southern Africa [1,3–5]. A partitioning into two lineages between
West-Central and East-Southern Africa is observed for the kob
(Kobus kob), the African lion (Panther leo), the roan antelope
(Hippotragus equinus), the waterbuck (Kobus ellipsiprymnus), the
savanna elephant (Loxodonta africana) and the bushbuck (Tragelaphus
scriptus) [6–12]. Species that have a largely East to Southern
(including South-West) African distribution often divide into two
or three lineages, such as impala (Aepyceros melampus) which has a
distinct South-West African lineage [13], or sable antelope
(Hippotragus niger) which has two East African lineages, a South-
West lineage and a Southern lineage [14–16]. The congruency of
phylogeographic patterns among taxonomic groups and trophic
levels is generally attributed to the existence of similar forces
shaping the evolutionary history of species, with common African
refugia [1,7,9,17] and speciation events being climatically medi-
PLOS ONE | www.plosone.org 1 February 2013 | Volume 8 | Issue 2 | e56235

ated [18]. Paleoclimatic reconstructions show that the African
continent was marked by pronounced monsoonal changes during
the Pleistocene (i.e., climatic oscillations), paced by earth’s orbital
variations [18]. The vegetation changes associated with these
climatic changes were probably the main driver of population
expansions in savanna species during cool and dry phases, and
population contraction during wet and warm phases [2]. The
location of these refugia were purportedly in West, East, South
and South-Western Africa [1,9,10,19,20].
Phylogeographic studies that accurately reflect the pattern of
spatial genetic variation require access to large sample collections
distributed across the entire range of the target species. Perhaps
because of the difficulty in obtaining samples over such a large
geographic area, as well as the inaccessibility of remote areas in
Africa, it is rare to find studies involving more than 200 samples or
which cover the entire distribution of the model species. To
improve our understanding of African biogeography, we studied
the spatial genetic structure of the African buffalo (Syncerus caffer) at
a continental scale. The African buffalo is a good model because,
together with a few other large taxa such as e.g. the elephant and
the giraffe, it is distributed throughout most of sub-Saharan Africa.
The species is primarily found in savannas, but also occurs in other
habitats, including clearings in the rainforest belt [21–23]. The
African buffalo exhibits extreme morphological variability across
its range, greater than most other African mammals, both in body
size and weight, coloration and horn size [21]. As a result, it has
previously been assigned to as many as 52 distinct subspecies
divided across two species [21,24]. This number has decreased
considerably as our understanding of the species has increased.
Today, two [25], three [21] or four [26,27] subspecies are
commonly recognized (Table 1). The forest buffalo (S. c. nanus),
which occurs in the West and Central African rainforests, shows
adaptation to forest life [22] having a smaller size, unobtrusive
swept-back horns and a characteristic red to reddish brown color.
The Cape buffalo (S. c. caffer) of the South-East African savannas is
about twice the size of the forest buffalo, with large downward
curved horns and a brownish to black color. The third and fourth
subspecies–not recognized by all authorities–are the West African
savanna buffalo (S. c. brachyceros) and the Central African savanna
buffalo (S. c. aequinoctialis), which are more difficult to distinguish
morphologically. They occupy the Sahelian savanna, character-
ized by a low net above ground primary production compared to
the East and Southern African savannas (615% lower) [28]. The
two latter subspecies seem to be morphologically intermediate
between the Cape and forest buffalo [29]. The evolutionary
relationships between these four putative subspecies are unclear,
having therefore led to the taxonomic controversy. This uncer-
tainty is corroborated by the observation of intermediate
phenotypes in contact zones between all four subspecies [21]
and of at least one reported cross between S. c. caffer and S. c. nanus
in captivity, these being the two subspecies with the more
divergent morphological characteristics [30]. Moreover, differenc-
es in karyotypes between the nanus and the caffer phenotypes have
been reported, with S. c. caffer having 52 chromosomes and S. c.
nanus having 2n = 54 to 56 chromosomes [30–32]. The extreme
morphological variability within the species therefore allows us to
test the congruence between phylogenetic-based and morpholog-
ical-based classification.
Although several genetic studies on African buffalo have already
been conducted, these were generally focused at smaller spatial
scales, mainly in East and Southern Africa (S. c. caffer), using
various molecular markers such as mitochondrial DNA, autosomal
microsatellites, Y-chromosomal microsatellites and the histocom-
patibility complex (MHC) DRB3 gene [33–44]. Partial exceptions
include the studies by Van Hooft [36,37], which include a few
samples (n = 14) from Central Africa. They highlighted a clear
differentiation between S. c. caffer and S. c nanus/S. c. brachyceros. No
significant genetic differentiation was found between S. c. nanus and
S. c. brachyceros [37], but these results were not conclusive due to a
limited sample size. A truly pan-African genetic study of the
African buffalo has not been undertaken yet.
In the present study, a detailed genetic analysis of the African
buffalo across its geographic range was performed using
mitochondrial D-loop (control region) sequences. The control
region is the most variable part of the mammalian mtDNA
genome [45]. This study provides an unprecedented sampling
scheme for buffalo, representing 43 study localities in 17 countries.
We combined newly derived sequences from faeces and tissue
biopsies from South, West and Central Africa with published
sequences from East and Southern Africa. A total of 255 West-
Central and 511 East-Southern buffalo mtDNA sequences were
analyzed. Sequence data were analyzed with regard to demo-
graphic changes, phylogeography and evolutionary history.
Specifically, we aimed to I) test whether there is a correspondence
between the distinct morphological phenotypes and the genetic
lineages, and II) infer the phylogeographic history that has led to
the observed distribution of genetic and phenotypic variation.
Results
As the taxonomic status of the subspecies is still subject to
controversy (see above), we defined each of the four putative
subspecies as recognized by East [27] and Kingdon [26] and
adopted by the IUCN (2004) as an ecophenotype, i.e., nanus
ecophenotype (forest-dwelling buffalo from West Africa), brachyceros
ecophenotype (savanna buffalo from West Africa), aequinoctialis
ecophenotype (savanna buffalo from Central Africa) and caffer
ecophenotype (Cape buffalo from East and Southern Africa).
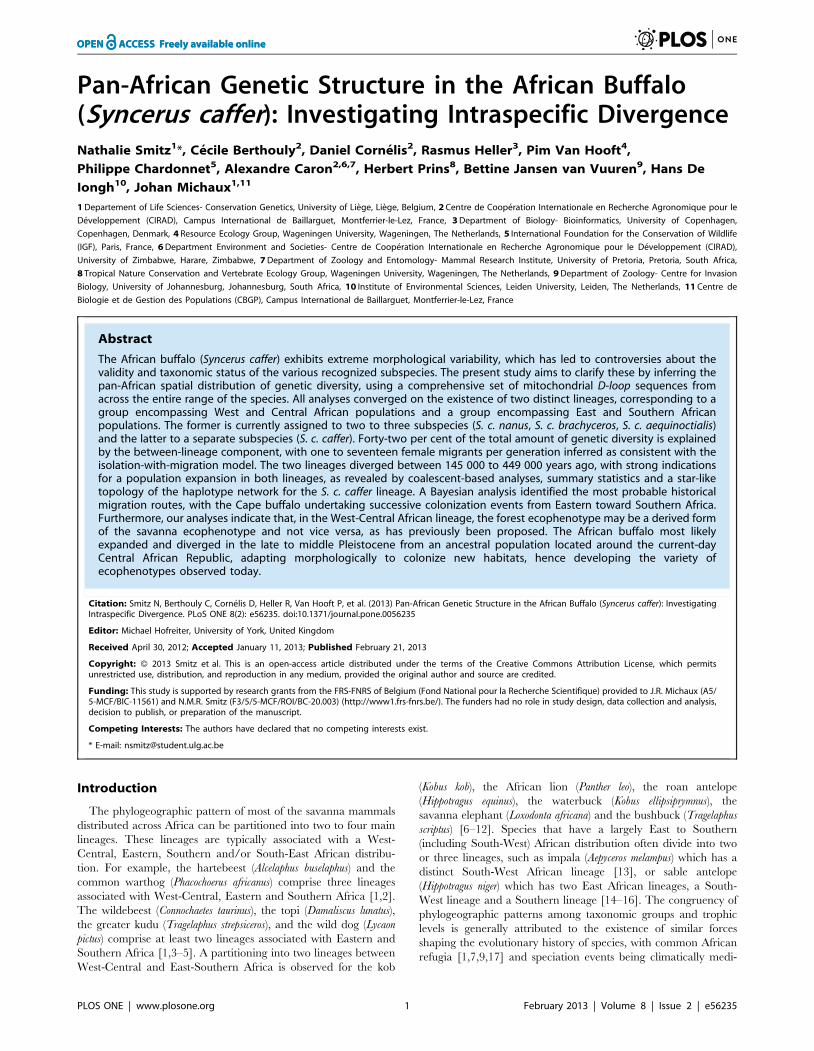
Population Differentiation1. Network analysis and genetic distance. Two lineages
that made geographic sense were retrieved with the minimum
spanning network (H1 and H2; Figure 1), following a South-
Eastern/West-Central separation, with eight mutational steps
separating the two lineages. Within these lineages, no finer
geographic structure was evident, with samples from the various
localities being paraphyletic. The first lineage (H1) is composed of
South-Eastern (SE) African populations and contains 143 haplo-
types, mainly of the S. c. caffer ecophenotype (136 haplotypes). This
predominantly South-Eastern lineage also includes seven haplo-
types of West-Central (WC) African origin. With the exception of
the Namibian samples, haplotypes from Southern Africa (Zim-
babwe, Botswana and South Africa) occupied the tip position in
the network. About 45% of the Ugandan haplotypes occupied a
central position in the network. The second geographic lineage
(H2) consisted mainly of West-Central (WC) African samples,
including samples from three ecophenotypes: S. c. brachyceros, S. c.
nanus and S. c. aequinoctialis. These ecophenotypes were not
monophyletic and were distributed throughout the H2 lineage.
H2 included 94 distinct haplotypes, including seven of SE African
origin.
The minimum spanning network is characterized by a clear
star-like topology for the H1 lineage, and there is a tendency
toward the same pattern for the H2 lineage. Distances separating
SE African haplotypes were less than among the WC African
haplotypes, reflecting the relatively low nucleotide diversity
observed in SE Africa. Within each lineage, there was a low
structural per country affinity of haplotypes.
Phylogeographic study of the African Buffalo
PLOS ONE | www.plosone.org 2 February 2013 | Volume 8 | Issue 2 | e56235
2. Genetic variation between populations and between
subspecies. At the continental scale, African buffalo display
high levels of genetic diversity, as reflected by both haplotype and
nucleotide diversities (h = 0.98, p = 5.50%; Table 2). As suggested
by our previous results, a partition within two lineages at the
continental scale has been revealed, with a high and significant
proportion of the variation accounted for by the between-lineage
component (FCT = 0.42). At the population level, low overall
sequence divergence among the populations within each lineage
was observed, ranging from 0.1% to 1.3% in H1 and from 0.1% to
Table 1. Morphological characteristics, including weight in kilogram (kg), dress color, body length in centimetre (cm), width ofhorn and length of skull in millimetre (mm) of the four recognized subspecies of African buffalos (out of literature).
S. c. caffer S. c. nanus S. c. aequinoctialis S. c. brachyceros
Weight (kg) 700–900 [26,74] ,320 [26,74] intermediate intermediate
Dress blackish [78] reddish [74,76] brown/black [75] brown/black [75]
Body length (cm) ,340 [26,74] ,120 [26,74] intermediate intermediate
Width of horn at base (mm) 224621.5 [46] 12869.75 [46] 212617.2 [46] 166618.3 [46]
Length of skull (mm) 503617.9 [46] 426610.7 [46] 500618.2 [46] 455622.9 [46]
doi:10.1371/journal.pone.0056235.t001
Figure 1. An unrooted minimum spanning tree (MST) of Syncerus sp. showing genetic relationship among D-Loop region haplotypesdetected in this study. The sizes of circles are proportional to haplotype frequency and length of lines is proportional to the number of nucleotidesubstitutions separating the haplotypes, except for the dotted lines, where the numbers of mutational steps joining the circles are indicated abovethe connecting branches. Circles were colored according to geographical sample origin: Green/Red/Blue: H1 South and East Africa; Turquoise/Pink:H2 West Africa; Yellow: H2 Central Africa; Black: Namibia. Asterisks represent nanus ecophenotype samples. CAR: Central African Republic; DRC:Democratic Republic of the Congo.doi:10.1371/journal.pone.0056235.g001
Phylogeographic study of the African Buffalo
PLOS ONE | www.plosone.org 3 February 2013 | Volume 8 | Issue 2 | e56235

Table 2. Genetic diversity and demographic test for both genetic lineages (H1 and H2), as well as for each ecophenotypes.
h hSD
hp-value
p pSD
pp-value
Fu’sFs
Fu’s Fsp-value
t r rp-value
SSD SSDp-value
H1 (i.e., Ecophenotype caffer) 0.980 0.002 0.001 4.58 0.001 0.001 224.016 0.003 6 0.003 0.850 0.001 0.670
H2 (i.e., three otherecophenotypes)
0.981 0.002 0.001 6.42 0.002 0.001 223.902 0.001 13 0.005 0.170 0.002 0.190
Ecophenotype aequinoctialis 0.997 0.010 0.001 6.95 0.004 0.001
Ecophenotype nanus 0.890 0.001 0.001 5.77 0.001 0.001
Ecophenotype brachyceros 0.961 0.007 0.001 5.78 0.002 0.001
h: haplotype diversity; p: nucleotide diversity expressed in percentage; SD: standard deviation;t: expansion times; r: Harpending’s raggedness index; SSD: sum ofsquared deviations using ARLEQUIN and DNaSP software.doi:10.1371/journal.pone.0056235.t002
Table 3. Population pairwise FST between the twenty-eight populations significantly differentiated calculated with ARLEQUINsoftware.
1 2 3 4 5 6 7 8 9 10 11 12 13 14 15 16 17 18 19 20 21 22 23 24 25 26 27 28
1 / *** *** *** *** *** ns *** *** *** * *** *** *** *** *** *** *** *** *** *** *** *** *** *** *** *** ***
2 0.39 / *** ns *** *** ns *** *** ns * *** *** *** *** *** *** *** *** *** *** *** *** *** *** *** *** ***
3 0.38 0.19 / * *** *** * *** *** *** *** *** *** *** *** *** *** *** *** *** *** *** *** *** *** *** *** ***
4 0.47 0.66 0.24 / ns ns ns ns ns ns ns *** *** *** *** *** *** * *** *** * *** *** *** *** *** *** ***
5 0.22 0.11 0.14 0.01 / *** ns *** *** ns ns *** *** *** *** *** *** *** *** *** *** *** *** *** *** *** *** ***
6 0.30 0.22 0.27 0.10 0.13 / * *** * *** *** *** *** *** *** *** *** *** *** *** *** *** *** *** *** *** *** ***
7 0.07 0.22 0.20 0.10 0.01 0.16 / * ns ns ns *** *** *** *** * *** *** *** *** *** *** *** *** *** *** *** ***
8 0.27 0.22 0.26 0.01 0.10 0.06 0.10 / ns *** *** *** *** *** *** *** *** *** *** *** *** *** *** *** *** *** *** ***
9 0.26 0.23 0.28 0.06 0.08 0.08 0.08 0.04 / * *** *** *** *** *** *** *** *** *** *** *** *** *** *** *** *** *** ***
10 0.29 0.07 0.22 0.02 0.02 0.13 0.05 0.14 0.12 / ns *** *** *** *** *** *** *** *** *** *** *** *** *** *** *** *** ***
11 0.15 0.17 0.17 0.08 0.02 0.16 0.08 0.13 0.13 0.04 / *** *** *** *** *** *** *** *** *** *** *** *** *** *** *** *** ***
12 0.63 0.54 0.58 0.43 0.46 0.51 0.54 0.45 0.49 0.49 0.50 / *** * *** *** *** *** * *** *** *** ns *** *** *** *** ***
13 0.70 0.57 0.60 0.53 0.48 0.52 0.64 0.45 0.52 0.55 0.55 0.11 / * *** * * * ns * *** *** ns *** *** *** *** ***
14 0.63 0.50 0.54 0.35 0.42 0.46 0.50 0.39 0.45 0.44 0.45 0.04 0.04 / *** ns *** * ns *** *** *** * *** * *** *** *
15 0.61 0.49 0.54 0.37 0.40 0.46 0.49 0.40 0.45 0.43 0.45 0.05 0.18 0.09 / *** *** *** *** *** *** *** * *** *** *** *** ***
16 0.70 0.54 0.58 0.46 0.45 0.48 0.61 0.40 0.49 0.50 0.50 0.17 0.08 0.06 0.22 / * ns ns nsns
ns *** *** *** * *** *** ns
17 0.68 0.56 0.60 0.46 0.47 0.51 0.59 0.43 0.50 0.52 0.52 0.10 0.08 0.06 0.17 0.06 / *** ns *** *** *** * *** *** *** *** ns
18 0.67 0.52 0.55 0.44 0.42 0.47 0.56 0.40 0.47 0.46 0.47 0.13 0.15 0.08 0.20 0.13 0.12 / ns * * * ns *** ns *** *** *
19 0.65 0.54 0.58 0.43 0.45 0.49 0.54 0.41 0.48 0.49 0.49 0.06 0.02 0.02 0.13 0.04 0.02 0.04 / * *** * ns *** ns ns *** ***
20 0.64 0.56 0.59 0.44 0.48 0.52 0.55 0.44 0.50 0.52 0.53 0.15 0.05 0.07 0.17 0.02 0.10 0.11 0.05 / *** *** * *** *** *** *** *
21 0.60 0.21 0.54 0.38 0.43 0.46 0.50 0.40 0.45 0.46 0.46 0.21 0.12 0.14 0.18 0.05 0.14 0.18 0.11 0.06 / *** *** *** *** *** *** *
22 0.72 0.64 0.66 0.62 0.55 0.59 0.67 0.52 0.59 0.63 0.62 0.17 0.12 0.16 0.30 0.23 0.14 0.09 0.06 0.18 0.26 / ns *** *** *** *** ***
23 0.65 0.51 0.54 0.40 0.41 0.46 0.51 0.39 0.45 0.43 0.43 0.08 0.06 0.05 0.15 0.15 0.08 0.03 0.01 0.09 0.15 0.01 / * * *** *** ***
24 0.64 0.52 0.57 0.40 0.45 0.50 0.54 0.44 0.49 0.46 0.49 0.06 0.20 0.08 0.09 0.24 0.16 0.18 0.11 0.20 0.24 0.25 0.12 / *** ns *** ***
25 0.61 0.51 0.56 0.38 0.44 0.48 0.50 0.42 0.46 0.46 0.47 0.09 0.13 0.04 0.14 0.09 0.08 0.02 0.03 0.11 0.17 0.13 0.07 0.10 / *** *** ***
26 0.60 0.51 0.55 0.39 0.44 0.48 0.50 0.42 0.46 0.46 0.46 0.05 0.09 0.07 0.09 0.16 0.12 0.10 0.06 0.15 0.19 0.17 0.08 0.03 0.04 / *** ***
27 0.73 0.61 0.63 0.58 0.52 0.56 0.67 0.52 0.59 0.57 0.59 0.33 0.52 0.37 0.32 0.49 0.43 0.45 0.41 0.42 0.42 0.56 0.44 0.29 0.28 0.25 / ***
28 0.68 0.52 0.57 0.38 0.43 0.47 0.56 0.39 0.47 0.46 0.48 0.17 0.15 0.06 0.19 0.01 0.08 0.16 0.08 0.06 0.09 0.30 0.19 0.22 0.11 0.09 0.63 /
The significance level is shown above the diagonal, *indicates P,0.05, **indicates P,0.005, ***indicates P,0.0005; ns, non-significant. From line 1 to 11: H2 lineage (S. c.nanus, S. c. brachyceros and S. c. aequinoctialis); from line 12 to 28: H1 lineage (S. c. caffer); bold/italic written value: ecophenotype nanus. 1: Campo ma’an; 2: Lope; 3:Gamba; 4: Ngoto Forest; 5: Benoue; 6: Mole; 7: Arly, Pama, Singou; 8: Pendjari; 9: W; 10: Zakouma; 11: Bamingui-Bangoran; 12: Queen Elizabeth; 13: Lake Mburo; 14:Murchison falls; 15: Kidepo valley; 16: Laikipia; 17: Amboseli; 18: Nairobi; 19: Tsavo; 20: Masai Mara- Serengeti- Maswa; 21: Nakuru; 22: Arusha; 23: Kizigo; 24: Hwange-Chobe; 25: Kruger; 26: Gonarezhou; 27: Hluhluwe-Imfolozi; 28: Mount Elgon.doi:10.1371/journal.pone.0056235.t003
Phylogeographic study of the African Buffalo
PLOS ONE | www.plosone.org 4 February 2013 | Volume 8 | Issue 2 | e56235

2.9% in H2. According to the pairwise FST values (Table 3), lower
FST values between populations within each lineage (SE vs WC)
can be observed, compared to higher FST values between
populations between each of the lineages. Fixation indexes
between populations between lineages (FST) were estimated to be
0.52, and among populations within lineages (FSC) to be 0.17
(Table 4). This corroborates the absence of structure observed
within lineages in the network and evolutionary trees. Moreover,
pairwise FST values between the brachyceros/aequinoctialis ecopheno-
types and the nanus ecophenotype of Western Africa were quite
low, ranging from 0.02 to 0.12, which is lower than between most
population pairs within these ecophenotypes (Table 3 and 5).
Nucleotide diversity is lower for H1 (4.6%) than for H2 (6.4%),
except for the Campo-Ma’an population (Table 6 and 2). The
highest nucleotide diversity was observed in the aequinoctialis
ecophenotype populations (7%), being on average 1.4 times higher
than in the caffer ecophenotype populations. The largest distances,
up to 2.9% (higher FST = 0.47 (Table 3)), were found among forest
buffalo populations (S. c. nanus). The nanus ecophenotype also
displays the lowest haplotype diversity, being on average 1.3 times
lower than in the other populations.
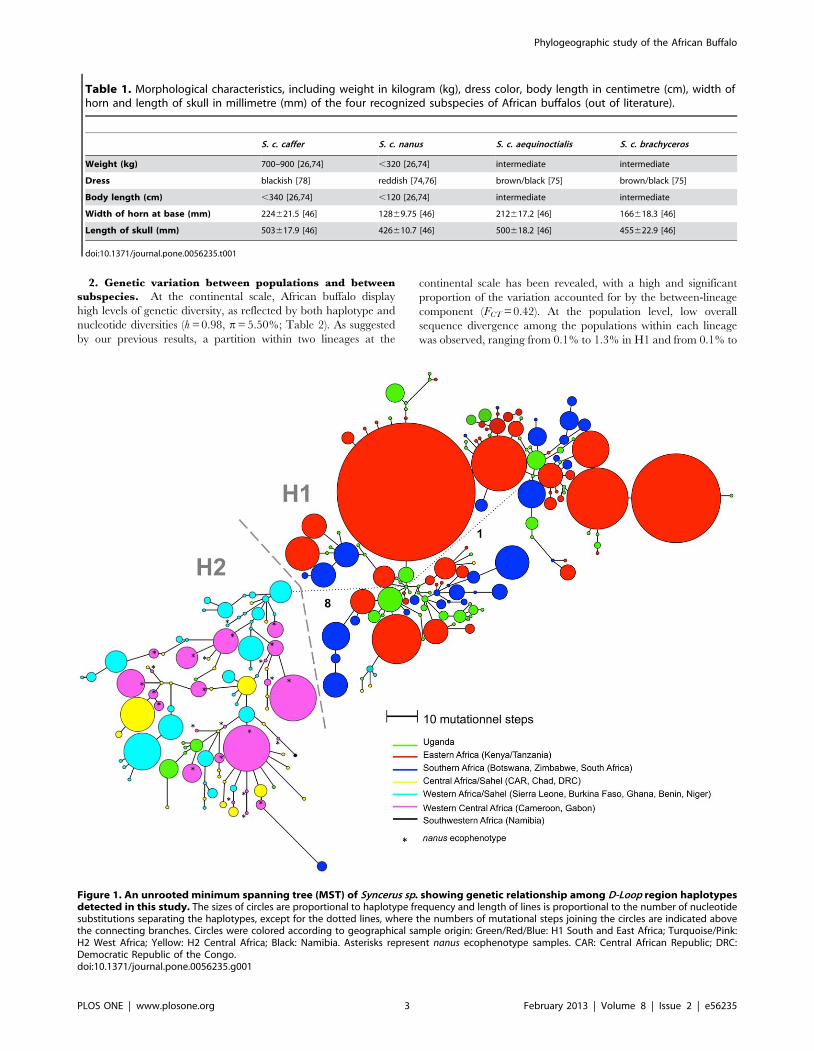
Demographic TrendsThe mismatch distribution analysis showed a predominantly
unimodal pattern for both lineages (Figure 2). In addition, Fu’s Fs
values as well as the raggedness index were significantly negative
(Table 2) (H1: p = 0.007; H2: p = 0.001) which suggests a
demographic expansion for both lineages. According to the tvalues (tH1 = 6; tH2 = 13), demographic expansion for H1 was
estimated as starting approximately 48 000 YBP (Year Before
Present), and H2 approximately 104 000 YBP.
Coalescence Based AnalysesThe phylogenetic analyses performed with the program BEAST
confirmed the clear separation into two distinct geographical
lineages, namely H1 and H2, as revealed by the minimum
spanning network.
For a better visual clarity of the BEAST results, the global tree is
presented as two subtrees corresponding to the lineages H1 and
H2 (Figure 3A and 3B). Although the root location could not be
inferred with high confidence, results favored Chad/CAR/
Uganda as the root location (posterior probability = 0.40 com-
pared to prior probability 0.18). Uganda was the most probable
location for many of the older internal nodes in H1, with high
posterior probability (.0.5). In contrast, H2 showed compara-
tively low support for node locations, although the posterior
probabilities for most of the best-supported locations were higher
than 0.20 (Chad, Cameroon and CAR: collective posterior
probability of 0.20+0.20+0.19 = 0.59, compared to prior proba-
bility = 0.18). As can be seen in the network (Figure 1), although
H1 and H2 mainly consist of samples from South-Eastern and
Western Africa respectively, there were a number of exceptions to
this. In the tree, a separate lineage of 13 East African samples (of
which twelve were Ugandan) was observed in the H2 lineage. Out
of all 120 possible between-state diffusion rates, 17 migration rates
had a Bayes factor of more than 3 (Figure 4).
The divergence time between the H1 and the H2 lineages under
the IM model was estimated at 193 kyr (95% CI: 145 kyr–
449 kyr). With the BEAST reconstruction, the divergence time at
the root of the tree was estimated at 273 kyr, with a divergence
between a Ugandan and a Chad lineage, situated within the
confidence interval of the divergence time estimated considering
gene flow between both lineages over time. This gene flow was
estimated at around five female migrants per generation (95% CI
1–17) with IM. Gene flow did not appear to be directional
(p$0.49) (Figure 5A). The effective population size was assessed to
be larger for H2 (215 000, 95% CI: 160 000–292 000) than for H1
(149 000, 95% CI: 109 000–205 000) (p = 0.05). The ancestral
effective population size based on the same dataset (850, 95% CI:
245–27 000) was significantly smaller than the current effective
size (p,0.00001), indicative of an important population expansion
event (Figure 5B). A relatively high negative correlation was
observed between divergence time and ancestral population size
(Pearson r = 20.54), indicating that the IM program had
difficulties estimating these two parameters independently. All
other pairwise correlations between parameters were estimated to
be between 20.34 and 0.29. The split parameter indicates that it is
possible that only a small fraction (fraction: 0.14, 95% CI: 0.12–
0.98) of the ancestral population founded the extant metapopu-
lation in SE Africa (i.e., S. c. caffer).
Discussion
Continental Phylogeographic Structure and TaxonomicStatus of the Buffalo
Our study, based on the mtDNA genetic structure points to a
genetic discontinuity between the WC (mainly lineage H2) and the
SE (mainly lineage H1) populations (FCT = 0.42). Van Hooft [37]
found similar results on the basis of mitochondrial and Y-
chromosomal markers, with a smaller sampling from WC Africa
(14 samples). These lineages or haplogroups are not equivalent to
populations, but the clear separation between them suggests that
they are the results of a significant divergence and hence represent
Management Units (or MUs; Moritz 1994). The lineages
correspond to the two subspecies distinguished by all authorities:
S. c. caffer for the SE populations, and S. c. nanus for the WC
populations. According to these genetic results, S. c. nanus would
include S. c. brachyceros and S. c. aequinoctialis subspecies following
standard nomenclature rules (S. c. nanus Boddaert 1785, S. c.
brachyceros Gray 1837 and S. c. aequinoctialis Blyth 1866). This
is further substantiated by the low amount of genetic differenti-
ation between S. c. brachyceros, S. c. aequinoctialis and S. c. nanus.
Although inferences based on DNA data are somewhat hampered
because of the time required for complete lineage sorting to occur,
our data unequivocally show that the separation between S. c.
brachyceros, S. c. nanus and S. c. aequinoctialis is not taxonomically
equivalent to the split between all of these and S. c. caffer. We note
that these are preliminary genetic results as they are based
exclusively on single-locus mtDNA. No final conclusion can be
drawn concerning the taxonomic status of these subspecies before
using complementary nuclear markers.
Table 4. Fixation indices as estimated from hierarchicalAMOVAs in ARLEQUIN software. This analysis was computedwith the twenty-eight populations distributed within the twogeographical lineages (H1 and H2) (p,0.001) (FSC: amongpopulations within lineages; FST: among populations amonglineages; FCT: among both lineages).
F-statistics
FSC 0.17
FST 0.52
FCT 0.42
doi:10.1371/journal.pone.0056235.t004
Phylogeographic study of the African Buffalo
PLOS ONE | www.plosone.org 5 February 2013 | Volume 8 | Issue 2 | e56235
The absence of genetic structure within H2 based on the
analysis of the mitochondrial DNA -contrasting with extreme
phenotypic variability- also suggests that buffalo may rapidly adapt
(in evolutionary terms) to different ecological conditions, with
ecophenotypes not being reproductively isolated. Finer scale
resolution of the connectivity between the three ecophenotypes
of WC Africa should be investigated using more sensible molecular
markers as microsatellites or single nucleotide polymorphism.
Besides, based on our results, the fourth species described in
Groves and Grubb [46], Syncerus mathewsi, a population restricted
to the forested mountainous area of Virunga volcanoes, would
correspond to an intermediate between the nanus and the caffer
ecophenotypes (contact region close to the Rift Valley), with
morphological intermediate characteristics, as also proposed by
Grubb [47] himself. Further investigations using neutral nuclear
markers within the contact region would permit clarification of this
last assumption.
Although the morphology, behavior and respective habitats of S.
c. caffer and S. c. nanus are very different, the amount of genetic
differentiation is typical of that of subspecies, especially when
compared to the range of FCT values observed for other large
African bovids (Table 7). The most parsimonious explanation for
this pattern is that an ancient allopatric separation between an
Eastern and a Western population formed the two observed
lineages. This is further supported by earlier findings based on Y-
chromosomal microsatellite loci, which indicated that while S. c.
caffer was monomorphic for a single allele, the same allele was not
present in S. c. nanus [37]. Nevertheless, gene flow between those
two lineages, even if low, was indicated by a few haplotype
infidelities in the network and the phylogenetic analyses. This gene
flow was estimated to be in the order of five mitochondrial
genomes per generation since these lineages diverged. The
difference in chromosome number between the nanus and the
caffer ecophenotype, due to a Robertsonian fusion of two
acrocentric pairs (S. c. caffer: 52 and nanus ecophenotype: 54–56
chromosomes) [30–32], may have also contributed to a low gene
flow by decreasing hybrid fertility [48] and may be a consequence
of their divergence in allopatry. Negative effects of the variation of
chromosome number on fertility have been observed in mice,
cattle and humans [49,50].
The separation into two lineages, distributed in WC and SE
Africa respectively, is a pattern observed in many other savanna
African mammal species, as for example within the roan antelope
(Hippotragus equinus) or the bushbuck (Tragelaphus scriptus) [9,12].
Convergent phylogeographic patterns could indicate the existence
of common African refugia for various African savanna species
during climatic oscillations [18], proposed to be located in West,
East, Southern and South-West Africa [51]. Buffalo populations in
Uganda and in the Central African Republic displayed the highest
genetic diversity found in the species and were the most likely
candidates for the tree root location (Figure 3), suggesting that
these are good candidate areas for historic refugia within this
species. As the two lineages are found around this region, it may
also be considered as a hybrid or overlapping zone between
populations of the two lineages, explaining the higher genetic
diversity observed. The same phylogeographical pattern is
observed within the kob (Kobus kob- based on nuclear DNA
and mtDNA) with an overlapping region located around Northern
Uganda [7]. It was proposed based on divergent phenotype and
life-history adaptations of the kob subspecies that populations went
isolated within refugia in West and East Africa during the
Pleistocene, with subsequent dispersal leading to secondary
contact and hybridization between lineages around the present-
day Uganda. Similar refugia location were also proposed for the
hartebeest (Alcelaphus buselaphus- based on mtDNA), the topi
(Damaliscus lunatus- based on mtDNA) and the roan antelopes
(Hippotragus equinus –based on both nuclear DNA and mtDNA)
[1,6,7,9]. Based on the concordant pattern of intraspecific
structure in African mammals, we propose that the two lineages
division observed in different savanna species has arisen as a
consequence of Pleistocene climate oscillations in the absence of
an obvious present-day geographical barrier. More arid conditions
observed during glacial periods would have promoted isolation of
populations in refugia, with expansion during interglacial wet
periods [8], with secondary contact and hybridization between
lineages when overlapping occured. We thus propose that the
African buffalo survived unfavorable periods during the
Pleistocene in at least one refuge located in Western and one
refuge located in Eastern Africa, with overlapping around the
present-day Uganda.
Even if the buffalo would show strong philopatric behavior
[21,52,53], its high nucleotide diversity and low differentiation
between populations suggest a capability to disperse widely over
evolutionary time scales. The combination of a relatively large
effective population size and the possible ancestral nature of the
H2 lineage as discussed hereafter may explain its higher nucleotide
diversity. Furthermore, it is interesting to note that the overall
nucleotide diversity reaches 6%, which, except for the Grant’s
gazelle and the bushbuck, is high in comparison to other large
African mammals, even if buffalo populations are reported to have
declined in numbers due to outbreak of rinderpest during the last
century (elephant (Loxodonta africana), 1.4%; bushbuck (Tragelaphus
scriptus), 11.7%; roan antelope (Hippotragus equinus), 1.6%; water-
buck (Kobus ellipsiprymnus), 4.1%; impala (Aepyceros melampus), 2.8%;
Grant’s gazelle (Nanger granti), 10.9%) [9,12,54–57]. Same high
level of genetic variation was found in previous studies investigat-
ing the impact of such severe population bottlenecks on the genetic
variability of buffalo populations, indicating that rinderpest
pandemic had very little impact on the genetic diversity of the
African buffalo in terms of allelic or haplotype diversity [35,43,55].
The nanus ecophenotype populations are in comparison relatively
small and isolated, as indicated by low haplotype diversities and
high between-population genetic distances. Pairwise FST values
between the nanus ecophenotype populations were about three
times as large as those between populations within the other
ecophenotypes (see bold/italic written FST value in Table 3),
Table 5. Pairwise FST computation between ecophenotypes.
Ecophenotype nanus Ecophenotype brachyceros Ecophenotype aequinoctialis
Ecophenotype brachyceros 0.12
Ecophenotype aequinoctialis 0.02 0.08
Ecophenotype caffer 0.51 0.45 0.44
doi:10.1371/journal.pone.0056235.t005
Phylogeographic study of the African Buffalo
PLOS ONE | www.plosone.org 6 February 2013 | Volume 8 | Issue 2 | e56235

Table 6. Sample table summarizing their origin, number per park, subspecies affiliation based on morphological data, number ofhaplotypes, and haplotype and nucleotide diversities with their associated standard deviation estimated with ARLEQUIN andDNaSP software.
CountryToNind
Locality withineach country spp
LocalNind
LocalNhap h SD p (%) SD
Sierra Leone 1 Gola Forest A 1 1 / / / /
Ghana 39 Mole B 37 13 0.878 0.037 5.42 0.28
Kpetsu A 2 2 / / / /
Burkina Faso 5 Arly, Pama, Singou B 5 4 0.900 0.161 6.40 1.58
Benin 41 Pendjari B 41 19 0.931 0.021 5.72 0.32
Niger 21 W B 21 14 0.948 0.031 5.04 0.46
Cameroon 37 Benoue A,B 37 15 0.938 0.016 5.98 0.28
Gabon 76 Campo ma’an A 21 3 0.600 0.080 2.77 0.43
Gamba A 30 5 0.667 0.063 4.85 0.52
Lope A 25 6 0.760 0.073 5.07 0.45
CAR 25 Ngoto Forest A,C 4 4 1.000 0.002 7.95 0.29
St-Floris C 3 3 / / / /
Bangoran C 10 10 1.000 0.001 7.63 0.25
Koukourou C 2 2 / / / /
Sangha C 1 1 / / / /
Ouadda C 2 2 / / / /
Bria C 1 1 / / / /
Ndji River C 1 1 / / / /
Mbari C 1 1 / / / /
Chad 10 Zakouma C 10 9 0.978 0.046 7.08 0.51
DRC 1 Garamba A 1 1 / / / /
Uganda 134 Queen Elizabeth D 60 24 0.948 0.012 5.52 0.37
Lake Mburo D 22 17 0.965 0.034 2.36 0.52
Murchison falls D 21 19 0.990 0.018 4.82 0.55
Kidepo Valley D 19 14 0.953 0.036 4.30 0.47
Mount Elgon D 12 8 0.909 0.025 3.46 0.34
Kenya 127 Laikipia D 10 6 0.844 0.103 2.55 0.59
Amboseli D 20 10 0.863 0.063 3.29 0.44
Nairobi D 10 4 0.711 0.117 3.25 0.56
Tsavo D 24 11 0.909 0.032 3.61 0.45
Masai Mara D 28 11 0.902 0.029 3.32 0.43
Nakuru D 35 9 0.840 0.037 4.23 0.85
Tanzania 119 Serengeti D 37 15 0.899 0.033 3.66 0.36
Maswa D 22 10 0.870 0.052 3.96 0.61
Arusha D 48 11 0.735 0.064 2.34 0.37
Kizigo D 9 5 0.806 0.120 3.80 1.02
Selous D 1 1 / / / /
Unknown origin D 2 2 / / / /
Zimbabwe 59 Hwange D 16 9 0.883 0.062 5.08 0.52
Gonarezhou D 43 19 0.955 0.038 4.59 0.55
Botswana 11 Chobe D 11 10 0.982 0.046 4.53 0.58
South Africa 60 Kruger D 41 15 0.929 0.017 4.53 0.33
Hluhluwe-Imfolozi D 19 2 0.515 0.096 3.17 0.56
Namibia 1 Mother from Okahandja E 1 1 / / / /
AVERAGE 0.871 0.051 4.525 0.511
The nineteen samples excluded from the analysis are not quoted in this table (A S. c. nanus; B S. c. brachyceros; C S. c. aequinoctialis; D S. c. caffer; E Unknown affiliation;spp: subspecies; h: Haplotype diversity; p: nucleotide diversity expressed in percentage; CAR: Central African Republic; DRC: Democratic Republic of the Congo). Thesamples from the Benoue National Park and the Ngoto forest were morphologically intermediate between the S. c. nanus and the S. c. brachyceros/S. c. aequinoctialissubspecies respectively, indicated by the both capital letter.doi:10.1371/journal.pone.0056235.t006
Phylogeographic study of the African Buffalo
PLOS ONE | www.plosone.org 7 February 2013 | Volume 8 | Issue 2 | e56235
indicating that forest buffalo populations show signs of fragmen-
tation and of genetic drift, reflecting the importance of rainforest
as a biogeographical barrier to gene flow. Observations of forest-
dwelling buffalo (nanus ecophenotype) confirm our assumption
[21,58,59]. These studies showed a high correlation between forest
buffalo presence and clearings, necessary for feeding and for water
accessibility [23]. This dependence on open places has been
identified as a limiting factor in movement of individuals. Our
results support the fact that rainforest acts as a major
biogeographic barrier limiting gene flow.
Evolutionary History and Demographic TrendsAccording to the IM analysis, although this result was not
significant, the split parameter suggests that the S. c. caffer
subspecies originates from the isolation of a subpopulation of the
ancestral population. Fossil records from the late Pleistocene are in
agreement with this. Indeed, the close resemblance of the
Pleistocene-dated fossils to the actual West-Central African buffalo
suggests that the H2 population existed before the H1 population
[52,60]. Our results therefore suggest a recent origin of the Cape
buffalo (S. c. caffer), which possibly derived from a stock of savanna
buffalo originating from West-Central Africa (H2 lineage) [52].
The coalescent approach with migration suggested a Middle to
Late Pleistocene divergence (150–300 kyr), which is contempora-
neous with previous studies of other African species [1,6]. It should
be noted that we are restricted to making inferences going back to
the MRCA (the ‘mitochondrial Eve’) of the buffalo mtDNA, which
is most likely much younger than the species itself, unfolding only
part of the buffalo history.
We also found evidence under the IM model of an important
expansion in both lineages since their Pleistocene divergence,
Figure 2. Mismatch distribution analysis including whole samples from the four subspecies, with observed (dotted line) andexpected (thin line) mismatch from segregating sites of the aligned sequences of the D-Loop gene computed under the suddenexpansion model performed with the ARLEQUIN software. A South-Eastern lineage; B West-Central lineage.doi:10.1371/journal.pone.0056235.g002
Phylogeographic study of the African Buffalo
PLOS ONE | www.plosone.org 8 February 2013 | Volume 8 | Issue 2 | e56235
Phylogeographic study of the African Buffalo
PLOS ONE | www.plosone.org 9 February 2013 | Volume 8 | Issue 2 | e56235

which is supported by the star-like topology of the haplotype
network of the H1 lineage and the negative Fu’s Fs index for both
lineages. This is in agreement with two earlier studies based on S.
c. caffer, using an alternative coalescent approach with Bayesian
skyline plots [61,62]. The expansion time, calculated based on the
t values, was estimated as starting at approximately 48 000 YBP
for the H1 lineage, consistent with a previous study on the Cape
buffalo by Van Hooft [37]. Expansion time for the H2 lineage was
estimated at approximately 104 000 YBP. The more recent
expansion of the H1 compared to the H2 lineage could be related
to the development of open grassland on the East-Southern part of
the continent at the end of Pleistocene. Paleoclimatic indications
support our assumption. Indeed, Eastern and Southern Africa
experienced an extremely arid period between 135 and 90 kyr, far
more severe than the conditions occurring during the Last Glacial
Maximum (35–15 kyr). Aridity decreased progressively after
95 kyr, until it reached near modern conditions around 60 kyr
[63]. This period approximately coincides with the expansion
signal for the H1 lineage. The development of large savanna-type
grasslands could have allowed southward colonization by provid-
ing suitable habitat for the buffalo populations [64,65]. Van Hooft
[37] also proposed that this expansion could have followed the
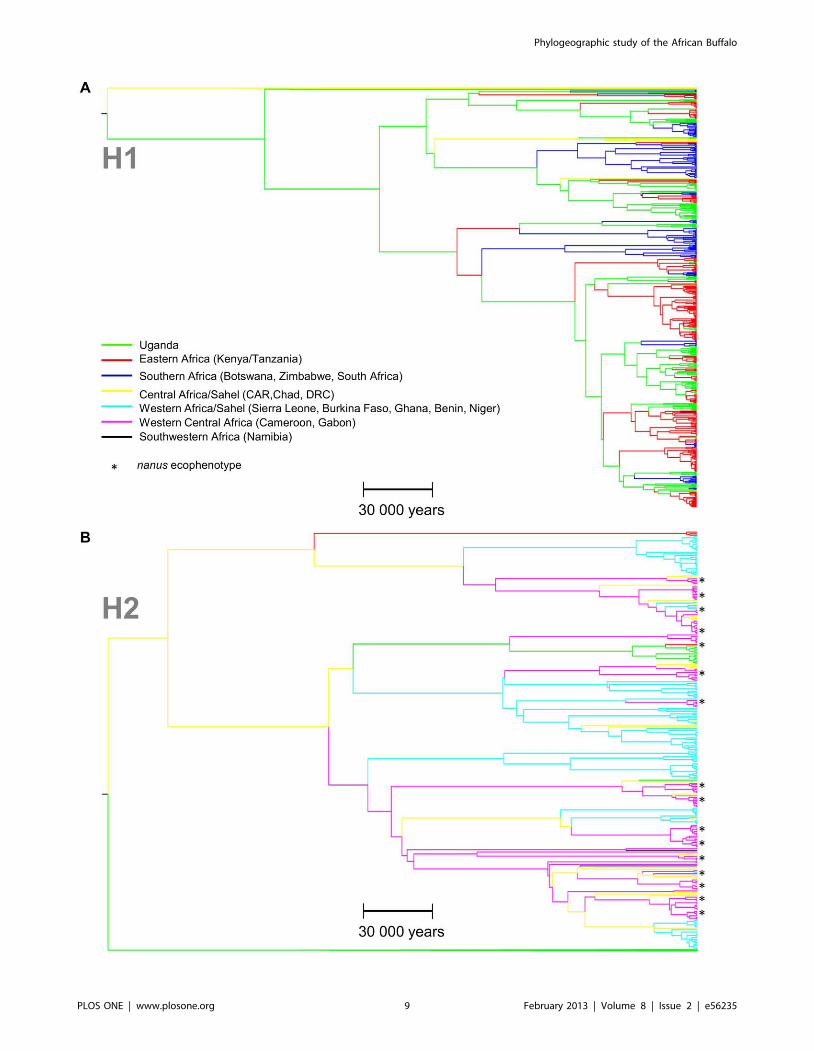
Figure 3. Bayesian phylogeographic trees of the D-Loop sequences reconstructed with BEAST software showing the inferredgeographical location of each node in the buffalo phylogeny. Node locations are color coded (branches leading to each node) according togeographical sample origin: Green/Red/Blue: H1 South and East Africa; Turquoise/Pink: H2 West Africa; Yellow: H2 Central Africa; Black: Namibia. Scalebar shows time in years. Asterisks represent nanus ecophenotype samples. A H1 lineage; B H2 lineage. CAR: Central African Republic; DRC: DemocraticRepublic of the Congo.doi:10.1371/journal.pone.0056235.g003
Figure 4. Map of the African continent showing the seventeen historical migration rates between sampled localities supported by aBayes factor .3. Grey shape on the map represent the actual distribution of the African buffalo after IUCN’s Antelope Specialist Group, 2008.Numbers on the map indicate the median time endpoints over all BEAST trees of the earliest branch with a given locality state. Hence, it provides anestimate of the earliest migration into each locality.doi:10.1371/journal.pone.0056235.g004
Phylogeographic study of the African Buffalo
PLOS ONE | www.plosone.org 10 February 2013 | Volume 8 | Issue 2 | e56235

extinction of a buffalo-like species, the giant long-horned buffalo
(Peloveris antiquus), which dominated the African savanna until the
late Pleistocene, as demonstrated by fossil data [52,66,67], a
hypothesis also in agreement with our results.
Nevertheless, recent radiometric studies on fossil records
support the presence of buffalo in Southern Africa around
542 kyr (95% CI: 435–682 kyr) [68], which indicates that some
Syncerus-like species occupied Southern Africa earlier than we
could infer based on mtDNA. Our signal of expansion toward
Southern Africa could thus be a signal of re-colonization, which
supports the hypothesis of the importance of the refugia located in
Eastern and Western Africa. Southern Africa could have witnessed
multiple colonization-extinction events, following habitat suitabil-
ity.
Lineage H2 on the other hand was inferred to have expanded
earlier, at approximately 104 000 YBP. More varied and open
habitats prevailed after 1.8 Ma in subtropical Africa [69], with
more pronounced vegetal changes after 220 kyr associated with
climatic shifts [70,71]. Paleorecords support the probable persis-
tence of a rainforest zonal belt in both dry and wet periods before
220 kyr, with large westward expansions of Podocarpus forest during
favorable periods [70]. After 220 kyr, a more pronounced
reduction of scattered occurrences of the rainforest was recorded.
The development of savanna habitat in Western Africa, replacing
forest habitat, could have promoted the expansion of the Western
populations of savanna buffalo, whose expansion signal approx-
imately coincides with the savanna development.
Major Colonization Events and Migration RoutesThe Eastern region around the present-day Uganda appears to
have played a prominent role throughout the history of the H1
lineage. Many internal branches had high posterior probabilities
for the geographical state of Uganda, and the earliest occurrence
of a non-Ugandan branch in H1 was 83–103 kyr (Figure 3B),
roughly 170 000 years after the divergence of H1 and H2. This
supports an important conclusion: a primary refuge for S. c. caffer
located in Eastern Africa appears to have played an important role
in its history, when climatic conditions were unfavorable.
Migration from a core Eastern refuge into other parts of SE
Africa was found to have happened several times, as these other
locations are positioned at multiple separate external branches,
dated independently, on internal Ugandan branches, probably
related to the climatic oscillation registered during Pleistocene.
Further support is found in the network reconstruction, which
reflects the same pattern, with Southern African haplotypes
forming sub-groups positioned at tip positions, without being
Figure 5. Plots of the posterior probability distribution of parameters estimated from the isolation-with-migration modelperformed with the IM software. A Posterior distribution for migration estimates of the directional migration rates from H1 to H2 (in black) andotherwise (in pink); B Posterior distribution of estimates of the population sizes for the ancestral (in grey), H1 (in black) and H2 (in pink) populations.doi:10.1371/journal.pone.0056235.g005
Phylogeographic study of the African Buffalo
PLOS ONE | www.plosone.org 11 February 2013 | Volume 8 | Issue 2 | e56235
monophyletic. Our analysis of the quantification of the strength of
connectivity between geographical states in the tree, which
attempted to identify the historically most important migration
routes, identified strong support for a Uganda-Tanzania and a
Tanzania-Kenya link, but not for a Uganda-Kenya link. Thus, a
central role of Tanzania in this Southern expansion was also
highlighted.
The H2 lineage showed a less clear geographical pattern with
an earlier geographical diversification from a core population in
Chad, Cameroon or the Central African Republic (CAR) (i.e.,
Western refuge). The genealogy of H2, with its longer branch
lengths, indicates that H2 underwent a demographic expansion
earlier than H1, a fact corroborated by the mismatch distribution
profiles. For H2, Cameroon and Gabon hosting forest buffalo
ecophenotypes form migratory cul-de-sacs connected to CAR,
indicating that these populations are the result of a unique
migration route from CAR, which is different from the migration
route between CAR and the Western savanna buffalo populations.
This is consistent with Figure 3A, where the same three Central
African forest buffalo populations mainly occur together in
lineages distinct from the Western savanna buffalo of Niger,
Chad, Ghana and Benin. This interpretation suggests that the
forest buffalo ecophenotype, rather than being the ancestor of all
living African buffalo as Kingdon [26] proposed, may be an
advanced form derived from the WC savanna ecophenotype. This
is also supported by the fact that the forest ecophenotype appears
to be non-monophyletic, indicating different separate migration
route endpoints. Furthermore, the work of Bekhuis [23], based on
the study of the diet of the forest buffalo in Cameroon, concluded
that the ancestral niche of the buffalo ancestors more likely
corresponds to a savanna-rainforest gradient or mosaic than to a
true rainforest, in agreement with the observation that most
Pleistocene buffalo fossils resemble S. c. brachyceros [72]. CAR was
clearly an important link in the westward dispersal of buffalo from
a presumed Central African origin, as evidenced by the high
number of strongly supported rates between CAR and other H2
locations in addition to the inferred link between CAR and
Uganda.
Interestingly, the one available sample from South-Western
Africa (Namibia) was positioned well within H2. This shows an
important migration connection between West-Central and West-
Southern Africa, which has been proposed before [37] and is
supported by morphological studies, reporting the existence of a
dwarf-buffalo-like-population in Angola [21]. Nevertheless, as this
deduction is based on only one sample from Antwerpen Zoo with
mother from Okahandja [37, this study], it should be regarded as
tentative and to be further investigated by increasing the sampling
from this region.
In summary, the pattern in Figure 4 and Figure 3 suggests that
the split between two major lineages of buffalo occurred in
Western Africa, probably around the present-day CAR. One
lineage (H1) apparently remained in Eastern Africa for a long time
before expanding in population size and range, and the other (H2)
expanded earlier along two separate routes into the African forest
belt and the Western Sahel region, respectively. Overall, we
propose the following phylogeographic scenario: the ancestor of all
living buffalo lived in Western Africa. This ancestral population
became separated (for unknown reasons) around 100–300 kyr into
two isolated populations, one of which (ancestors of H2) started
expanding westward at an early time, around 100 kyr or earlier.
The other (ancestors of H1) retained its core population in Eastern
Africa, probably being unable to colonize arid Southern Africa
until about 50–80 kyr, where it expanded South and East, possibly
after adapting to an arid savanna environment or after the decline
of an obvious competitor, Pelorovis antiquus [52,66,67]. A recent
colonization of Southern Africa by S. c. caffer is supported by the
lack of true Cape buffalo characteristics, i.e., the sweeping horns
and pronounced horn boss, in all buffalo fossils from this region
[52,72]. This tentative phylogeographic scenario is in agreement
with the wealth of fossil and molecular data currently available on
the African buffalo.
ConclusionsOur main finding is that African buffalo should be partitioned
into two MUs (i.e., Management Units as defined by Moritz [73]),
putatively named the South-Eastern African buffalo (S. c. caffer)
and the Western African buffalo (S. c. nanus), which has important
implications for the conservation of the species. We found little
genetic structure distinguishing the three morphologically distinct
ecophenotypes of the Western African buffalo, hence we posit that
these ecophenotypes merely represent rapid adaptations to local
habitat variations without reproductive isolation. Our results also
suggest that the forest buffalo ecophenotype may be an adapted
form derived from the West-Central savanna ecophenotype. The
more important phenotypic variability observed in West-Central
Africa could be the result of an earlier origin of the Western
lineage than of the Cape buffalo. More genetic clusters in the
Western lineage that very recently diverged may also exist and
could be identified using finer genetic markers. We have
demonstrated that extensive sampling from the whole distribution
of a species makes it possible to infer important aspects of historical
migration, refugial areas and taxonomic subdivision.
Materials and Methods
Sample Collection and Laboratory MethodsThe protocols for animal sampling used for our study did not
induce pain or distress, according to the Animal Care Resource
Guide, and thus correspond to USDA category C. Indeed, capture
relied on the live capture technique of large mammals covered in
the American Society Mammalogists Guidelines. Procedures were
not more invasive than peripheral blood sampling or peripheral
tissue sampling. Chemical immobilisation was only performed to
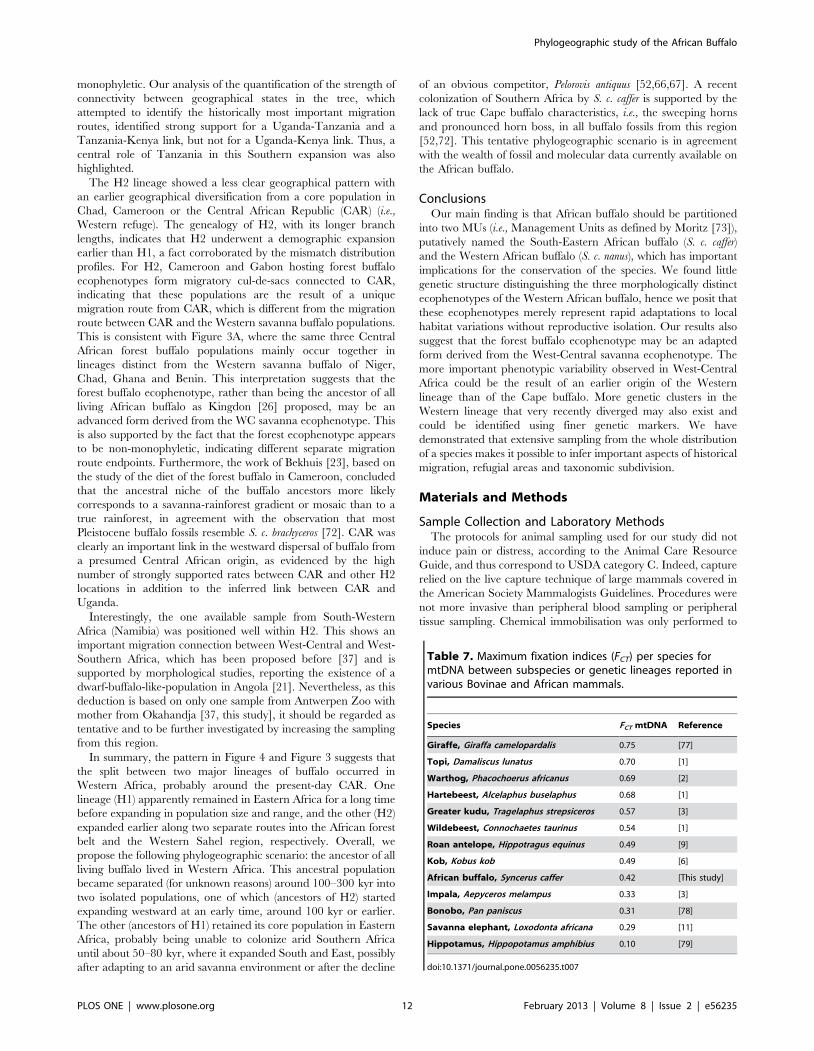
Table 7. Maximum fixation indices (FCT) per species formtDNA between subspecies or genetic lineages reported invarious Bovinae and African mammals.
Species FCT mtDNA Reference
Giraffe, Giraffa camelopardalis 0.75 [77]
Topi, Damaliscus lunatus 0.70 [1]
Warthog, Phacochoerus africanus 0.69 [2]
Hartebeest, Alcelaphus buselaphus 0.68 [1]
Greater kudu, Tragelaphus strepsiceros 0.57 [3]
Wildebeest, Connochaetes taurinus 0.54 [1]
Roan antelope, Hippotragus equinus 0.49 [9]
Kob, Kobus kob 0.49 [6]
African buffalo, Syncerus caffer 0.42 [This study]
Impala, Aepyceros melampus 0.33 [3]
Bonobo, Pan paniscus 0.31 [78]
Savanna elephant, Loxodonta africana 0.29 [11]
Hippotamus, Hippopotamus amphibius 0.10 [79]
doi:10.1371/journal.pone.0056235.t007
Phylogeographic study of the African Buffalo
PLOS ONE | www.plosone.org 12 February 2013 | Volume 8 | Issue 2 | e56235
facilitate the procedure. Animals were released in favourable
condition that enabled them to avoid predators, seek shelter, and
survive inclement weather.
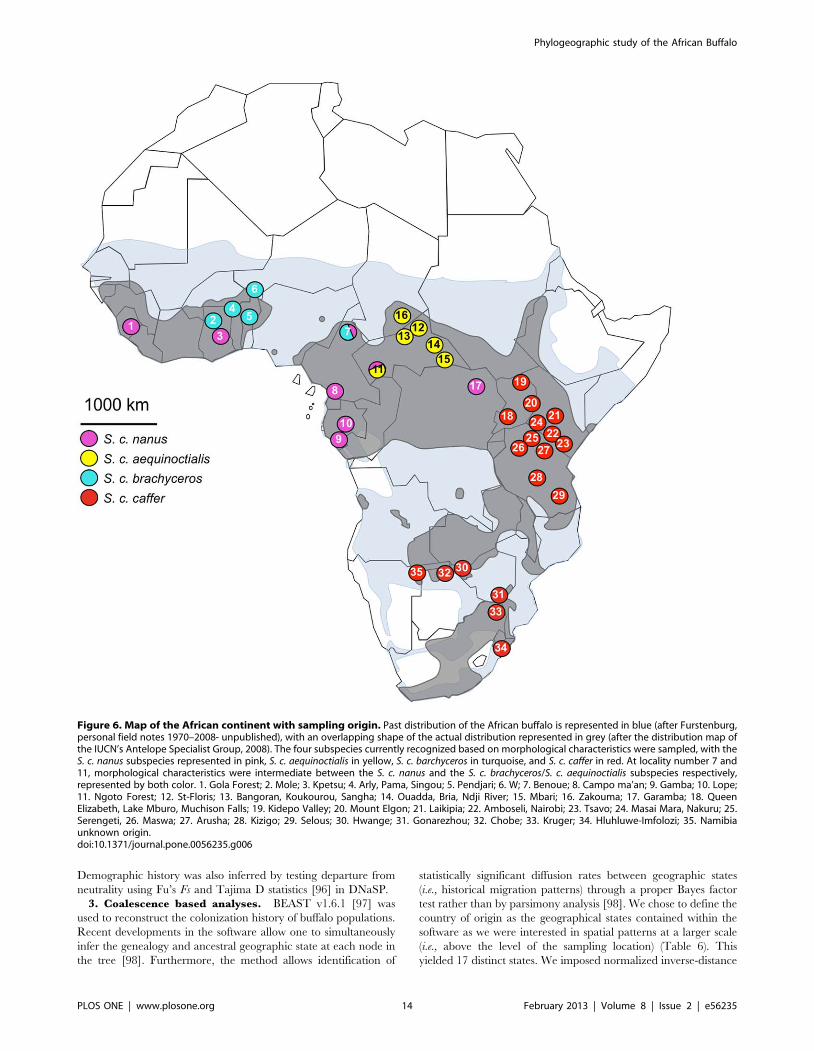
A set of 787 buffalo samples from West (Ghana, Burkina Faso,
Benin, Niger, Sierra Leone, Chad), Central (Cameroon, Central
African Republic, Democratic Republic of Congo, Gabon), East
(Uganda, Kenya, Tanzania) and Southern Africa (Zimbabwe,
Botswana, South Africa, Namibia, Angola) was analyzed. Details
and location of the samples are shown in Table 6 and Figure 6.
This extensive sampling covers almost the entire distribution of the
African buffalo and comprises samples of all putative subspecies.
Sample access was facilitated by a large campaign of epidemio-
logical monitoring, but also because buffalo is a prestigious
hunting trophy.
Blood, hair, tissue and dung samples were kept in ethanol
solution and stored at ambient temperature, except the dung
samples from Ghana, Sierra Leone and Benin, which were
collected on Whatman FTA cards [80,81]. Total DNA was
extracted using either a DNeasy tissue kit (QIAGEN) or a
Puregene kit (QIAGEN), following the manufacturer’s instruc-
tions. The Puregene protocol was modified slightly for use with
Whatman FTA cards. DNA was released from the cards by
soaking 1.25 cm2 of the card in 240 ml water and heating this to
90uC for 10 minutes. Following this, 120 ml of the solution was
transferred to a new tube together with 480 ml Puregene Cell Lysis
solution and 3 ml of a 20 mg/ml proteinase K solution. The
remainder of the protocol followed the manufacturer’s instruc-
tions.
The D-loop hypervariable region (HVR) and adjacent regions
were amplified in the majority of samples using forward L0 (59-
CCCAAAGCTGAAATTCTACTTAAACTA-39) and reverse S0
(59-TCTAGGCATTTTCAGTGCCTTGCTTT-39) primers
[82]. In the samples from Ghana, Sierra Leone, Benin, Cameroon
and Gabon, DNA amplification took place with forward primer
Dsca1 (59-AATATAAAGAGCCTCCCCAG-39) and reverse
primer Dsca2 (59-CGGCCATAGCTGAGTCC-39) [35]. In gen-
eral, DNA amplification was carried out as described in Heller
[43] with polymerase chain reaction (PCR) products sent to
MACROGEN Inc (Capillary electrophoresis on a 3730XL) or
sequenced following Heller [43] protocols. PCR reactions on
DNA extracted from dung were performed with a Qiagen Hotstart
PCR kit following the manufacturer’s instructions. Negative
controls were invariably included to check for contamination.
PCR products of DNA extracted from dung were cleaned with a
MultiScreen PCR96 Cleanup kit (Millipore) and sequenced using a
DETT sequencing kit according to the manufacturer’s specifica-
tions (GE Healthcare). The resulting sequence PCR products were
cleaned with a Montage SEQ96 Sequencing Reaction Cleanup kit
(Millipore).
Newly sequenced individuals are registered on the National
Institutes of Health (NIH) genetic sequence database (GenBank-
JQ065982–JQ066169, JQ780485–JQ780603). Previously se-
quenced data are available on the same sequence database
(AF313151–AF313345, JQ403422–JQ403515 and AF028843–
AF029038, with exclusion of AF028863, AF028871, AF028876–
AF028882, and AF028891 sequences). Seven sequences of Bubalus
bubalis, the Asian water buffalo, the closest relative to Syncerus caffer,
were used as an outgroup for our study (Genbank accession
numbers: AF475260, AF475278, AY702618, AF547270,
EF396999, EF536326, EF536327).
Sequence AnalysisThe resulting sequences were read and aligned using CLUS-
TAL_X [83], as implemented in BIOEDIT v.7.09 [84] and using
Chromas software [85], with corrections by eye. Newly sequenced
samples led to the identification of a 604-bp overlapping region.
When aligning those newly sequenced HVR region with those
obtained from GenBank, a 286-bp overlapping region (including
indels) was identified. Nineteen samples were excluded from the
final analyses as these contained large amounts of missing data
(samples from Mole (n = 1), Niger (n = 5) and CAR (n = 1)), or
required the introduction of a large (85 bp) indel in the alignment,
corresponding to the conserved region ETAS2 (Extended Termi-
nation Associated Sequence) [86] (Lope NP (n = 10), Kidepo
Valley (n = 1) and Angola (n = 1)). In total, 768 samples were
included in the final analyses. Because of complications during
analyses (see e.g. [87] for a discussion of the effect of missing data
on analyses), all sites containing alignment gaps or ambiguous
nucleotides (i.e., missing data) were removed, which resulted in a
final dataset of 195 unambiguous characters. The dataset
comprised 116 mutations of which 109 were parsimony informa-
tive, with a large number of the variability associated to rare
variants that differed in just one nucleotide site each. The
transition/transversion ratio was estimated at 9.55:1.
A haplotype network was constructed using the minimum
spanning network method (MINSPNET in ARLEQUIN v.3.1)
[88] with default settings. This produces a network representing
the most parsimonious relationship between haplotypes. Networks
are preferable to trees for intraspecific studies because they do not
force haplotypes to occupy tip positions and allow for multi-
furcations in the topology [89].
1. Population differentiation. The hierarchical distribution
of genetic variance among and within populations was assessed
using an analysis of molecular variance (AMOVA) on the basis of
individual nucleotide frequencies. We also performed pairwise
comparisons of individual nucleotide frequencies between popu-
lations using Wright’s F-statistics, as implemented in ARLEQUIN
v.3.1 [90]. The groups and populations for AMOVA and Wright’s
F-statistics were defined according to their geographic position,
including the national park or game reserve where it was collected
(see Table 6), except for the neighboring populations in the
Chobe-Hwange and the Masai Mara-Serengeti-Maswa ecosystems
that were not significantly differentiated from one another. The
statistical significance of the F-statistics was assessed using 1 000
random permutations. For all populations where the number of
included samples exceeded four, we calculated the number of
haplotypes, haplotype diversity h and nucleotide diversity p [91]
(including standard deviations) using ARLEQUIN and DNaSP
[92].
2. Demographic trends. Past demographic history of each
of the buffalo lineages was inferred by a pairwise mismatch
distribution analysis between individuals [93], comparing the
distribution of observed pairwise nucleotide differences, with the
expected distribution in an exponentially expanding population.
To assess the statistical significance of the distribution, we
examined the sum of square deviations (SSD) between the
observed and expected mismatch and Harpending’s raggedness
index r computed under a population growth-decline model in
ARLEQUIN. The P-value of the test was approximated based on
the fraction of times the real data showed a lower value than the
simulated data. The timing of demographic expansion can also be
roughly estimated by the mode of mismatch distribution texpressed as t = 2 mt, where t is the expansion time in number
of generations and m is the mutation rate for the whole sequence
[94]. Generation time was fixed within a range of five to seven
years, based on the estimates of O’Ryan [34] and Prins (personal
communication), and the mutation rate per site was fixed to 32%
per million years for the D-loop as estimated by Shapiro [95].
Phylogeographic study of the African Buffalo
PLOS ONE | www.plosone.org 13 February 2013 | Volume 8 | Issue 2 | e56235
Demographic history was also inferred by testing departure from
neutrality using Fu’s Fs and Tajima D statistics [96] in DNaSP.
3. Coalescence based analyses. BEAST v1.6.1 [97] was
used to reconstruct the colonization history of buffalo populations.
Recent developments in the software allow one to simultaneously
infer the genealogy and ancestral geographic state at each node in
the tree [98]. Furthermore, the method allows identification of
statistically significant diffusion rates between geographic states
(i.e., historical migration patterns) through a proper Bayes factor
test rather than by parsimony analysis [98]. We chose to define the
country of origin as the geographical states contained within the
software as we were interested in spatial patterns at a larger scale
(i.e., above the level of the sampling location) (Table 6). This
yielded 17 distinct states. We imposed normalized inverse-distance
Figure 6. Map of the African continent with sampling origin. Past distribution of the African buffalo is represented in blue (after Furstenburg,personal field notes 1970–2008- unpublished), with an overlapping shape of the actual distribution represented in grey (after the distribution map ofthe IUCN’s Antelope Specialist Group, 2008). The four subspecies currently recognized based on morphological characteristics were sampled, with theS. c. nanus subspecies represented in pink, S. c. aequinoctialis in yellow, S. c. barchyceros in turquoise, and S. c. caffer in red. At locality number 7 and11, morphological characteristics were intermediate between the S. c. nanus and the S. c. brachyceros/S. c. aequinoctialis subspecies respectively,represented by both color. 1. Gola Forest; 2. Mole; 3. Kpetsu; 4. Arly, Pama, Singou; 5. Pendjari; 6. W; 7. Benoue; 8. Campo ma’an; 9. Gamba; 10. Lope;11. Ngoto Forest; 12. St-Floris; 13. Bangoran, Koukourou, Sangha; 14. Ouadda, Bria, Ndji River; 15. Mbari; 16. Zakouma; 17. Garamba; 18. QueenElizabeth, Lake Mburo, Muchison Falls; 19. Kidepo Valley; 20. Mount Elgon; 21. Laikipia; 22. Amboseli, Nairobi; 23. Tsavo; 24. Masai Mara, Nakuru; 25.Serengeti, 26. Maswa; 27. Arusha; 28. Kizigo; 29. Selous; 30. Hwange; 31. Gonarezhou; 32. Chobe; 33. Kruger; 34. Hluhluwe-Imfolozi; 35. Namibiaunknown origin.doi:10.1371/journal.pone.0056235.g006
Phylogeographic study of the African Buffalo
PLOS ONE | www.plosone.org 14 February 2013 | Volume 8 | Issue 2 | e56235
(straight-line distance) based priors on the diffusion rate indicators
between countries (i.e., geographical midpoint between sampled
regions in each country) to incorporate geographical separation of
the samples in the analyses. A strict molecular clock was applied
with a normally distributed substitution rate prior, with 95% of the
probability density between 2.361027 and 4.161027, as estimated
by Shapiro [96] for the steppe bison Bison priscus. Analyses were
conducted assuming a constant population size in order to avoid
over-parameterization. The best fitting nucleotide substitution
model, according to the Akaike information criterion (AIC) [99],
was the HKY (Hasegawa, Kishino and Yano) substitution model
[100]; we therefore specified this model in all analyses. BEAST
MCMC chains were run for 50 million generations, with sampling
of statistics and trees every 5 000 steps. Convergence was verified
using TRACER v1.4 [97]. A maximum lineage credibility tree
was constructed using TreeAnnotator [97], and the geographical
state at each node was visualized in FigTree v1.3.1 (Rambaut
2006–2009). Finally, Bayes factors (BF) [98] were calculated to
estimate the diffusion rates between states throughout the trees.
We imposed a threshold value of BF = 3 to determine the
significance of the diffusion process connecting the location states.
An isolation-with-migration (IM) model for two closely related
populations or ecophenotypes was applied using the IM program
[101,102]. The IM model presents seven demographic parame-
ters, scaled by the mutation rate: current effective population sizes,
ancient effective population size, migration rate in both directions,
time of population splitting and a splitting parameter. The latter
parameter, not included in newer versions of IM (IMA and IMA2),
estimates what fraction of the ancestral population formed each of
the two current populations or ecophenotypes. We used a burn-in
of 500 000 steps followed by a run of 12–15 million steps. Prior
distributions were chosen that included all or most of the range
over which the posterior density is non-trivial. We ran the
program for a sufficient length of time so that there were no
obvious trends in the trend line plots and ensured that the lowest
effective sample size (ESS) for estimates exceeded 50. The latter
was not always achievable, especially for the time of population
splitting, irrespective of the length of the runs. However, we got
similar estimates for all parameters in all simulations, providing
confidence in our findings. The estimates of the mean and the
limits of the 95% confidence interval deviated no more than 27%
and 41%, respectively, from their average value across three
simulations. We used a geometric heating scheme with h1 = 0.8
and h2 = 0.9, applying metropolis coupling using a 10 chain
geometric heat mode with 45 chain swap attempts per step. The
final prior values used for respectively current population size,
ancestral population size, migration rate, lower limit divergence
time, and upper limit divergence time were qcurrent = 70, qancestral = 8,
m = 0.12, w = 7 and t = 40, respectively. The splitting parameter s
was included, migration rates were estimated in both directions
and the HKY substitution model was applied.
Due to computational constraints, 360 samples were randomly
selected, 180 from West-Central and 180 from South-Eastern
Africa. Three simulations with 360 samples were performed, each
using a different random subset of samples and a different random
seed number. All populations within a specific group were
represented with a random selection of samples, while equalizing
sample size per population as much as possible resulting in the
following scheme: West Africa (90 samples), Cameroon and
Gabon (54 samples), Chad, Central African Republic and
Democratic Republic of Congo (Eastern part of Central Africa
close to the lineage border, 36 samples), Uganda (Western part of
East Africa close to the lineage border, 36 samples), Kenya and
Tanzania (54 samples) and Southern Africa (90 samples).
Countries close to the border between two lineages were defined
as distinct groups to get maximum sample representation from the
presumed center of the divergence.
Acknowledgments
West African buffalo tissue samples came from a study funded by the
French National Research Agency (ANR Mobility program). Special
thanks go to M. Pellerin from the IGF of Paris (Fondation Internationale
pour la Gestion de la Faune), K.L. Kanapeckas for the samples from the
Hluhluwe-Imfolozi National Park, P. Bouche, M. de Garine-Wichatitsky
(Centre de Cooperation Internationale en Recherche Agronomique pour le
Developpement), F. Jori (Centre de Cooperation Internationale en
Recherche Agronomique pour le Developpement), R. Godinho, D.
Mathieu, R. Barrat, E. Turquin, P. Dumesnil, Y. Penet, R. Michael, R.
Paolucci, D. Stromberg, M. Pariente, E. Jan, Y. Forestier, J.F. Herrera, R.
Garza, P. Leveau, P. Augais, Basson, R. Buij, B. Croes and Jayet for all
other samples of tissue, dung or blood of the African buffalo. We also thank
the CIRAD RP-PCP platform of Harare for providing samples from
Southern Africa. Further thanks to M. Melletti and E.S. Vrba for personal
comments and investigation into the interpretation of the results.
Author Contributions
Conceived and designed the experiments: NS CB DC RH PVH PC JM.
Performed the experiments: NS CB RH PVH. Analyzed the data: NS CB
RH PVH JM. Contributed reagents/materials/analysis tools: NS CB DC
RH PVH PC AC HHTP BJVV HHDI JM. Wrote the paper: NS CB DC
RH PVH PC AC HHTP BJVV HHDI JM.
References
1. Arctander P, Johansen C, Coutellec-Vreto MA (1999) Phylogeography of three
closely related African bovids (tribe Alcelaphini). Mol Biol Evol 16: 1724–1739.
2. Muwanika VB, Nyakaana S, Siegismund HR, Arctander P (2003) Phylogeog-
raphy and population structure of the common warthog (Phacochoerus africanus)
inferred from variation in mitochondrial DNA sequences and microsatellite
loci. Heredity 91: 361–372.
3. Nersting LG, Arctander P (2001) Phylogeography and conservation of impala
and greater kudu. Mol Ecol 10: 711–719.
4. Girman DJ, Kat PW, Mills MGL, Ginsberg JR, Borner M, et al. (1993)
Molecular genetic and morphological analyses of the African wild dog (Lycaon
pictus). J Hered 84: 450–459.
5. Marsden CD, Woodroffe R, Mills MGL, McNutt JW, Creel S, et al. (2012)
Spatial and temporal patterns of neutral and adaptive genetic variation in the
endangered African wild dog (Lycaon pictus). Mol Ecol. doi: 10.1111/j.1365-
294X.2012.05477.x.
6. Birungi J, Arctander P (2000) Large sequence divergence of mitochondrial
DNA genotypes of the control region within populations of the African
antelope, kob (Kobus kob). Mol Ecol 9: 1997–2008.
7. Lorenzen ED, De Neergaard R, Arctander P, Siegismund HR (2007)
Phylogeography, hybridization and Pleistocene refugia of the kob antelope
(Kobus kob). Mol Ecol 16: 3241–3252.
8. Bertola LD, van Hooft WF, Vrieling K, Uit de Weerd DR, York DS, et al.
(2011) Genetic diversity, evolutionary history and implications for conservation
of the lion (Panthera leo) in West and Central Africa. J Biogeogr 38(7): 1356–
1367. doi:10.1111/j.1365-2699.2011.02500.x.
9. Alpers DL, Jansen van Vuuren B, Arctander P, Robinson TJ (2004) Population
genetics of the roan antelope (Hippotragus equinus) with suggestions for
conservation. Mol Ecol 13: 1771–1784.
10. Lorenzen ED, Simonsen BT, Kat PW, Arctander P, Siegismund HR (2006)
Hybridization between subspecies of waterbuck (Kobus ellipsiprymnus) in zones of
overlap with limited introgression. Mol Ecol 15: 3787–3799. doi: 10.1111/
j.1365-294X.2006.03059.x.
11. Nyakaana S, Arctander P, Siegismund HR (2002) Population structure of the
African savannah elephant inferred from mitochondrial control region
sequences and nuclear microsatellite loci. Heredity 89: 90–98.
12. Moodley Y, Bruford MW (2007) Molecular Biogeography: Towards an
Integrated Framework for Conserving Pan-African Biodiversity. PLoS ONE
(5): e454.
13. Lorenzen ED, Arctander P, Siegismund HR (2006) Regional genetic
structuring and evolutionary history of the Impala Aepyceros melampus.
J Heredity 97: 119–132.
Phylogeographic study of the African Buffalo
PLOS ONE | www.plosone.org 15 February 2013 | Volume 8 | Issue 2 | e56235
14. Pitra C, Hansen AJ, Lieckfeldt D, Arctander P (2002) An exceptional case of
historical outbreeding in African sable antelope populations. Mol Ecol 11:
1197–1208.
15. Pitra C, VazPinto P, O’Keeffe BWJ, Willows-Munro S, Jansen Van Vuuren B,
et al. (2006) DNA-led rediscovery of the giant sable antelope in Angola.
Eur J Wildlife Res 52: 145–152.
16. Jansen van Vuuren B, Robinson TJ, VazPinto P, Estes R, Matthee CA (2010)
Western Zambian sable: are they a geographic extension of the giant sable
antelope? S Afr J Wildl Res 40: 35–42.
17. Flagstad O, Syvertsen P, Stenseth N, Jakobsen K (2001) Environmental change
and rates of evolution: the phylogeographic pattern within the hartebeest
complex as related to climatic variation. Proc R Soc Lond B 268: 667–677. doi:
10.1098/rspb.2000.1416.
18. deMenocal PB (1995) Plio-Pleistocene African climate. Science 270: 53–59.
DOI: 10.1126/science.270.5233.53.
19. Hewitt GM (2004) The structure of biodiversity – insights from molecular
phylogeography. Front Zool 1: 4.
20. Lorenzen ED, Siegismund HR (2004) No suggestion of hybridization between
the vulnerable black-faced impala (Aepyceros melampus petersi) and the common
impala (A. m. melampus) in Etosha National Park, Namibia. Mol Ecol 13: 3007–
3019.
21. Prins HHT (1996) Ecology and Behaviour of the African Buffalo: Social
Inequality and Decision Making. Wildlife Ecology and Behaviour Series Vol. 1.
London: Chapman & Hall.
22. Melletti M, Penteriani V, Mirabile M, Boitani L (2007) Some behavioral
aspects of forest buffalo (Syncerus caffer nanus): from herd to individual. J Mammal
88: 1312–1318.
23. Bekhuis PDBM, de Jong CB, Prins HHT (2008) Diet selection and density
estimates of forest buffalo in Campo-Ma’an National Park, Cameroon.
Afr J Ecol 46: 668–675.
24. Corson PJ (2002) Le buffle d’Afrique: biologie, chasse et mythologie. France:
Du Gerfaut. 263 p.
25. Wilson DE, Reeder DAM (2005) Mammal species of the world: a taxonomic
and geographic reference. Baltimore: Johns Hopkins University Press. 2142 p.
26. Kingdon J (1997) The Kingdon Field Guide to African Mammals. London and
New York: Academic Press, Natural World. 450 p.
27. East R (1998) African antelope database. Gland: IUCN/SSC Antelope
Specialist Group.
28. Fritz H (1997) Low ungulate biomass in West African savannas: primary
production or missing megaherbivores or large predator species? Ecography
20: 417–421.
29. Stark MA (1986) Daily movement, grazing activity and diet of savanna buffalo,
Syncerus caffer brachyceros, in Benoue National Park, Cameroon. Afr J Ecol 24:
255–262.
30. Cribiu EP, Popescu CP (1980) Chromosome constitution of a hybrid between
East African buffalo (Syncerus caffer caffer) and dwarf forest buffalo (Syncerus caffer
nanus). Ann Genet Sel Anim 12: 291–293.
31. Wurster DH, Benirsch K (1968) Chromosome studies in superfamily bovidea.
Chromosoma 25: 152.
32. Hsu TC, Benirschke K (1970) An Atlas of Mammalian Chromosomes. Vol. 4,
Folio 192. New York: Springer-Verlag.
33. Templeton AR, Georgiadis NJ (1996) A landscape approach to conservation
genetics: conserving evolutionary processes in the African bovidae. In: Avise
JC, Hamrick JL, editors. Conservation Genetics: Case Histories from Nature.
New York: Chapman & Hall.
34. O’Ryan C, Harley EH, Bruford MW, Beaumont M, Wayne RK, et al. (1998)
Microsatellite analysis of genetic diversity in fragmented South African buffalo
populations. Animal Conserv 1: 85–94.
35. Simonsen BT, Siegismund HR, Arctander P (1998) Population structure of
African buffalo inferred from mtDNA sequences and microsatellite loci: high
variation but low differentiation. Mol Ecol 7: 225–237.
36. Van Hooft WF, Groen AF, Prins HHT (2000) Microsatellite analysis of genetic
diversity in African buffalo (Syncerus caffer) populations throughout Africa. Mol
Ecol 9: 2017–2025.
37. Van Hooft WF, Groen AF, Prins HT (2002) Phylogeography of the African
buffalo based on mitochondrial and Y-chromosomal loci: Pleistocene origin
and population expansion of the Cape buffalo subspecies. Mol Ecol 11: 267–
279.
38. Van Hooft WF, Groen AF, Prins HHT (2003) Genetic structure of African
buffalo herds based on variation at the mitochondrial D-loop and autosomal
microsatellite loci: evidence for male-biased gene flow. Conserv Genet 4: 467–
477.
39. Van Hooft P, Greyling BJ, Prins HHT, Getz WM, Jolles AE, et al. (2007)
Selection at the Y chromosome of the African buffalo driven by rainfall. PLoS
ONE 10.
40. Van Hooft WF, Prins HHT, Getz WM, Jolles AE, Van Wieren SE, et al. (2010)
Rainfall-driven sex-ratio genes in African buffalo suggested by correlations
between Y-chromosomal haplotype frequencies and foetal sex ratio. BMC Evol
Biol 10.
41. Greyling BJ, Kryger P, du Plessis S, Van Hooft WF, Van Helden P, et al. (2008)
Development of a high-throughput microsatellite typing approach for forensic
and population genetic analysis of wild and domestic African Bovini.
Afr J Biotechnol 7; 655–660.
42. Wenink PW, Groen AF, Roelke-Parker ME, Prins HHT (1998) African buffalomaintain high genetic diversity in the major histocompatibility complex in spite
of historically known population bottlenecks. Mol Ecol 7: 1315–1322.
43. Heller R, Lorenzen ED, Okello JBA, Masembe C, Siegismund HR (2008) Mid-
Holocene decline in African buffalos inferred from Bayesian coalescent-basedanalyses of microsatellites and mitochondrial DNA. Mol Ecol 17: 4845–4858.
44. Heller R, Okello JBA, Siegismund HR (2010) Can small wildlife conservanciesmaintain genetically stable populations of large mammals? Evidence for
increased genetic drift in geographically restricted populations of Cape buffaloin East Africa. Mol Ecol 19: 1324–1334.
45. Aquadro CF, Greenberg BD (1983) Human mitochondrial DNA variation andevolution: analysis of nucleotide sequences for seven individuals. Genetics 103:
287–312.
46. Groves CP, Grubb P (2011) Ungulate taxonomy. Baltimore: Johns Hopkins
University Press.
47. Grubb P (1972) Variation and incipient speciation in the African buffalo.Zeitschrift fur Saugetierkunde 37: 121–144.
48. Dettman JR, Sirjusingh C, Kohn LM, Anderson JB (2007) Incipient speciationby divergent adaptation and antagonistic epistasis in Yeast. Nature 447: 585–
588.
49. Villagomez DAF, Pinton A (2008) Chromosomal abnormalities, meiotic
behavior and fertility in domestic animals. Cytogenet Genome Res 120: 69–80.
50. Fang M, Berg F, Ducos A, Andersson L (2006) Mitochondrial haplotypes of
European wild boars with 2n = 36 are closely related to those of Europeandomestic pigs with 2n = 38. Anim Genet 37: 459–464.
51. Lorenzen ED, Heller R, Siegismund HR (2012) Comparative phylogeographyof African savannah ungulates. Molecular Ecology 21: 3656–3670.
52. Kingdon J (1982) East African Mammals, an Atlas of Evolution in Africa. Vol.
III, Part C (Bovids). London: Academic Press.
53. Sinclair ARE (1977) The African buffalo: a study of resource limitation of
populations. Chicago: University of Chicago Press.
54. Nyakaana S, Arctander P (1999) Population genetic structure of the African
elephant in Uganda based on variation at mitochondrial and nuclear loci:evidence for male-biased gene flow. Mol Ecol 8: 1105–1115.
55. Simonsen BT (1997) Population Structure and History of African Bovids. PhDThesis. Department of Population Biology, Zoological Institute, University of
Copenhagen.
56. Arctander P, Kat PW, Aman RA, Siegismund H (1996) Extreme genetic
variations between populations of Grants gazelle (Gazella granti) in Kenya.Heredity 76: 465–475.
57. Arctander P, Kat PW, Simonsen BT, Siegismund HR (1996) Population
genetics of Kenyan impalas – consequences for conservation. In: Wayne RK,
Smith TB, editors. Molecular Genetics in Conservation. Oxford: OxfordUniversity Press.
58. Korte LM (2008) Habitat selection at two spatial scales and diurnal activitypatterns of adult female forest buffalo. J Mammal 89: 115–125.
59. Korte LM (2008) Variation of group size among African buffalo herds in a
forest-savanna mosaic landscape. J Zool 275: 229–236.
60. Gentry AW (1978) Bovidae. In: Maglioi VJ, Cooke HBS, editors. Evolution of
African Mammals. Cambridge: Harvard University Press. 540–572.
61. Finlay EK, Gaillard C, Vahidi SMF, Mirhoseini SZ, Jianlin H, et al. (2007)
Bayesian inference of population expansions in domestic bovines. Biol Lett 3:449–452.
62. Heller R, Bruniche-Olsen A, Siegismund HR (2012) Cape buffalo mitoge-nomics reveals a Holocene shift in the African human-megafauna dynamics.
Mol Ecol 21: 3947–3959.
63. Cohen AS, Stone JR, Beuning KRM, Park LE, Reinthal PN, et al. (2007)
Ecological consequences of early Late Pleistocene megadroughts in tropicalAfrica. PNAS 1–6. doi:10.1073/pnas.0703873104.
64. Vrba ES (1992) Mammals as a key to evolutionary theory. J Mammal 73: 1–28.
65. Endler JA (1977) Geographic Variation, Speciation, and Clines. Princeton,New Jersey: Princeton University Press.
66. Klein RG (1988) The archaeological significance of animal bones fromAcheulean sites in Southern Africa. Afr Archaeol Rev 6: 3–25.
67. Klein RG (1995) Mammalian extinctions and Stone Age people in Africa. In:Martin PS, Klein RG, editors. Quaternary Extinctions: a Prehistoric
Revolution. Tucson, London: The University of Arizona Press. 553–573.
68. Porat N, Chazan M, Grun R, Aubert M, Eisenmann V, et al. (2010) New
radiometric ages for the Fauresmith industry from Kathu Pan, Southern Africa:implications for the Earlier to Middle Stone Age transition. J Archaeol Sci 37:
269–283. doi: 10.1016/j.jas.2009.09.038.
69. deMenocal PB (2004) African climate change and faunal evolution during the
Pliocene-Pleistocene. Earth Planet Sc Lett 220: 3–24.
70. Dupont LM, Agwu COC (1992) Latitudinal shifts of forest and savanna in NWAfrica during the Brunhes chron: further marine palynological results from site
M 16145 (9oN, 19oW). Veg Hist Archaeobot 1: 163–175.
71. Dupont LM, Jahns S, Marret F, Ning S (2000) Vegetation change in equatorial
West Africa: time-slices for the last 150 ka. Palaeogeogr Palaeocl 155: 95–122.
72. Groves CP (1992) How old are subspecies? A tiger’s eye view of human
evolution. Perspect Hum Biol 2: 153–160.
73. Moritz C (1994) Defining ‘evolutionary significant units’ for conservation.
Trends Ecol Evol 9: 373–375.
74. Nowak RM (1991) Walker’s Mammals of the World (Fifth Edition). Baltimore:
The Johns Hopkins University Press.
Phylogeographic study of the African Buffalo
PLOS ONE | www.plosone.org 16 February 2013 | Volume 8 | Issue 2 | e56235

75. Alden PC, Estes RD, Schlitter D, McBride B (1995) National Audubon Society
Field Guide to African Wildlife. New York: Chanticleer Press.
76. Buchholtz C (1990) Cattle. In: Parker, SP, editor. Grzimek’s Encyclopedia of
Mammals. New York: McGraw-Hill. 5: 360–417.
77. Brown DM, Brenneman RA, Koepfli KP, Pollinger JP, Mila B, et al. (2007)
Extensive population genetic structure in the giraffe. BMC Biol 5: 13.
78. Eriksson J, Hohmann G, Boesch C, Vigilant L (2004) Rivers influence the
population genetic structure of bonobos (Pan paniscus). Mol Ecol 13: 3425–3435.
79. Okello JBA, Nyakaana S, Masembe C, Siegismund HR, Arctander P (2005)
Mitochondrial DNA variation of the common hippopotamus: evidence for a
recent population expansion. Heredity 95: 206–215.
80. Kraus RH, van Hooft P, Waldenstrom J, Latorre-Margalef N, Ydenberg RC,
et al. (2009) Avian influenza surveillance: on the usability of FTAH cards to
solve biosafety and transport issues. Wildfowl Special Issue 2: 215–223.
81. Kraus RH, van Hooft P, Waldenstrom J, Latorre-Margalef N, Ydenberg RC,
et al. (2011) Avian influenza surveillance with FTAH cards: field methods,
biosafety and transport issues solved. J Vis Exp 54: 21847074.
82. Douzery E, Randi E (1997) The mitochondrial control region of Cervidae:
Evolutionary patterns and phylogenetic content. Mol Biol Evol 14(11): 1154–
1166.
83. Thompson JD, Gibson TJ, Plewniak F, Jeanmougin F, Higgins D (1997) The
CLUSTAL_X windows interface: flexible strategies for multiple sequence
alignment aided by quality tools. Nucl Acids Res 25: 4876–4882.
84. Hall TA (1999) BioEdit: a user-friendly biological sequence alignment editor
and analysis program for Windows 95/98/NT. Nucl Acid S 41: 95–98.
85. Technelysium website. Chromas available: http://www.Technelysium.com.
au/chromas.html. Accessed 2013 Jan 21.
86. Sbisa E, Tanzariello F, Reyes A, Pesole G, Saccone C (1997) Mammalian
mitochondrial D-loop region structural analysis: identification of new
conserved sequences and their functional and evolutionary implications. Gene
205: 125–140. DOI:10.1016/S0378-1119(97)00404-6.
87. Joly S, Stevens MI, Jansen van Vuuren B (2007) Haplotype networks can be
misleading in the presence of missing data. Syst Biol 56: 857–862.
88. Schneider S, Roessli D, Excoffier L (2000) ARLEQUIN: a software for
population genetics data analysis, Version 2.000. Geneva: Genetics andBiometry Laboratory.
89. Crandall KA, Templeton AR (1993) Empirical tests of some predictions from
coalescent theory with applications to intraspecific phylogeny reconstruction.Genetics 134: 959–969.
90. Excoffier L, Laval G, Schneider S (2005) Arlequin (version 3.0): an integratedsoftware package for population genetics data analysis. Evol Bioinform 1: 47–
50.
91. Nei M (1987) Molecular Evolutionary Genetics. New York: ColumbiaUniversity Press.
92. Librado P, Rozas J (2009) DnaSP v5: a software for comprehensive analysis ofDNA polymorphism data. Bioinformatics 25: 1451–1452.
93. Rogers AR, Harpending H (1992) Population growth makes waves in thedistribution of pairwise genetic differences. Mol Biol Evol 9: 552–569.
94. Rogers AR (1995) Genetic evidence for a Pleistocene population explosion.
Evolution 49: 608–615.95. Shapiro B, Drummond AJ, Rambaut A, Wilson MC, Matheus P, et al. (2004)
Rise and fall of the Beringian steppe bison. Science 306: 1561–1565.96. Fu XY (1997) Statistical tests of neutrality of mutations against population
growth, hitchhiking and background selection. Genetics 147: 915–925.
97. Drummond AJ, Rambaut A (2007) Beast: Bayesian evolutionary analysis bysampling trees. BMC Evol Biol 7: 214. doi: 10.1186/1471-2148-7-214.
98. Lemey P, Rambaut A, Drummond AJ, Suchard MA (2009) Bayesianphylogeography finds its roots. PloS Comput Biol 5: e1000520.
99. Akaike H (1974) A new look at the statistical model identification.IEEE T Automat Contr 19: 716–723.
100. Hasewaga M, Kishino H, Yano T (1985) Dating of the human-ape splitting by
a molecular clock of mitochondrial DNA. J Mol Evol 22: 160–174.101. Hey J (2005) On the number of New World founders: a population genetic
portrait of the peopling of the Americas. PloS Biol 3: 965–975.102. Hey J, Nielsen R (2004) Multilocus methods for estimating population sizes,
migration rates and divergence time, with applications to the divergence of
Drosophila pseudoobscura and D-persimilis. Genetics 167: 747–760.
Phylogeographic study of the African Buffalo
PLOS ONE | www.plosone.org 17 February 2013 | Volume 8 | Issue 2 | e56235


