
Oxidative Stress and Proinflammatory CytokinesContribute to Demyelination and Axonal Damage in aCerebellar Culture Model of NeuroinflammationAlessandra di Penta1,2, Beatriz Moreno1, Stephanie Reix3, Begona Fernandez-Diez1, Maite Villanueva1,
Oihana Errea1, Nagore Escala1, Koen Vandenbroeck2,4, Joan X. Comella3, Pablo Villoslada1*
1 Center of Neuroimmunology, Institute of Biomedical Research August Pi Sunyer (IDIBAPS) – Hospital Clinic of Barcelona, Barcelona Spain, 2 Neurogenomiks, University
of the Basque Country (UPV/EHU), Leioa, Spain, 3 Vall d’Hebron Institut de Recerca (VHIR), Universitat Autonoma de Barcelona and CIBERNED, Barcelona, Spain,
4 IKERBASQUE, Basque Foundation for Science, Bilbao, Spain
Abstract
Background: Demyelination and axonal damage are critical processes in the pathogenesis of multiple sclerosis (MS).Oxidative stress and pro-inflammatory cytokines elicited by inflammation mediates tissue damage.
Methods/Principal Findings: To monitor the demyelination and axonal injury associated with microglia activation weemployed a model using cerebellar organotypic cultures stimulated with lipopolysaccharide (LPS). Microglia activated byLPS released pro-inflammatory cytokines (IL-1b, IL-6 and TNFa), and increased the expression of inducible nitric oxidesynthase (iNOS) and production of reactive oxygen species (ROS). This activation was associated with demyelination andaxonal damage in cerebellar cultures. Axonal damage, as revealed by the presence of non-phosphorylated neurofilaments,mitochondrial accumulation in axonal spheroids, and axonal transection, was associated with stronger iNOS expression andconcomitant increases in ROS. Moreover, we analyzed the contribution of pro-inflammatory cytokines and oxidative stress indemyelination and axonal degeneration using the iNOS inhibitor ethyl pyruvate, a free-scavenger and xanthine oxidaseinhibitor allopurinol, as well as via blockage of pro-inflammatory cytokines using a Fc-TNFR1 construct. We found thatblocking microglia activation with ethyl pyruvate or allopurinol significantly decreased axonal damage, and to a lesserextent, demyelination. Blocking TNFa significantly decreased demyelination but did not prevented axonal damage.Moreover, the most common therapy for MS, interferon-beta, was used as an example of an immunomodulator compoundthat can be tested in this model. In vitro, interferon-beta treatment decreased oxidative stress (iNOS and ROS levels) and therelease of pro-inflammatory cytokines after LPS stimulation, reducing axonal damage.
Conclusion: The model of neuroinflammation using cerebellar culture stimulated with endotoxin mimicked myelin andaxonal damage mediated by the combination of oxidative stress and pro-inflammatory cytokines. This model may bothfacilitate understanding of the events involved in neuroinflammation and aid in the development of neuroprotectivetherapies for the treatment of MS and other neurodegenerative diseases.
Citation: di Penta A, Moreno B, Reix S, Fernandez-Diez B, Villanueva M, et al. (2013) Oxidative Stress and Proinflammatory Cytokines Contribute to Demyelinationand Axonal Damage in a Cerebellar Culture Model of Neuroinflammation. PLoS ONE 8(2): e54722. doi:10.1371/journal.pone.0054722
Editor: Martin Stangel, Hannover Medical School, Germany
Received August 3, 2012; Accepted December 14, 2012; Published February 19, 2013
Copyright: � 2013 di Penta et al. This is an open-access article distributed under the terms of the Creative Commons Attribution License, which permitsunrestricted use, distribution, and reproduction in any medium, provided the original author and source are credited.
Funding: This study was supported by the Instituto de Salud Carlos III: FIS PI041445 (MIOTRED) to PV; RETICS program: Red Espanola de Esclerosis Multiple to PV(RD07/0060/001) and KV (RD07/0060/2005); SAIOTEK 2009 program of the Gobierno Vasco, ref. S-PE09UN33 (‘‘ERtek’’) to KV and the Juan de la Cierva program ofthe Ministerio de Ciencia y Innovacion (MICINN) to AdP. The funders had no role in study design, data collection and analysis, decision to publish, or preparationof the manuscript.
Competing Interests: PV serves as Academic Editor in PLOS ONE. PV is founder and hold stocks in Bionure Farma SL. PV has received consultancy fees fromNovartis, Roche, MedImmune, Heidelberg Engineering, Digna Biotech, Neurotec, and Bionure Farma. This does not alter the authors’ adherence to all the PLOSONE policies on sharing data and materials.
* E-mail: [email protected]
Introduction
Axonal damage is a critical process in the pathogenesis of
several chronic brain diseases, including neurodegenerative
diseases, (Alzheimers disease, Parkinsons diseases, and amyotro-
phic lateral sclerosis) inflammatory diseases (multiple sclerosis), or
acute diseases such as stroke and brain trauma [1,2,3]. Axonal
damage is a complex process that involves alterations in multiple
pathways, mitochondrial dysfunction, oxidative stress, ischemia,
ATP depletion, ion channel redistribution, axonal transport
impairment and reduction in trophic support [4]. These processes
converge to induce Wallerian degeneration and dying-back, or
axonal degeneration. By identifying the pathways that contribute
to axonal damage, new avenues toward the development of
neuroprotective therapies to treat brain diseases could be opened
[2].
Oxidative stress is a deleterious condition that can cause cell
damage, and subsequent cell death, due to oxidation of cardinal
cellular components, such as lipids, proteins, and DNA [5].
Reactive oxygen species (ROS) are generated via several reactions,
including the incomplete reduction of bimolecular oxygen (O2),
PLOS ONE | www.plosone.org 1 February 2013 | Volume 8 | Issue 2 | e54722

resulting in the generation of superoxide (O2N), hydroxyl radicals
(NOH) and hydroxyperoxide (H2O2). The most common cellular
free radicals are the hydroxyl radical (OH?), the superoxide radical
(O2–?), and nitric monoxide (NO?). Other molecules that are not
free radicals but that can lead to the generation of free radicals
through various chemical reactions include hydrogen peroxide
(H2O2) and peroxynitrite (ONOO–). These ROS can be
counterbalanced by natural enzymatic antioxidants (e.g., superox-
ide dismutase, catalase) and non-enzymatic antioxidants (e.g., uric
acid, ascorbic acid, glutathione), which are expressed under the
control of transcription factors, such as nuclear factor E2-related
factor 2 (Nrf2). The central nervous system (CNS) appears to be
especially vulnerable to oxidative stress due to its high rate of
oxygen consumption, the abundance of iron, the low levels of
molecular antioxidants, and the susceptibility of neurons or
oligodendrocytes due to their particular metabolic properties [6].
The study of the contribution of different pathways to CNS
damage and the effects of therapies in preventing such damage
requires the development of suitable models. Here we characterize
at the morphological level an in vitro model of brain inflammation
by challenging cerebellar cultures with endotoxin in order to
promote microglia activation. In this model, we assessed the role of
oxidative stress and pro-inflammatory cytokines in producing
axonal damage and demyelination as a response to microglial
activation. Studies were performed in mouse cerebellar organo-
typic cell cultures, which provide a well-preserved structure of
brain tissue including all implicated cell populations (microglia,
astrocytes, neurons, axons, myelin and oligodendrocytes). We
found that in response to inflammation due to microglia activation
in cerebellar organotypic cultures the axons and myelin were
damaged by the induction of oxidative stress and pro-inflamma-
tory cytokines.
Materials and Methods
Animals and cerebellar organotypic culturesAll animal experiments were performed using C57BL/6J mice
(Harlan Laboratories). Animals were handled in accordance with
the European Communities Council Directive (86/609/EEC
amended by Directive 2005/65/EC) and the Spanish regulations
for the procurement and care of experimental animals (1201 RD/
2005, October 10), and the study was approved by the Ethical
Committee on Animal Research of the University of Barcelona.
All possible efforts were made to minimize animal suffering and
limit the number of animals used. Cerebellar slice cultures were
based on previously published protocols [7,8] and were prepared
from 8-day-old C57BL/l6 mice. Cerebellum was cut using a
vibratome obtaining tissue slices (350 mm thick). Three slices were
plated on Millicell-CM culture inserts. Cultures were incubated at
37uC, 5% CO2 in 50% basal medium containing Earle’s salt, 25%
Hank’s buffered salt solution, 25% inactivated horse serum, 5 mg/
ml glucose, 0.25 mM L-glutamine and 25 mg/ml Penicillin/
Streptomycin. In all experiments, cerebellar slices were main-
tained in culture for 7 days for reducing microglia activation and
allowing cultures to myelinate before commencing the studies.
After 7 days in vitro (DIV), cultures were treated with different
concentrations of LPS (5, 10, 15 and 20 mg/ml) for 1, 3, 6, 12, 24,
48, 72 and 96 h, and then fixed in 4% paraformaldehyde (PFA) for
immunofluorescence analysis, or homogenized to obtain protein
extracts. Untreated control tissue (both for microscopy imaging
and for molecular analysis) was incubated for identical periods of
time as treated cultures.
BV-2 cultureBV-2 cells were generously provided by Prof Antonio Celada
(IRB, Barcelona, Spain) [9] and were maintained in DMEM
containing 5% heat inactivated FBS, 4mM L-Glutamine (SAFC
biosciences), 20 mM Hepes (Sigma) and appropriate antibiotics at
37uC in a humidified chamber with 5% C02. Before treatment
cells were washed twice with DMEM, then incubated 6, 12 or
24 h in 10 ml of serum-free medium containing 100 ng/ml LPS
(Sigma L4391) and different concentrations of Allopurinol (100
mM or 1 mM).
Immunofluorescence microscopyCerebellar slices were fixed with 4% paraformaldehyde (PFA)
for 40 min, washed with PBS for 10 min, and blocked at RT for
2 h in 10% normal goat serum (NGS: Vector Laboratories,
Burlingame, USA) and 0.5% Triton X-100 in PBS. The slices
were incubated overnight at 4uC with the distinct primary
antibodies (Table 1) in blocking solution (10% NGS and 0.3%
Table 1. List of primary antibodies used for immunofluorescence studies.
Antigen Description Dilution Company
MHCII Major Histocompatibility Complex class II: rat anti-mouse MHC class II (I-A)monoclonal antibody
1:300 Chemicon
CD11b/OX42 mouse anti-rat CD11b 1:150 Serotec
NfL Neurofilament light C28E10, rabbit mAb 1:500 Cell Signaling
NfH Neurofilament heavy (phosphorylated and non-phosphorylated NfH):rabbit polyclonal antiserum against the 200 kD Neurofilament Heavy. Ref. Ab81351
1:200 AbCam
SMI32 non-phosphorylated neurofilament heavy SMI32 1:200 Stenberg
MBP Myelin Basic Protein: rat anti-MBP (82-87) antibody 1:200 Serotec
NeuN Neuronal Nuclei: anti-NeuN mouse mAb 1:500 Chemicon
iNOS Inducible nitric oxide synthase: purified rabbit anti-iNOS/NOS type II 1:200 BD Bioscience
COXI Mitochondrial Complex IV subunit I monoclonal antibody COXI 1:200 MitoScience
Casp3 Caspase 3: anti-Casp3 rabbit 1:300 Cell Signaling
Iba1 Ionized calcium binding adaptor molecule 1: anti-Iba 1, rabbit 1:400 Wako
Nrf2 Nrf2 (C-20) 1:75 Santa Cruz
doi:10.1371/journal.pone.0054722.t001
Cerebellar Culture Model of Neuroinflammation
PLOS ONE | www.plosone.org 2 February 2013 | Volume 8 | Issue 2 | e54722

Triton X-100 in PBS). After further washing, the slices were
incubated in blocking solution containing the secondary antibody
mixture prior to three washes with PBS. The secondary antibodies
used were mouse IgG Cy2-linked, rabbit IgG Cy3-linked (from
goat, 1:200, GE Healthcare, Freiburg, Germany) and goat anti-rat
IgG Alexa Fluor 488 (1:200, Molecular Probes, Eugene, OR).
Propidium iodide (Fluka) was used at 5 mg/ml for 2 h at 37uC and
5% CO2. The slices were mounted in Gel/Mount anti-fading
mounting medium (Biomeda, Foster City, CA) and pictures were
made by confocal scanning microscopy from single images all
through the whole tissue (but avoiding the surface of the culture in
contact with air) (Zeiss LSM 510). Demyelination and axonal loss
were quantified as described elsewhere [10,11]. Briefly, demye-
lination was quantified as the percentage of axons stained with
NfL with MBP surrounding sheaths respect to the total number of
axons (without MBP sheaths). Axonal loss was quantified as the
percentage of axons stained with non-phosphorylated neurofila-
ments (SMI32) respect to the total number of axons (NfH:
phosphorylated and non-phosporylated neurofilaments).
Electron microscopyThe cerebellar slices were fixed for 24 h in 2% PFA and 2.5%
glutaraldehyde in PBS 0.1 M at 4uC. Then, they were washed in
PBS 0.1 M for 12 h before post-fixation treatment with 2%
osmium tetroxide in PBS 0.1 M for 1 h at 4uC, followed by
posterior dehydration and inclusion in Epoxy embedding medium
(EPON). Ultra-thin sections were stained with 1% uranylacetate
and lead citrate solution. Samples were observed with a Tecnai
SPIRIT Transmision Electron Microscope (FEI Company,
Eindhoven, The Netherlands) working at an acceleration voltage
of 120 KV. Images were acquired with a Megaview III camera
and digitized with the program iTEM (Soft Imaging System).
TUNEL assayTissues sections, fixed with 4% PFA, were permeabilized with
1.5% Triton X-100 (in PBS) overnight at 4uC. Then the solution
was removed to add sodium citrate solution (0.1% in H2O) 1 h at
RT. The detection of cells with DNA-strand breaks was performed
by the TUNEL labelling method using terminal transferase
recombinant and the Fluorescein 212-dUTP (ROCHE) for 2h
at 37uC. The reaction was stopped with 20 mM EGTA and the
sections were washed 2 times with PBS. The labeled slides were
analyzed by confocal microscopy (Olympus FV1000). In addition,
for cell death quantification, nuclei were stained with 0.5 mg/mL
of Hoechst 33342. Hoechst stained nuclei were scored as number
of total cells and TUNEL positives cells were scored as dead.
Active caspase-3 immunofluorescenceCultures were rinsed with PBS at RT and fixed in 4% PFA for
30 min. They were then washed twice with PBS and permeabi-
lized and blocked with 3% FBS and 0.1% Triton X-100 in PBS for
60 min. Cultures were incubated overnight at 4uC with rabbit
polyclonal anti-cleaved caspase-3 (Cell Signaling) diluted 1:150,
rinsed three times with PBS, and incubated with Alexa Fluor 594-
conjugated anti-rabbit secondary antibodies (Molecular Probes,
Eugene, OR) diluted 1:250 for 1 h at RT and protected from light.
Finally, cells were stained with 0.05 mg/ml Hoechst 33258 for
30 min. For double staining Casp3/MBP the cultures were
permeabilized as describe above and incubated overnight at 4uCwith polyclonal anti-cleaved caspase-3 and rat anti-MBP (1:200).
Alexa Fluor 546-conjugated anti-rabbit and 488-conjugated anti-
rat secondary antibodies were used.
ELISAMouse cerebellar organotypic cultures were stimulated with
LPS for different periods of time (0, 3, 6, 12, 24, 48, 72 and
96 hrs), or with LPS plus IFN-b (1000U/ml: Calbiochem) or
Allopurinol (100 mM or 1 mM) and the culture supernatants were
collected to quantify the secreted IL-1b, TNF-a and IL-6. Mouse
ELISA Kits were used according to the manufacturer’s instruc-
tions (eBioscience, San Diego, CA, USA).
Western BlotsThree cerebellar slices per group were used for analysis.
Western-blots were performed as previously described [12].
Briefly, total protein (10 mg) from cerebellar slices was separated
by SDS-polyacrylamide gel electrophoresis, transferred onto a
nitrocellulose membrane and hybridized for 2 h or overnight with
primary antibodies diluted in the same blocking buffer: mouse
anti-CNPase (29,39-cyclic-nucleotide 39-phosphodiesterase) 1:500
(Abcam), rabbit anti-iNOS (inducible Nitric Oxide Synthase)
1:200 (BD Bioscience). Protein load was assessed and normalized
using Ponceau S staining. Antibody binding was detected with
HRP-conjugated anti-mouse or anti-rabbit secondary antibodies
(Cell Signaling) used at a concentration of 1:2,000.
ROS AssaysROS were assayed with H2DCFDA (50 mM, Invitrogen) added
to the cerebellar organotypic cultures for 1 hour at 37uC.
Unincorporated H2DCFDA was removed by washing the slices
twice with PBS and the fluorescence was measured on a
spectrofluorometer after excitation at 485 nm and emission at
535 nm.
Blocking TNF-a using the recombinant Fc-TNFR1construct
Fc-TNFR1 was produced as described previously [13]. After
7 days in culture the Fc-TNFR1 construct (Fc-TNFR1: 1/50
dilution) was added 2 h before challenging the cultures with
human TNF-a at 20 and 40 ng/ml. Samples were collected 24
and 48 h after LPS stimulation, fixed in 4% PFA for 45 minutes
and stored at 4uC in PBS-azide until immunostaining was
performed.
MTT assayThe MTT assay was performed 24 and 48 h after the TNFa
challenge to assess cell survival in the organotypic tissue after
exposure to Fc-TNFR1 and prior to the TNF-a challenge. The
results provided us with the optimal concentration of Fc-TNFR1
required to block endogenous TNF-a. MTT (50 ml, final
concentration 0.5 mg/ml) was added to each well and the tissue
was incubated for 3 h at 37uC. The tissue was recovered in 0.1 M
HCl 2-propanol, incubated again for 25 minutes at room
temperature and centrifuged at maximum speed for 3 min. The
supernantants were analyzed by spectrophotometer at 570 nm.
Quantitative PCR (qPCR)Three cerebellar slices per group were used for analysis. RNA
was extracted following the manufacturer’s instructions (Ma-
cherey-Nagel) and quantified with Nanodrop. RNA (100 ng) was
reverse-transcribed to cDNA using random primers according to
the manufacturer’s instructions (Applied Biosystems). Subsequent-
ly, qPCR was performed with the Supermix for SsoFast EvaGreen
(Biorad) on a 7500 Fast Real-Time PCR System (Applied
Biosystems) and the qPCR QuantiTect Primer Assay were
performed for each of the target genes (Qiagen). The expression
Cerebellar Culture Model of Neuroinflammation
PLOS ONE | www.plosone.org 3 February 2013 | Volume 8 | Issue 2 | e54722

of the transcripts of interest was normalized to that of endogenous
HPRT1, and the data expressed relative to the mean expression in
the untreated control group.
Statistical analysisAll experiments were performed at least three times, and control
cultures were time-matched with testing cultures. The values were
expressed as the means 6 SEM. The Student’s t-tests (in Fig. 1, 2,
3 and Supp. Fig. S1 and S3) or ANOVA (in Fig. 4, 5, 6 and 7)
were used to determine statistical significance and all analyses were
performed using SPSS 15.0 software (IBM).
Results
LPS induces microglia activation in mice cerebellarorganotypic cultures
In order to reproduce microglia activation as one of the
mechanisms present in neuroinflammation, cerebellar organotypic
cultures were challenged with LPS. First, we determined the
concentration and timing of LPS needed to induce microglia
activation by treating the cultures for 24 h with different
concentration of LPS (5, 10, 15 and 20 mg/ml), and analyzing
the kinetics of IL-1b, TNF-a and IL-6 release over 96 h by ELISA
(Supp. Fig. S1). When cultures were challenged with doses up to
15 mg/ml, LPS induced a dose-dependent production of pro-
inflammatory cytokines, such as IL-1b (Supp. Fig. S1A). Peak
levels of secreted TNF-a, IL-6 and IL-1b were observed 3, 12 and
24 h after LPS challenge, respectively. While the release of IL-1bwas transient, constant high levels of TNF-a and IL-6 were
secreted from 3 h up to the last measurement at 96 h (approx-
imately 500 pg/ml and 1800 pg/ml, respectively) (Supp.
Fig. S1B). To assess microglia activation, organotypic cultures
were stained with markers of activated microglia such as MHCII
and OX42 [14]. We observed the presence of amoeboid shaped
microglial cells, with enhanced MHC-II and OX42 expression
24 h after LPS challenge (Supp. Fig. S1C), both features indicative
of microglial activation. We did not observe MHC-II and OX42
Figure 1. Microglial activation induces demyelination in mouse cerebellar cultures. A) Cerebellar cultures were stimulated with LPS(15 mg/ml) for different periods of time (0 to 96 h) and CNPase expression was assessed by Western-blot. Protein expression was quantified andnormalized to the total protein loaded, and the results are expressed as a percentage with respect to the controls (100%). Error bars indicate thestandard error. **P,0.01. B) Immunofluorescence for NfH (red) and MBP (green) in cerebellar cultures treated with LPS (15 mg/ml: panels d-f and k-m)or control slices (Ctrl, panels a-c and g-i). Panels g-m show a higher magnification (660) of images in a-f (white boxes in panels a-f). Scale bars= 100 mm (panels a-f) and 5 mm (panels g-m). The graph represent the percentage of myelinated axons (double staining for MBP and NfH) comparedto unmyelinated axons (NfH). C) Cultures were treated with LPS for 24h and then demyelination was analyzed by electron microscopy. D) Cerebellarcultures were treated with LPS (15 mg/ml) for 24 h and then immunostained for MBP/Casp3 or NeuN/Casp3 colabeling. Scale bar = 10 mm. Thegraphs represent the percentage of cell death by quantifying the co-localization of active Casp3 immunofluorescence in conjunction with MBP orNeuN staining. Student’s t-test was used to determine statistical significance.doi:10.1371/journal.pone.0054722.g001
Cerebellar Culture Model of Neuroinflammation
PLOS ONE | www.plosone.org 4 February 2013 | Volume 8 | Issue 2 | e54722

positive cells in the control cultures at the same time point (data
not shown).
Activation of microglia by LPS induces demyelinationand oligodendrocyte death
To determine whether neuroinflammation induces demyelin-
ation in the cerebellar organotypic model, we analyzed CNPase
protein expression in Western-blot. Cultures were grown for 7
DIV to allow significant myelination and then exposed to LPS
(15 mg/ml) for 1, 3, 6, 12, 24, 48, 72 and 96 h, which produced a
40% loss of CNPase protein after 96 h, which had fallen
significantly by 24 h (Fig. 1A). Slices were also counterstained
with NfL and MBP antibodies (Fig. 1B) for different times after
LPS treatment. We observed significant demyelination at 24 h,
revealed as a decrease in the intensity of myelin immunoreactivity
at different magnifications that was maintained until 96 h (Fig. 1B
and Supp. Fig. S2). The 24 h time point was therefore used as
reference in all subsequent demyelination experiments. Confocal
analysis revealed only a few myelinated axons (Fig. 1B, panel m) in
LPS-challenged cultures when compared to time-matched con-
trols. In cultures treated with LPS, the myelin staining appeared
punctuate and sharp, a hallmark of myelin damage. CNPase
staining revealed a similar profile of demyelination as MBP
staining (data not shown). In response to LPS treatment there was
an approximately 2-fold decrease in MBP staining compared to
time-matched control tissue (Fig. 1B, graph). Demyelination after
LPS challenge was confirmed by electron microscopy (Fig. 1C).
To determine whether LPS stimulation induced the cell death,
cultures were exposed to LPS (15 mg/ml) for 24 h, and stained for
activated (cleaved) caspase 3 (Fig. 1D and Supp. Fig. S3B). LPS
treatment enhanced glia cell death that was mainly involving
oligodendrocytes, revealed by an increased number of MBP/
Casp3-positive cells (Fig. 1D). Evidence of oligodendrocytes cell
death was also obtained when the cultures were labeled with
propidium iodide (PI) for the last 2 h, revealing an increased
number of MBP/PI-positive cells (Supp Fig. S3A), although some
other glial cell types cannot be excluded. In contrast, only a few
neurons died in the grey matter, as revealed by NeuN/Casp3,
NeuN/PI and Hoechst/Casp3 co-labeling (Fig. 1D and Supp.
Fig. S3A and B). These findings indicate that exposure to LPS
induced significant cell death in the white matter, and is consistent
with oligodendrocyte cell death seen in the LPS model of optic
nerve injury [15].
LPS induces oxidative stress and axonal damage inmouse cerebellar cultures
To analyze whether LPS induce oxidative stress in mice
organotypic cultures, we quantified iNOS expression and ROS
production at different times after LPS challenge (0 to 96 h, Fig. 2).
Western blot analysis showed that LPS increased levels of iNOS
protein peaking at 12 to 24 h after challenge and decreased
subsequently up to the study end-point (96 h, Fig. 2A). Further-
more, using fluorescent assay with H2DCFDA we observed a
100% and 40% increase in ROS production 12 h and 24 h after
the LPS challenge, respectively (Fig. 2B). To verify whether the
actual producer cells of iNOS were microglia or astrocytes, the
cultures were immunostained for iNOS and the microglial marker
Iba1 after LPS stimulation. As expected, in the slices treated with
LPS, iNOS was mainly expressed by microglia cells (Fig. 2C).
Presence of axonal damage was assessed by double immuno-
staining for both total (phosphorylated and non-phosphorylated)
NfH and non-phosphorylated NfH (SMI32; Fig. 3A). In response
to LPS treatment, non-phosphorylated NfH was found to
Figure 2. Microglial activation by LPS induces oxidative stressin cerebellar cultures. A) iNOS expression after LPS challenge:Western-blot analysis of iNOS expression in cerebellar cultures after LPSstimulation (15 mg/ml). Band intensity was calculated by densitometryand expressed as a percentage in the graph. The change in iNOSexpression was calculated with respect to control (untreated cultures)and normalized with respect to total protein. Error bars indicate thestandard error. ***P,0.001. B) ROS production after LPS challenge:cerebellar cultures were treated with LPS for different periods of timeand ROS generation was measured by spectrofluorometry. Values in thebar graph represent arbitrary units and the error bars indicate thestandard error. *P,0.05. Statistical analysis was performed usingStudent’s t-test.C) Expression of iNOS by activated microglia: Cerebellarcultures were treated with LPS for 24 h and immunostainined for Iba1(red, panels a and d) and iNOS (green, panels b and e) in organotypiccultures treated with LPS (15 mg/ml) for 24 h. Panels c and f shows themerged signals. Inset shows an enlarged image from panel f. Scale bar= 10 mm.doi:10.1371/journal.pone.0054722.g002
Cerebellar Culture Model of Neuroinflammation
PLOS ONE | www.plosone.org 5 February 2013 | Volume 8 | Issue 2 | e54722

accumulate in the neurofilaments (arrows in Fig. 3A panel h) with
a 4-fold increase at 24 h compared to total NfH, suggesting
presence of axonal dysfunction (Fig. 3A, panel b). Furthermore,
axonal dysfunction was visible in slices challenged with LPS by
means of immunostaining for NfL and MBP, showing the
formation of swollen structures (beading or spheroids; arrows in
Fig. 3B, panel c and Supp. Fig. S2) indicating impaired axonal
transport, as well as with axonal transection (end-bulbs; arrow-
heads in Fig. 3A, panel c and Supp. Fig. S2) [1]. Based on our
results showing maximum axonal damage by 24 h after LPS
challenge, this time point was used for assessing axonal damage.
Finally, we analyzed the changes in the distribution of axonal
mitochondria by staining the respiratory chain complex IV
subunit-I (COX-I) after stimulation with LPS (15 mg/ml) for
24 h (Fig. 3 C). We observed an accumulation of COX-I labeled
mitochondria in the spherical axon bulbs, indicative of altered
mitochondrial transport (Fig. 3C, arrows in panel f). No such
accumulation of mitochondria was observed in the time-matched
control cultures (Fig. 3C, panel c).
Contribution of oxidative stress to axonal and myelindamage
To assess the contribution of oxidative stress to axonal damage,
we compared the effect of LPS induced oxidative stress with that
induced by hydrogen peroxide (H2O2), a promoter of free radicals,
in the cerebellar culture model. ROS production induced by LPS
after 24 h was 3-fold higher than that in time-matched control
slices and 2-fold higher than that induced by a low dose of H2O2.
Indeed, LPS induced a 36% and 15% increase in iNOS protein
expression with respect to control slices and those treated with a
low dose of H2O2 (Fig. 4A). Furthermore, demyelination was
evident in both LPS and H2O2-treated samples, as detected in
CNPase Western-blots (Fig. 4A), and by immunofluorescence for
NfL and MBP (Fig. 4B). The extensive loss of myelin generated by
LPS treatment was associated with greater axonal swelling than in
control or H2O2–treated samples (Fig 4B panels f and i). Axonal
damage was greater 24 h after the LPS challenge when compared
with H2O2 treatment, as determined by specific staining for anti-
non-phosphorylated NfH (Fig. 4C).
The microglia activation inhibitors ethyl pyruvate andallopurinol decreased demyelination and axonal damage
To study the effect of microglia activation on axonal damage
and demyelination in this model, we tested the effect of the iNOS
inhibitor ethyl pyruvate (EP) [16,17]. EP is a stable form of
pyruvate, a metabolite with strong anti-oxidant and scavenger
activity, which inhibits expression of iNOS. EP inhibits JAK2
phosphorylation, which in turn inhibits the phosphorylation of
STAT1 and STAT3 in LPS-stimulated microglia and as a
consequence, suppresses the expression of the STAT-responsive
genes iNOS and cyclooxygenase-2. In addition, EP reduces LPS-
induced ROS production by inhibiting gp91phox transcription
Figure 3. Microglial activation induces axonal damage inmouse cerebellar cultures. A) Immunostaining (a) for totalneurofilament-heavy (NfH; red) and dephosphorylated NfH (SMI32;green). Panels a-c show control slices (Ctrl) while LPS treated slices areshown in panels d-i. Panels g-i show higher magnification images of d-f.Scale bar = 20 mm (panels a-f) and 10 mm (panels g-i). Graph (b):
percentage of non-phosphorylated neurofilament with respect to totalneurofilaments in cerebellar cultures stimulated for 24 h with LPS. Errorbars indicate the standard error. **P,0.01. Student’s t-test was used todetermine statistical significance.B) Immunostaining for NfL (red) andMBP (green) in the same conditions as in A. Arrows indicate axonalbeads and arrowheads indicate axonal transection (end-bulbs). Scalebar = 5 mm. C) Immunostaining for NfL (red) and Complex IV subunit-I(COX I, green): Neurofilament staining revealed the presence of axonalbeads. Arrows indicate mitochondrial accumulation in neurofilaments.Scale bar = 5 mm.doi:10.1371/journal.pone.0054722.g003
Cerebellar Culture Model of Neuroinflammation
PLOS ONE | www.plosone.org 6 February 2013 | Volume 8 | Issue 2 | e54722

and Rac1 activity, suppressing the Rac1-JAK-STAT signaling
cascade [16]. Figure 4A shows that in the presence of EP, ROS
production induced by LPS returned to levels similar to those of
untreated controls, which was associated with decreased iNOS
activation. Axonal damage, as determined by the increase in non-
phosphorylated NfH, was also reduced to control levels in the
presence of EP (Fig. 4C). Moreover, CNPase or MBP protein
levels were preserved by EP treatment (Fig. 4A and 4B). In
summary, EP decreased demyelination and axonal damage due to
the inhibition of microglia activation.
Second, we treated LPS challenged cultures with the xanthine
oxidase inhibitor and radical-free scavenger Allopurinol [18]. This
compound is a ROS scavenger that does not affect MAPK
activation in microglia [18]. We tested different concentration of
Allopurinol in the microglia cell line BV2 treated with LPS and
measured the release of pro-inflammatory cytokines and ROS
production. Allopurinol significantly decreased ROS levels with-
out significantly modifying IL-1b, IL-6 and TNF-a secretion (data
not shown). Cerebellar cultures were pretreated for 2 h with
allopurinol using two different concentrations (100 mM and
1 mM) and then stimulated with 15 mg/ml of LPS for 24 h. We
found a significant ROS decrease as quantified by H2DCFDA
assay in the cultures treated with allopurinol 1 mM after LPS
challenge compared with time-matched cultures stimulated with
LPS (Fig. 5A). Moreover, to verify that allopurinol does not
interfere with microglia activation we tested IL-1b, IL-6 and TNF-
a release by ELISA assay. Allopurinol was not able to block
cytokine release induced by LPS to a significant extent when we
Figure 4. Role of Ethyl pyruvate in preventing microglia activation in cerebellar cultures. A) Comparative effects of LPS, H2O2 and Ethylpyruvate (EP) in ROS production, iNOS expression and CNPs levels: Cerebellar cultures were left untreated (Ctrl) or treated with H2O2 (1 mM), LPS(15 mg/ml), LPS plus EP (10 mM), or H2O2 plus EP. ROS were measured by spectrofluorometry using H2DCFDA and expressed as arbitrary units. Totalprotein was extracted and analyzed in Western blots probed for iNOS and CNPase. The bands were quantified by densitometry, normalized to thetotal protein and expressed as a percentage with respect to the control. Error bars indicate the standard error. *P,0.05, **P,0.01 and ***P. B)Comparative effects of LPS, H2O2 and EP in demyelination and axonal damage in cerebellar cultures: Immunostaining for NfL (red, panels a, d, g, k andn) and MBP (green, panels b, e, h, l and o) in untreated organotypic cultures (control; panels a-c) or those treated for 24 h with H2O2 (panels d-f), LPS(panels g-i), LPS plus EP (panels k-m) or H2O2 plus EP (panels n-p). Co-localization is shown in the merged panels c, f, i, m and p. Insets show a highermagnification of the areas in panels f and i. Scale bar = 10 mm. The graphic below was shows the percentage of myelinated neurofilament. Asterisksindicate the standard error calculated respect to the control. **P,0.01 and ***P. C) Role of LPS, H2O2 and EP in presence of non-phosphorilatedneurofilaments (SMI32): SMI32 (green) staining in the same conditions as in B. Arrows indicates SMI32 accumulation in axons. Scale bar = 10 mm. Thegraph below shows the percentage of non-phosphorylated neurofilament with respect to total neurofilaments in cerebellar cultures stimulated for24 hrs with LPS. Asterisks indicate the standard error calculated respect to the control (statistical analysis was performed using ANOVA test) **P,0.01.doi:10.1371/journal.pone.0054722.g004
Cerebellar Culture Model of Neuroinflammation
PLOS ONE | www.plosone.org 7 February 2013 | Volume 8 | Issue 2 | e54722

treated the cultures with 100 mM of allopurinol. In contrast,
allopurinol blocks cytokine release at 1 mM (Fig. 5A). However,
when we compared IL-1b, IL-6 and TNF-a levels from cultures
treated with allopurinol (1 mM) after LPS challenge with time-
matched control cultures (without LPS) we found a significant
increase of cytokines release (Fig. 5A). These results suggest that
allopurinol was not able to block microglia activation completely,
even if it did block ROS production. Finally, we assessed the effect
of microglia activation modulated by allopurinol on demyelination
and axonal damage. After 24 h of treatment with LPS in presence
or absence of allopurinol, cultures were stained for neurofilament
light (NfL) and MBP (Fig. 5B, left panels). Allopurinol used at
1 mM significantly prevented axonal damage (Fig. 5B, right
panels) but did not decrease demyelination (Fig. 5B, see
quantification in graphs below).
Blocking TNF-a prevents partially demyelination but notoxidative stress-mediated axonal damage
During brain inflammation, pro-inflammatory cytokines and
oxidative stress may differentially contribute to axon and myelin
damage. To investigate the contribution of pro-inflammatory
cytokines such as TNF-a to tissue damage, TNF-a activity was
inhibited using a blocking recombinant protein (Fc-TNFR1), and
the levels of oxidative stress and axonal and myelin damage in
cultures were measured. Demyelination was significantly attenu-
ated in cerebellar cultures pretreated with Fc-TNFR1 2 h before
the LPS challenge (Fig. 6A), visible as a significant increase in the
percentage of myelinated axons in the Fc-TNFR1 group
compared to the LPS group (Fig. 6B). We quantified oligoden-
drocyte cell death by double staining with MBP/PI. We observed
that Fc-TNFR1 treated cultures had a significantly decrease of
oligodendrocyte death compared to the cultures treated with LPS
(Fig. 6B). These effects were present without modification of iNOS
expression (Fig. 6C). In summary, in the cerebellar culture model
of neuroinflammation, myelin damage and oligodendrocyte loss
were promoted by TNF-a.
Role of interferon-beta therapy in preventing oxidativestress-mediated axonal damage
Interferon-beta (IFN-b) is the most common treatment for MS,
with a pleiotropic mechanism of action, preventing CNS damage.
However, the precise role of IFN-b in controlling oxidative stress
in MS is uncertain, particularly given that type I IFN activates
iNOS in monocytes and promotes ROS generation [19,20], while
it can also downregulate iNOS expression in other settings [21].
First, we assessed the effects of IFN-b in the release of
proinflammatory cytokines by LPS. Cytokine release was signif-
icantly attenuated in presence of IFN-b (Fig. 7A). Specifically,
IFN-b has a more profound and early effect on IL-1b than on IL-6
and TNF-a release. Furthermore, cultures treated with IFN-b had
significantly less axonal damage, as revealed by a reduction in the
Figure 5. Effects of allopurinol in microglia mediated axonaldamage and demyelination. A) Comparative effect of LPS andallopurinol (ALO) in cytokine expression, and ROS production bycultures: cerebellar cultures were treated with LPS in presence or
absence of ALO (ALO1: 100 mM or ALO2: 1 mM). At 24 h ROS weremeasured and expressed as arbitrary units and IL-1b, TNF-a and IL6release were measured by ELISA. Asterisks indicate the standard errorcalculated respect to the control. *P,0.05, and ***P. B) Comparativeeffect of LPS and allopurinol in the induction of axonal damage (non-phosphorilated neurofilaments: Immunostaining for NFL/MBP and non-phosporilated neurofilaments (SMI32) in cultures using the samecondition as in D. Scale bar = 10 mm. The graph below shows thequantification of demyelinated and non-phosporilated neurofilamentes.Error bars indicate the standard error. *P,0.05, **P,0.01 (ANOVA test).doi:10.1371/journal.pone.0054722.g005
Cerebellar Culture Model of Neuroinflammation
PLOS ONE | www.plosone.org 8 February 2013 | Volume 8 | Issue 2 | e54722
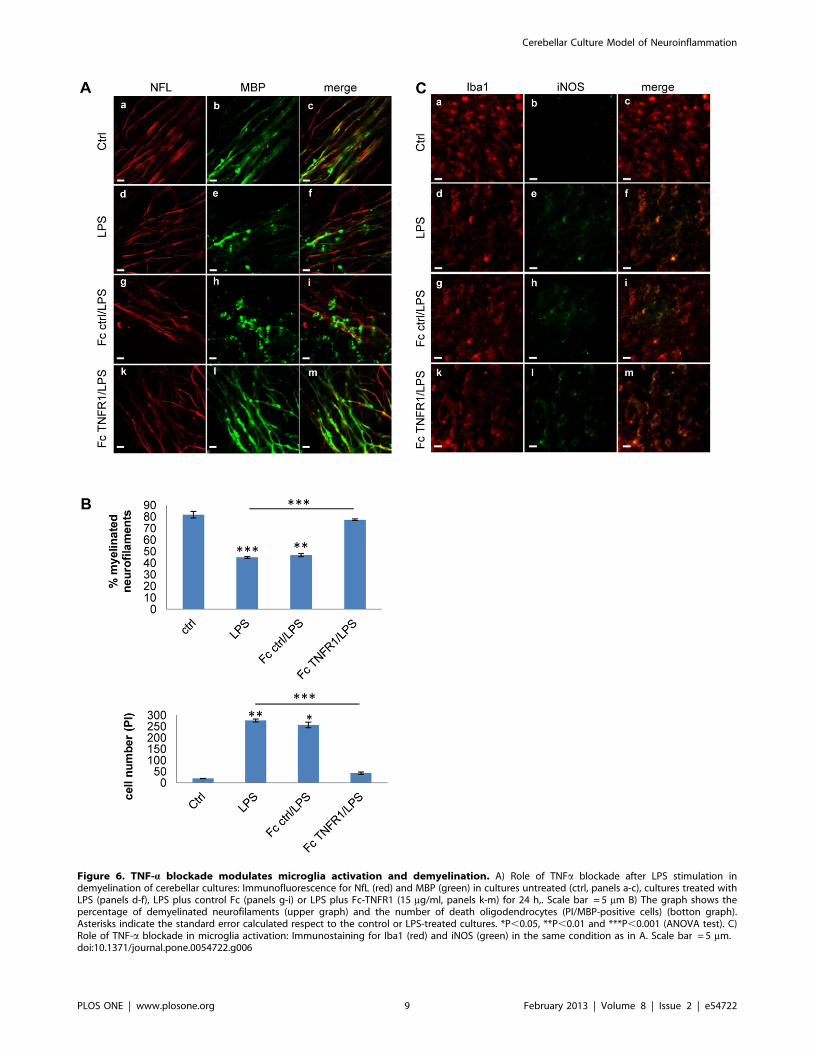
Figure 6. TNF-a blockade modulates microglia activation and demyelination. A) Role of TNFa blockade after LPS stimulation indemyelination of cerebellar cultures: Immunofluorescence for NfL (red) and MBP (green) in cultures untreated (ctrl, panels a-c), cultures treated withLPS (panels d-f), LPS plus control Fc (panels g-i) or LPS plus Fc-TNFR1 (15 mg/ml, panels k-m) for 24 h,. Scale bar = 5 mm B) The graph shows thepercentage of demyelinated neurofilaments (upper graph) and the number of death oligodendrocytes (PI/MBP-positive cells) (botton graph).Asterisks indicate the standard error calculated respect to the control or LPS-treated cultures. *P,0.05, **P,0.01 and ***P,0.001 (ANOVA test). C)Role of TNF-a blockade in microglia activation: Immunostaining for Iba1 (red) and iNOS (green) in the same condition as in A. Scale bar = 5 mm.doi:10.1371/journal.pone.0054722.g006
Cerebellar Culture Model of Neuroinflammation
PLOS ONE | www.plosone.org 9 February 2013 | Volume 8 | Issue 2 | e54722
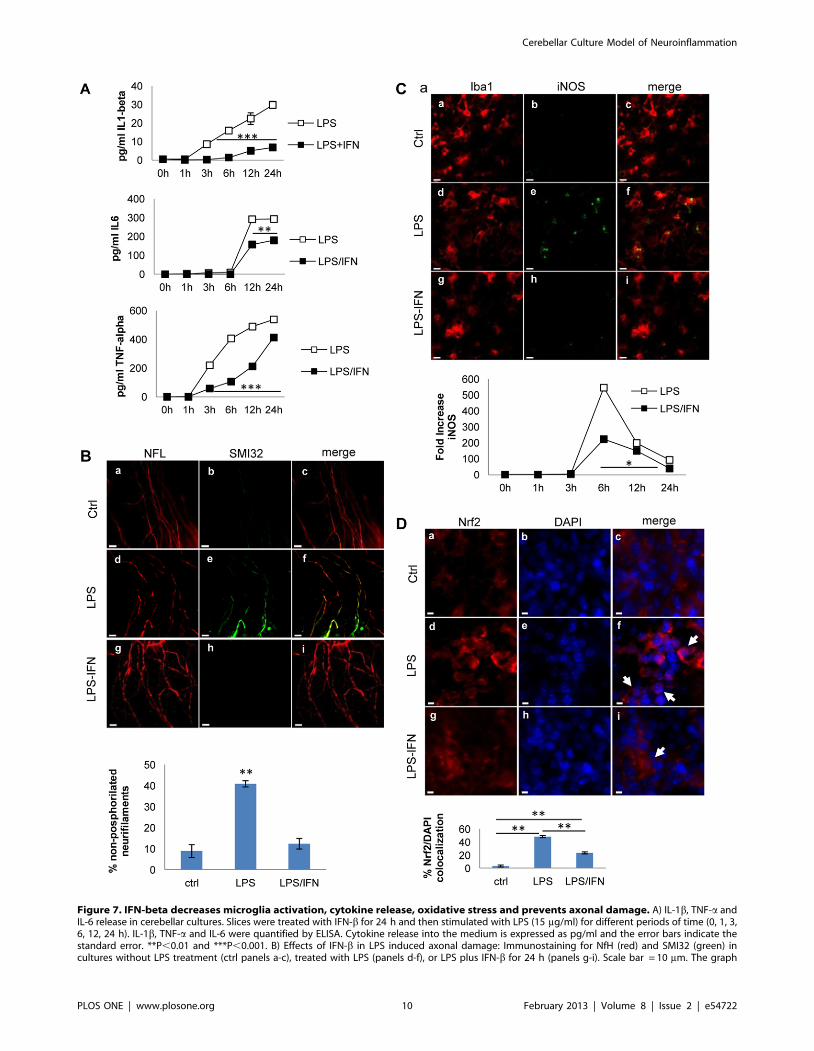
Figure 7. IFN-beta decreases microglia activation, cytokine release, oxidative stress and prevents axonal damage. A) IL-1b, TNF-a andIL-6 release in cerebellar cultures. Slices were treated with IFN-b for 24 h and then stimulated with LPS (15 mg/ml) for different periods of time (0, 1, 3,6, 12, 24 h). IL-1b, TNF-a and IL-6 were quantified by ELISA. Cytokine release into the medium is expressed as pg/ml and the error bars indicate thestandard error. **P,0.01 and ***P,0.001. B) Effects of IFN-b in LPS induced axonal damage: Immunostaining for NfH (red) and SMI32 (green) incultures without LPS treatment (ctrl panels a-c), treated with LPS (panels d-f), or LPS plus IFN-b for 24 h (panels g-i). Scale bar = 10 mm. The graph
Cerebellar Culture Model of Neuroinflammation
PLOS ONE | www.plosone.org 10 February 2013 | Volume 8 | Issue 2 | e54722
percentage of non-phosphorylated neurofilaments in cultures
treated with IFN-b after LPS challenge (Fig. 7B).
In order to assess the effect of IFN-b on oxidative stress, we
analyzed iNOS and Nrf2 expression. Pretreatment with IFN-bprior to the LPS challenge reduced LPS-induced iNOS expression,
as determined both by RT-PCR (Fig. 7C) and by increasing the
protein levels in the tissue and translocation to nucleus (Fig. 7D).
Nrf2 is a transcription factor that regulates the expression of many
phase II detoxifying and antioxidant enzymes. The increase of
Nrf2 is a molecular sensor of oxidative stress and its decrease
would suggest reduced oxidative stress. Thus, we observed that
LPS-induced oxidative stress triggers translocation of Nrf2 in the
nucleus, and that IFN-b treatment induced 50% decrease in Nrf2
translocation (Fig. 7D). Taken together, these results indicate that
IFN-b displays an anti-oxidant and anti-inflammatory role in the
mice cerebellar model and also highlights the usefulness of this
model for monitoring the effects of MS therapies.
Discussion
The LPS model of neuroinflammation in cerebellar cultures
[22] recapitulates several events that occur during brain inflam-
mation, including microglia activation followed by cytokine release
and oxidative stress, demyelination and axonal damage. Using this
model we have evaluated the effect of microglia activation on
demyelination and axonal damage in cerebellum tissue. Moreover,
we have analyzed whether the murine organotypic culture model
represents an effective tool to study the effects of drugs used in
neuroinflammatory diseases by using IFN-b as an example. Our
results indicate that LPS induced microglia activation in
organotypic cultures, as observed by presence of microglial cells
with amoeboid shape that expressed MHC-II and OX42, the
release of pro-inflammatory cytokines, such as IL-1b, IL-6 and
TNF-a and the induction of oxidative stress. Microglia activation
was associated with oligodendrocyte death and myelin and axonal
damage. Demyelination occurs in cerebellar cultures challenged
with LPS, although to a lesser extent than in models of
demyelination induced by lysolecithin [23], passive transfer of
anti-MOG antibodies in cerebellar cultures [24], or LPS challenge
to optic nerve cultures [15]. We need to keep in mind that
cerebellar tissue appears to be more sensitive to oxidative damage
than other brain regions [25]. Cerebellar cultures preserve to a
large extent the structure of the brain tissue, and all the cell
populations of interest (microglia, astrocytes, neurons and axons,
myelin and oligodendrocytes) when compared with spinal cord,
retina or hippocampus cultures. The analysis of the effects of
neuroinflammation elicited by LPS facilitates dissection of the
pathogenic process present in brain inflammatory diseases. In vivo,
LPS injection in the spinal cord has been shown to induce
significant immune cell recruitment to the site of injection, with
prominent demyelination that develops over 2 weeks and to a
lesser extent axonal damage, followed by remyelination by
Schwann cells 4 weeks later [26]. Although the hematogenous
inflammation typical of MS and other inflammatory brain diseases
does not develop in this model, the effect of activating the innate
immune system within the brain is recapitulated by the presence of
microglia activation, which appears to be critical for the long-term
axonal damage in MS and degenerative diseases [27].
In the cerebellar cultures stimulated with LPS, we observed
ROS production and iNOS expression in activated microglia
indicating induction of oxidative stress. LPS activates microglia
and astrocytes by binding to TLR4, promoting the induction of
iNOS, which in turn produces ROS [28]. Activation of microglia
and astrocytes occurs at different stage in several neurodegener-
ative diseases. In experimental autoimmune encephalomyelitis
(EAE), microglia proliferate at the initial stage while astrocytes
start to respond more markedly at the late recovery stage [29]. In
general, activated astrocytes also express iNOS and the levels of
iNOS observed in the organotypic cultures challenged with LPS
probably also depend on astrocytes. Oligodendrocytes and myelin
are highly sensitive to NO, which provokes the deregulation of the
mitochondrial electron transport chain in association with the
translocation of the apoptosis inducing factor (AIF) [30] and the
production of peroxynitrite [31]. The reduction, but not complete
suppression, of demyelination by iNOS inhibitors suggests that
oligodendrocytes are damaged by other mechanisms triggered
through the activation of TLR4 by LPS. Indeed, TNF-a and IL-
1b appear to mediate oligodendrocyte damage in mixed cultures
[15,32]. The requirement of a mixed glia environment suggests
that cytokines impair the glutamate-buffering capacity of astro-
cytes [33].
To evaluate the contribution of microglia activation on
demyelination and axonal degeneration we also may use of
chemical inhibitors of microglia activation such as EP or
allopurinol. Axonal damage was elicited by LPS-mediated
microglia activation as well as by H2O2-promoted oxidative stress.
Inhibition of iNOS expression by EP prevented myelin and axonal
damage whereas allopurinol preferentially prevented axonal loss,
but demyelination persists. In particular, allopurinol reduced
significantly the production of ROS and slightly the amount of
cytokines. The amount of cytokines still present after allopurinol
pre-treatment (.500 pg/ml for TNF-a, 100 pg/ml for IL-6 and
50 pg/ml for IL-1b) is sufficient to induce demyelination in the
cultures. Moreover, in the present model we found that following
inhibition of TNF-a, myelin damage and oligodendrocyte loss
were promoted by pro-inflammatory cytokines. However, we did
not blocked other pro-inflammatory cytokines and for this reason
we cannot rule out the contribution of other pro-inflammatory
cytokines to tissue damage.
Oxidative stress may contribute to axonal damage via several
mechanisms, including the impairment of mitochondrial function
due to the accumulation of mutations in mtDNA. In turn, this
leads to energetic failure, protein and lipid oxidation, and
microtubule degradation, thus impairing functions such as axonal
transport and structural support [1,3,34]. The axonal swelling and
mitochondria accumulation were pertinently present in the model
and were consistent with a disruption of microtubules by oxidative
stress and the subsequent blockade of axonal transport [6].
Moreover, demyelination enhances this effect due to the lack of
metabolic support provided by myelin in long axons [35,36].
Finally we have investigated the effect of IFN-b, a firmly
established first-line therapeutic agent for MS that prevents CNS
below shows the percentage of non-phosphorylated neurofilament with respect to total neurofilaments in cultures stimulated with LPS and treatedwith IFN-b. C) Effects of IFN-b in microglia activation and iNOS expression: Immunofluorescence staining for Iba1 (red) and iNOS (green) in the sameconditions as B). iNOS levels were quantified by qPCR from cultures treated with LPS or LPS plus IFN-b: the graphs shown the fold increase over thebasal values (2), normalized to the expression of the HPRT1 housekeeping gene. Error bars indicate the standard error. *P,0.05. D) Effects of IFN-b inNrf2 nuclear translocation: Immunostaining for Nrf2 (red) and DAPI (blue) in cultures without LPS treatment (ctrl, panels a-c), treated with LPS (panelsd-f), or LPS plus IFN-b for 24 h (panels g-i). Arrows indicate Nrf2 accumulation in the nucleus. Representative images of double staining are shown.Error bars indicate the standard error. **P,0.01. Scale bar = 5 mm. ANOVA test was used to determine statistical significance.doi:10.1371/journal.pone.0054722.g007
Cerebellar Culture Model of Neuroinflammation
PLOS ONE | www.plosone.org 11 February 2013 | Volume 8 | Issue 2 | e54722

damage. Our model indicates that IFN-b decrease both the
expression of pro-inflammatory cytokines and oxidative stress, as
such contributing to axonal preservation. The occurrence of
oxidative damage coincided with increased levels of antioxidant
enzymes in cerebellar cultures treated with IFN-b, suggesting that
the antioxidant capacity is overwhelmed during a neuroinflam-
matory attack [37]. Several studies have also shown that IFN-binhibits cytokine-induced NO- or iNOS-synthesis in astrocytes,
which may contribute to its clinical efficacy [21,38,39]. In
contrast, Lieb et al [40] have shown no inhibitory effects of
IFN-b on iNOS in rat microglial cells. Moreover, studies in
murine macrophages have shown that IFN-b increased the iNOS
activity, thereby enhancing intracellular NO activity [20]. In our
culture system, IFN-b reduced iNOS expression supporting the
protective effect of IFN-b from oxidative stress. Endogenous
antioxidant enzymes are regulated by the transcription factor Nrf2
and upon exposure to ROS, Nrf2 translocates to the nucleus
where it binds to antioxidant response elements in genes coding for
antioxidant enzymes [41]. In organotypic cultures challenged with
LPS, translocation of Nrf2 into the nucleus was decreased when
the cultures were treated with IFN-b. We hypothesize that the
decrease in nuclear translocation of Nrf2 observed is probably due
to the ability of IFN-b to prevent oxidative stress.
In summary, our data underscore that in cerebellar organotypic
cultures challenged with LPS, microglial activation is sufficient to
release pro-inflammatory cytokines and induce oxidative stress,
damaging myelin and axons, even in the absence of lymphocytes
and hematogenous macrophages. These events were recapitulated
and dissected in this model, providing a tool to study tissue
damage MS and other inflammatory brain diseases, that might
reflect the progression of the disease in the absence of overt
inflammatory infiltrates. Moreover, this model permits the
mechanistic study of new treatments for MS and other neuroin-
flammatory disorders.
Supporting Information
Figure S1 LPS induces microglia activation in mousecerebellar cultures. A) dose-response curve of IL-1b release
measured by ELISA. Cerebellar cultures were stimulated with four
different concentrations of LPS for 24 h (5, 10, 15 and 20 mg/ml).
B) IL-1b, TNF-a and IL-6 release in cerebellar cultures. Slices
were stimulated with LPS (15 mg/ml) for different periods of time
(0, 1, 3, 6, 12, 24, 48, 72 and 96 h) and then analyzed by ELISA.
Cytokine release into the medium is expressed as pg/ml. Error
bars indicate the standard error. *P,0.05, **P,0.01 and
***P,0.001 (Student’s t-test). C) Immunostaining for markers of
microglia activation MHCII (a) and OX42 (b). Cultures were
stimulated with LPS (15 mg/ml) for 24 h and then stained with
antibodies against MHCII and OX42. Scale bars = 50 mm (a) and
10 mm (b).
(TIF)
Figure S2 Demyelination and impaired axonal trans-port were maintained after 24 h of LPS treatment.Cerebellar cultures were stimulated with LPS (15 mg/ml) for 0,
1, 3, 6, 12, 24, 48, 72 and 96 h, and stained for NfH (red) and
MBP (green). The time points 12 h and 96 h after LPS challenge
are shwon. Arrows indicate axonal beads and arrowheads indicate
axonal transection (end-bulbs). Scale bar = 10 mm.
(TIF)
Figure S3 Microglial activation induces oligodendrocytedeath in mouse cerebellar cultures. A) Cerebellar cultures
were treated with LPS (15 mg/ml) for 24 h and then immuno-
stained for MBP (green) or NeuN (blue) and counterstained with
propidium iodide (red). The graph shows the number of PI-MBP-
positive cells. Higher magnification images of white (g) and grey (h)
matter in cultures treated with LPS. Scale bar = 100 mm (panels a-
f) and 10 mm (panels g and h). B) Cerebellar cultures were
incubated for 24 h in the presence (LPS) or absence (Ctrl) of LPS
(15 mg/ml). Immunocytochemistry was performed to detect
activated (cleaved) caspase-3 labeling. Graphs show the percentage
of cell death by quantifying the co-localization of active Casp3
immunofluorescence in conjunction with Hoechst 33258 nuclear
staining. Asterisk indicates the standard error calculated respect to
the control. *P,0.05, **P,0.01 (Student’s t-test). Representative
images of double staining for active Casp3 (green) and Hoechst
(blue) are shown. Scale bar = 5 mm.
(TIF)
Acknowledgments
We would like to thank Ali Taubes for the English review.
Author Contributions
Conceived and designed the experiments: AdP PV JC. Performed the
experiments: AdP BM SR BFD MV OE NE. Analyzed the data: AdP KV
JC PV. Contributed reagents/materials/analysis tools: KV ER JC. Wrote
the paper: AdP KV JC PV.
References
1. Coleman M (2005) Axon degeneration mechanisms: commonality amid
diversity. Nat Rev Neurosci 6: 889–898.
2. Coleman MP, Perry VH (2002) Axon pathology in neurological disease: a
neglected therapeutic target. Trends Neurosci 25: 532–537.
3. Beal MF (2005) Mitochondria take center stage in aging and neurodegeneration.
Ann Neurol 58: 495–505.
4. Su KG, Banker G, Bourdette D, Forte M (2009) Axonal degeneration in
multiple sclerosis: the mitochondrial hypothesis. Curr Neurol Neurosci Rep 9:
411–417.
5. Gilgun-Sherki Y, Melamed E, Offen D (2001) Oxidative stress induced-
neurodegenerative diseases: the need for antioxidants that penetrate the blood
brain barrier. Neuropharmacology 40: 959–975.
6. Roediger B, Armati PJ (2003) Oxidative stress induces axonal beading in
cultured human brain tissue. Neurobiol Dis 13: 222–229.
7. Stoppini L, Buchs PA, Muller D (1991) A simple method for organotypic
cultures of nervous tissue. J Neurosci Methods 37: 173–182.
8. Dusart I, Airaksinen MS, Sotelo C (1997) Purkinje cell survival and axonal
regeneration are age dependent: an in vitro study. J Neurosci 17: 3710–3726.
9. Stansley B, Post J, Hensley K (2012) A comparative review of cell culture systems
for the study of microglial biology in Alzheimer’s disease. J Neuroinflammation
9: 115.
10. Miron VE, Ludwin SK, Darlington PJ, Jarjour AA, Soliven B, et al. (2010)
Fingolimod (FTY720) enhances remyelination following demyelination of
organotypic cerebellar slices. Am J Pathol 176: 2682–2694.
11. Zhang H, Jarjour AA, Boyd A, Williams A (2011) Central nervous system
remyelination in culture – a tool for multiple sclerosis research. Exp Neurol 230:
138–148.
12. Martinez-Forero I, Garcia-Munoz R, Martinez-Pasamar S, Inoges S, Lopez-
Diaz de Cerio A, et al. (2008) IL-10 suppressor activity and ex vivo Tr1 cell
function are impaired in multiple sclerosis. Eur J Immunol 38: 576–586.
13. Schneider P (2000) Production of recombinant TRAIL and TRAIL receptor: Fc
chimeric proteins. Methods Enzymol 322: 325–345.
14. Cavaliere F, Dinkel K, Reymann K (2005) Microglia response and P2 receptor
participation in oxygen/glucose deprivation-induced cortical damage. Neuro-
science 136: 615–623.
15. Sherwin C, Fern R (2005) Acute lipopolysaccharide-mediated injury in neonatal
white matter glia: role of TNF-alpha, IL-1beta, and calcium. J Immunol 175:
155–161.
16. Kim HS, Cho IH, Kim JE, Shin YJ, Jeon JH, et al. (2008) Ethyl pyruvate has an
anti-inflammatory effect by inhibiting ROS-dependent STAT signaling in
activated microglia. Free Radic Biol Med 45: 950–963.
Cerebellar Culture Model of Neuroinflammation
PLOS ONE | www.plosone.org 12 February 2013 | Volume 8 | Issue 2 | e54722

17. Kao KK, Fink MP (2010) The biochemical basis for the anti-inflammatory and
cytoprotective actions of ethyl pyruvate and related compounds. BiochemPharmacol 80: 151–159.
18. Yang CS, Lee HM, Lee JY, Kim JA, Lee SJ, et al. (2007) Reactive oxygen
species and p47phox activation are essential for the Mycobacterium tubercu-los is- induced pro-inf lammatory response in murine microgl ia.
J Neuroinflammation 4: 27.19. Bogdan C, Rollinghoff M, Diefenbach A (2000) The role of nitric oxide in innate
immunity. Immunol Rev 173: 17–26.
20. Yao SY, Ljunggren-Rose A, Stratton CW, Mitchell WM, Sriram S (2001)Regulation by IFN-beta of inducible nitric oxide synthase and interleukin-12/
p40 in murine macrophages cultured in the presence of Chlamydia pneumoniaeantigens. J Interferon Cytokine Res 21: 137–146.
21. Hua LL, Liu JS, Brosnan CF, Lee SC (1998) Selective inhibition of human glialinducible nitric oxide synthase by interferon-beta: implications for multiple
sclerosis. Ann Neurol 43: 384–387.
22. Kim JY, Shen S, Dietz K, He Y, Howell O, et al. (2010) HDAC1 nuclear exportinduced by pathological conditions is essential for the onset of axonal damage.
Nat Neurosci 13: 180–189.23. Birgbauer E, Rao TS, Webb M (2004) Lysolecithin induces demyelination in
vitro in a cerebellar slice culture system. J Neurosci Res 78: 157–166.
24. Harrer MD, von Budingen HC, Stoppini L, Alliod C, Pouly S, et al. (2009) Liveimaging of remyelination after antibody-mediated demyelination in an ex-vivo
model for immune mediated CNS damage. Exp Neurol 216: 431–438.25. Vladimirova O, O’Connor J, Cahill A, Alder H, Butunoi C, et al. (1998)
Oxidative damage to DNA in plaques of MS brains. Mult Scler 4: 413–418.26. Felts PA, Woolston AM, Fernando HB, Asquith S, Gregson NA, et al. (2005)
Inflammation and primary demyelination induced by the intraspinal injection of
lipopolysaccharide. Brain 128: 1649–1666.27. Moreno B, Jukes JP, Vergara-Irigaray N, Errea O, Villoslada P, et al. (2011)
Systemic inflammation induces axon injury during brain inflammation. AnnNeurol 70: 932–942.
28. Lehnardt S, Lachance C, Patrizi S, Lefebvre S, Follett PL, et al. (2002) The toll-
like receptor TLR4 is necessary for lipopolysaccharide-induced oligodendrocyteinjury in the CNS. J Neurosci 22: 2478–2486.
29. Matsumoto Y, Ohmori K, Fujiwara M (1992) Microglial and astroglial reactionsto inflammatory lesions of experimental autoimmune encephalomyelitis in the
rat central nervous system. J Neuroimmunol 37: 23–33.
30. Baud O, Li J, Zhang Y, Neve RL, Volpe JJ, et al. (2004) Nitric oxide-induced
cell death in developing oligodendrocytes is associated with mitochondrial
dysfunction and apoptosis-inducing factor translocation. Eur J Neurosci 20:
1713–1726.
31. Jack C, Antel J, Bruck W, Kuhlmann T (2007) Contrasting potential of nitric
oxide and peroxynitrite to mediate oligodendrocyte injury in multiple sclerosis.
Glia 55: 926–934.
32. Li J, Ramenaden ER, Peng J, Koito H, Volpe JJ, et al. (2008) Tumor necrosis
factor alpha mediates lipopolysaccharide-induced microglial toxicity to devel-
oping oligodendrocytes when astrocytes are present. J Neurosci 28: 5321–5330.
33. Takahashi JL, Giuliani F, Power C, Imai Y, Yong VW (2003) Interleukin-1beta
promotes oligodendrocyte death through glutamate excitotoxicity. Ann Neurol
53: 588–595.
34. Counterman AE, D’Onofrio TG, Andrews AM, Weiss PS (2006) A physical
model of axonal damage due to oxidative stress. Proc Natl Acad Sci U S A 103:
5262–5266.
35. Nave KA, Trapp BD (2008) Axon-glial signaling and the glial support of axon
function. Annu Rev Neurosci 31: 535–561.
36. Irvine KA, Blakemore WF (2008) Remyelination protects axons from
demyelination-associated axon degeneration. Brain 131: 1464–1477.
37. van Horssen J, Schreibelt G, Drexhage J, Hazes T, Dijkstra CD, et al. (2008)
Severe oxidative damage in multiple sclerosis lesions coincides with enhanced
antioxidant enzyme expression. Free Radic Biol Med 45: 1729–1737.
38. Guthikonda P, Baker J, Mattson DH (1998) Interferon-beta-1-b (IFN-B)
decreases induced nitric oxide (NO) production by a human astrocytoma cell
line. J Neuroimmunol 82: 133–139.
39. Stewart VC, Giovannoni G, Land JM, McDonald WI, Clark JB, et al. (1997)
Pretreatment of astrocytes with interferon-alpha/beta impairs interferon-gamma
induction of nitric oxide synthase. J Neurochem 68: 2547–2551.
40. Lieb K, Engels S, Fiebich BL (2003) Inhibition of LPS-induced iNOS and NO
synthesis in primary rat microglial cells. Neurochem Int 42: 131–137.
41. de Vries HE, Witte M, Hondius D, Rozemuller AJ, Drukarch B, et al. (2008)
Nrf2-induced antioxidant protection: a promising target to counteract ROS-
mediated damage in neurodegenerative disease? Free Radic Biol Med 45: 1375–
1383.
Cerebellar Culture Model of Neuroinflammation
PLOS ONE | www.plosone.org 13 February 2013 | Volume 8 | Issue 2 | e54722


