
OXIDATION OF REFRACTORY GOLD
CONCENTRATES AND SIMULTANEOUS
DISSOLUTION OF GOLD IN AERATED
ALKALINE SOLUTIONS
By
Suchun Zhang
B. Eng. (Appl. Chem.), Tsinghua University, Beijing, China
This thesis is presented
for the degree of Doctor of Philosophy of
Murdoch University
Western Australia
March 2004

ii
I declare that this thesis is my own account of my research and contains as
its main content work which has not previously been submitted for a degree
at any tertiary education institute
______________________
Suchun Zhang
March 2004

iii
ABSTRACT
The oxidation of refractory gold concentrates containing arsenopyrite and pyrite
and the simultaneous dissolution of gold in aerated alkaline solutions at ambient
temperatures and pressures without the addition of cyanide has been studied. It involves
the following aspects: the chemistry of the oxidation of pure arsenopyrite and pyrite
minerals in aerated alkaline solutions; the kinetics of oxidation of arsenopyrite and the
simultaneous dissolution of gold in such solutions; the kinetics of simultaneous
dissolution of gold during the alkaline oxidation of refractory gold concentrates; the
electrochemistry of gold in alkaline solutions containing thiosulfate or monothioarsenate;
the effect of copper on the leaching of gold in alkaline thiosulfate solutions; and the
leaching of gold in alkaline solutions with thioarsenites.
The nature and proportions of the products of the oxidation of arsenopyrite in
aerated alkaline solutions have been studied using high pressure ion chromatography
techniques that have shown that thiosulfate and a new species, monothioarsenate, are the
main oxidation products of arsenopyrite apart from arsenate and sulfite. The alkaline
oxidation of pyrite primarily yields thiosulfate and sulfite. A kinetic investigation of the
oxidation of arsenopyrite with air or oxygen has shown that the initial rate of
arsenopyrite oxidation is proportional to the concentration of dissolved oxygen. A
reaction mechanism for the oxidation of arsenopyrite has been proposed, which involves
an anodic oxidation of the mineral involving hydroxyl ions coupled to a cathodic process
for oxygen reduction which is partially controlled by mass transfer of dissolved oxygen
to the mineral surface.

iv
Detailed studies of the dissolution behaviour of gold in aerated alkaline solutions
in the presence of thiosulfate or monothioarsenate by electrochemical and leaching
methods have demonstrated that the dissolution rate is very low as compared to that of
gold in alkaline cyanide or ammoniacal thiosulfate solutions. It has been found that
copper ions catalyze the dissolution of gold in the thiosulfate solutions in the absence of
ammonia. The leaching experiments also have shown that gold may dissolve in alkaline
thioarsenite solutions, which provides a possible new process option for the leaching of
gold.
The oxidation of refractory arsenical gold concentrates in aerated alkaline
solutions results in the formation of thiosulfate, arsenate and sulfate as well as the
dissolution of gold, copper and iron. It appears that the dissolution of gold is due to the
complex reactions of gold with thiosulfate ions promoted by the catalytic effect of
copper ions. Up to 80% of the gold may be extracted during the oxidation of selected
refractory arsenical gold concentrates, which suggests a possible one-step process for the
extraction of gold.

v
ACKNOWLEDGEMENTS
I would like to express my deepest thanks to my supervisors, Professor Michael J.
Nicol of Extractive Metallurgy at Murdoch University and Mr. Bill W. Staunton,
Manager of the Gold Program of the A J Parker Cooperative Research Centre for
Hydrometallurgy, for their genuine, generous, invaluable advice, guidance and
assistance, for their inspiration, patience and kindness throughout my PhD studies. It has
been a great honor to work with them because of their immense experience and
knowledge.
I acknowledge with thanks the financial support from Australian Government,
Murdoch University and the A. J. Parker Centre through the awards of scholarships.
Many thanks go to Professor Ian Ritchie, former director of the A. J. Parker Centre and
his wife, Anne, Dr. Jim Avraamides, deputy director of the A. J. Parker Centre, Ms Betty
Bright, Business Manager of the A. J. Parker Centre for their generous help given after I
came to Perth in Western Australia.
I would like to express my gratitude to all those in Chemistry and Extractive
Metallurgy, and MPS Store at Murdoch University who provided much help during my
PhD studies. Special thanks are due to Ken Seymour and Stewart Kelly for their
technical support in using XRD, SEM and AAS analyses, to Doug Clarke for his
assistance in setting up the ion chromatography instrumentation, to Kleber Claux for his
help in manufacturing the reactors used in my studies, and to Wiluna Gold Mine in
Western Australia for providing the refractory gold concentrate sample. My sincere
gratitude also goes to Dr. Gamini Senanayake, Dr. Nimal Subasinghe, Dr. Nicolas

vi
Welham, Dr. Hongguang Zhang, Dr. Glen O'Malley, Dr. Maria Isabel Lazaro-Baez and
Ms Sylvia Black for their help during my studies.
At last, I am very thankful to my parents, my brother and my sister, in particular,
my wife, Hua Chen and my son, Bolun Zhang for their love, support and encouragement
throughout my PhD studies.

vii
PUBLICATIONS
1. Suchun Zhang, Michael J. Nicol (2003), An electrochemical study of the
dissolution of gold in thiosulfate solutions. I Alkaline solutions. Journal of
Applied Electrochemistry, 33: 767-775.
2. Suchun Zhang, Michael J. Nicol (2003), The simultaneous oxidation of
sulfide minerals and the dissolution of gold. (In preparation).
3. Suchun Zhang, Michael J. Nicol (2003), An electrochemical study of the
dissolution of gold in thiosulfate solutions. II Effect of copper. (In
preparation).

viii
TABLE OF CONTENTS
Abstract ....................................................................................................... iii
Acknowledgement ........................................................................................v
Publications ................................................................................................ vii
Table of Contents ...................................................................................... viii
List of Figures .............................................................................................xv
List of Tables ...........................................................................................xxiv Chapter 1 Introduction .............................................................................1
1.1 Background to this study ....................................................................................1
1.2 Scope of this study ..............................................................................................5
1.3 Objectives of this study .......................................................................................7
1.4 Overview of this thesis .......................................................................................7
Chapter 2 Review of the Literature .........................................................9
2.1 The chemistry of the hydrometallurgy of gold ...................................................9
2.1.1 General properties of gold .......................................................................9
2.1.2 Chemistry of the dissolution of gold .....................................................10
2.1.3 The leaching of gold with various lixiviants .........................................14
2.1.3.1 Cyanidation ..............................................................................14
2.1.3.2 Chlorination .............................................................................17
2.1.3.3 Sulfide/Polysulfides .................................................................19
2.1.3.4 Other lixiviants ........................................................................20
2.2 The leaching of gold with thiosulfate ...............................................................22
2.2.1 The chemistry of thiosulfate ..................................................................22
2.2.1.1 Structure and use .....................................................................22
2.2.1.2 Redox properties and stability .................................................23
2.2.1.3 Metal complexation .................................................................29
2.2.1.4 Generation of thiosulfate .........................................................30
2.2.1.5 Determination of thiosulfate ....................................................31
2.2.2 The electrochemistry of gold in the presence of thiosulfate...................32
2.2.2.1 Electrochemical oxidation of thiosulfate .................................32

ix
2.2.2.2 Electrochemical oxidation of gold ...........................................34
2.2.3 Leaching of gold with ammoniacal thiosulfate solutions ......................38
2.2.3.1 Thermodynamics of gold leaching ..........................................38
2.2.3.2 Kinetics of the leaching of gold ...............................................41
2.2.4 Summary ................................................................................................48
2.3 Arsenical complexes of gold .............................................................................49
2.3.1 Oxy-salts of arsenic ...............................................................................50
2.3.2 Sulfides and thiosalts of arsenic ............................................................53
2.3.3 Effect of arsenic on the dissolution of gold ...........................................58
2.4 Alkaline oxidation of refractory sulfide gold ores ............................................61
2.4.1 Gold recovery from refractory sulfide ores ...........................................61
2.4.1.1 Roasting ...................................................................................62
2.4.1.2 Bio-oxidation ...........................................................................63
2.4.1.3 Chemical oxidation ..................................................................63
2.4.1.4 Alkaline oxidation ...................................................................64
2.4.2 Alkaline oxidation of arsenopyrite ........................................................64
2.4.2.1 The nature of arsenopyrite .......................................................64
2.4.2.2 Thermodynamics of the oxidation of arsenopyrite ..................66
2.4.2.3 Mechanism of the oxidation of arsenopyrite ...........................67
2.4.2.4 Kinetics of the oxidation of arsenopyrite ................................71
2.4.3 Alkaline oxidation of pyrite ...................................................................74
2.4.3.1 The nature of pyrite .................................................................74
2.4.3.2 Thermodynamics of oxidation of pyrite ..................................75
2.4.3.3 Oxidation by oxygen in alkaline solutions ..............................77
2.4.3.4 Kinetics of the oxidation of pyrite by oxygen .........................79
2.4.3.5 Mechanism of the oxidation of pyrite .....................................80
2.4.4 Alkaline oxidation of chalcopyrite ........................................................81
2.4.5 Eh measurements ...................................................................................82
2.4.6 Electrochemical interactions between sulfide minerals .........................85
2.4.7 Effect of fine grinding on sulfide oxidation ..........................................86
2.4.8 Effects of sulfide minerals on the dissolution of gold ...........................87
2.4.9 Summary ................................................................................................88
Chapter 3 Materials and Methods .........................................................90
3.1 Materials and reagents ......................................................................................90

x
3.2 Apparatus ..........................................................................................................93
3.2.1 Electrochemical set-up ...........................................................................93
3.2.1.1 Rotating gold disk electrode ....................................................93
3.2.1.2 Rotating platinum disk electrode .............................................94
3.2.1.3 Counter electrode .....................................................................94
3.2.1.4 Reference electrode .................................................................94
3.2.1.5 Electrochemical cell ................................................................95
3.2.1.6 Electrochemical system ...........................................................95
3.2.2 Oxidation and leaching system ..............................................................96
3.2.2.1 Reactor system .........................................................................96
3.2.2.2 Gas supply system ...................................................................96
3.2.2.3 Monitoring system .................................................................100
3.3 Experimental methods ....................................................................................103
3.3.1 Electrochemical measurements ...........................................................103
3.3.1.1 Open circuit potential (OCP) measurement ...........................103
3.3.1.2 Cyclic voltammetry ...............................................................103
3.3.1.3 Constant potential coulometry ...............................................105
3.3.2 Dissolution of gold ..............................................................................106
3.3.3 Oxidation of sulfide minerals and gold concentrates ..........................108
3.4 Analyses ..........................................................................................................110
3.4.1 Atomic absorption spectrometry (AAS) ..............................................110
3.4.1.1 Analysis for gold ...................................................................110
3.4.1.2 Analysis for arsenic ...............................................................111
3.4.1.3 Analysis for copper and iron .................................................111
3.4.2 Inductively coupled plasma spectrometry (ICP) .................................111
3.4.3 UV/Visible spectrophotometry ............................................................111
3.4.4 High pressure liquid chromatography (HPLC) ....................................112
3.4.4.1 Instrumentation for HPLC .....................................................112
3.4.4.2 Solutions for HPLC ...............................................................113
3.4.4.3 Calibration and determination ...............................................117
3.4.5 X-ray diffraction (XRD) analysis ........................................................120
3.4.6 Scanning electron microscopy (SEM) analysis ...................................120
3.4.7 Optical microscopy ..............................................................................121
3.4.8 Particle size analysis ............................................................................121
3.4.9 Wet chemical analysis .........................................................................121

xi
3.4.10 Miscellaneous analyses ........................................................................121
Chapter 4 Electrochemical Dissolution of Gold in Alkaline
Thiosulfate Solutions ...........................................................123 4.1 Introduction .....................................................................................................123
4.2 Results .............................................................................................................124
4.2.1 Open circuit potentials .........................................................................124
4.2.2 Cyclic voltammetry of gold .................................................................127
4.2.2.1 Thiosulfate solution ...............................................................127
4.2.2.2 Formation of sulfur film ........................................................129
4.2.2.3 Effect of ammonia .................................................................132
4.2.2.4 Oxygen reduction ..................................................................132
4.2.3 Coulometric experiments .....................................................................133
4.2.3.1 Effect of potential ..................................................................133
4.2.3.2 Effect of rotation speed ..........................................................139
4.2.3.3 Effect of temperature .............................................................139
4.2.3.4 Effect of pH ...........................................................................142
4.2.3.5 Effect of thiosulfate concentration ........................................143
4.2.3.6 Effect of ammonia concentration ..........................................145
4.3 Discussion .......................................................................................................146
4.3.1 Gold in thiosulfate solutions ................................................................146
4.3.2 Effect of ammonia ...............................................................................152
4.4 Conclusions .....................................................................................................154
Chapter 5 Effect of Copper on Dissolution of Gold in Alkaline
Thiosulfate Solutions ...........................................................156 5.1 Introduction .....................................................................................................156
5.2 Chemistry of copper in thiosulfate solutions ..................................................158
5.3 Results .............................................................................................................160
5.3.1 Mixed potential measurements ............................................................160
5.3.2 Anodic polarization .............................................................................163
5.3.3 Coulometric measurements .................................................................166
5.3.4 Gold dissolution in thiosulfate solutions with copper .........................168
5.4 Discussion .......................................................................................................168
5.4.1 Electrochemical oxidation ...................................................................168

xii
5.4.2 Dissolution of gold with oxygen .........................................................171
5.4.3 Possible complex of gold with copper in thiosulfate solutions ...........174
5.5 Conclusions .....................................................................................................176
Chapter 6 The Dissolution of Gold in Thioarsenate / Thioarsenite
Solutions ...............................................................................177 6.1 Introduction .....................................................................................................177
6.2 Dissolution in alkaline monothioarsenate solutions .......................................178
6.2.1 The electrochemical behavior of gold .................................................178
6.2.1.1 Mixed potential measurements ..............................................178
6.2.1.2 Cyclic voltammetry ...............................................................179
6.2.1.3 Coulometric determination ....................................................182
6.2.1.4 Cathodic reduction of oxygen ...............................................183
6.2.2 Dissolution of gold in monothioarsenate solutions .............................184
6.2.3 Discussion ............................................................................................185
6.3 Dissolution in alkaline thioarsenite solutions .................................................187
6.3.1 Dissolution of gold ..............................................................................188
6.3.2 Discussion ............................................................................................190
6.4 Conclusions .....................................................................................................192
Chapter 7 Simultaneous Oxidation of Sulfide Minerals and
Dissolution of Gold in Alkaline Solutions .........................193 7.1 Introduction .....................................................................................................193
7.2 Sulfide minerals ..............................................................................................195
7.3 Results .............................................................................................................199
7.3.1 Oxidation of pyrite and gold in alkaline solutions ...............................199
7.3.2 Oxidation of arsenopyrite in alkaline solutions ...................................201
7.3.3 Effect of milling of gold with arsenopyrite .........................................206
7.3.4 Effect of particle size on the dissolution of arsenopyrite ....................211
7.3.5 Effect of stirring speed on the dissolution of arsenopyrite and gold ...213
7.3.6 Effect of pulp density on the dissolution of arsenopyrite and gold .....216
7.3.7 Effect of oxygen partial pressure .........................................................221
7.3.8 Effect of NaOH concentration .............................................................222
7.3.9 Effect of temperature ...........................................................................227
7.3.10 Effect of the addition of thiosulfate and sulfur ....................................229

xiii
7.3.11 Reactions between arsenite and sulfur species ....................................233
7.4 Discussion .......................................................................................................234
7.4.1 Chemistry of the oxidation of pyrite ....................................................234
7.4.2 Chemistry of the oxidation of arsenopyrite .........................................235
7.4.2.1 Speciation of arsenic or sulfur ...............................................235
7.4.2.2 Products of oxidation of iron .................................................239
7.4.3 Kinetics of the oxidation of arsenopyrite .............................................241
7.4.3.1 Initial reaction orders .............................................................243
7.4.3.2 Mechanism for arsenopyrite oxidation ..................................252
7.4.4 Dissolution of gold ..............................................................................255
7.5 Summary and conclusions ..............................................................................257
Chapter 8 The Oxidation of Sulfide Concentrates and the
Simultaneous Dissolution of Gold ......................................260 8.1 Introduction .....................................................................................................260
8.2 Gold concentrates ...........................................................................................262
8.2.1 Wiluna concentrate ..............................................................................262
8.2.2 Macraes concentrate ............................................................................263
8.2.3 Salsigne concentrate ............................................................................263
8.2.4 An unknown concentrate .....................................................................264
8.3 Results .............................................................................................................264
8.3.1 Oxidation of Wiluna concentrate .........................................................265
8.3.1.1 Effect of milling time ............................................................265
8.3.1.2 Effect of the concentration of NaOH .....................................268
8.3.1.3 Effect of oxygen concentration ..............................................270
8.3.1.4 Effect of temperature .............................................................272
8.3.1.5 Effect of extended reaction time ............................................274
8.3.2 Oxidation of Macraes concentrate .......................................................277
8.3.3 Oxidation of Salsigne concentrate .......................................................279
8.3.4 Oxidation of unknown concentrate ......................................................280
8.4 Discussion .......................................................................................................282
8.5 Conclusions .....................................................................................................288
Chapter 9 Summary and Recommendations ......................................290
9.1 Summary .........................................................................................................290

xiv
9.2 Recommendations for future work .................................................................294
References .................................................................................................296 Appendix ...................................................................................................322
Appendix A1 Thermodynamic data used in this study .........................................322
Appendix A2 Wet chemical analysis of sulfide minerals and oxidized residues ..323
A2.1 Preparation of a bromine-bromide mixture .........................................323
A2.2 Procedure for digesting sulfide materials ............................................323
A2.3 Analysis of oxidized residues ..............................................................324
Appendix A3 Estimation of the mass transfer coefficient of oxygen ...................326
Appendix A4 XRD patterns ..................................................................................328
Appendix A5 Particle size analyses ......................................................................329
Appendix A6 Calculation of cumulative dissolution rates for the oxidation of
sulfide minerals and gold concentrates ..........................................331

xv
LIST OF FIGURES
Figure 2.1 Eh-pH diagram for gold-cyanide-water system at 25 °C for [Au] = 0.1
mM and [CN-] = 1 mM................................................................................16
Figure 2.2 Eh-pH diagram for the metastable S-H2O system at 25 °C ........................24
Figure 2.3 Steady state anodic polarization curve at 20 °C (2 M S2O32-, no Cu and
ammonia, pH=10) .......................................................................................35
Figure 2.4 Electrochemical model for the dissolution of gold in the ammoniacal
thiosulfate leach system ..............................................................................37
Figure 2.5 Eh-pH diagram for Au-NH3-S-H2O system at 25 °C (0.05 mM Au, 0.1
M S2O32-, 0.1 M NH3/NH4
+) .......................................................................39
Figure 2.6 Eh-pH diagram for Au(0)-Au(I)-Au(III)-NH3-S2O32--H2O system at 25
°C; [Au(I)]= 10-5 M, [Na2S2O3]= 0.1 M, [NH3+NH4+]= 1 M ....................39
Figure 2.7 Eh-pH diagram for Cu-NH3-S-H2O system at 25 °C (0.5 mM Cu, 0.1
M S2O32-, 0.1 M NH3/NH4
+) .......................................................................41
Figure 2.8 Eh-pH diagram for the arsenic-water system at 25 °C and [As]= 0.1 M ....51
Figure 2.9 Relationship between solubility of Au and concentration of As in 0.5
M NaOH solution at 200 °C in the presence of As2S3 ...............................59
Figure 2.10 Eh-pH diagram for the Fe-As-S-H2O system at 25 °C ...............................67
Figure 2.11 Eh-pH diagram for the pyrite-water system at 25 °C and for 10-5 M
dissolved species ........................................................................................76
Figure 2.12 Schematic representation of a mixed potential system ..............................84
Figure 3.1 Cross-section of a rotating disk electrode ..................................................93
Figure 3.2 A schematic presentation of electrochemical set up ...................................97
Figure 3.3 Assembly of reactor and agitating units .....................................................98
Figure 3.4 A schematic presentation of reactor system for oxidation of sulfide
minerals and dissolution of gold ................................................................99
Figure 3.5 Schematic presentation of combined Pt-Ag/AgCl electrode, gold and
mineral electrodes .....................................................................................102
Figure 3.6 A cyclic voltammogram at 5 mV s-1 of a rotating (500 rpm) gold
electrode in 0.1 M NaOH solution at room temperature ..........................104
Figure 3.7 Mechanical mill for ultra-fine grinding of sulfide minerals and/or gold
powder ......................................................................................................107
Figure 3.8 Instrumentation set-up for high pressure liquid chromatography ............115

xvi
Figure 3.9 Ion chromatogram for a 3.03 mM solution of Na3AsO3S using CO32- -
HCO3- eluant with UV detection ..............................................................116
Figure 3.10 Ion chromatogram for a 0.25 mM Na3AsO2S2 solution prepared using
the synthesized Na3AsO2S2 with UV detection and CO32--HCO3
-
eluant ........................................................................................................116
Figure 3.11 Ion chromatogram showing peaks for 0.10 mM H2AsO3-, 2.0 mM
HAsO42-, 2.0 mM SO4
2-, 0.60 mM HAsO3S2-, 1.0 mM S2O32- using
UV detection and CO32--HCO3
- eluant .....................................................118
Figure 3.12 Ion chromatogram showing peaks for 0.20 mM HAsO42-, 0.25 mM
SO32-, 0.40 mM HAsO3S2-, 1.0 mM S2O3
2- using UV detection and
CO32--HCO3
- eluant ..................................................................................118
Figure 3.13 Ion chromatogram for a solution obtained during the oxidation of
arsenopyrite in aerated 0.625 M NaOH at 25 °C after 3 hour ..................120
Figure 4.1 OCP of a rotating (1000 rpm) gold electrode in 1 M Na2S2O3 + 0.1 M
NaOH solutions under nitrogen and oxygen at 23 °C ..............................125
Figure 4.2 Open circuit potentials of a rotating (200 rpm) gold disk electrode in
deoxygenated solutions of pH 10.6 at 25 °C ............................................126
Figure 4.3 Mixed potentials of a rotating (200 rpm) gold disk electrode in
oxygenated solutions of pH 10.6 at 25 °C ................................................127
Figure 4.4 Cyclic voltammograms at 5 mV s-1 of rotating (200 rpm) gold and
platinum electrodes in deoxygenated 0.1 M NaOH solutions with and
without 1 M Na2S2O3 at 23 °C .................................................................128
Figure 4.5 Cyclic voltammograms at 5 mV s-1 of rotating (200 rpm) gold and
platinum electrodes in deoxygenated solutions containing 0.1 M
Na2S2O3 and 0.1 M NaOH at 23 °C .........................................................129
Figure 4.6 Cyclic voltammogram at 10 mV s-1 of a stationary gold electrode in
0.1 M Na2SO4 at 25 °C .............................................................................131
Figure 4.7 Cyclic voltammograms at 5 mV s-1 of a rotating (200 rpm) gold disk
electrode in deoxygenated solutions of pH 10.6 at 25 °C containing
0.1 M (NH4)2SO4 plus NH3 ; 1 M Na2S2O3 plus NaOH ; 1 M Na2S2O3,
0.1 M (NH4)2SO4 plus NH3 ......................................................................131
Figure 4.8 Reduction of oxygen on a rotating (400 rpm) gold disk electrode in
0.1 M Na2S2O3 solution with pH 12 at 25 °C ...........................................133

xvii
Figure 4.9 Anodic dissolution of a rotating (1000 rpm) gold electrode in 1 M
Na2S2O3 plus 0.1 M NaOH solutions at different potentials at 23 °C
for 12.5 hours ...........................................................................................134
Figure 4.10 Anodic dissolution of a rotating (200 rpm) gold disk in a solution
containing 1 M Na2S2O3 plus 0.1 M NaOH at 0.25 V and 25 °C ............136
Figure 4.11 Coulombic efficiency during anodic oxidation of a rotating (200 rpm)
gold disk in a deoxygenated solution containing 1 M Na2S2O3 and 0.1
M NaOH solution at 0.25 V and 25 °C ....................................................136
Figure 4.12 Optical microscope image of a gold disk after anodic oxidation in 1 M
Na2S2O3 and 0.1 M NaOH solution for 12.5 hours at 0.25 V and 25 °C ..137
Figure 4.13 Cyclic voltammograms (10 mV s-1) for gold in 0.1 M Na2SO4
solution. The sweeps start from 0 V in the positive direction ..................138
Figure 4.14 Effect of rotation on anodic dissolution of gold in alkaline 1 M
Na2S2O3 solutions for data from Table 4.2 ...............................................138
Figure 4.15 Current-time transients during the anodic dissolution of a rotating
(200 rpm) gold disk in a solution containing 1 M Na2S2O3 and 0.1 M
NaOH at various temperatures at 0.25 V .................................................140
Figure 4.16 Arrhenius plot for data from Table 4.3 .....................................................141
Figure 4.17 Effect of pH on anodic dissolution of gold in the alkaline 1M Na2S2O3
solutions for data from Table 4.4 .............................................................142
Figure 4.18 Effect of Na2S2O3 concentration on anodic oxidation of gold at 0.25 V
for data from Table 4.5 .............................................................................143
Figure 4.19 Current-time transients during anodic oxidation of gold at 0.25 V in
1.0, 0.5, 0.1 M Na2S2O3 solutions at 25 °C, 200 rpm ...............................144
Figure 4.20 Current-time transients during anodic dissolution of a rotating (200
rpm) gold disk at 0.25 V in solutions of pH 10.6 containing 1 M
Na2S2O3, NH3 and 0.1 M (NH4)2SO4 ; 1 M Na2S2O3 and NaOH; NH3
and 0.1 M (NH4)2SO4 without Na2S2O3 at 25 °C .....................................146
Figure 5.1 An Eh-pH diagram for Cu-S2O32--H2O system at 25 °C (conditions:
0.2 M S2O32-, 0.5 mM Cu2+) .....................................................................159
Figure 5.2 Variation of the potential of a rotating gold electrode in aerated 0.2 M
thiosulfate solutions at different pH values and copper concentrations ...161
Figure 5.3 Effect of the addition of copper ions (2 mM Cu) on the mixed
potentials of rotating gold and platinum electrodes in aerated 0.2 M
thiosulfate solutions at pH 7 .....................................................................162

xviii
Figure 5.4 Anodic polarization of a rotating platinum electrode in deoxygenated
0.2 M thiosulfate solutions containing 0 mM, 0.5 mM and 5 mM Cu
ions at pH 7 ...............................................................................................163
Figure 5.5 Anodic polarization of a rotating gold electrode in deoxygenated 0.2M
thiosulfate solutions containing 0 mM, 0.5 mM and 5 mM Cu ions at
pH 7 ..........................................................................................................164
Figure 5.6 Anodic polarization of a rotating platinum electrode in deoxygenated
0.2 M thiosulfate solutions containing 0 mM, 0.5 mM and 5 mM Cu
ions at pH 12 .............................................................................................164
Figure 5.7 Anodic polarization of a rotating gold electrode in deoxygenated0.2 M
thiosulfate solutions containing 0 mM, 0.5 mM and 5 mM Cu ions at
pH 12 ........................................................................................................165
Figure 5.8 Anodic polarization curves of a rotating gold electrode in
deoxygenated 0.2 M thiosulfate solutions containing 0.5 mM Cu ions
at various pH values .................................................................................165
Figure 5.9 Current-time transients at the gold electrode in 0.2 M thiosulfate
solutions with and without copper at 0.3 V, pH 12 and 20 °C .................167
Figure 5.10 Dissolution of gold powder in oxygenated 0.2 M thiosulfate solutions
at pH 12 with and without copper at 25 °C ..............................................169
Figure 6.1 Mixed potentials for a rotating (400 rpm) gold electrode in oxygenated
alkaline AsO3S3- solutions ........................................................................179
Figure 6.2 Cyclic voltammogram of a stationary gold electrode in deoxygenated
0.1 M Na3AsO3S solution at pH 12 ..........................................................180
Figure 6.3 Cyclic voltammograms of rotating gold and platinum electrodes in
deoxygenated 0.1 M Na3AsO3S solutions at pH 12 .................................180
Figure 6.4 Successive voltammograms of a rotating gold electrode in
deoxygenated 0.1 M Na3AsO3S solutions at pH 12 .................................181
Figure 6.5 Cyclic voltammograms of gold with and without rotation in
deoxygenated 0.1 M Na3AsO3S solutions at pH 12 .................................181
Figure 6.6 Variation with time of the anodic current on a rotating (200 rpm) gold
electrode at 0.25 V in a deoxygenated 0.5 M Na3AsO3S solution at pH
13 ...............................................................................................................182
Figure 6.7 Cathodic reduction of oxygen on a rotating (400 rpm) gold electrode
in an oxygenated 0.1 M AsO3S3- solution at pH 12 .................................183

xix
Figure 6.8 Dissolution of gold in oxygenated alkaline solutions containing 0.2 M
S2O32-; 0.1 M AsO3S3-; 1 mM S2O3
2- at 25 °C and pH 12 ........................184
Figure 6.9 Variation of pH, potential, and gold concentration during reaction of
gold with an aerated solution of 0.046 M As2S54- at 25 °C.......................189
Figure 6.10 Variation of pH, potential and gold concentration during reaction of
gold with an aerated solution of AsS33- and AsO3
3- at 25 °C ...................189
Figure 7.1 X-ray diffraction diagram for pure arsenopyrite sample from
Gemstone House .......................................................................................197
Figure 7.2 X-ray diffraction diagram for pure arsenopyrite sample from Socklich
Trading Company .....................................................................................197
Figure 7.3 X-ray diffraction diagram for pure pyrite sample ....................................198
Figure 7.4 Atomic molar ratios of sulfur species to total dissolved sulfur during
the oxidation of pyrite by air ....................................................................199
Figure 7.5 Variation of solution potential, pH, concentration of gold and
dissolved oxygen during the oxidation of pyrite by air ............................200
Figure 7.6 Variation of concentrations of Au, Cu, Fe and thiosulfate during the
oxidation of pyrite by air ..........................................................................201
Figure 7.7 Molar ratio of total sulfur/total arsenic during the oxidation of
arsenopyrite with air .................................................................................202
Figure 7.8 Molar fractions of sulfur species/total dissolved sulfur during the
oxidation of arsenopyrite with air ............................................................202
Figure 7.9 Molar fractions of arsenic species/total dissolved arsenic during the
oxidation of arsenopyrite with air ............................................................203
Figure 7.10 Scanning electron micrograph of arsenopyrite particles after oxidation
in an aerated 1.25 M NaOH solution ........................................................204
Figure 7.11 Optical microscopic photograph of an arsenopyrite electrode after
oxidation in an aerated 1.25 M NaOH solution ........................................205
Figure 7.12 Dissolution of Au, As and Fe during oxidation of arsenopyrite milled
with and without gold powder ..................................................................207
Figure 7.13 Variation of the potential, pH and dissolved oxygen of the pulp during
oxidation of arsenopyrite milled with and without gold powder ..............207
Figure 7.14 Variation of the concentrations of thiosulfate and monothioarsenate
during oxidation of arsenopyrite milled with and without gold powder ...208
Figure 7.15 SEM photograph for fine gold particles wet-milled together with
FeAsS mineral in a stainless steel mill .....................................................210

xx
Figure 7.16 XRD diagrams for wet-milled arsenopyrite minerals in the presence
and absence of gold powder .....................................................................211
Figure 7.17 Dissolution rates of arsenopyrite with different particle sizes in
aerated 1.25 M NaOH solutions ...............................................................212
Figure 7.18 Variation of thiosulfate and monothioarsenate during oxidation of
pure arsenopyrite of different particle sizes in 1.25 M NaOH solutions ..213
Figure 7.19 Dissolution rate of arsenopyrite and gold in 1.25 M NaOH solutions
with different agitation speeds .................................................................214
Figure 7.20 Variations of the concentrations of thiosulfate and oxygen during the
oxidation of arsenopyrite in 1.25 M NaOH solutions with different
agitation speeds ........................................................................................215
Figure 7.21 Potentials of gold electrode and concentrations of monothioarsenate
during the oxidation of arsenopyrite in aerated 1.25 M NaOH
solutions at two agitation speeds ..............................................................215
Figure 7.22 Oxidation of arsenopyrite in aerated 1.25 M NaOH solutions at
different pulp densities ..............................................................................217
Figure 7.23 Variation of the gold dissolved during the oxidation of arsenopyrite in
aerated 1.25 M NaOH solutions at different pulp densities .....................217
Figure 7.24 Generation of thiosulfate and monothioarsenate during the oxidation
of arsenopyrite in aerated 1.25 M NaOH solutions at different pulp
densities ....................................................................................................218
Figure 7.25 Variation of pH values and oxygen concentrations during the
oxidation of arsenopyrite in aerated 1.25 M NaOH solutions at
different pulp densities .............................................................................218
Figure 7.26 Potentials of gold, platinum and arsenopyrite electrodes during the
oxidation of arsenopyrite in aerated 1.25 M NaOH solutions (pulp
densities =30 g l-1) ....................................................................................220
Figure 7.27 Variation of potentials of gold and arsenopyrite electrodes during the
oxidation of arsenopyrite in aerated 1.25 M NaOH solutions at
different pulp densities ..............................................................................220
Figure 7.28 Effect of oxygen partial pressure on the oxidation of arsenopyrite in
1.25 M NaOH solutions ............................................................................222
Figure 7.29 Effect of oxygen partial pressure on gold dissolution during the
oxidation of arsenopyrite in 1.25 M NaOH solutions ..............................223

xxi
Figure 7.30 Variation of thiosulfate formed during the oxidation of arsenopyrite in
1.25 M NaOH solutions at various oxygen partial pressures ...................223
Figure 7.31 Oxidation of arsenopyrite with air in solutions of different initial
NaOH concentrations ...............................................................................224
Figure 7.32 Dissolution rates of gold during the oxidation of arsenopyrite with air
in different NaOH solutions .....................................................................224
Figure 7.33 Formation of thiosulfate during the oxidation of arsenopyrite with air
in different NaOH solutions .....................................................................226
Figure 7.34 Oxidation of arsenopyrite in 1.25 M NaOH solution with air at
different temperatures................................................................................226
Figure 7.35 Dissolution rates of gold during the oxidation of arsenopyrite by air in
1.25 M NaOH solutions at different temperatures ....................................227
Figure 7.36 Variation of thiosulfate concentration during the oxidation of
arsenopyrite in aerated 1.25 M NaOH solutions at different
temperatures .............................................................................................228
Figure 7.37 Variation of oxygen concentration during the oxidation of
arsenopyrite by air in 1.25 M NaOH solutions at different
temperatures .............................................................................................228
Figure 7.38 Mixed potentials of gold and arsenopyrite electrodes during the
oxidation of arsenopyrite by air in 1.25 M NaOH solutions at different
temperatures .............................................................................................229
Figure 7.39 Oxidation of arsenopyrite in 1.25 M NaOH solutions in the presence
and absence of 0.05 M thiosulfate, and in the presence of 0.1 g sulfur ....230
Figure 7.40 Concentrations of gold and copper during the oxidation of
arsenopyrite with 0.1 g sulfur, with and without 0.05 M thiosulfate in
aerated 1.25 M NaOH solutions ...............................................................230
Figure 7.41 Effect of the addition of thiosulfate or elemental sulfur on the
concentration of thiosulfate during the oxidation of arsenopyrite in
aerated 1.25 M NaOH solutions ...............................................................231
Figure 7.42 Effect of oxygen partial pressure on the initial rate of arsenopyrite
oxidation (Data from Figure 7.28) ...........................................................245
Figure 7.43 Logarithms of initial rates versus logarithms of average particle sizes
(Data from Figure 7.17) ............................................................................246
Figure 7.44 Arrhenius plot for the oxidation of arsenopyrite (Data from
Figure7.34) ...............................................................................................247

xxii
Figure 7.45 Determination of the apparent reaction order of arsenopyrite with
respect to NaOH concentration (Data from Figure 7.31) .........................251
Figure 8.1 Effect of milling time on rates of extraction of Au and Cu during the
oxidation of Wiluna concentrate with air .................................................267
Figure 8.2 Effect of milling time on rates of extraction of As, S and Fe during the
oxidation of Wiluna concentrate with air .................................................267
Figure 8.3 Variation of concentrations of thiosulfate and monothioarsenate and
potential of gold electrode during the oxidation of Wiluna concentrate
with air for various milling times .............................................................268
Figure 8.4 Dissolution of gold and copper during the oxidation of milled Wiluna
concentrate in different NaOH solutions with air ....................................269
Figure 8.5 Dissolution of arsenic and sulfur during the oxidation of milled
Wiluna concentrate in different NaOH solutions with air ........................269
Figure 8.6 Variation of concentrations of thiosulfate and dissolved oxygen during
the oxidation of milled Wiluna concentrate in different NaOH
solutions with air ......................................................................................270
Figure 8.7 Dissolution of gold, copper and iron during the oxidation of milled
Wiluna concentrate with air and oxygen ..................................................271
Figure 8.8 Dissolution of arsenic and sulfur during the oxidation of milled
Wiluna concentrate with air and oxygen ..................................................271
Figure 8.9 Variation of concentrations of thiosulfate and dissolved oxygen during
the oxidation of milled Wiluna concentrate with air and oxygen ............272
Figure 8.10 Dissolution of gold, copper and iron during the oxidation of milled
Wiluna concentrate with air at various temperatures ...............................273
Figure 8.11 Dissolution of arsenic and sulfur during the oxidation of milled
Wiluna concentrate with air at various temperatures ...............................273
Figure 8.12 Variation of concentrations of thiosulfate and dissolved oxygen during
the oxidation of milled Wiluna concentrate with air at various
temperatures .............................................................................................274
Figure 8.13 Dissolution of gold and copper during the oxidation of milled Wiluna
concentrate at different times ...................................................................275
Figure 8.14 Dissolution of arsenic, sulfur and iron during the oxidation of milled
Wiluna concentrate at different times ......................................................276
Figure 8.15 Concentration profiles of thiosulfate, arsenate, sulfite and sulfate
during the oxidation of milled Wiluna concentrate at different times .....276

xxiii
Figure 8.16 Dissolution of gold, arsenic, sulfur, copper and iron during the
oxidation of milled Macraes concentrate with air at 25 °C ......................278
Figure 8.17 Variation of concentrations of thiosulfate, arsenate, sulfite and
monothioarsenate during the oxidation of milled Macraes concentrate
with air at 25 °C ........................................................................................278
Figure 8.18 Dissolution of gold, arsenic, sulfur, copper and iron during the
oxidation of milled unknown concentrate with air at 25 °C .....................281
Figure 8.19 Variation of the concentrations of thiosulfate and monothioarsenate
during the oxidation of milled unknown concentrate with air at 25 °C ...281
Figure 8.20 Correlation of the dissolution of gold with the dissolution of arsenic
and sulfur during the oxidation of milled Wiluna concentrate under
various conditions .....................................................................................284
Figure 8.21 Correlation of the dissolution of gold with the oxidation of
arsenopyrite and pyrite and with the dissolution of sulfur and arsenic
based on analyses of residues after 48 hours’ oxidation of milled
Wiluna concentrate under various conditions ..........................................284
Figure A3 Plot of mass transfer coefficient vs. particle diameter for freely falling
spheres ......................................................................................................327
Figure A4.1 XRD pattern for a Wiluna flotation concentrate sample ..........................328
Figure A4.2 XRD pattern for a Macraes flotation concentrate sample ........................328
Figure A5.1 Size distribution of particles resulted from wet-milling 150 grams of
Wiluna gold concentrate in a stainless steel mill for 120 minutes ...........329
Figure A5.2 Size distribution of particles resulted from wet-milling 150 grams of
Wiluna gold concentrate in a stainless steel mill for 60 minutes .............329
Figure A5.3 Size distribution of particles resulted from wet-milling 150 grams of
Wiluna gold concentrate in a stainless steel mill for 20 minutes .............330
Figure A5.4 Size distribution of particles resulted from wet-milling 25 grams of
pure arsenopyrite in a stainless steel mill for 60 minutes .........................330

xxiv
LIST OF TABLES
Table 2.1 Physical properties of gold ...........................................................................9
Table 2.2 Stability constants for selected Au(I) and Au(III) complexes and
standard reduction potentials for the corresponding reactions at 25 °C......13
Table 2.3 Selected redox reactions involving thiosulfate ...........................................25
Table 2.4 Stability constants for selected metal thiosulfate complexes at 25 °C .......29
Table 2.5 A selection of proposed thioarsenite species ..............................................55
Table 2.6 Dissociation constants of the acids of thioarsenates at 25 °C ....................56
Table 2.7 Some published kinetic data for the alkaline oxidation of arsenopyrite ....72
Table 2.8 Some physical properties of pyrite .............................................................75
Table 3.1 Chemicals and minerals used .....................................................................90
Table 3.2 Relationships between O2 concentration and the potential of O2 sensor ..102
Table 3.3 Standard solutions for HPLC ...................................................................117
Table 3.4 Calibration curves for various species using HPLC .................................119
Table 4.1 Average dissolution rates of gold in 1 M Na2S2O3 and 0.1 M NaOH
solutions at various potentials over 12.5 hours at 23 °C, 1000 rpm
rotation ......................................................................................................134
Table 4.2 Effect of rotation speed on the average anodic dissolution rate of gold
in a solution containing 1 M Na2S2O3 and 0.1 M NaOH at 0.25 V, 25
°C over 12.5 hours ....................................................................................139
Table 4.3 Effect of temperature on the average anodic dissolution rate of gold in
1 M Na2S2O3 solutions and 0.1 M NaOH solution at 0.25 V, 200 rpm
over 12.5 hours .........................................................................................140
Table 4.4 Effect of pH on the average anodic dissolution rate of gold in 1 M
Na2S2O3 solutions at 0.25 V, 25 °C and 200 rpm rotation over 12.5
hours .........................................................................................................142
Table 4.5 Effect of Na2S2O3 concentration on the average anodic dissolution rate
of gold in 0.1 M NaOH solutions at 0.25 V, 25 °C, 200 rpm over 12.5
hours .........................................................................................................144
Table 4.6 Effect of ammonia concentration on the average anodic dissolution
rate of gold in 1 M Na2S2O3 solutions with pH 10.6 at 0.25 V, 25 °C,
200 rpm over 12.5 hours ...........................................................................146
Table 4.7 Some possible reactions of thiosulfate in alkaline aqueous solutions ......149

xxv
Table 5.1 Average rates of anodic dissolution of gold in 0.2 M thiosulfate
solutions with different copper at 0.3 V, pH 12 and 20 °C ......................166
Table 5.2 Atomic absorption assay of gold- and copper-thiosulfate bearing
solutions, before and after reaction with selected reagents ......................175
Table 6.1 Results of testwork on the dissolution of gold in thioarsenite solutions ..190
Table 7.1 Size distribution and composition of a crushed arsenopyrite sample ......196
Table 7.2 Solubility of ferric ions in monothioarsenate and arsenate solutions .......209
Table 7.3 Semi-quantitative SEM/EDAX analysis for a fine gold particle after
wet-grinding .............................................................................................209
Table 7.4 Dissolution of gold in oxygenated alkaline NaOH solutions after
milling with elemental sulfur ...................................................................232
Table 7.5 Concentrations of the various species formed during the reactions of
arsenite with sulfur species at 25 °C ........................................................234
Table 8.1 Sodium hydroxide required for complete oxidation of arsenopyrite or
pyrite .........................................................................................................261
Table 8.2 Fire assay (Au) and ICP analyses for the flotation gold concentrates ......262
Table 8.3 Average head assays of the Macrase concentrate sample ........................264
Table 8.4 Oxidation of Salsigne concentrate with air at 25 °C for 48 hours ............279
Table A1 Free energies of formation (kcal mol-1) (1 kcal = 4.184 kJ) .....................322
Table A2 Results of an experiment with Wiluna concentrate ..................................332

Chapter 1 Introduction 1
CHAPTER 1 INTRODUCTION
1.1 Background to this Study
Almost all gold currently produced from ores in the world is extracted by the
cyanidation process, which was firstly recognized as early as 1783 and studied in the
1840's and 1850's. Between 1887 and 1888, the cyanidation process was patented and
later developed into a commercial process in 1889 (Marsden and House, 1992). The
process depends on the fact that gold forms an exceptionally strong bond with cyanide
ions to give the aurous di-cyanide complex. In deed, the stability constant for this species
is sufficiently large for gold to be oxidized by oxygen in the presence of cyanide ions.
Thus the leaching of gold from its ores is accomplished by bubbling air through a slurry
of crushed ore in alkaline (pH=10) cyanide solution. The cyanidation process is so
simple, efficient and economical that it has spread rapidly all over the world and has
been the most important extraction process for the extraction of gold and silver from
their respective ores for over a century.
Although it is an effective technique for the treatment of a wide range of ores, the
cyanidation process has several drawbacks and is not suitable for the direct extraction of
gold and silver from some kinds of ores and concentrates, for the following reasons:
(1) Cyanide is an extremely toxic compound, creating the need for expensive
transportation, storage and cleanup procedures and resulting in a series of
environmental and health problems related to the industrial use of cyanide and the

Chapter 1 Introduction 2
disposal of toxic cyanide waste. The cyanidation process is under scrutiny and more
stringent environmental and health standards are being established. Several countries
no longer allow the construction of new gold processing plants using cyanide (Han
and Meng, 1992).
(2) The leaching kinetics of gold and silver with cyanide is slow, with the leaching rate
being controlled by the diffusion of oxygen that has limited solubility in water. Under
most plant conditions, the leaching of gold normally takes at least 24 hours for an
economically acceptable recovery of gold.
(3) Gold occurs in refractory ores and concentrates.
The word, “refractory”, literally means “difficult to treat”. The so-called
refractory gold ores cannot be easily and/or economically treated directly by
conventional cyanidation processes, yielding unsatisfactorily low extractions of gold and
silver. Generally, three basic causes account for the “refractory” characteristics of ores
(Kontopoulos and Stefanakis, 1990):
a) Gold is often locked in oxidizable gangue minerals, often sulfides, and cannot be
adequately liberated, even by fine grinding, so that it is not accessible to the leaching
reagents, resulting in low recovery. This appears most commonly as physical
encapsulation of very finely disseminated gold particles within a mineral that is
unreactive and impermeable to the cyanide leaching solution. A typical mineral of
this type is arsenopyrite (Rapson, 1997, Marsden and House, 1992).
b) Reactive constituents present in the mineral matrix consume unacceptable quantities
of cyanide and/or oxygen in side reactions, for example, pyrrhotite, arsenopyrite,
copper oxides (Davis and Tran, 1991).

Chapter 1 Introduction 3
c) Carbonaceous materials naturally occurring in some ores can adsorb the aurocyanide
complex during cyanide leaching and result in low extraction of gold from ores. This
phenomenon is known as pre-robbing (Thomas, 1991b).
The “easily cyanidable “ gold ores with exploitable grades are becoming rapidly
depleted around the world and more and more ore bodies are proving to be refractory to
some extent. Since refractory gold ores are not amenable to direct cyanidation, particular
pretreatment processes are required prior to conventional cyanidation in order to improve
the recovery of gold. Numerous pretreatment processes have been developed to
overcome the refractory nature of some gold ores and to increase the extraction of gold
and silver (Souza and Ciminelli, 1992; Wu, et al., 1999; Xu et al., 1999; Corrans and
Angove, 1991; Luganov et al., 1996; Dunn and Chamberlain, 1997; Koslides and
Ciminelli, 1992; Van Weert et al., 1986; Syrtlanova et al., 1979; Kostina and Chernyak,
1979; Thomas, 1991b, c; Kontopoulos and Stefanakis, 1990; Dunn et al., 1989; Linge
and Welham, 1997; Li et al., 1992). Some of these techniques are pre-aeration,
chlorination, roasting, pressure oxidation, bacterial oxidation, ultra-fine grinding,
chemical oxidation, electrochemical oxidation and high-pressure cyanidation. All the
additional pretreatment techniques result in an increase in the overall production cost and
thus are often not economically viable. Of these techniques, high temperature roasting,
pressure oxidation and bacterial oxidation have found application in the gold industry,
although each of them is subject to its particular advantages and shortcomings.
Alkaline oxidation may be the preferred treatment option for arsenical sulfide
ores in certain situations. Thermodynamically, oxidation occurring in alkaline media
would be advantageous because arsenopyrite and pyrite are not stable at low potentials
(Ciminelli, 1987; Ciminelli and Osseo-Asare, 1995a, b; Tao et al., 1994; Kostina and

Chapter 1 Introduction 4
Chernyak, 1979; Wang et al., 1992). The use of an alkaline oxidation pretreatment
process has several technical merits such as the following (Deng, 1995; Deng, 1992):
Simpler flowsheet for gold recovery by cyanidation; •
•
•
•
•
•
•
•
Lower operating temperature (usually less than 100 °C);
Fewer corrosion problems with materials of construction;
Lower capital and operating costs, and
Suitability for acid-consuming ores and concentrates.
However, in comparison with many developed acid pretreatment processes, the alkaline
oxidation route has received very limited attention for refractory gold ores and only the
Barrick Mercur Gold Mine, Nevada, used alkaline pressure oxidation on a commercial
scale for the pretreatment of refractory gold ores (Thomas and Williams, 2000; Thomas,
1991a, b; Hiskey and Sanchez, 1995). The drawbacks of alkaline oxidation such as the
use of relatively expensive reagents, e.g. sodium hydroxide (NaOH) and higher operating
pressures have restricted the commercial application of this process (Deng, 1995).
Additionally, gold extraction by cyanidation after pretreatment by alkaline oxidation
normally does not exceed 85%, although some investigators reported 90 to 99%
recoveries of gold by cyanidation from products of autoclave oxidation in NaOH
solutions (Koslides and Ciminelli, 1992; Bhakta et al., 1989).
To overcome the above shortcomings, several new attempts have been made to
increase gold recovery and decrease the operating and capital costs of alkaline oxidation
processes, including:
Simultaneous fine-grinding and leaching of gold by hypochlorite (Mao et al., 1997);
Simultaneous fine-grinding and leaching of gold by cyanide (Min et al., 1999);
Simultaneous pressure oxidation and gold leaching by thiosulfate (Lulham, 1989);

Chapter 1 Introduction 5
Ultra-fine grinding and oxidation under ambient conditions (Syrtlanova et al., 1979;
Rossovsky, 1993);
•
•
•
Gold leaching by a lime-sulfur mixture (Lan and Zhang, 1996), and
Gold leaching by oxidation products of sulfur in lime solution with oxygen (Fang and
Han, 2002).
More recently, it has been found that during the alkaline oxidation by dissolved oxygen
of refractory arsenopyrite bearing gold concentrates, the gold in the concentrates was
simultaneously dissolved by a reaction which has not yet been identified (Zhang and
Nicol, 1999). Independent Metallurgical Laboratories (Anon., 1999) in Western
Australia also performed similar experiments and observed a similar phenomenon. They
attributed the dissolution of gold to possible leaching by thiosulfates formed during the
oxidation process or the complexation of gold with chlorides present in the water used.
1.2 Scope of this Study
As mentioned above, gold was simultaneously leached out during the alkaline
oxidation of the refractory arsenopyrite bearing gold concentrates. It is necessary to
study the chemistry of the alkaline oxidation of gold concentrates and relevant pure
minerals such as arsenopyrite (FeAsS), pyrite (FeS2) and chalcopyrite (CuFeS2),
especially FeAsS because arsenic and sulfur in the arsenopyrite mineral both can
dissolve in alkaline solutions, forming species which might influence the behaviour of
gold. Rossovsky (1993) has proposed that thioarsenites (AsS33-) and thiosulfates (S2O3
2-)
are present in such solutions. On the other hand, there is no consensus on the oxidation
products of arsenopyrite and little is known about the formation of arsenic-sulfur
compounds during the oxidation of arsenopyrite and their effects on the dissolution of
gold which might take place during the oxidation. Therefore, part of this study focuses

Chapter 1 Introduction 6
on the chemistry of the oxidation of arsenopyrite and gold concentrates in alkaline
solutions and the reaction of some arsenic-sulfur compounds with gold.
Another part of the study is devoted to the dissolution behavior of gold during the
alkaline oxidation of arsenopyrite and refractory gold concentrates, and to the effects of
some process variables on the kinetics of the dissolution of gold.
Since thiosulfate is a probable oxidation product of refractory sulfidic gold ores
in alkaline solutions, part of this study is also engaged in a study of the dissolution of
gold in alkaline solutions containing thiosulfate. Although extensive studies on the
kinetics and mechanism of gold dissolution in ammoniacal thiosulfate media have been
carried out (Aylmore and Muir, 2001), the thiosulfate leaching system for gold and silver
has been found to be very complicated and is not fully understood, which in turn hinders
its development and application in the gold industry. The successful development and
utilization of the thiosulfate leaching system will depend on a detailed knowledge of the
leaching mechanism. Further research on reactions of thiosulfate with gold is necessary
so as to better understand the reaction mechanism and control the solution chemistry. In
this part, the effect of copper on the dissolution of gold is investigated because of the
common presence of copper bearing minerals like chalcopyrite in refractory sulfidic gold
ores.

Chapter 1 Introduction 7
1.3 Objectives of this Study
The following are the main objectives of the research project:
1) To study the effects of various parameters on the kinetics of the oxidation of
refractory gold concentrates containing arsenopyrite and pyrite at ambient
temperatures and pressures;
2) To investigate the simultaneous dissolution of gold, arsenic and sulfur species in
aerated alkaline solutions;
3) To establish the chemistry (including electrochemistry) of the reaction system so that
optimization and control of the process can be accomplished on a rational basis.
1.4 Overview of this Thesis
The thesis is sub-divided into the following main sections:
Chapter 2 presents an overview of the relevant chemistry of gold, arsenic and sulfur
and reviews the literature on the dissolution of gold in thiosulfate and
arsenic bearing solutions, and on the oxidation of refractory sulfidic gold
ores.
Chapter 3 describes the experimental set up and the analyses and test procedures used.
Chapter 4 deals with the studies of the electrochemical dissolution of gold in alkaline
solution. It discusses the mechanism of the dissolution of gold and the
effects of various parameters.

Chapter 1 Introduction 8
Chapter 5 considers the effect of copper and grinding on the dissolution of gold in
alkaline thiosulfate solutions without ammonia.
Chapter 6 summarizes the results of a study of the behaviour of gold in alkaline arsenic
bearing solutions by means of electrochemical and leaching techniques.
Chapter 7 deals with the kinetics of dissolution of gold, arsenic and sulfur during the
alkaline oxidation of the pure sulfide minerals, arsenopyrite and pyrite. The
effects of some parameters on the oxidation of arsenopyrite are also
investigated.
Chapter 8 reports on the alkaline oxidation of selected refractory gold concentrates and
the dissolution of gold during the oxidation.
Chapter 9 provides some conclusions and recommendations.

Chapter 2 Review of the Literature 9
CHAPTER 2 REVIEW OF THE LITERATURE
2.1 The Chemistry of the Hydrometallurgy of Gold
2.1.1 General Properties of Gold
Gold is the noblest of all metals. From ancient times, it has been valued as the
‘king of metals’, excelling all others in its beautiful yellow color, bright luster, ductility
and stability in air. Even today its special interest is connected with its value as a metal
(Remy et al., 1956). It is a soft metal and is usually alloyed to give it more strength.
Metallic gold also has high electrical and conductivity properties that have led to its
widespread use in modern industries in more recent decades. Table 2.1 lists some of the
physical properties of gold.
Table 2.1 Physical properties of gold (after Greenwood and Earnshaw, 1997)
Molar atomic weight / g mol-1 196.967 Melting point / °C 1064 Boiling point / °C 2808 Density / g cm-3 at 20 °C 19.32 Electrical resistivity / µ Ω cm at 20 °C 2.35 Electronegativity 2.4

Chapter 2 Review of the Literature 10
Gold is the only metal that is generally found in nature in the metallic state, and
the only gold compounds that exist in a natural state are the tellurides and stibnites,
AuTe2 and AuSb2. It is almost invariably associated with quartz or pyrite, both in veins
and in alluvial or placer deposits (Greenwood and Earnshaw, 1997). Gold is the only
metal that is not oxidized in air (even at high temperatures) or water by either oxygen or
sulfur, and is not attacked under the most corrosive conditions (Bailar et al., 1973).
Of greater importance in gold hydrometallurgy is the chemistry of gold
complexes in aqueous solutions. It has been well known that gold can occur in one of six
oxidation states, from -1 to +5 (Puddephatt and Vittal, 1994), which can be related to its
relatively high electronegativity, i.e. tendency to attract bonding electrons. The most
ubiquitous forms of gold compounds and those of hydrometallurgical interest are those in
the aurous (+1) or auric (+3) oxidation state.
2.1.2 Chemistry of the Dissolution of Gold
The dissolution of gold in aqueous solutions is a combined process of oxidation
and complexation. In the presence of a complexing ligand, aurous or auric cations will
form stable complexes or be reduced by water to metallic gold (Nicol, et al., 1987). It is
also often necessary to add a pH modifier, either acid or alkali, to maintain an optimum
pH for the dissolution of gold. From an electrochemical viewpoint, the dissolution of
solid metallic materials is an electrochemical process, which involves separate anodic
(oxidative) and cathodic (reductive) reactions (Nicol, 1993). For the dissolution of gold
in aqueous solutions, the anodic process involves oxidation of the gold according to the
following reactions:
Au+ + e- = Au0 E°= 1.691 V (2.1)

Chapter 2 Review of the Literature 11
Au3+ + 3e- = Au0 E°= 1.498 V (2.2)
E° is the standard reduction potential (King, 1994). The cathodic process that occurs
simultaneously with the above reactions involves reduction of an appropriate oxidant.
In the absence of complexing ligands, the aurous ion (Au+) is thermodynamically
unstable under all potential-pH conditions, as indicated by its higher reduction potential
than the auric ion (Au3+) reduction potential. At these high potentials, both the aurous
and the auric ions will undergo spontaneous reduction to gold with the oxidation of water
to oxygen, given that E° = 1.229 V (King, 1994) for the following reaction:
O2 + 4H+ + 4e- = 2H2O (2.3)
This means that gold can not be oxidized in aqueous solutions in the absence of
complexing ligands.
The stability of the ions can, however, be increased in the presence of appropriate
ligands, such as cyanide, chloride and thiosulfate ions, by forming stable complexes,
Au+ + 2L = AuL2+ (2.4)
Au3+ + 4L = AuL43+ (2.5)
where L is a complexing ligand. The stability constants, β2 and β4, for the Au+ and Au3+
complexes can be expressed as follows:
β2 = [AuL2+]/[Au+][L]2 (2.6)
β4 = [AuL43+]/[Au3+][L]4 (2.7)
By combining Equations 2.1 and 2.4, Equation 2.8 is obtained and the standard reduction
potential at 25 °C is given by Equation 2.9 according to the Nernst equation (Nicol et al.,
1987):
AuL2+ + e- = Au + 2L (2.8)
2n0592.0
Au/Auo
Au/AuLo log)(EE 2 β−= ++ (2.9)

Chapter 2 Review of the Literature 12
where n is the number of electrons involved in the reaction (here n = 1). Similarly,
Equations 2.10 and 2.11 can be obtained (n = 3).
AuL43+ + 3e- = Au + 4L (2.10)
4n0592.0
Au/Auo
Au/AuLo log)(EE 33
4 β−= ++ (2.11)
There are a number of ligands that can form aurous or auric complexes with a
wide range of stability. However, only a limited number of ligands form aqueous
complexes of sufficient stability for use in gold extraction processes. Some of these
complexes are listed in Table 2.2 in which the stability constants and the standard
reduction potentials of the corresponding reduction reactions are given. The stability of
the gold complexes is related not only to the properties of the complexing ligand, but
also more specifically to the donor atom of the ligand that is bonded directly to the gold
atom. Two general rules apply (Nicol et al., 1987). The first is that the stability of gold
complexes tends to decrease when the electronegativity of the donor atom increases. For
example, the stability for the gold halide complexes in aqueous solution follows the order
I- > Br- > Cl- > F-. The second rule is that Au(III) is generally favored over Au(I) with
hard ligands and Au(I) over Au(III) with soft ligands. Thus soft polarizable ligands
containing less electronegative donor atoms such as S, C, Se, P, As and I form more
stable complexes with Au(I), whereas hard (more electronegative) electron donor ligands
with F, Cl, Br, O, N donor atoms prefer Au(III). The preferred co-ordination number of
Au(I) is 2 and that of Au(III) is 4, with Au(I) tending to form linear complexes and
Au(III) tending to form square planar complexes. In water, aurous and auric ions exist in
the hydrated state as complexes Au(H2O)2+ and Au(H2O)4
3+, although they are generally
represented as Au+ and Au3+.

Chapter 2 Review of the Literature 13
Table 2.2 Stability constants for selected Au(I) and Au(III) complexes and standard reduction potentials for the corresponding reactions at 25 °C.
Complex Log β Reduction Reaction E°/V Ref.
- - Au+ + e- = Au 1.69 a Au(CN)2
- 38.3 Au(CN)2- + e- = Au + 2CN- -0.57 a
Au2(HS)2S2- 72.9 Au2(HS)2S
2- + 2e- = 2Au + S2- + 2HS- -0.47* c
AuS- 36.3 AuS- + e- = Au + S2- -0.46 b Au(HS)2
- 32.8 Au(HS)2- + e- = Au + 2HS- -0.25* c
Au(SO3)23- 26.8 Au(SO3)2
3- + e- = Au + 2SO32- 0.11* c
Au(S2O3)23- 26.0 Au(S2O3)2
3- + e- = Au + 2S2O32- 0.15 b
Au(CSe(NH2)2)2+ 25.3* Au(CSe(NH2)2)2
+ + e- = Au + 2CSe(NH2)2 0.20 b Au(CS(NH2)2)2
+ 22.0 Au(CS(NH2)2)2+ + e- = Au + 2CS(NH2)2 0.38 b
Au(NH3)2+ 19.0* Au(NH3)2
+ + e- = Au + 2NH3 0.57 b AuI2
- 19.0* AuI2- + e- = Au + 2I- 0.57 b
Au(SCN)2- 17.1 Au(SCN)2
- + e- = Au + 2SCN- 0.66 a AuBr2
- 12.0 AuBr2- + e- = Au + 2Br- 0.98* a
AuCl2- 9.0* AuCl2
- + e- = Au + 2Cl- 1.16 b - - Au3+ + 3e- = Au 1.50 a Au(CN)4
- ∼56 Au(CN)4- + 3e- = Au + 4CN- 0.40* a
Au(NH3)43+ ∼59 Au(NH3)4
3+ + 3e- = Au + 4NH3 0.33 d AuI4
- 47.7 AuI4- + 3e- = Au + 4I- 0.56* a
Au(SCN)4- 42 Au(SCN)4
- + 3e- = Au + 4SCN- 0.62 a AuBr4
- 32 AuBr4- + 3e- = Au + 4Br- 0.87* a
AuCl4- 26 AuCl4
- + 3e- = Au + 4Cl- 1.00 a a. from Nicol et al., 1987; b. from Hiskey and Atluri, 1988; c. from Webster, 1986; d. from Skibsted and Bjerrum, 1974a, b; * calculated from E° values or β values with Equations 2.9 or 2.11.

Chapter 2 Review of the Literature 14
As can be seen in Table 2.2, the most stable complex is that with cyanide and this
has been of greatest importance in gold industry with the establishment of the
cyanidation process. Other non-cyanide gold complexes of hydrometallurgical interest
are those involving thiourea, thiocyanate, thiosulfate, sulfide and the halide complexes.
These ligands are potential competitive alternatives to cyanide which has come under
scrutiny due to increased environmental and occupational health pressures in recent
years. Despite extensive laboratory studies, none has found commercial application on a
large scale (Sparrow and Woodcock, 1995). The leaching of gold by cyanide and other
ligands in aqueous solutions will be briefly summarized in the following Section 2.1.3,
except for thiosulfate which will be reviewed in detail in Section 2.2. In Section 2.3,
some gold bearing compounds formed with arsenic are also briefly reviewed.
2.1.3 The Leaching of Gold with Various Lixiviants
2.1.3.1 Cyanidation
Cyanidation is the most common method by which gold is recovered from its
ores. After more than 100 years in use, a substantial body of empirical experience has
been published and a solid theoretical framework has been established (Sparrow and
Woodcock, 1995). In the cyanidation process for the extraction of gold, gold is oxidized
and dissolves in aqueous alkaline cyanide solution in the presence of dissolved oxygen as
an oxidant, forming the Au(I) cyanide complex, Au(CN)2-. The overall reaction for the
leaching of gold may be expressed by the following equation:
4Au + 8CN- + O2 + 2H2O = 4Au(CN)2- + 4OH- (2.12)

Chapter 2 Review of the Literature 15
In order to represent the equilibrium chemistry of the cyanidation reaction, it is
often convenient to use the Eh-pH diagram (also called as Pourbaix diagram) which is
widely utilized in hydrometallurgical processes (Burkin, 1966; Marsden and House,
1992). Figure 2.1 gives an Eh-pH diagram for the gold-water-cyanide-oxygen system at
25 °C and [CN-] = 10–3 M. The two dashed lines indicate the equilibria for the reduction
of water to hydrogen (lower line),
2H2O + 2e- = H2 + 2OH- E° = - 0.0591 pH - 0.0295 log (pH2) (2.13)
and for the reduction of oxygen to water (upper line),
O2 + 4 H+ + 4e- = 2H2O E° = 1.23 – 0.0591 pH + 0.0147 log (Po2) (2.14)
respectively, where pH2 and Po2 are the partial pressure of hydrogen and oxygen gas
respectively (Marsden and House, 1992). Between the two dashed lines is the area in
which water is stable. The shaded region indicates the area of stability of gold as the
Au(CN)2- complex in aqueous cyanide solutions over a wide range of pH values. As
illustrated in Figure 2.1, gold may be oxidized by oxygen at a potential of about -0.52 V
and will be soluble in alkaline cyanide solutions at high pH (>10). For practical purposes,
the stoichiometry of the dissolution reaction of gold is given by
Au(CN)2- + e- = Au + 2CN- E° = - 0.57 V (2.15)
while the reductive reaction of oxygen may be generally assumed to be as following:
O2 + 2H2O + 4e- = 4OH- E° = + 0.401 V (2.16)
Of greater importance in practice are the kinetic considerations that apply to the
leaching of gold. Thus, electrochemical techniques have been used to study the kinetics
and mechanism of gold dissolution in that the anodic oxidative reactions of gold and the
cathodic reductive reactions of oxygen may be studied separately (Kudryk and Kellogg,
1954). Accordingly, much work has been published on the anodic behaviour of gold in
alkaline cyanide solutions and reviewed by Nicol (1980a, b).
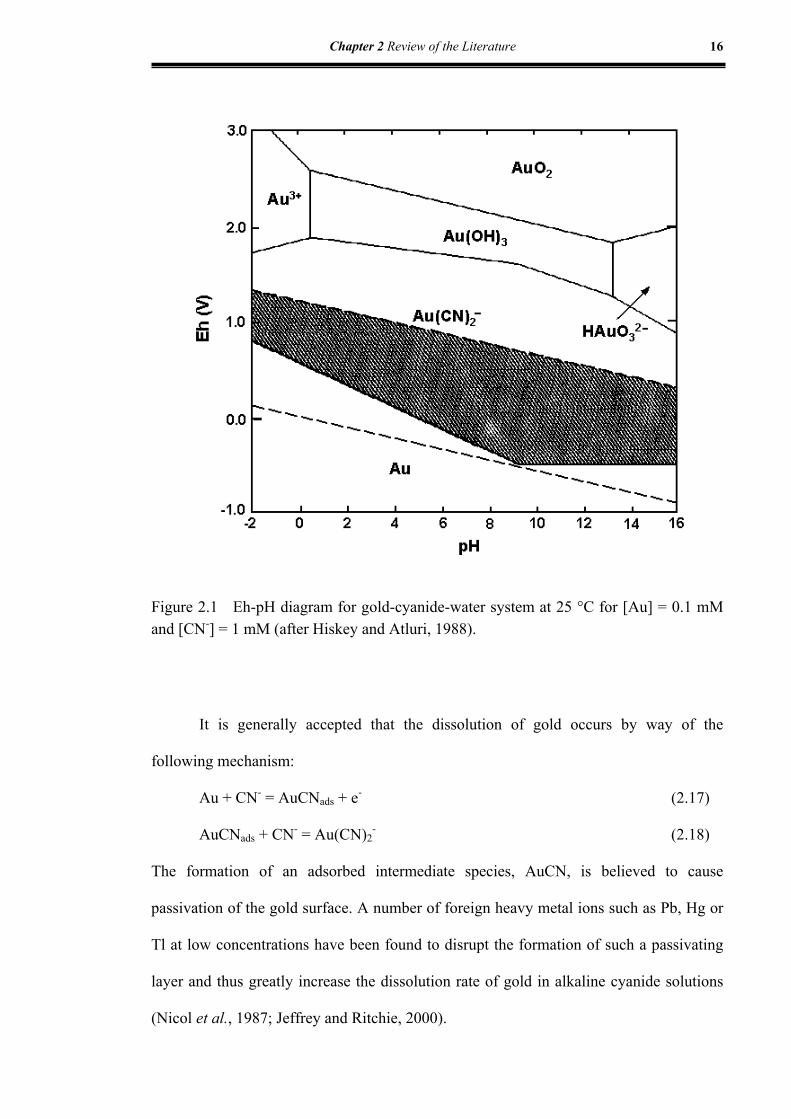
Chapter 2 Review of the Literature 16
Figure 2.1 Eh-pH diagram for gold-cyanide-water system at 25 °C for [Au] = 0.1 mM and [CN-] = 1 mM (after Hiskey and Atluri, 1988).
It is generally accepted that the dissolution of gold occurs by way of the
following mechanism:
Au + CN- = AuCNads + e- (2.17)
AuCNads + CN- = Au(CN)2- (2.18)
The formation of an adsorbed intermediate species, AuCN, is believed to cause
passivation of the gold surface. A number of foreign heavy metal ions such as Pb, Hg or
Tl at low concentrations have been found to disrupt the formation of such a passivating
layer and thus greatly increase the dissolution rate of gold in alkaline cyanide solutions
(Nicol et al., 1987; Jeffrey and Ritchie, 2000).

Chapter 2 Review of the Literature 17
The cathodic reduction of oxygen in alkaline solutions has been experimentally
shown to proceed through the intermediate formation of peroxide by the reaction
(Damjanovic et al., 1967; King, 1994)
O2 + H2O + 2e- = HO2- + OH- E° = - 0.076 V (2.19)
The hydrogen peroxide formed is a strong oxidizing agent which may take part in further
oxidation reactions:
HO2- + H2O + 2e- = 3OH- E° = 0.878 V (2.20)
Oxygen may be directly reduced to hydroxide ions, rather than to HO2- as in Equation
2.16. Generally, these reactions require a large overpotential and are very slow.
It is well established on the basis of electrochemical measurements that the
overall rate of gold dissolution in aerated alkaline cyanide solutions is controlled by the
rate of diffusion of the reactants from the bulk solution to the surface of gold i.e. the
reaction is mass transport controlled. Therefore, the leaching rate of gold can depend on
oxygen concentration, cyanide concentration, temperature and the agitation rate (Nicol et
al., 1987).
2.1.3.2 Chlorination
Chlorination was extensively applied in the nineteen century for the treatment of
ores and gold occurring with sulfides. With the advent of the cyanide process and
steadily decreasing reserves of high grade of gold ores, this method has essentially
disappeared and is used nowadays only in the refining of gold. Over the past 10 years,
the leaching of gold with chlorides has gained renewed attention due to considerable
emphasis on protection of the environment from pollution and on the treatment of

Chapter 2 Review of the Literature 18
refractory gold ores which are not amenable to traditional cyanide process (Wang et al.,
1998; Rapson, 1997; Pangum and Browner, 1996; Zyryanov and Doshlov, 1995; Li et
al., 1992; Linge and Welham, 1997; Yen and Pindred, 1989; Liu and Nicol, 2002).
As can be seen in Table 2.2, the gold chloride complexes are not as stable as the
Au(I) cyanide complex but one advantage of this is that they are therefore more easily
reduced to gold metal. The oxidation of gold in chloride media depends on the
concentration of chloride and the temperature but only occurs at potentials above about
1.2 V. Therefore, a strong oxidant such as chlorine, chlorate, hypochlorite or ozone is
required to dissolve gold at a reasonable rate. Nitric acid may also be used to achieve fast
dissolution rates. Cyclic voltammetry for the oxidation of gold in chloride solutions has
shown (Nicol, 1980a) that the anodic dissolution rate of gold is proportional to the
chloride ion concentration. Furthermore, the rate of dissolution of gold by chlorination
can be faster than that achievable in aqueous alkaline cyanide solutions because the
solubility of oxidants such as chlorine can be greater than that of oxygen in aqueous
solutions. Under the strong oxidizing conditions used during chlorination, other metals
and/or sulfide minerals may also be appreciably oxidized, thus resulting in excessively
high consumption of chlorine and poor economics of the process. Chlorination has been
suggested for gold ores containing less than 0.5% sulfur (Von Michaelis, 1987).
Other halide systems, such as bromine-bromide and iodine-iodide, are capable of
dissolving gold at very fast rates and have been studied by Dadger (1989) and Davis et
al. (1993). These systems are strongly oxidizing and able to dissolve many sulfide
minerals as the chlorine-chloride system. However, the commercial application of
bromine and iodine for gold leaching is restricted by the high cost of the reagents, the

Chapter 2 Review of the Literature 19
high cost of materials of construction to withstand the severe conditions and health risks
associated with their use (Marsden and House, 1992).
2.1.3.3 Sulfide/Polysulfides
Sulfide or polysulfide ions as lixiviants for gold have been extensively studied
and recently reviewed by Sparrow and Woodcock (1995) and Hiskey and Atluri (1988).
This subject has received considerable attention by geochemists due to its proposed
importance in the mobilization and transport of gold in the environment and in the
presence of gold in valuable minerals (Weissberg, 1970; Seward, 1973; Renders and
Seward, 1989; Shenberger and Barnes, 1989; Seward, 1993; Nekrasov, 1996). It is well
known that elemental sulfur dissolves readily in alkali sulfide solutions forming a
mixture of different alkali polysulfides, with HS- being the predominant species and
small fractions of Sn2- species becoming evident at pH values greater than 13. The
polysulfides may also be formed slowly by atmospheric oxidation of alkali sulfide
solutions with the color of the solution changing from colorless to yellow (Adams,
1994).
As shown in Table 2.2, the Au(I) complexes with polysulfides are closest to
cyanide in the relative order of stability, thus gold can readily dissolve into the
polysulfide solutions at low potentials. Krauskopf (1951) has suggested the gold complex
formed in sulfide solutions is AuS-, but now it is commonly accepted, after the work of
Seward (1973), that the gold complex Au2(HS)2S2- is predominant in strongly alkaline
solutions while the Au(HS)2- ion predominates in less alkaline solutions. The maximum
solubility of gold is about 220ppm at neutral pH at 300 °C in 0.2 M NaHS solution
(Seward, 1973). At ambient temperatures, about 10 ppm Au may dissolve (Tan and Bell,

Chapter 2 Review of the Literature 20
1990). Gold can also dissolve in aqueous solutions of ammonium polysulfides and its
dissolution rate is dependent on the temperature and composition of the solution
(Kakovskii and Tyurin, 1962; Yang et al., 1992).
Zhang et al. (1992a, b) used a lime sulfur synthetic solution (LSSS) to dissolve
more than 90% of the gold from ores and concentrates at 25 °C with the aid of ammonia
and cupric ions. The LSSS solution, containing polysulfides and thiosulfate, was
synthesized from calcium hydroxide, elemental sulfur and other additives. Zhu et al.
(1994b) also used a mixed thiosulfate/polysulfide solution to leach 90% of the gold from
ores at 25 °C with addition of ammonia, cupric catalyst and oxygen under pressure. More
recently, bio-catalyzed bisulfide leaching of gold from its ores has been reported by
Hunter et al. (1996 and 1998). Fang and Han (2002) used in situ oxidation products of
elemental sulfur in a lime slurry to leach about 86% gold from a sulfidic flotation
concentrate in an autoclave with oxygen.
2.1.3.4 Other lixiviants
Thiourea is a relatively non-toxic, reactive organic reagent for the dissolution of
heavy metals in addition to gold and silver, and thus has been proposed as an alternative
to cyanide for the treatment of sulfidic, cyanide-consuming ores, or for use in locations
where environmental concerns make the use of cyanide difficult (Marsden and House,
1992). Extensive studies on the dissolution of gold and silver with thiourea have been
reviewed by Groenewald (1975), Hiskey and Atluri (1988), Von Michaelis (1987),
Sparrow and Woodcock (1995) and recently by Zhang (1997).

Chapter 2 Review of the Literature 21
The ability of thiocyanate to dissolve gold was first reported by White (1905).
The leaching of gold with thiocyanate has been investigated subsequently by Fleming
(1986) and more recently by Chen and Pang (1997) and Barbosa-Filho and Monhemius
(1994a, b and c) who reported in detail the chemistry and kinetics of the dissolution of
gold in thiocyanate aqueous solutions.
Ammonia as a lixiviant for gold has been studied by Han and Meng (1992),
Meng and Han (1993) and Guan and Han (1996). Gold dissolves as the Au(I) di-ammine
complex Au(NH3)2+ in ammoniacal solutions. Meng and Han (1993) have reported that
the kinetics of gold dissolution are negligibly slow at low temperatures and an acceptable
rate of dissolution occurs at temperatures above 120 °C in the presence of an oxidant.
Several oxidants such as oxygen, Cu(NH3)42+, Co(NH3)4
3+ and OCl-, alone or in
combination, have been tested for gold leaching, with the cupric ammine ions in
conjunction with dissolved oxygen being the best of all the oxidants used.
Sulfurous acid as a lixiviant for gold recovery from refractory gold ores has also
been reported (Touro and Wiewiorowski, 1992). Zhang et al. (1996) studied the
solubility of gold in amino acid solutions at pH 6-8 and temperatures from 20-80 °C.
Other leaching systems using organic lixiviants such as nitriles, cyanamide, cyanoform
and CSUT(I) (an unpublished synthetic organic compound, Wang et al., 1993) for gold
dissolution have been proposed. However, despite some potential advantages, there is
little prospect for commercial development and they are at present of academic interest
only (Marsden and House, 1992).

Chapter 2 Review of the Literature 22
2.2 The Leaching of Gold with Thiosulfate
2.2.1 The Chemistry of Thiosulfate
2.2.1.1 Structure and use
Thiosulfate (S2O32-) is an anion formed by full deprotonation of the strong acid,
thiosulfuric acid (H2S2O3) which is one of many oxo-acids of sulfur:
H2S2O3 = H+ + HS2O3- pKa1 = 0.3 (2.21)
HS2O3- = H+ + S2O3
2- pKa2 = 1.7 (2.22)
where pKa is the negative logarithm of the dissociation constant Ka. (Sullivan and Kohl,
1997). However, pure H2S2O3 is too unstable to be isolated. In aqueous acidic solutions,
it rapidly decomposes with deposition of sulfur and evolution of sulfur dioxide. A series
of thiosulfuric salts is known most of which are stable even in solution (Remy, 1956).
There are two commercially available salts of thiosulfate namely, sodium thiosulfate
(also known as “hypo”), Na2S2O3·5H2O and ammonium thiosulfate, (NH4)2S2O3.
Thiosulfate ion has a structure comparable to that of the sulfate ion with one
oxygen atom replaced by a sulfur atom, as illustrated by the following structures (Remy,
1956):
S
O
OO
S
......
: :
:
: :
..
..
(-)
(-)
Thiosulfate ion Band S - S = 2.01 Å Band S - O = 1.47 Å
S
O
OO
O
......
: :
:
: :
..
..
(-)
(-)
Sulfate ion

Chapter 2 Review of the Literature 23
It is this sulfide-like sulfur atom that dominates the unique chemistry of thiosulfate
which has reducing properties, strong complexing tendencies and sulfide forming
capabilities (Hiskey and Atluri, 1988). Hence, thiosulfate is widely applied in a range of
areas including chemistry, photography, paper industry, pharmaceuticals, nuclear
industry, and medicine (Dhawale, 1993). Thiosulfate has a low toxicity with a LD50
(dose needed to kill 50% of a population) of 7.5 ± 0.752 g kg-1 for mice (Langhans et al.,
1992). Ammonium thiosulfate has also been used as a fertilizer for soils low in sulfur for
many decades. Therefore, thiosulfate is regarded as an environmentally friendly reagent
(Aylmore and Muir, 2001; Dhawale, 1993).
2.2.1.2 Redox properties and stability
Sulfur is an active element and forms numerous compounds that exist over a
range of oxidation states from –2 to 7 (Zhdanov, 1975). To illustrate the oxidation-
reduction properties of thiosulfates, it is convenient to use the Eh-pH diagram for the
metastable S-H2O system as shown in Figure 2.2 (Peters, 1986; Osseo-Asare, 1989). This
Eh-pH diagram does not include sulfate and bisulfate, as these are thermodynamically
more stable than thiosulfate, tetrathionate, sulfite, hydrogen sulfite and sulfurous acid.
As can be seen in Figure 2.2, thiosulfate is located in a narrow elongated stability
field in the neutral and alkaline pH region and is a metastable anion that tends to undergo
chemical decomposition in aqueous solutions. It may undergo oxidation to sulfite (SO32-
), polythionates (SnO62-, n = 2-5) and sulfate (SO4
2-), or reduction to elemental sulfur (S0)
and sulfide (S2-) depending on the potential and pH of the solutions. Thiosulfate acts
mainly as a reducing agent because it is oxidized to tetrathionate (S4O62-) at pH values
above about 4 due to the relatively low reduction potential of the tetrathionate to

Chapter 2 Review of the Literature 24
thiosulfate reaction (E° = 0.08 V). Trithionate and pentathionate are thermodynamically
less stable than either tetrathionate or thiosulfate, and do not appear on the Eh-pH
diagram. Given time, all sulfur species will ultimately be oxidized to sulfate, the most
stable and final degradation product. Some selected important redox reactions involving
thiosulfate are given in Table 2.3.
1614121086420-2
2.0
1.6
1.2
0.8
0.4
0.0
-0.4
-0.8
pH
Eh
(V)
S
H2S HS -
H2SO3
S2-
SO32-S2O3
2-
S2O62-
S2O82-
S4O62-
Figure 2.2 Eh-pH diagram for the metastable S-H2O system at 25 °C. [S]= 1 M. The thermodynamically stable species (i.e. sulfate ions) are omitted from consideration to reveal the metastability domain of species such as thiosulfate, sulfite (SO3
2-) and tetrathionate (S4O6
2-).

Chapter 2 Review of the Literature 25
Table 2.3 Selected redox reactions involving thiosulfate
Redox Reactions ∆G°298K* /kJ mol-1 Ref. Equation No.
Oxidation 2S2O3
2- + I3- = S4O6
2- + 3I- -88.0 a (2.23) S2O3
2- + 4Cl2 + 5H2O = 2SO42- + 8Cl- + 10H+ -829.1 a (2.24)
2S2O32- + 2Cu2+ = S4O6
2- + 2Cu+ -14.1 a (2.25) S2O3
2- + 2Fe3+ = S4O62- + 2Fe2+ -133.3 a (2.26)
2S2O32- + ½O2 + H2O = S4O6
2- + 2OH- -61.9 c (2.27) 3S2O3
2- + 2O2 + H2O = 2S3O62- + 2OH- -437.2 c (2.28)
S2O32- + 2O2 + 2OH- = 2SO4
2- + H2O -887.8 c (2.29) Reduction S2O3
2- + CN- = SO32- + CNS- -44.0** c (2.30)
S2O32- + AsO3
3- = SO32- + AsO3S3- ? f (2.31)
Dissociation S2O3
2- + 2H+ = SO2 + S0 + H2O -18.7 a (2.32) S2O3
2- + 2OH- = SO42- + S2- + H2O -53.8 a (2.33)
S3O62- + H2O = S2O3
2- + SO42- + 2H+ -65.5 d (2.34)
2S3O62- + 6OH- = S2O3
2- + 4SO32- + 3H2O -313.3 d (2.35)
S4O62- + 2OH- = S2O3
2- + SO42- + S0 + H2O -161.2 c (2.36)
4S4O62- + 6OH- = 5S2O3
2- + 2S3O62- + 3H2O -189.4 b (2.37)
2S5O62- + 6OH- = 5S2O3
2- + 3H2O -449.7 b (2.38) 4SO3
2- + 2S2- + 3H2O = 3S2O32- + 6OH- -29.5 e (2.39)
S4O62- + SO3
2- + 2OH- = 2S2O32- + SO4
2- + H2O -194.3 e (2.40) S4O6
2- + SO32- = S2O3
2- + S3O62- 31.0 b (2.41)
S4O62- + S2O3
2- = SO32- + S5O6
2- 99.1 b (2.42) a. from Tykodi, 1990; b. from Byerley et al., 1975; c. from Suzuki, 1999; d. from Naito et al., 1975; e. from Wan, 1997; f. from Bailar et al., 1973; * calculated using the thermodynamic data from Pourbaix (1974) except the ∆G°298K for S2O3
2- which is calculated from the redox potential E° (0.08 V) for the S4O62-/S2O3
2- couple. ** calculated using the ∆G°298K data from Hiskey and Atluri (1988).

Chapter 2 Review of the Literature 26
Equations 2.32 and 2.33 show that thiosulfate has a tendency to disproportionate
at low pH to sulfur and sulfur dioxide or in alkaline solutions to sulfide and sulfate. The
decomposition of thiosulfate may also be promoted by the presence of certain bacteria
and exposure to ultraviolet light (Suzuki, 1999; Tykodi, 1990; Dhawale, 1993). Thus,
efforts have been made to stabilize the thiosulfate as suggested in Equations 2.39 and
2.40 in which the addition of sulfite may inhibit the decomposition of thiosulfate
(Kerley, 1981; 1983). The use of sulfate in the stabilization of thiosulfate has been
reported (Hu and Gong, 1991) but the mechanism is unclear.
Thiosulfate will also be quantitatively oxidized by iodine (Equation 2.23), which
forms the basis of iodimetry in analytical chemistry. The reaction of thiosulfate with
chlorine (Equation 2.24) is used in the paper industry (Tykodi, 1990), while the reactions
shown in Equations 2.30 and 2.31 are employed for detoxification of cyanide and arsenic
containing solutions (Dhawale, 1993). As indicated by Equation 2.26, ferric ions can also
promote the oxidation of thiosulfate in near neutral solutions. This reaction takes place in
two stages, with a deep violet complex anion Fe(S2O3)2- being formed almost
immediately, followed by a slower decomposition of this intermediate anion (Tykodi,
1990).
The oxidation of thiosulfate by cupric ions deserves special attention because of
the use of copper ions as a catalyst and oxidant in the ammoniacal thiosulfate leach
process for gold and silver. As indicated by the Equation 2.25, the reaction of thiosulfate
with cupric ions is thermodynamically favored. In addition, copper(II) has long been
known to greatly accelerate the oxidation of thiosulfate by a variety of oxidizing agents
in aqueous solutions (Rabai and Epstein, 1992). The kinetics of the reaction (Equation
2.25) has been studied in a pure aqueous solution without any additional complexing

Chapter 2 Review of the Literature 27
agent by Rabai and Epstein (1992) who have found that the reaction is not immeasurably
fast and proceeds in steps, with the extremely rapid formation of the yellow Cu(S2O3)22-
complex and then the rapid, but relatively slower (in seconds), redox reaction forming
tetrathionate and the copper(I) thiosulfate complex. The respective reactions can be
represented by the following equations:
Cu2+ + 2S2O32- = Cu(S2O3)2
2- (2.43)
2Cu(S2O3)22- = 2CuS2O3
- + S4O62- (2.44)
The Cu(I) ions are stabilized by the excess thiosulfate in the form of the mono- or di-
thiosulfato complexes (Cu(S2O3)23- or CuS2O3
- ), most likely the Cu(S2O3)35- complex
(see Table 2.4 in the following Section 2.2.1.3). When the thiosulfate is insufficient, the
fast redox reaction is followed by slower side reactions that result in the formation of
copper sulfide and sulfate (Rabai and Epstein, 1992):
2Cu2+ + S2O32- + H2O = Cu2S + SO4
2- + 2H+ (2.45)
In alkaline ammoniacal solutions, however, the oxidation of thiosulfate by Cu(II)
is much slower and the rate is inversely dependent on the concentration of ammonia
(Byerley et al., 1973). Copper(II) ions, predominantly as the cupric tetra-ammine
complex, Cu(NH3)42+, oxidize thiosulfate initially to tetrathionate (Equation 2.25); the
latter then undergoes a subsequent disproportionation reaction to yield trithionate and
thiosulfate (Equation 2.37). The mechanism has been suggested to involve the formation
of an intermediate Cu(NH3)3S2O3 complex which gives rise to copper(I) ions and the
S2O3- radical, the latter dimerizing to tetrathionate ions. Therefore, Equation 2.25 is best
described as follows in ammoniacal solutions (Abbruzzese et al., 1995; Wan, 1997):
2Cu(NH3)42+ + 8S2O3
2- = 2Cu(S2O3)35- + S4O6
2- + 8NH3 (2.46)

Chapter 2 Review of the Literature 28
The Cu(S2O3)35- complex is the most stable copper(I) species. If the ammoniacal solution
is exposed to oxygen, the Cu(NH3)42+ ions will be rapidly reformed by oxidation of
copper(I) ions with oxygen as described in following equation:
2Cu(S2O3)35- + 8NH3 + ½O2 + H2O = 2Cu(NH3)4
2+ + 6S2O32- + 2OH- (2.47)
The mechanism of this re-oxidation has been suggested to occur via the intermediate
formation of the amminethiosulfatocopper(II) species associated with axially coordinated
dioxygen, with the following structures (Byerley et al., 1975; Breuer and Jeffrey, 2003):
CuII
NH3
NH3
O2
H3N
H3N
S2O32 -
CuII
NH3
OH2
O2
H3N
H3N
S2O32 -
Alternatively, ammonium sulfamate and ammonium sulfate have been reported to be the
chief products of oxidation of thiosulfate by oxygen in high ammonia concentrations
with copper (Naito et al., 1970). The oxidation of thiosulfate in aqueous solutions by
molecular oxygen (Equations 2.27-2.29) under normal pressures and temperatures is very
slow (Dhawale, 1993). Thus, the concentration of cupric ions is an important factor in
determining the stability of thiosulfate and the management of the reagent suite.
Increasing temperature and hydroxyl ion concentration will also promote the oxidation of
thiosulfate to sulfate by oxygen in alkaline solutions (Rolia and Chakrabarti, 1982). In
addition, the presence of sulfide minerals such as pyrite may catalyze the oxidation of
thiosulfate by dissolved oxygen in aqueous solutions (Xu and Schoonen, 1995).

Chapter 2 Review of the Literature 29
2.2.1.3 Metal complexation
Thiosulfate forms strong complex ions with a variety of metals including gold,
silver, copper, iron, cadmium, nickel, cobalt, platinum and mercury (Hiskey and Atluri,
1988; Tykodi, 1990). Several of the relevant metal complexes of thiosulfate and their
stability constants are listed in Table 2.4.
Table 2.4 Stability constants for selected metal thiosulfate complexes at 25 °C.
Complex formation log K Ionic strength Reference
Au+ + 2S2O32- = Au(S2O3)2
3- 26 dilute b Au+ + S2O3
2- = Au(S2O3)- 10.4 - d Ag+ + S2O3
2- = Ag(S2O3)- 9.2 1 b Ag+ + 2S2O3
2- = Ag(S2O3)23- 12.5 1 b
Ag+ + 3S2O32- = Ag(S2O3)3
5- 12.8 1 a 2Ag+ + 3S2O3
2- = Ag2(S2O3)34- 24.5 1 b
2Ag+ + 4S2O32- = Ag2(S2O3)4
6- 26.3 4 a 3Ag+ + 4S2O3
2- = Ag3(S2O3)45- 38.2 1 b
3Ag+ + 5S2O32- = Ag3(S2O3)5
7- 39.8 4 a 6Ag+ + 8S2O3
2- = Ag6(S2O3)810- 78.6 4 a
Cu+ + S2O32- = Cu(S2O3)- 10.4 1.6 a
Cu+ + 2S2O32- = Cu(S2O3)2
3- 12.3 1.6 a Cu+ + 3S2O3
2- = Cu(S2O3)35- 13.7 1.6 a
Cu2+ + 2S2O32- = Cu(S2O3)2
2- 4.6 0.2 c Fe3+ + S2O3
2- = Fe(S2O3)+ 1.98 0.1 a Pd2+ + 4S2O3
2- = Pd(S2O3)46- 35.0 0.3 a
Hg2+ + 3S2O32- = Hg(S2O3)3
4- 33.3 1 a Cd2+ + 3S2O3
2- = Cd(S2O3)34- 6.4 1 a
Pb2+ + 3S2O32- = Pb(S2O3)3
4- 6.2 3 a Zn2+ + 3S2O3
2- = Zn(S2O3)34- 3.3 3 a
a. from Smith and Martell (1976); b. from Hogfeldt (1982); c. from Rabai and Epstein (1992); d. from Webster (1986).

Chapter 2 Review of the Literature 30
These complexes are formed by coordination through the sulfide-like sulfur atom
in the thiosulfate molecule. There are two complexes of gold with thiosulfate, i.e.
Au(S2O3)23- and Au(S2O3)- with the former being more stable. Silver forms stable
complex ions which is why thiosulfate is used as a fixing agent in photography. Either
Cu(I) or Cu(II) may form complexes with thiosulfate but the Cu(I) complexes are much
more stable in aqueous solutions, with the Cu(S2O3)35- complex being most stable. Fe(III)
complexes with thiosulfate are unstable and are suggested as intermediates during the
oxidation of thiosulfate by Fe(III) (Tykodi, 1990; Sillen and Martell, 1964). The
complexation of Fe(II) by thiosulfate is weak and generally not considered. Other
transition metals have also been reported to form complexes with thiosulfate, with
Hg(S2O3)34-, Pd(S2O3)4
6- and Tl(S2O3)45- being very stable (Sillen and Martell, 1964;
Martell and Smith, 1982). Of importance to this study are the gold and copper complexes
which are involved in the thiosulfate leach process for gold.
2.2.1.4 Generation of thiosulfate
Thiosulfate can be commercially generated by boiling aqueous solutions of sulfite
with an excess of elemental sulfur (Equation 2.48). Of technical importance for the
preparation of thiosulfate also is the partial oxidation of polysulfides Sn2- by air
(Equation 2.49, n = 2, 3, 4,….), with full oxidation forming sulfate (Bailar et al., 1973).
Thiosulfate can also be prepared by the oxidation of a mixture of sulfides and sulfites
with iodine (Equation 2.50), by dissolving elemental sulfur in strong alkali solutions
(Equation 2.51; Tykodi, 1990; Pryor, 1960) or weak alkali (NH4OH or Ca(OH)2 slurries)
solutions (Equation 2.52; Peters, 1976). Under anhydrous conditions thiosulfuric acid
may be produced (see Equation 2.53; Bailar et al., 1973; Cotton and Wilkinson, 1988).
Kerley (1983) described a method of generating thiosulfate by Equation 2.54:

Chapter 2 Review of the Literature 31
SO32- + S0 = S2O3
2- (2.48)
2Na2Sn + 3O2 = 2Na2S2O3 + 2(n-2)S0 (2.49)
SO32- + S2- + I2 = S2O3
2- + 2I- (2.50)
4S0 + 4OH- = 2HS- + S2O32- + H2O (2.51)
12S0 + 6OH- = 2S52- + S2O3
2- + 3H2O (2.52)
H2S + SO3 = H2S2O3 (2.53)
2NH3 + SO2 + S0 + H2O = (NH4)2S2O3 (2.54)
Thiosulfates and other metastable sulfur species have been known to be
intermediate products in the inorganic and bacterial oxidation of sulfide minerals and of
great relevance to the mobilization of gold in geological environments (Lakin et al.,
1974; Peters, 1976; Rolia and Tan, 1985; Webster, 1986; Lulham, 1989).
2.2.1.5 Determination of thiosulfate
The best known method for the determination of thiosulfate is the iodimetric
titration, which is based on the quantitative oxidation of thiosulfate by iodine (Equation
2.23) and widely finds application in the titrimetric determination of oxidizing agents
(Vogel, 1962). Soluble starch is used to give a better determination of the end point or
alternatively the end point can be determined potentiometrically or amperometrically.
A comprehensive review of methods used to determine thiosulfate and other
sulfur species in solution has been made (Szekeres, 1974; Williams, 1979). Recently,
chromatographic and electrophoretic analytical techniques with particular emphasis on
ion chromatographic methods have been reviewed by O’Reilly et al. (2001) for the
separation of inorganic sulfur species in aqueous matrices. As thiosulfate ions are

Chapter 2 Review of the Literature 32
metastable in aqueous solutions, aqueous samples from metallurgical processes often
contain various sulfur ions including thiosulfate. For the determination of individual
sulfur species, normal wet chemical analytical techniques including titrimetric iodimetry
and gravimetry suffer problems because they are time-consuming and generally only
applicable to the determination of one analyte ion at a time. Ion chromatography can be
used to detect a range of sulfur ions in a single analysis with good reproducibility and
detection limits down to 10 µM in concentration and is widely used for this purpose.
Most researchers use anion exchange columns with a mixture of acetonitrile and/or
sodium carbonate as the mobile phase to selectively separate sulfur species. A broad
range of detection techniques has been used in conjunction with the ion chromatography
methods, with by far the most popular being UV spectrophotometry and conductivity.
Normally, ion chromatography techniwques can take up to thirty minutes per sample to
analyze all the species in solution (Steudel and Holdt, 1986; Barkley et al., 1993; Weir et
al., 1994; Zou et al., 1993; Miura et al., 1997).
2.2.2 The Electrochemistry of Gold in the Presence of Thiosulfate
The study of the behaviour of gold in thiosulfate solutions is complicated by the
reactivity of thiosulfate itself to oxidation and this aspect will therefore initially be
briefly reviewed.
2.2.2.1 Electrochemical oxidation of thiosulfate
Few studies have dealt with the electrochemical oxidation of thiosulfate ions on
platinum electrodes (Zhdanov, 1975). Glasstone and Hickling (1932) have examined the
anodic oxidation of thiosulfate to tetrathionate and sulfate, and obtained tetrathionate in

Chapter 2 Review of the Literature 33
the highest yield at a platinum electrode in slightly acid or neutral solutions (pH = 5-7) at
a relatively high current density (0.2 A cm-2). They have proposed that the thiosulfate is
oxidized by H2O2 produced at the anode, and not via a direct electrochemical process
involving the discharge of thiosulfate ions. Similarly, Klemenc (1939) has argued that
thiosulfate is oxidized to tetrathionate by free hydroxyl radicals created at the anode
during the discharge of the OH- ions. Voltammetric studies on a rotating platinum wire
electrode suggest that in neutral solution, thiosulfate is firstly oxidized to tetrathionate
which in turn is oxidized to dithionate through an electrochemical mechanism involving
molecular oxygen (Kuzmina and Songina, 1963). More recently, Loucka (1998) has
reported that in acidic thiosulfate solutions the platinum electrode is covered by sulfur
layers which can subsequently be oxidized to soluble sulfate.
Pedraza et al. (1988) first reported the oxidation of thiosulfate on gold in neutral
solutions in the double layer region where the gold is free of oxide layers. They have
found that thiosulfate ions decompose when in contact with gold at open circuit, leaving
a film of at least three sulfur-containing species tightly bound to the surface. A layer of
sulfur builds up during the anodic oxidation of thiosulfate, which eventually blocks the
surface of the gold electrode. However, the authors ignored the fact that gold might have
dissolved at the same time as thiosulfate oxidized because gold is not inert in thiosulfate
solutions. Recently, Zhuchkov and Bubeev (1994) studied the electrochemical oxidation
of thiosulfate ions in order to determine the dissolution kinetics of gold based on current
efficiency measurements. They have found that the current efficiency is strongly
dependent on the anodic polarization and cannot be used alone for reliable determination
of the dissolution rate of gold in thiosulfate solutions.

Chapter 2 Review of the Literature 34
2.2.2.2 Electrochemical oxidation of gold
White (1905) first studied the direct oxidative dissolution of gold metal in an
alkaline or near neutral solution of thiosulfate. This has been followed by several studies
associated with the use of thiosulfate for gold leaching, and the role of thiosulfate in the
mobilization of gold in geological environments (Kakovskii, 1957; Tyurin and
Kakovskii, 1960; Panchenko and Lodeishchikov 1971; Umetsu and Tozawa 1972;
Berezowsky et al., 1978; Kerley, 1981). The redox reaction for gold oxidation in
thiosulfate media is known to be
Au(S2O3)23- + e- = Au + 2S2O3
2- (2.55)
with a standard reduction potential of E° = 0.153 V at 25 °C (Schmid and Curley-
Fiorino, 1975; Pouradier and Gadet, 1969; Sullivan and Kohl, 1997).
The electrochemical oxidation of gold in thiosulfate solutions has been studied by
several researchers (Zhuchkov and Bubeev, 1990; Jiang et al., 1993a; Zhu et al., 1994a;
Chen et al., 1996; Breuer and Jeffrey, 2002). Jiang et al. (1993a) have found that there
are two current peaks in the steady-state anodic polarization curve for gold in thiosulfate
solutions, as shown in Figure 2.3. They suggested that the smaller current peak I (at a
potential of about 0.05 V vs. SCE) corresponds to the dissolution of gold while the
current peak II (about 0.62 V vs. SCE) is associated with the anodic oxidation of
thiosulfate ions. However, they did not provide practical evidence for the dissolution of
gold.

Chapter 2 Review of the Literature 35
-0.2 0 0.2 0.4 0.6 0.8
100
200
300
400
0
E / V (SCE)
i / (µ
A c
m -2
)
Figure 2.3 Steady state anodic polarization curve at 20 °C (2 M S2O3
2-, no Cu and ammonia, pH = 10) (after Jiang et al., 1993a).
The studies by Zhu et al. (1994a) have produced similar results using anodic
voltammetry. In solutions of low concentration of thiosulfate (0.1 M) the anodic current
is extremely low suggesting that the dissolution rate of gold in thiosulfate alone solutions
is very slow. The same authors have established by the use of electrochemical impedance
spectroscopy (EIS) that the anodic voltammetric response of a gold electrode in
thiosulfate solutions includes reactions other than the dissolution of gold such as the
oxidation of thiosulfate and the formation of passivating films of elemental sulfur on the
surface of the gold electrode.
Zhuchkov and Bubeev (1990) focused on the current peak II in Figure 2.3 during
their study on the mechanism of gold dissolution in thiosulfate media at 20 °C. They
proposed that the dissolution of gold at higher potentials could be limited by the rate of

Chapter 2 Review of the Literature 36
chemical dissolution of a passive surface film, which was suggested as being a hydrated
auric oxide. Their study shows that increasing the pH value of the solution lowers the
maximum anodic current while the rest potential becomes more positive. Although the
activation energy for the dissolution of gold was measured by the authors, the use of the
total anodic current as the dissolution rate of gold without considering the simultaneous
oxidation of thiosulfate makes this data questionable.
Ammonia has been found to increase the anodic peak currents of gold in
thiosulfate solutions in the absence of copper ions (Jiang et al., 1993a; Zhu et al., 1994a;
Breuer and Jeffrey, 2002) and is more effective than ammonium ions for the oxidation of
gold. Zhu et al. (1994a) suggested that ammonia prevents the passivation of the gold
electrode with sulfur films by being adsorbed on gold surface to form the aurous di-
ammine complex Au(NH3)2+ . The latter reacts with thiosulfate ions in the solution to
form the aurous di-thiosulfate complex, Au(S2O3)23- as shown in Figure 2.4. In the
presence of copper ions which have long been known to catalyze the oxidative
dissolution of gold in thiosulfate solutions (Tyurin and Kakovskii, 1960; Umetsu and
Tozawa, 1972; Von Michaelis, 1987), another important role of ammonia is to stabilize
copper(II) ions as the cupric tetra-ammine complex, Cu(NH3)42+ for the oxidation of
metallic gold to aurous ions (Byerley et al., 1973; Breuer and Jeffrey, 2002). Thus, based
on their detailed studies for gold-copper-thiosulfate-ammonia system, Jiang et al.
(1993a) proposed an electrochemical mechanism for the copper catalyzed leaching of
gold with ammoniacal thiosulfate as displayed in Figure 2.4. The anodic oxidative
reaction of gold is coupled to a cathodic process in which the cupric tetra-ammine
complex (Cu(NH3)42+) is reduced to cuprous di-ammine complex (Cu(NH3)2
+), which is
in turn re-oxidized by oxygen to the cupric tetra-ammine complex to complete the copper
cycle.

Chapter 2 Review of the Literature 37
Gold Surface
Aue-
Anodic Area
Cathodic Area
323243 2)()( NHNHCueNHCu +→+ +−+
++ →+ 233 )(2 NHAuNHAu
−+ +→ eAuAu
+243 )(NHCu
+23 )(NHAu
−3232 )( OSAu
−232OS
3NH
+23 )(NHCu
−OH
2O+
+
Solution
-
Anodic Area
Cathodic Area
323243 2)()( NHNHCueNHCu +→+ +−+
++ →+ 233 )(2 NHAuNHAu
−+ +→ eAuAu
+243 )(NHCu
+23 )(NHAu
−3232 )( OSAu
−232OS
3NH
+23 )(NHCu
−OH
2O+
+
+
+
Figure 2.4 Electrochemical model for the dissolution of gold in the ammoniacal thiosulfate leach system (after Jiang et al., 1993a).
However, the available data in the literature do not support this mechanism. For
example, the standard reduction potential for the Au(NH3)2+/Au couple is high (E° = 0.57
V) (see Table 2.2 in Section 2.1.2; Guan and Han, 1995), and the kinetics of the
oxidative dissolution of gold in ammoniacal solutions is extremely slow at ambient
temperatures and measurable gold dissolution occurs only at temperatures greater than
120 °C (Meng and Han, 1993; Guan and Han, 1996). Measurements in thiosulfate
solutions have shown that the rest potential of gold varies with the thiosulfate
concentration instead of the ammonia concentration, suggesting that the predominant
gold species in thiosulfate solutions is a gold thiosulfate species (Wan, 1997). Thus,
Aylmore and Muir (2001) have proposed a revised electrochemical mechanism, in which
gold reacts with thiosulfate to form Au(S2O3)23- complex ions.

Chapter 2 Review of the Literature 38
2.2.3 Leaching of Gold with Ammoniacal Thiosulfate Solutions
2.2.3.1 Thermodynamics of gold leaching
The Eh-pH diagram is a convenient way to illustrate the thermodynamics of
hydrometallurgical leaching processes. However, its use requires a good understanding
of the chemistry of the leaching system. It is known that the dissolution of gold in
aqueous thiosulfate solutions with dissolved oxygen as an oxidant is very slow and the
overall reaction can be illustrated as follows:
4Au + O2 + 8S2O32- + 2H2O = 4Au(S2O3)2
3- + 4OH- (2.56)
For leaching of gold to occur at a reasonable rate, thiosulfate, ammonia and copper(II)
must be present in solution which complicates the leaching process (Umetsu and
Tozawa, 1972; Abbruzzese et al., 1995; Wan, 1997; Jeffrey, 2001).
An Eh-pH diagram for the gold-thiosulfate-ammonia-water system has been
constructed showing the regions of stability of two main soluble gold complexes, namely
the di-ammine (Au(NH3)2+) and the di-thiosulfate complexes (Au(S2O3)2
3-) as displayed
in Figure 2.5 (Wan, 1997; Aylmore and Muir, 2001; Zipperian et al., 1988). Construction
of this Eh-pH diagram was based on a stability constant for the aurous di-ammine
complex ion of β2 = 1026 which is of a very similar magnitude as that of the aurous di-
thiosulfate complex (see Table 2.2 in Section 2.1.2).

Chapter 2 Review of the Literature 39
Figure 2.5 Eh-pH diagram for Au-NH3-S-H2O system at 25 oC (0.05 mM Au, 0.1 M S2O3
2-, 0.1 M NH3/NH4+) (after Wan, 1997).
Figure 2.6 Eh-pH diagram for Au(0)-Au(I)-Au(III)-NH3-S2O32--H2O system at 25 °C;
[Au(I)]= 10-5 M, [Na2S2O3]= 0.1 M, [NH3+NH4+]= 1 M. (after Senanayake et al., 2003).

Chapter 2 Review of the Literature 40
However, recent reviews of this data and recalculation for the stability constants
have shown that the stability constant for the di-ammine complex has been overestimated
by several orders of magnitude, being about 1019 (see Table 2.2 in Section 2.1.2;
Skibsted and Bjerrum, 1977; Guan and Han, 1995) or about 1013 (Senanayake et al.,
2003). Therefore, the area of stability of the di-ammine complex of gold shown in Figure
2.5 should be much reduced and the di-thiosulfate complex exists over the whole pH
range under alkaline conditions. Thus, Senanayake et al. (2003) recently constructed a
new Eh-pH diagram shown in Figure 2.6 indicating that the Au(S2O3)23- is the
predominant species over the entire range, particularly in the range of pH 9-11 and Eh 0
to 0.2 V which are likely to be encountered in a gold leaching circuit using the
thiosulfate-ammonia system.
As shown above, ammoniacal thiosulfate solutions containing copper ions are
very complex with many species present. An Eh-pH diagram for the copper-ammonia-
thiosulfate-water system has been established by Wan (1997) as shown in Figure 2.7.
Metallic copper is not stable in ammoniacal thiosulfate solutions. Various copper oxides,
sulfides and other species may form depending on the potential and pH of the solution. In
the presence of ammonia, copper(II) ions exist in the form of Cu(NH3)42+ in a narrow
stability region while copper(I) ions are mainly present as Cu(S2O3)35-. Oxygen can
oxidize Cu(S2O3)35- to Cu(NH3)4
2+ (see Equation 2.47) which in turn oxidizes metallic
gold to aurous ion as follows:
Au + Cu(NH3)42+ + 5S2O3
2- = Au(S2O3)23- + Cu(S2O3)3
5- + 4NH3 (2.57)
In addition, some thiosulfate degradation to tetrathionate occurs according to the
simplified overall reaction shown in Equation 2.58 (Breuer and Jeffrey, 2000):
2Cu(NH3)42+ + 8S2O3
2- = 2Cu(S2O3)35- + 8NH3 + S4O6
2- (2.58)

Chapter 2 Review of the Literature 41
Therefore, for efficient leaching of gold it is very important to maintain an optimum
concentration of the cupric tetra-amine ion in the system by controlling the pH of the
solution, the concentrations of ammonia and thiosulfate (Zipperian et al., 1988).
pH
-1. 5
1. 5
1. 0
0. 5
0. 0
-0. 5
-1. 0
0 2 4 6 8 10 12 14
Cu
Cu2S
CuS
Cu (S2O3)3 5-
Cu2+
CuO
Cu2O
CuO
Cu(
NH
3) 4 2+
Eh
(V)
Figure 2.7 Eh-pH diagram for Cu-NH3-S-H2O system at 25 °C (0.5 mM Cu, 0.1 M S2O3
2-, 0.1 M NH3/NH4+) (after Wan, 1997).
2.2.3.2 Kinetics of the Leaching of Gold
As early as the 1880’s, the recovery of gold and silver proposed by Russell and
the Von Patera process made use of thiosulfate (Von Michaelis, 1987). Copper was
found to enhance the leaching of gold. However, it was not until the late 1970s that the
work on the leaching of gold with thiosulfate was revived by Berezowsky and Sefton
(1979) who proposed the use of ammonium thiosulfate and oxygen under pressure to
recover gold, and by Kerley (1981, 1983) who developed a patented process using
copper ions and sulfites to improve the leaching of gold in ammoniacal thiosulfate
solutions. In recent years due to the environmental constraints on the use of cyanide,

Chapter 2 Review of the Literature 42
extensive studies on the kinetics and mechanism of gold dissolution with thiosulfate have
been carried out in order to understand and improve the atmospheric ammoniacal
thiosulfate leach process (Hiskey and Atluri, 1988; Barbosa-Filho et al., 1995; Sparrow
and Woodcock, 1995; Wan, 1997; Breuer and Jeffrey, 2000; Jeffrey et al., 2001). A
comprehensive review on the fundamental chemistry and extractive processes of gold
and silver in alkaline thiosulfate solutions has been published by Aylmore and Muir
(2001). In the following sections of this review, some factors affecting the kinetics,
efficiency and economics of the thiosulfate leaching processes are outlined.
1) Effect of Oxidants Since thiosulfate is readily oxidized and disproportionates
in acidic solutions, the process is required to be conducted in alkaline solutions for which
the number of potential oxidants is limited. The most economic oxidant is molecular
oxygen in air but it has been proven to be less effective under ambient conditions due to
its limited solubility in aqueous solutions and the slow reduction of oxygen at the gold
surface in the absence of copper (Webster, 1986; Jiang et al., 1993a). Thus, Berezowsky
and Sefton (1979) promoted the use of oxygen under pressure to leach gold using
ammonium thiosulfate. However, other work has not confirmed the beneficial effect of
pressure alone (Hemmati et al., 1989; Langhans et al., 1992), while the oxidative
degradation of thiosulfate is increased by the use of excessive oxygen (Byerley et al.,
1973). Hence there should only be sufficient oxygen to convert the copper (I) to
copper(II) for further gold leaching. Hydrogen peroxide and ozone oxidize thiosulfate
rapidly thus increasing the consumption of thiosulfate (Naito et al., 1970). The
dissolution of gold by thiosulfate using oxygen generated electrochemically has been
reported by Panayotov et al. (1994).
Chapter 2 Review of the Literature 43
2) Effect of Copper Copper ions are effective catalytic agents for the
dissolution of gold with thiosulfate as previously discussed. It is known that a freshly
prepared solution of sodium cuprous thiosulfate can be used to extract silver but not gold
from sulfide ores, which is attributed to the greater reactivity of cuprous ions for oxygen
(Mellor, 1929; Flett et al., 1983). Copper ions also catalyze the oxidation of thiosulfate
by oxygen or other oxidants. Consequently there should only be sufficient copper present
to maximize leaching of gold and minimize thiosulfate consumption. It has been found
that the initial rate of gold extraction but not the ultimate extraction is enhanced by
increasing the copper(II) concentration (Abbruzzese et al., 1995; Zipperian et al., 1988).
On the other hand, Jeffrey (2001) has reported that the leaching rate of gold (of 10-5 mol
m-2 s-1 magnitude) increases linearly with copper concentration at low concentrations of
less than 5 mM while at higher copper concentrations the rate of dissolution becomes
almost independent of copper concentration. Such results are consistent with that of
Langhans et al. (1992). Jeffrey (2001) suggested that the leaching rate of gold is limited
by diffusion of copper(II) to the surface of gold at low concentrations of copper but at
high copper concentrations the reaction is chemically controlled.
3) Effect of Thiosulfate Concentration Since the stability of gold complexes
with thiosulfate depends upon the concentration of thiosulfate in solution, increasing the
thiosulfate concentration is expected to increase the recovery of gold. Many investigators
have found the positive role of thiosulfate concentration (up to 2 M) in increasing the
leaching rate of gold in ammoniacal solutions (Tozawa et al., 1981; Zipperian et al.,
1988; Hemmati et al., 1989; Abbruzzese et al., 1995; Langhans et al., 1992; Breuer and
Jeffrey, 2000). However, the concentration of thiosulfate has to be controlled by
maintaining the appropriate concentration ratio of ammonia to thiosulfate in solution so
that copper can play the catalytic role involving the facile transfer between the cupric and

Chapter 2 Review of the Literature 44
cuprous states (see Section 2.2.1.2). In some cases, excess thiosulfate may result in a
negative effect on the leaching of gold. In addition, higher thiosulfate concentrations
increase thiosulfate consumption, which cause an increase in the concentrations of
degradation products such as sulfate, trithionate and tetrathionate (Byerley et al., 1973
and 1975; Cao et al., 1992). Therefore, it is important to use an optimum thiosulfate
concentration. Sulfite ions at a concentration of at least 0.05% have been used to stabilize
thiosulfate by preventing the formation of any free sulfide ion and the precipitation of
gold or silver from solution (Kerley, 1983).
4) Effect of Ammonia Concentration Ammonia is important in the leaching of
gold in thiosulfate solutions. In the absence of copper, ammonia has been suggested to
promote the leaching of gold by eliminating a passivating film of sulfur resulting from
the decomposition of thiosulfate (Jiang et al., 1993a; Chen et al., 1996). In the presence
of copper, ammonia stabilizes copper in the cupric state for the oxidation of gold.
Therefore, changing the ammonia concentration influences the stability of the copper(II)
complexes, alters the potential of the copper(II)-copper(I) redox couple and in turn
affects the dissolution rate of gold in thiosulfate solutions (Wan, 1997). This might
explain why there have been diverse reported effects of ammonia on the kinetics of
leaching of gold in thiosulfate media. For example, it has been reported that increasing
ammonia concentration increases the ultimate gold recovery, while lower gold recoveries
are obtained when the ammonia concentration is higher than 4 M (Abbruzzese et al.,
1995; Langhans et al., 1992; Hemmati et al., 1989). Jeffrey (2001) has reported that the
leaching rate of gold decreases with the increase in the concentration of ammonia
whereas Langhans et al. (1992) reported no effect of ammonia concentration on gold
extraction from a low-grade gold ores. At high concentrations of ammonia and high pH,
some solid copper species such as CuO, Cu2O and (NH4)5Cu(S2O3)3 may form, possibly

Chapter 2 Review of the Literature 45
hindering gold dissolution by coating the gold ore particles (Abbruzzese et al., 1995;
Flett et al., 1983; Chen et al., 1996).
5) Effect of Temperature Temperature has a significant effect on the rate of
gold dissolution in thiosulfate leach solutions. The leaching rate of gold has been
reported to increase with temperature in the range of 25 to 60 °C (Breuer and Jeffrey,
2000; Cao et al., 1992; Tozawa et al., 1981; Flett et al., 1983; Zipperian et al., 1988). In
contrast, Abbruzzese et al. (1995) have observed in their studies that temperature has a
negative effect on the dissolution of gold, which was ascribed to the passivation by
cupric sulfide formed on the surface of gold and to loss of thiosulfate due to
decomposition. Gold dissolution decreases between 65-100 °C and increases once again
between 100-140 °C. Above 140 °C, the oxidation of thiosulfate is extremely rapid
resulting in a decrease in gold dissolution (Tozawa et al., 1981). High temperatures will
also cause the loss of ammonia in solution to the atmosphere by volatilization (Kerley,
1981). In order to maintain the ammonia concentration it may be necessary to leach at
ambient temperatures in a sealed reactor at an appropriate pH. An apparent activation
energy of the leaching of gold in ammoniacal thiosulfate solutions has been found of
about 60 kJ mol-1, suggesting that the rate of the reaction is chemically controlled (Kim
and Sohn, 1990; Breuer and Jeffrey, 2000).
6) Effect of pH Alkaline conditions must be used to prevent the decomposition
of thiosulfate at low pH. Furthermore, in order to prevent the solubilization of some
impurities such as iron, manganese, nickel and cobalt, the pH of the solution should not
be greater than 10 (Perez and Galaviz, 1987; Niinae et al., 1996). Hemmati et al. (1989)
showed that the gold recovery generally increased with increasing pH over the pH range
of 9 to 10.5, while Breuer and Jeffrey (2000), Jiang et al. (1993b) and Yen et al. (1999)

Chapter 2 Review of the Literature 46
reported a slight decrease in leaching of gold at pH values greater than 10.5. It appears
that a pH of about 10 is appropriate for the dissolution of gold with thiosulfate.
7) Comparison with Cyanidation A number of comparative studies on the
leaching of gold in alkaline ammoniacal thiosulfate solutions and cyanide solutions have
been conducted (Hemmati et al., 1989; Langhans et al., 1992; Jeffrey et al., 2001). Two
apparent advantages of the ammoniacal thiosulfate leach system over cyanidation are its
non-toxicity and the higher initial leaching rate for gold. Jeffrey et al. (2001) have
measured the dissolution rate of pure gold in both media using a rotating electrochemical
quartz crystal microbalance and found that the reaction rate (4 × 10⁻⁵ mol m-2 s-1) is
substantially higher in freshly prepared ammoniacal thiosulfate solution containing
copper(II) than in cyanide solution (1 × 10⁻⁶ mol m-2 s-1), although the leach rate
decreases as the copper(II) reacts with thiosulfate. Extensive studies have been
conducted on pure gold (Tozawa et al., 1981; Barbosa-Filho et al., 1995; Breuer and
Jeffrey, 2000), copper sulfide concentrates (Berezowsky and Sefton, 1979; Cao et al.,
1992; Yen et al., 1999), manganese ores (Kerley, 1981 and 1983; Zipperian et al., 1988;
Hu and Gong, 1991), silver sulfides (Flett et al., 1983), oxidized ores (Langhans et al.,
1992; Abbruzzese et al., 1995; Kim and Sohn, 1990) and carbonaceous gold ores
(Hemmati et al., 1989; Wan and Brierley; 1997; Wan, 1997; Schmitz et al., 2001). Most
of these studies have shown that 80% of gold can be extracted within 1-4 hours.
Hemmati et al. (1989) compared the cost for gold extraction from a carbonaceous ore
using both thiosulfate and cyanide leach system. They have concluded that the
thiosulfate leach system has considerable economical advantage over cyanidation, while
Langhans et al. (1992) have indicated that the copper-catalyzed thiosulfate leaching
system may be competitive with conventional cyanidation methods for heap, dump, or in
situ leaching techniques where longer leach times are normally utilized.

Chapter 2 Review of the Literature 47
Newmont Gold was the first company to attempt a pilot scale thiosulfate heap
leach process as a means of recovering gold from the residue of a bio-oxidation heap
process (Wan, 1997). Because of the preg-robbing characteristics of the ore, the low-
grade carbonaceous sulfidic ore cannot be heap leached with cyanide solution after the
bio-oxidation. A thiosulfate leach system was found to be effective for extracting gold
from this carbonaceous ore and successfully applied in three pilot scale plants, which
were followed by further process development with a 300,000 ton low-grade ore heap
leach using ammonium thiosulfate. However, the process has not yet been
commercialized.
Another advantage of thiosulfate leaching is that the use of ammonia at pH values
of about 10 hinders the dissolution of iron oxides, silica, silicates and carbonates, the
most common gangue minerals found in gold-bearing ores (Abbruzzese et al., 1995).
The low affinity of the gold thiosulfate complex ions for activated carbon is an important
advantage over cyanidation for extracting gold from carbonaceous gold ores. Unlike gold
cyanide, gold thiosulfate complexes do not adsorb on carbonaceous material and much
higher recoveries of gold can be achieved (Gallagher, 1990). This is why Newmont Gold
and Barrick Gold Corporation re-examined the thiosulfate leaching of gold for their
refractory carbonaceous ores (Wan, 1997; Schmitz et al., 2001). On the other hand, this
can be a disadvantage in terms of recovery of gold from leach pulps.
The main disadvantage associated with the thiosulfate leach process is the
decomposition of the thiosulfate, which results in other problems including lower
reaction rates due to passivation after an initial rapid stage of leaching, low extraction
and high consumption of thiosulfate. The pilot scale tests at Newmont Gold Company

Chapter 2 Review of the Literature 48
have shown (Wan, 1997) that the average gold recovery from a 300,000 ton low-grade
ore heap is approximately 55 %. Ammonium thiosulfate consumption is about 5 kg t-1 for
low sulfide carbonaceous ores (without bio-oxidation) and 12-15 kg t-1 for bio-oxidized
ores. Ammonium thiosulfate consumption depends on the sulfide content, ore
characteristics and leach duration times. Another disadvantage of the thiosulfate leach
process is the lack of an economical process for recovering gold from pregnant pulps or
solutions, although a number of methods for gold recovery have been studied, including
precipitation by metals (copper, zinc, iron or aluminum) and sulfides (Aylmore and
Muir, 2001), solvent extraction (Chen et al., 1996; Virnig and Sierokoski, 1997), anion
exchange resins (Thomas et al., 1998; Nicol and O’Malley, 2001; Fleming et al., 2002),
and direct electrowinning (Gallagher et al., 1990; Abbruzzese et al., 1995). Activated
carbon commonly used for recovering gold from cyanide solutions cannot be used in
ammoniacal thiosulfate leach system due to its low affinity for gold thiosulfate
complexes.
2.2.4 Summary
Thiosulfate is a promising alternative to cyanide due to its low toxicity and
competitive leaching rate of gold in copper bearing ammoniacal solutions. Thiosulfate
leaching also decreases the interference from cations such as lead, zinc, iron and copper
commonly encountered in conventional cyanidation processes. However, the high rate of
consumption of reagents is a disadvantage which has contributed to the lack of a
successful application in the gold industry on a commercial scale. Many studies have
shown that reagent consumption and the leaching rate of gold depend upon the
composition of the leach solution, ore characteristics, temperature and leach time. The

Chapter 2 Review of the Literature 49
thiosulfate leach process is potentially applicable to refractory ores such as carbonaceous
or sulfidic ores for which cyanide is not suitable.
The chemistry of the ammoniacal thiosulfate system for the leaching of gold and
silver is complicated due to complex interactions among thiosulfate, copper, ammonia
and gold or silver. Decomposition of thiosulfate also complicates the thiosulfate leach
process. A satisfactory mechanism for the dissolution of gold has not been established,
meaning that more fundamental work is required to be carried out. For example, the
fundamental electrochemistry of the anodic oxidation of gold and of the cathodic
reduction of oxygen and redox mediators such as the copper(II)/copper(I) couple have
not been satisfactorily explored. The effect of ammonia on the anodic oxidation of gold
in thiosulfate solutions has not been full established. An appropriate recovery method for
gold from thiosulfate leach pulps is required to be developed based on a more complete
understanding of the chemistry of the system.
2.3 Arsenical Complexes of Gold
This review on the arsenical complexes of gold was initiated by an observation
that gold dissolution occurred during the alkaline oxidation of arsenical refractory gold
concentrates during work carried out in 1999 in the A. J. Parker Cooperative Research
Centre for Hydrometallurgy at Murdoch University. It was also inspired by the work of
Williams and Anthony (1990) who have found that arsenic apparently influences the
leaching of platinum group metals from ores, and the studies of Nagy et al. (1966) and
Rossovsky (1993) who reported that the thioarsenite anion, AsS33-, existed in solutions
produced by the alkaline leaching of refractory arsenical gold concentrates.

Chapter 2 Review of the Literature 50
2.3.1 Oxy-Salts of Arsenic
Arsenic is very widely distributed in nature. In aqueous solution, the commonly
encountered oxidation states of arsenic are +3, as in H3AsO3, and +5, as in H3AsO4.
Formally, a –3 oxidation state can be assigned in AsH3 (Zingaro, 1994).
Arsenious acid, H3AsO3, is formed by dissolving arsenic trioxide in water, but the
free acid has never been isolated. It can dissociate in three steps forming the three anions
H2AsO3-, HAsO3
2-, and AsO33-. The pKa for the dissociation of the first proton is 9.2,
which means that H3AsO3 is a very weak acid. Alkali metal arsenites, being soluble in
water, are frequently isolated in solid state as meta-arsenites, typically NaAsO2.
Arsenic acid, H3AsO4, can be formed by the dissolution of arsenic pentoxide in
cold water and obtained as a hydrate H3AsO4·0.5H2O, by the evaporation of a cold
aqueous solution. It is about as strong an acid as H3PO4 and forms the three anions
H2AsO4-, HAsO4
2-, AsO43- depending the pH value of the aqueous solutions. The acid
dissociation constants are pKa1 = 2.25, pKa2 = 6.77, pKa3 = 11.4 respectively. An Eh-pH
diagram for the As-H2O system is shown in Figure 2.8. The thermodynamically stable
species in alkaline solutions are HAsO42-, AsO4
3-, H2AsO3- and AsO3
3-.

Chapter 2 Review of the Literature 51
14121086420
1.0
0.8
0.6
0.4
0.2
0.0
-0.2
-0.4
-0.6
-0.8
-1.0
pH
Eh
(V)
As
HAsO32-
H3AsO3
H3AsO4
H2AsO4-
HAsO42-
AsO43-
H2AsO3-
AsO33-
Figure 2.8 Eh-pH diagram for the arsenic-water system at 25 °C and [As] = 0.1 M. Constructed using Outokumpu HSC Program (Roine, 1994). ∆G°298K for HAsO3
2- and AsO3
3- from Dove and Rimstidt (1985).
As can be seen in Figure 2.8, arsenite ion is a reducing agent in alkaline solutions
while arsenate ion can thermodynamically behave as a relatively strong oxidizing agent
in acidic solutions as shown below (E° from King, 1994).
H3AsO4 (aq) + 2H+ + 2e- = H3AsO3 (aq) + H2O E° = + 0.56 V (2.59)
AsO43- + 3H2O + 2e- = H2AsO3
- + 4 OH- E° = - 0.68 V (2.60)
Therefore, arsenite ions in basic solutions can be oxidized by species containing S-S
bonds such as thiosulfate (S2O32-), polythionates (SnO6
2-) and polysulfides (Sn2-), forming
thioarsenates. For example (Mellor, 1929; Bailar et al., 1973),
AsO33- + S2O3
2- = AsO3S3- + SO32- (2.31)
AsO33- + S2
2- = AsO3S3- + S2- (2.61)

Chapter 2 Review of the Literature 52
In acid solutions, arsenite ions undergo reaction with thiosulfate forming the yellow di-
arsenic tri-sulfide (As2S3). An induction period has been observed in the study of this
reaction which has been attributed to the formation of an intermediate arsenic thiosulfate,
As(S-SO2-OK)3, which subsequently undergoes decomposition (Zingaro, 1994):
2As(S2O3)3K3 = As2S3 + 3SO2 + 3S0 + 3K2SO4 (2.62)
Arsenate ions can be reduced in a solution containing a non-oxidizing acid to arsenious
state by a number of reductants such as Cu+, Ti3+, Fe2+, Sn2+, S2-, SO2 and I2. For
example,
H3AsO4 + SO2 + H2O = H2SO4 + H3AsO3 (2.63)
2H3AsO4 + 5H2S = As2S3 + 2S0 + 8H2O (2.64)
There are a great number of metal salts containing arsenite or arsenate ions
(Mellor, 1929; Greenwood and Earnshaw, 1997). Generally alkaline earth metal salts are
less soluble than those of the alkali metals and heavy metal salts tend to be insoluble.
Normally, iron arsenites and arsenates are insoluble in water. Guibourt (Mellor, 1929)
has reported that some ferrous hydroxide dissolves in solution when the freshly
precipitated hydroxide is digested with an aqueous solution of arsenic trioxide. When
ferric sulfate, chloride, or nitrate is treated with a solution of arsenic trioxide or an alkali
arsenate, all the ferric salt will not be precipitated. Guibourt has also found that when
ferric hydroxide is mixed with a saturated solution of arsenic trioxide and sodium
hydroxide, after cooling and standing for 24 hours, a yellow substance is obtained with
the composition of ferric pyroarsenite, Fe4(As2O5)3·7H2O which forms a deep red
solution with sodium hydroxide. Neutral and acid ferric arsenates are quickly and
completely dissolved by concentrated ammonia, yielding a blood-red solution while the
basic ferric arsenates, however, do not dissolve. The above phenomena indicate that the
chemistry of iron arsenic compounds is complex and not well understood.

Chapter 2 Review of the Literature 53
There are very few simple inorganic compounds of gold with arsenic.
Stavenhagen (Mellor, 1929) reported gold arsenite, AuAsO3·H2O to be formed when a
solution of auric chloride in 50 percent of alcohol is treated with potassium arsenite. This
gold arsenite is freely soluble in water, in an excess of the precipitating agent, in aqueous
ammonia and in diluted acids. When a warm solution of auric chloride is mixed with
sodium orthoarsenate, a yellow-white precipitate of gold arsenate, AuAsO4 is produced
(Mellor, 1929). Au3AsO4 exists with a free energy of formation at 25 °C (∆G°298K) of –
297.7 kJmol-1 (Barin, 1989).
2.3.2 Sulfides and Thiosalts of Arsenic
Realgar, As4S4 and orpiment, As2S3 are naturally occurring arsenic sulfides and
can also be prepared artificially from aqueous solutions by reaction of As(III) and As(V)
with H2S. For example,
2As3+ + 3H2S = As2S3 + 6H+ (2.65)
2As5+ + 5H2S = As2S5 + 10H+ (2.66)
They are insoluble in water but sufficiently acidic to dissolve in alkali sulfide solutions to
form thiosalts with S2- acting as the base (Remy et al., 1956; Zingaro, 1994).
As2S3 + 3S2- = 2AsS33- (thioarsenite ion) (2.67)
If arsenic trisulfide is allowed to react with ammonium polysulfide, the sulfur dissolved
in the reagent brings about oxidation to thioarsenate:
As2S3 + 3S2- + 2S0 = 2AsS43- (thioarsenate ion) (2.68)
The thioarsenite and thioarsenate anions are stable in alkali, but the free acids H3AsS3
and H3AsS4 are not and spontaneously decompose into arsenic sulfides and H2S.

Chapter 2 Review of the Literature 54
Thioarsenite and arsenite ions can be formed simultaneously by the action of alkalis on
arsenic trisulfide:
As2S3 + 6OH- = AsS33- + AsO3
3- + 3H2O (2.69)
Thioarsenite is expected to be present to some extent during the oxidation of arsenopyrite
in alkaline solutions (Nagy et al., 1966; Rossovsky, 1993).
The details of the chemistry of thioarsenite are poorly understood. There is a lack
of general agreement with regard to the speciation and molecular form of thioarsenite
complexes and a variety of stoichiometries have been proposed (Mellor, 1929; Sillen and
Martell, 1964; Spycher and Reed, 1989; Webster, 1990; Eary, 1992; Helz et al., 1995;
Young and Robins, 2000). Table 2.5 gives some selected complexes of thioarsenite and
their free energies of formation at 25 °C.
Young and Robins (2000) suggested that the reactions of amorphous As2S3 in
water could be written:
2As2S3 (am) + 3H2O = As3S63- + H2AsO3
- + 2H+ pH >9.2 (2.70)
2As2S3 (am) + 3H2O = As3S5(SH)2- + H3AsO3 (aq) + 2H+ pH 6.5-9.2 (2.71)
2As2S3 (am) + 3H2O = HAs3S4(SH)2 (aq) + H3AsO3 (aq) pH <6.5 (2.72)
while Helz et al. (1995) have proposed that in sulfide solutions at a pH less than 7, As2S3
dissolves via the following reactions:
1.5As2S3 + 1.5H2S = As3S4(SH)2- + H+ (2.73)
As3S4(SH)2- + H+ +3HS- = 3AsS(SH)2
- (2.74)
At higher pH values, AsS2(SH)2- is formed from AsS(SH)2- by deprotonation.
Zakaznova-Iakovleva and Seward (2002) have reported spectroscopic evidence for
H3AsS30 and H2AsS3
- from 25 to 300 oC in a brief abstract. However, Wood et al. (2002),
in a Raman study, found that while general conditions could be defined under which

Chapter 2 Review of the Literature 55
thioarsenite species were dominant with respect to their oxo analogues, the system
appeared to be more complex than previously thought. They could not precisely identify
the thio components in solution.
Table 2.5 A selection of proposed thioarsenite species
Complexes Proposed ∆G°298K / kJ mol-1 pH Reference
AsS33- - > 12 d
AsS2- -47.28 6 - 9 a
As3S63- -55 > 9.2 a
As3S5(SH)2- -106 6.5 – 9.2 a As3S4(SH)2
- -139 1 - 7 a HAs3S4(SH)2 -180 < 6.5 a
AsS(SH)2- -38 8 - 12 c
AsS2(SH)2- - 8 - 12 c As2S4
2- -23.90 2 - 10 b HAs2S4
- -71.11 2 - 10 b As4S7
2- -102.63 4 - 9 b As2S5
4- - 10.5 d a. from Young and Robins, 2000; b. from Akinfiev et al., 1992; c. from Helz et al., 1995; d. from Prasad, 1987.
A variety of thioarsenate tetrahedral ions AsSnO4-n3- are also known and may be
isolated depending on the precise reaction conditions (Mellor, 1929; Schwedt and
Rieckhoff, 1996), as indicated by Equations 2.31, 2.61 and 2.68. The acids of these
thioarsenate ions are mild as shown in Table 2.6 in which the dissociation constants of
the acids and relevant salts are given.

Chapter 2 Review of the Literature 56
Table 2.6 Dissociation constants of the acids of thioarsenates at 25 °C (after Schwedt and Rieckhoff, 1996; Macintyre, 1992)
Thioarsenate Acid Dissociation Reaction pKs
H3AsO3S = H2AsO3S- + H+ pKs1 = 3.3
H2AsO3S- = HAsO3S2- + H+ pKs2 = 7.2
Na3AsO3S·12H2O, Na3AsO3S·11H2O, Na3AsO3S·6H2O
H3AsO3S
HAsO3S2- = AsO3S3- + H+ pKs3 = 11.0
H3AsO2S2 = H2AsO2S2- + H+ pKs1 = 2.4
H2AsO2S2- = HAsO2S2
2- + H+ pKs2 = 7.1
Na3AsO2S2·11H2O, Na3AsO2S2·7H2O, Na3AsO2S2·2H2O
H3AsO2S2
HAsO2S22- = AsO2S2
3- + H+ pKs3 = 10.9
Na3AsOS3·11H2O H3AsOS3 HAsOS32- = AsOS3
3- + H+ pKs3 = 10.8
Na3AsS4·8H2O H3AsS4 HAsS42- = AsS4
3- + H+ PKs3 = 5.2
Studies of the chemistry of thioarsenates are few. The monothioarsenate and
dithioarsenate anions have structures as described by the following forms (Macintyre,
1992).
As
S
OO
O
......
: ::
:
: :
..
..
(-)
(-)(-)
AsO3S3- ion Bond length: As-O 167, As-S 214,
S-O 314 pm Bond angles: OAsO 107.5-109.3°,
OAsS 107.5-113.3°.
As
S
OS
O
......
: ::
:
: :
..
..
(-)
(-)(-)
AsO2S23- ion
Bond length: As-O 169, As-S 212-215, S-O 312-315 pm
Bond angles: OAsO 107.0°, OAsS 109.6°, SAsS 110.8°.

Chapter 2 Review of the Literature 57
Schwedt and Rieckhoff (1996) have reported that monothioarsenate is the most stable of
the thioarsenates over the entire pH range although acid solutions of monothioarsenate
become turbid (Mellor, 1929). Dithioarsenate has maximum of stability at pH 3, 5-6 and
10, while decomposing to H2S and a yellowish precipitate in acid solutions (Mellor,
1929). Tetrathioarsenate is stable in solution only at pH values higher than 10. It may
also be oxidized to arsenate and sulfate by several oxidizing agents such as iodine,
peroxide and K3Fe(CN)6 (Bailar et al., 1973; Macintyre, 1992). For example,
AsO3S3- + 4I2 + 10OH- = AsO43- + SO4
2- + 8I- + 5H2O (2.75)
Several compounds of transition metals formed with thioarsenite or thioarsenate
are probably double salts: for example, enargite, CuAsS4 as 3Cu2S·As2S5; Proustite,
Ag3AsS3 as 3Ag2S·As2S3; lorandite, Tl2As4S7 as Tl2S·2As2S3 (Mellor, 1929). Gold
compounds are few. Berzelius has reported that a yellow precipitate of gold sulfarsenite,
2AuS3·3As2S3 (suspect formula) is formed when a solution of sodium sulfarsenite and a
gold salt are mixed together (Mellor, 1929). When sodium orthosulfarsenate is used, gold
orthosulfarsenate, AuAsS4 can be precipitated from an aqueous solution of an auric gold
salt. The dark brown precipitate is soluble in water and the solution can be decolorized
by ferrous sulfate with a yellowish-brown precipitate being formed. If sodium
pyrosulfarsenate is the precipitant, then gold pyrosulfarsenate, Au4(As2S7)3 is obtained as
a reddish-brown precipitate that is soluble in water. Loeken and Tremel (1998) have
recently reported evidence of one gold thioarsenate compound, K2AuAsS4. This
compound forms orange, plate-like crystals that were found to be slightly air-sensitive
and decompose in water.
Chapter 2 Review of the Literature 58
2.3.3 Effect of Arsenic on the Dissolution of Gold
The behaviour of gold in hydrothermal solutions has been of great interest to
economic geologists and geochemists, and arsenical complexes of gold have received
considerable attention in the hydrothermal transport and deposition of gold because of
the discovery of gold-arsenic deposits in rocks with high arsenic concentrations
throughout the world (Nekrasov, 1996; Seward, 1993).
Thioarsenites have long been assumed to play a role in the complexation of
elements of Group 1B (Cu, Ag, Au) in a variety of sulfide-rich environments when
arsenic is present (Clarke and Helz, 2000; Tossell, 2000a) since arsenic is a very soft
donor atom and forms its most stable complexes with soft metals such as Au, Pt, Pd
(McAuliffe, 1987). A number of geochemists (Grigor’yeva and Sukneva, 1981;
Nekrasov and Gamyanin, 1978; Akhmedzhakova et al., 1988 and 1991) have measured
the solubility of gold in aqueous solutions in the presence of stibnite (Sb2S3) and/or
orpiment (As2S3) in the temperature range from 200 to 300 °C. Nekrasov and Gamyanin
(1978) studied the effect of arsenic as a metal or orpiment (As2S3) on the solubility of
gold in alkaline sodium hydroxide (NaOH) solutions at 200 °C. They reported that the
solubility of Au in alkaline arsenic solutions at 200 °C was greater by a factor of 103 than
in the same solution without arsenic, with the values being 0.003-0.007 and 4.9-8.6 ppm
respectively. They have suggested that gold in alkaline solutions may occur in complexes
of the type Au(As2)2- (suspect formula), Au(As2)2- or Au(AsS2)2-, Au(AsS3)2- and
Au(AsS2)0. Figure 2.9 gives the relationship between the solubility of gold and
concentration of As in alkaline (0.5 M NaOH) solution at 200 °C in the presence of
orpiment.

Chapter 2 Review of the Literature 59
As ( mg l-1 )
Au
( mg
l-1 )
Figure 2.9 Relationship between solubility of Au and concentration of As in 0.5 M NaOH solution at 200 °C in the presence of As2S3. (after Nekrasov and Gamyanin, 1978).
Grigor’eva and Sukneva (1981) measured the solubility of gold in 0.1 M
solutions of NaOH, Na2S and Na2Sn (n ≥ 2) at 200 °C in the absence or presence of
As2S3. They also found that the addition of As2S3 to the NaOH solution increased the
solubility of gold by 2-3 orders. The mechanism for the solubility enhancement by As2S3
is not known. Akhmedzhakova et al. (1988) studied the solubility of gold in acidic
aqueous chloride-sulfide solutions in the presence of orpiment at 200 and 300 °C. Their
results indicate that the solubility of gold increases with increasing arsenic concentration.
They proposed that addition of arsenic to Au-S-Cl-H2O system may lead to the formation
of a heteropolynuclear compound of the type H2(AuAs)S30 at 200 °C. However, the
complexity of the system makes their results inconclusive.

Chapter 2 Review of the Literature 60
Nekrasov (1996) synthesized an unknown gold sulfoarsenide with empirical
formula Au4AsS3 while determining the solubility of gold in sulfide-arsenic solutions at
300 °C. They have suggested that gold migration in hydrothermal solutions is more
probable in the form of heteropolynuclear complexes of the type Au(AsS3)2- and
Au(AsS2)0. Seward (1981) also suggested the probable existence of such polynuclear
complexes. As3S63- and Sb2S6
3- are possible ligands which may play an important role in
hydrothermal gold transport (Seward, 1993). Nutt and co-workers (Nekrasov, 1996) have
suggested that the formation of gold-pyrite-arsenopyrite ore bodies in the jaspilite
deposits of Broomstock in Zimbabwe is associated with the presence of the Au(AsS3)2-
complex.
More recently, the ternary complex, CuAsS(SH)(OH) has been found to have an
unusually high stability and makes a large contribution to the total concentrations of both
Cu and As in sulfide solutions equilibrated with Cu and As sulfide minerals (Clarke and
Helz, 2000; Tossell, 2000a, 2001). Based on quantum mechanical calculations, Tossell
(2000b) has found that complexes with similar structures exist for Au+ and Tl+
coordinated to AsS(SH)(OH)-, and AuAsS(HS)(OH) is considerably more stable than the
aquo ion Au+. He suggested that the Au+ and AuSH complexes of AsS(SH)(OH)- or
AsS(SH)2- may be implicated in “invisible gold” in arsenical pyrite. Unfortunately, their
work on thioarsenite chemistry has been of a theoretical nature.
In summary, the presence of arsenic in solution could have some influence on the
dissolution of gold in aqueous solutions but the mechanism for this function is not clear
and has not been satisfactorily investigated, although the existence of some complexes of
gold with thioarsenites has been suggested.

Chapter 2 Review of the Literature 61
2.4 Alkaline Oxidation of Refractory Sulfide Gold Ores
2.4.1 Gold Recovery from Refractory Sulfide Ores
One of the major challenges currently experienced by the gold industry is the
efficient recovery of precious metals from refractory ores containing arsenopyrite
(FeAsS) and pyrite (FeS2) which are important host minerals for gold. The most common
association of gold with these sulfide minerals are in gaps and fractures of the minerals,
along boundaries between sulfides and other minerals, locked within sulfide mineral
grains, in sub-microscopic form as inclusions or in solid solution and possibly as a lattice
constituent of the minerals (Gasparrini, 1983). Gold normally occurs as discrete grains
with particle size from 200 microns to fractions of a micron. In arsenopyritic minerals,
gold can be invisible as solid solution even when present at levels of 1% (Craig and
Vaughan, 1990; Vaughan et al., 1989). The treatment of sulfide deposits has been of
major interest in recent years due to continued exhaustion of oxidized gold ores
(Marsden and House, 1992; Deng, 1995; Sparrow and Woodcock, 1995).
Gold can be recovered via direct cyanidation if it exists as liberated or exposed
discrete grains. But gold in solid solution or as minute inclusions in sulfides responds
poorly to conventional cyanidation or other alternative lixiviants, even after ultra-fine
grinding of ores to 5 microns (Dunn et al., 1989; Corrans and Angove, 1991). Therefore,
gold recovery from arsenopyrite-pyrite bearing ores requires breakdown of the crystal
structure of the host minerals by oxidation, followed by conventional cyanidation. A
more complex process is therefore required to affect the recovery of gold from such ores.

Chapter 2 Review of the Literature 62
There are pyrometallurgical and hydrometallurgical options for arsenical sulfide
oxidation. Extensive studies on the treatment of arsenical sulfide gold ores have been
carried out worldwide, that have led to the industrial establishment and application of
roasting, pressure oxidation and bacterial oxidation processes (Fraser et al., 1991; Robins
and Jayaweera, 1992; Deng, 1995; Sparrow and Woodcock, 1995; Fleming, 1998). These
processes have individual advantages and disadvantages. Almost all hydrometallurgical
and pyrometallurgical processes for gold recovery utilize the cyanidation process as a
means of gold dissolution from the residues after the above pretreatment processes,
resulting in higher costs for the overall process and the increasing environmental
pressure associated with disposal of cyanide.
2.4.1.1 Roasting
Roasting is a traditional option for oxidation of arsenical sulfide ores, which
involves high temperature combustion in the presence of oxygen, resulting in the
conversion of sulfur to sulfur dioxide and arsenic to arsenic trioxide. Equation 2.76
shows the reaction for the roasting of arsenopyrite.
2FeAsS + 5O2 = Fe2O3 + As2O3 + 2SO2 (2.76)
Roasting is simple in principle but has two major disadvantages. Firstly, gold recovery
may still be low; for example, only 60-70% extraction is achieved in some cases (Dunn
et al., 1989). Secondly, the highly toxic arsenic-bearing gases from the roaster cause
severe environmental problems and impose strict legal regulations regarding their
emissions (Schraufnagel, 1983; Robins and Jayaweera, 1992). These gases must be
scrubbed and treated, which can result in increased costs and this in turn has led to the
development of alternative hydrometallurgical processes (Thomas, 1991a, b and c;
Sparrow and Woodcock, 1995; Van Weert et al., 1986; Nagpal et al., 1994; Deng, 1995).

Chapter 2 Review of the Literature 63
2.4.1.2 Bio-oxidation
Bio-oxidation uses iron- and sulfur-oxidizing bacteria in acid solutions to destroy
the sulfide lattice and thereby expose the gold (Lawrence and Bruynesteyn, 1983).
Arsenopyrite is oxidized to Fe(III), As(V) and sulfate through the intermediates Fe(II),
As(III) and S(0) (Malatt, 1999). One advantage of bio-oxidation over roasting is that
toxic arsenic can be precipitated from solution using lime, which limits the
environmental hazards of arsenic. Other advantages are that it is carried out under
ambient conditions and has relatively low reagent costs (Gilbert et al., 1987). However,
bacterial oxidation generally produces acid and lime must be used to thoroughly
neutralize and raise the pH to values required for cyanidation. Furthermore, it is subject
to large residence times and sensitivity to operating conditions, which can give rise to
inconsistent plant performance and periodic high operating costs.
2.4.1.3 Chemical oxidation
Chemical oxidation processes use soluble chemical oxidants to oxidize the sulfide
minerals faster than bacterial oxidation. The best known is pressure acid oxidation that
uses high pressures and temperatures to increase the oxygen solubility and the oxidation
rate of sulfide minerals. Pressure acid oxidation generally has acceptable operating costs,
but the complexity and capital cost of a pressure leaching plant make it a more expensive
option. It also requires the use of lime to raise the pH to cyanidation levels (Kontopoulos
and Stefanakis, 1989; Deng, 1995). Therefore, alternative processes have been developed
including the Cashman, Arseno, Nitrox, electrolytic and alkaline oxidation processes
(Deng, 1995; Van Weert et al., 1986; Beattie et al., 1985; Linge and Jones, 1993; Bhakta

Chapter 2 Review of the Literature 64
et al., 1989; Thomas and Williams, 2000; Thomas, 1991a, b and c; Souza and Ciminelli,
1992) none of which have been successfully applied commercially.
2.4.1.4 Alkaline oxidation
Alkaline oxidation was first proposed and commercially used in the late 1950’s
for treating arsenical sulfide materials (Sill, 1958; Chilton, 1958; Plaksin and Masurova,
1959). Alkaline pressure oxidation was also used to treat sulfidic gold ore (Arkhipova et
al., 1975; Mason et al., 1984; Bhakta et al., 1989; Thomas, 1991a, b and c; Souza and
Ciminelli, 1992; Hiskey and Sanchez, 1995). More recently, new processes have been
proposed for the oxidation of arsenical sulfidic gold ores in alkaline solutions to extract
gold in either one or two steps (Mao et al., 1997; Min et al., 1999; Rossovsky, 1993; Lan
and Zhang, 1996; Fang and Han, 2002). The use of alkaline oxidation pretreatment has
several technical merits including the use of lower temperatures, less severe corrosion
problems and suitability for acid-consuming ores (Deng, 1995; Deng, 1992), although
the high reagent costs may be considered as a disadvantage.
2.4.2 Alkaline Oxidation of Arsenopyrite
2.4.2.1 The nature of arsenopyrite
Arsenopyrite or arsenical pyrite is the most common mineral containing arsenic
and occurs worldwide in considerable abundance in many localities. Its composition
generally deviates from its theoretical formula of FeAsS with some variation in As and S
contents ranging from FeAs0.9S1.1 to FeAs1.1S0.9 (Morimoto and Clark, 1961). It has a
molecular mass of 162.83 with a theoretical chemical composition of 34.29% Fe, 46.01%

Chapter 2 Review of the Literature 65
As and 19.69% S. It has been suggested that Fe in arsenopyrite is present as both Fe2+
and Fe3+ with Fe2+ predominant (Nesbitt et al., 1995; Tossell et al., 1981; Nickel, 1968),
and the formula of arsenopyrite is described as Fe2+(AsS)2- with a minor contribution
from Fe3+(AsS)3- (Nesbitt et al., 1995; Shuey, 1975). The As and S in arsenopyrite exist
predominantly as a dianionic group because of the covalent bond between As and S.
Arsenic is present as As0 and As-, with the last predominant (Nesbitt et al., 1995). Most
sulfur is present as S- (78%) with S2- (15%) and Sn2- as minor species. The separation of
the arsenic from the sulfur is more difficult than the separation of the iron from the
arsenic-sulfur group (Nickel, 1968).
Arsenopyrite almost always occurs as an intergrowth of two or more single
crystals in its mineral forms, which complicates the determination of its structure by X-
ray diffraction (XRD) because of the difficulty of obtaining a single crystal (Vreugde,
1982). A fairly accurate quantitative XRD analysis for arsenopyrite can be obtained from
the d131 = 1.6106 diffraction peak (Morimoto and Clark, 1961). It has a silver-white color
and specific gravity of 6.07 (Cornelis et al., 1985). Arsenopyrite is a narrow band-gap
semiconductor, and it is n-type when deficient in arsenic while p-type when it is arsenic-
rich (Shuey, 1975). Its free energy of formation is –109.6 kJ mol-1 (Vreugde, 1982;
Barton, 1969).
Arsenopyrite has considerable economic importance when it carries the major
portion of gold in the ore. The oxidation of arsenopyrite is of practical and theoretical
importance in the processing of gold ores and concentrates. However, the chemistry of
arsenopyrite in relation to its dissolution, flotation and electrochemistry has received
little attention compared with other sulfide minerals, although there are a number of

Chapter 2 Review of the Literature 66
published studies on the oxidation of arsenopyrite in acid and alkaline solutions. In the
following section a review of work on the alkaline oxidation of arsenopyrite is outlined.
2.4.2.2 Thermodynamics of oxidation of arsenopyrite
Oxidation in alkaline media is advantageous thermodynamically because lower
potentials are required to oxidize arsenopyrite as indicated by the Eh-pH diagram for Fe-
As-S-H2O system shown in Figure 2.10 (Bhakta et al., 1989; Vreugde, 1982). The
potential stability range for arsenopyrite is from about –0.6 to +0.2 V. The rest potential
of arsenopyrite has been found to increase with decreasing pH from about -0.01 V at pH
12 to 0.15 V at pH 9 (Beattie and Poling, 1987; Sanchez and Hiskey, 1991). Thus, in
alkaline media, normal oxidants such as oxygen can oxidize arsenopyrite readily to ferric
hydroxides, arsenate (HAsO42- or AsO4
3- depending on pH), and sulfate with ferrous
hydroxides and arsenites as intermediates. The overall reaction for the alkaline oxidation
of arsenopyrite can be described by the following equation (Bhakta et al., 1989;
Papangelakis and Demopoulos, 1990; Ciminelli, 1987):
2FeAsS + 10OH- + 7O2 = Fe2O3 + 2AsO43- + 2SO4
2- + 5H2O (2.77)

Chapter 2 Review of the Literature 67
14 12 10 86420
pH
1. 2
1. 0
0. 8
0. 6
0. 4
0. 2
0
- . 2
- . 4
- . 6
- . 8
Eh (
V )
FeAsO4·2H2O
Fe(OH) 3H2 AsO4¯
HAsO42
¯
AsO 43 ¯
Fe(OH) 3
Fe(OH) 2 H2 AsO
3 ¯
Fe(OH) 3H
3 AsO3
FeAsS S o
FeAsS
S o,Fe 2+ H3 AsO
3
Fe2 +
H3AsO3
SO42¯
Fe3 +
H3As O4
H 3 A
sO4
FeAs
O 4·H
2O
Fe2 +
AsO2¯
Figure 2.10 Eh-pH diagram for the Fe-As-S-H2O system at 25 °C (after Bhakta et al., 1989). Only metastable species in aqueous media are displayed.
2.4.2.3 Mechanism of the oxidation of arsenopyrite
Most studies have concentrated on the electrochemical mechanism of
arsenopyrite oxidation. Kostina and Chernyak (1976) have studied the electrochemical
oxidation of arsenopyrite in concentrated caustic soda solution at 20 °C, and reported that
the oxidation of arsenopyrite starts at -0.2 V. The potential for arsenopyrite oxidation
shifts negatively with increasing temperatures, and the oxidation rate of arsenopyrite
increases with the increase of temperature and NaOH concentration. Sanchez and Hiskey

Chapter 2 Review of the Literature 68
(1991) have observed that the main anodic oxidation peak for arsenopyrite appears at
about 0.3 V.
The studies by Beattie and Poling (1987) indicate that oxidation of arsenopyrite
results in the formation of ferric hydroxide films on the surface of the mineral at pH
values greater than 7. Arsenic and sulfur are oxidized to arsenate and sulfate
respectively. Bhakta et al. (1989) reported electrochemical studies that have shown that
the hydrated iron oxide film appears to be porous and partially hinder further oxidation
of arsenopyrite. At pH 13.5, thick and apparently porous layers of iron oxide precipitate
on the sulfide particles, while at pH 7, thin and dense oxide coatings are formed
(Koslides and Ciminelli, 1992; Sisenov et al., 1988; Yu and Fang, 2000). Hematite is the
principle phase in the residue after pressure oxidation by oxygen (Koslides and
Ciminelli, 1992; Hiskey and Sanchez, 1995). Bhakta et al. (1989) have found that the
lowest potentials for arsenopyrite oxidation occur in caustic soda solutions.
Sanchez and Hiskey (1991) reinvestigated the electrochemical behaviour of
arsenopyrite in alkaline media using cyclic voltammetry at pH 8-12 at room
temperatures. Their work suggests that the anodic oxidation of arsenopyrite proceeds by
a two-step dissolution mechanism. The first step is described by Equation 2.78:
FeAsS + 6H2O = Fe(OH)3 + H2AsO3- + S0 + 7H+ + 6e- (2.78)
with the formation of a FeOOH surface layer, elemental sulfur, and arsenite (H2AsO3-).
The second step involves the oxidation of arsenite (H2AsO3-) to arsenate (HAsO4
2-) and
sulfur to sulfate according to the following reactions:
H2AsO3- + H2O = HAsO4
2- +3H+ + 2e- (2.79)
S0 + 4H2O = SO42- + 3H+ + 6e- (2.80)

Chapter 2 Review of the Literature 69
The overall reaction involves 14 electrons, confirming stoichiometric
determinations of the extent of dissolution of arsenopyrite. They have also found that the
rate of oxidation is sensitive to the pH of the medium.
Wang et al. (1992) have argued that the initial oxidation of arsenopyrite produces
ferric hydroxide and a realgar-like compound according the following reaction:
FeAsS + 3H2O = Fe(OH)3 + AsS + 3H+ +3e- (2.81)
At higher potentials, the oxidation of arsenopyrite results in elemental sulfur and arsenate
according to the following overall reaction:
FeAsS + 7H2O = Fe(OH)3 + HAsO42- + S0 + 10H+ +8e- (2.82)
Ferric hydroxide is precipitated and arsenate stays on the surface. Both elemental sulfur
and realgar (AsS) are retained on the arsenopyrite substrate.
It is interesting to note that Bou et al. (1998) suggested a possible mechanism for
arsenopyrite oxidation, after studying the cementation of the gold chloride complex
AuCl4- on arsenopyrite, involving the formation of arsenothioate (or thioarsenate),
AsS(OH)3 or As(OH)3S, on the surface of arsenopyrite mineral and the oxidation of
arsenothioate to sulfate and arsenate. But more detailed fundamental studies are required
to assess these claims.
Some studies have been reported on the atmospheric oxidation of arsenopyrite
surfaces by X-ray Photoelectron Spectroscopy (XPS). Buckley and Walker (1988) have
examined the surface oxidation of FeAsS in air-saturated alkaline solutions. Oxidation in
air-saturated alkaline solutions produces iron oxide, As(III) oxide, and a metal deficient
sulfide structure. Richardson and Vaughan (1989) conducted a spectroscopic
investigation of arsenopyrite surfaces leached in a variety of solutions, and observed the

Chapter 2 Review of the Literature 70
presence of arsenite, arsenate and iron in the forms of Fe(III)-arsenates and Fe(III)-
arsenites. Nesbitt et al. (1995) carried out more detailed studies on the atmospheric
oxidation of the arsenopyrite surface by XPS. They have found that surfaces reacted with
air-saturated distilled water for eight hours undergo extensive oxidation. Fe(III)-
oxyhydroxides are the dominant surface species of iron. Polysulfide, sulfate and
thiosulfate are present on surfaces as intermediates or the final oxidation products of
sulfur. The oxidation of As(-I) in arsenopyrite proceeds via numerous intermediates,
including As(I) and As(III), and possibly As(0), with As(V) as the final oxidation state of
As. The oxidation rates of Fe(II) and As(-I) are similar and much more rapid than that of
S(-I). The rate of production of As(III), relative to As(V), is sufficiently rapid to maintain
an appreciable concentration of As(III) as arsenite at the mineral surface. Arsenic
apparently diffuses rapidly from the interior of the mineral to the surface during
oxidation.
Nicol and Guresin (2000 and 2003) have recently studied the electrochemistry of
arsenopyrite in strongly alkaline solutions with either ferrate(VI) or dissolved oxygen as
the oxidant. They have shown that arsenic(III) is the main product of the anodic process
at potentials in the region of the rest potential (-0.7 to -0.3 V) during oxidation by either
ferrate(VI) or oxygen, and that the rate determining step in the anodic oxidation involves
transfer of a single electron with one or more hydroxyl ions also involved. The initial
stage of oxidation by ferrate(VI) has been shown to be mass-transport controlled and this
is also true of the oxidation by oxygen in dilute solutions of sodium hydroxide. The
cathodic reduction of oxygen can be strongly inhibited when increasing the alkalinity of
reaction solutions. The authors suggested that reduction of oxygen to peroxide might
precede reduction to water. They also pointed out that both the anodic and cathodic

Chapter 2 Review of the Literature 71
reactions could be partially passivated due to the formation of a thick passive layer
produced by a dissolution-precipitation process.
As a cathodic process for arsenopyrite oxidation by oxygen, the reduction activity
of oxygen on arsenopyrite in basic media has been studied electrochemically (Rand,
1977). At pH 9.06, the reduction of oxygen on arsenopyrite occurs at a potential below
0.0 V (vs. SCE) and is slower than that on pyrite and chalcopyrite surfaces. Arsenopyrite
will act as an anode when contact with pyrite and chalcopyrite.
There is little work reported on the leaching chemistry of arsenopyrite in
oxygenated alkaline media. The formation of thioarsenite (AsS33-) ions in alkaline
solutions has been found during the atmospheric oxidation of gold bearing arsenical ores
(Nagy et al., 1966; Rossovsky, 1993). The oxidation reactions taking place in aerated
NaOH solutions are suggested as:
3FeAsS + 9NaOH + 4O2 = Na3AsS3 + 2Na3AsO4 + 3Fe(OH)3 (2.83)
with the subsequent oxidation of AsS33- to SO4
2- and AsO43- .
2.4.2.4 Kinetics of the oxidation of arsenopyrite
The kinetics of acid pressure oxidation of arsenopyrite has been studied in detail
by Papangelakis and Demopoulos (1990). In alkaline media, some aspects of the kinetics
of arsenopyrite oxidation have also been studied (Plaksin and Masurova, 1959;
Kakovskii and Kosikov, 1975; Bhakta et al., 1989; Koslides and Ciminelli, 1992; Hiskey
and Sanchez, 1995; Yang et al., 1997). The oxidation rate of arsenopyrite depends upon
the concentrations of oxygen and the alkali used, temperature, surface area or particle
size of the mineral, slurry density, agitation and reaction time.

Chapter 2 Review of the Literature 72
It has been found that the initial oxidation rate of arsenopyrite in alkaline media is
proportional to the surface area of the mineral, dissolved oxygen concentration and
hydroxyl ion concentration. This initial oxidation rate can be described by the following
rate equation:
- (1/S) dN(FeAsS)/dt = k e(-Ka’)/RT [OH-]a Po2b (2.84)
where S is the surface area of arsenopyrite, dN/dt the number of moles of arsenopyrite
consumed per unit time, k the apparent constant, Ka’ the reaction activation energy (J
mol-1), R the universal gas constant (8.314 J mol-1K-1), T the temperature (K), a and b are
the respective reaction orders related to hydroxyl ion concentration and partial pressure
of oxygen. Table 2.7 gives reported data for Ka’, a and b from the literature.
Table 2.7 Some published kinetic data for the alkaline oxidation of arsenopyrite
Reference Ka’ /
kJ mol-1
a b T / K Po2 / kPa
Kakovskii and Kosikov, 1975 41.3 ~ 1 0.5 298-323 Atmosphere
Taylor and Amoah-Forson, 1987 23.8 - - 353-423 280-1400
Bhakta et al., 1989 20.3 - - 353-413 275-1380
Koslides and Ciminelli, 1992 15.1 0.27 ~ 0 373-433 265-1053
Yang et al., 1997 24.4 - - 283-333 Electrooxidation
As seen in Table 2.7, the activation energy for arsenopyrite oxidation in alkaline
media is low, suggesting a diffusion control mechanism. The diffusion of reactants (OH-
or O2) through the hydrous iron oxide layer on the partially reacted arsenopyrite may be
the rate-controlling factor. There is a clear difference between the reaction orders with

Chapter 2 Review of the Literature 73
respect to relevant reactants, which probably is associated with the use of different
pressures of oxygen. The negligible effect of oxygen pressure at high pressures on the
oxidation rate may indicate the occurrence of an adsorption reaction as described by a
Langmuir isotherm (Koslides and Ciminelli, 1992; Plaksin and Masurova, 1959). The
apparent fractional order for the hydroxyl ion concentration is typical of
electrochemically controlled reactions, involving the oxidation of arsenopyrite,
hydrolysis of iron and the reduction of oxygen (Koslides and Ciminelli, 1992).
Increasing temperature increases the rate oxidation of arsenopyrite up to about
140 °C, after which the As and S are precipitated from solution at high temperatures
(Plaksin and Masurova, 1959; Bhakta et al., 1989). Generally, longer leaching time
results in higher arsenic extraction from the pressure oxidation of arsenopyrite (Bhakta et
al., 1989), while under atmospheric conditions the oxidation rate decreases with time,
probably because of the formation of surface layers (Kakovskii and Kosikov, 1975).
Bhakta et al. (1989) have reported that the use of higher density of solids (more than
15%) in solution leads to substantially lower extraction of arsenic. The oxidation rate of
arsenopyrite increases with increasing agitation up to about 900 rpm above which the
rate becomes virtually independent of the stirring speed (Koslides and Ciminelli, 1992).
Since the ultimate purpose of the oxidation of arsenopyrite is to enable extraction
of precious metal values, a linear relationship between the extent of arsenic extraction
from gold ores and subsequent gold extraction by cyanidation has been established by
Hiskey and Sanchez (1995). It was observed that gold extraction after arsenopyrite
oxidation never exceeded 85%, which is consistent with the operating results at Barrick
Mercur (Thomas, 1991a, b). The reason was explained in terms of the formation of
passivating oxide layers on the surface of arsenopyrite.

Chapter 2 Review of the Literature 74
2.4.3 Alkaline Oxidation of Pyrite
The aqueous oxidation of pyrite is an oxidative process involving an increase in
the sulfur valence state. This subject has been extensively studied, since the
understanding of its behaviour in aqueous solutions is important for many applications
such as the separation of pyrite from complex sulfide ores by flotation, desulfurization of
coal, production of acid mine drainage and the leaching of pyrite. A number of excellent
reviews have been published on the oxidation of pyrite (Lowson, 1982; Hiskey and
Schlitt, 1982; Ciminelli, 1987; Zhu et al., 1993). The dissolution behaviour of pyrite has
been investigated using various techniques, including electrochemical techniques
(Meyer, 1979; Hamilton and Woods, 1981; Wadsworth et al., 1993; De Jager and Nicol,
1997), chemical analytical techniques (Goldhaber, 1983; Taylor at al., 1984; Moses et
al., 1987; McKibben and Barnes, 1986; Ciminelli and Osseo-Asare, 1986, 1995a, b),
XPS (Buckley and Woods, 1987; Mycroft et al., 1990), Raman Spectrometry (Li and
Wadsworth, 1993; Mycroft et al., 1990; Caldeira et al., 2003) and other instrumental
analytical techniques (Caldeira et al., 2003; Mishra and Osseo-Assare 1988; Wei and
Osseo-Asare, 1996; Ennaoui et al., 1986; Michell and Woods, 1978). In the following
section, attention is focused on the alkaline oxidation of pyrite.
2.4.3.1 The nature of pyrite
Pyrite is the most widespread and abundant of naturally occurring metal sulfides.
It is represented chemically by the formula FeS2 and is a binary transition metal sulfide
found in association with various ores (Hiskey and Schlitt, 1982; Ciminelli, 1987). The
iron component of pyrite has an oxidation state of +2. Consequently, it can be deduced

Chapter 2 Review of the Literature 75
that pyritic sulfur is present as the sulfide di-anion S22- (Vaughan and Tossell, 1983).
Pyrite occurs in two distinct crystal structures, cubic and framboidal, which respond
quite differently to oxidation (Lowson, 1982; Mishra and Osseo-Asare, 1988). The
framboidal form decomposes easily while the cubic structure is more stable. The pyrite
mineral has a characteristic brass-yellow color, and is a diamagnetic semiconductor.
Some physical properties of pyrite are given in Table 2.8.
Table 2.8 Some physical properties of pyrite (Lowson, 1982)
Physical Property Units Value Molecular Mass g mol-1 119.98
Density g cm-3 5.0 ∆G°298K kJ mol-1 -166.94
Resistivity: n-type mean Ω·m 1 × 10⁻³ Resistivity: p-type mean Ω m 2 × 10⁻²
2.4.3.2 Thermodynamics of the oxidation of pyrite
The oxidation behaviour of pyrite is determined by both equilibrium and kinetic
considerations. The Eh-pH diagram as given in Figure 2.11 for the FeS2-H2O system
may be used to determine the theoretical thermodynamic relationships for the behaviour
of pyrite in an aqueous system (Tao et al., 1994; Ciminelli, 1987). It can be seen that
pyrite is stable in a relatively broad range from approximately pH 1 to pH 13.
The potential range for pyrite stability is from approximately –0.6 to +0.3 V. It is
interesting to note that above pH 13, pyrite is no longer thermodynamically stable at any
potential. The rest potential of pyrite is about 0.3 V at pH 9.2, 0.2 V at pH 10 and -0.07

Chapter 2 Review of the Literature 76
V at pH 11 (Tao et al., 1994; Ahlberg et al., 1990; Ahmed, 1978). Thus, normal oxidants
such as oxygen can oxidize pyrite in alkaline media yielding iron hydroxides and sulfate
ions. At high pH values, the iron exists in the form of hydrated iron oxide species
(Hamilton and Woods, 1981, Caldeira et al. 2003). It should be emphasized that this
diagram does not show the presence of metastable sulfur species as shown in Figure 2.2.
Fe3 +Fe
(OH
)2 +
Fe(O
H) 2 +
Fe(OH)3
SO42 +
Fe(OH)2
FeS2
Fe2 + + 2S
SO42 +
Fe2 + + H2S
FeS + HS -
FeS + H2S
Fe + H2S Fe + HS -
Fe
10 12 14 8 640 2
1. 2
0. 8
0. 4
0
-0. 4
-0. 8
-1. 2
Eh
(V)
pH Figure 2.11 Eh-pH diagram for the pyrite-water system at 25 °C and for 10-5 M dissolved species (after Tao et al., 1994). The dashed line indicates the regional boundary within which certain species are metastable.
Elemental sulfur may be obtained as an end product of pyrite dissolution in acidic
solutions, but it is not stable in alkaline media. Mishra and Osseo-Asare (1988) detected
the formation of thiosulfate as an intermediate product in the anodic dissolution process
for pyrite. Mycroft et al. (1990) have suggested that the electrochemical oxidation of
pyrite surfaces between 0.15 and 0.75 V (vs. SCE) in near-neutral aqueous solutions
Chapter 2 Review of the Literature 77
results in the formation of polysulfides and sulfur. Li and Wadsworth (1993) confirmed,
by Raman spectroscopy studies, that the formation of sulfur and polysulfides on pyrite
surface could only be detected at high potentials above about 0.8 V (vs. SCE) in alkaline
solutions. However, Hamilton and Woods (1981) suggested the formation of a
monolayer of sulfur on oxidized pyrite surface in solutions with pH 9.2 at a potential of
about 0.0 V.
2.4.3.3 Oxidation by oxygen in alkaline solutions
The aqueous oxidation of pyrite by molecular oxygen has attracted scientific
interest for more than 100 years (Lowson, 1982). It is generally believed that the overall
stoichiometry for aqueous oxidation by molecular oxygen in alkaline solutions may be
represented as
4FeS2 + 15O2 + 16OH- = 4Fe(OH)3 + 8SO42- + 2H2O (2.85)
The iron hydroxide may form goethite (FeOOH), and then hematite (Fe2O3), as the water
of hydration is removed at higher temperatures (Marsden and House, 1992; Goldhaber,
1983). In hydroxide medium, hematite is the main product of iron oxidation while in
contrast the main constituent is ferrihydrite in carbonate medium (Caldeira et al., 2003).
The formation of iron hydroxide layers hinders the rate of further oxidation by
oxygen. In hydroxide media, pyrite particles are initially covered by a thin oxide layer
that fractures after longer reaction times with most of the oxide reporting to the aqueous
phase (Caldeira et al., 2003). In carbonate solutions, the particles of pyrite after oxidation
are initially covered by a discontinuous oxide coating that grows with reaction time, thus
increasing the overall pyrite surface coverage.

Chapter 2 Review of the Literature 78
Metastable sulfur oxyanions such as thiosulfate, polythionates and sulfite can
form as intermediates in the oxidation of sulfur to sulfate, depending on the pH and
potential of the medium (Goldhaber, 1983; Rolia and Tan, 1985; Moses et al., 1987;
Luther III, 1987; Lulham, 1989; Rossovsky, 1993; Mishra and Osseo-Asare, 1988).
Goldhaber has observed that at pH values greater than 7, the major sulfur oxidation
products are thiosulfate (65-80%) and sulfite. The ultimate oxidation of thiosulfate to
sulfate is delayed by an “induction period”, the duration of which increases with
alkalinity (Rolia and Chakrabarti, 1982). However, pyrite itself is an electrocatalyst for
the oxidation of thiosulfate to sulfate by oxygen in aqueous solutions (Xu and Schoonen,
1995). The production of thiosulfate may be described by the overall equations
4FeS2 + 7O2 + 8OH- = 2Fe2O3 + 4H2O + 4S2O32- (2.86)
4FeS2 + 11O2 + 6CO32- = 2Fe2O3 + 4SO4
2- + 2S2O32- + 6CO2 (2.87)
Use of lime, compared to NaOH or Na2CO3, appears to reduce the rate of thiosulfate
formation, presumably because it can form less soluble intermediates, e.g.,
polysulphanes (Rolia and Tan, 1985). The formation of thiosulfate is of great importance
because gold in pyritic ores may be complexed with thiosulfate and can therefore
dissolve in alkaline solutions as reported by Lulham (1989).
Despite the possible formation of elemental sulfur in alkaline media (Hamilton
and Woods, 1981; Rolia and Tan, 1985; Lowson, 1982), Buckley and Woods (1987)
found from an XPS study that no elemental sulfur was formed on the surface of pyrite
exposed to air-saturated alkaline environments.

Chapter 2 Review of the Literature 79
2.4.3.4 Kinetics of the oxidation of pyrite by oxygen
As the principal reaction between oxygen and pyrite is a heterogeneous surface
reaction between a dissolved gas and a solid surface, the reaction rate may be limited by
the oxygen transfer from the gas phase to the liquid phase. However, this limitation can
be removed by the use of high pressures.
As in the case of arsenopyrite, the initial oxidation rate of pyrite can be described
by the following rate equation
- (1/S) dN(FeS2)/dt = k e(-Ka’)/RT [OH-]a Po2b (2.88)
A variety of reaction orders have been reported. A fractional order of about 0.5 with
respect to oxygen partial pressure has been found (Ciminelli and Osseo-Asare, 1986 and
1995a, b; Stenhouse and Armstrong, 1952; Lin et al., 1986) while Koslides and Ciminelli
(1992) obtained a reaction order of 0.31. According to Wheelock (1981), the reaction
rate becomes nearly independent of oxygen partial pressure above 810 kPa in sodium
carbonate solutions. Fractional order kinetics is usually viewed as evidence that the rate-
controlling step involves an adsorption or desorption process, with the surface
concentrations being defined by a nonlinear, typically Langmuir, isotherm (Lowson,
1982; Hiskey and Wadsworth, 1981). A fractional order dependence on hydroxyl ion
concentration has also been reported in alkaline media. Koslides and Ciminelli (1992)
found an order of 0.23 in NaOH media while Ciminelli and Osseo-Asare (1986 and
1995a) obtained an order of 0.1 in Na2CO3 solutions. The activation energies for the
alkaline oxidation of pyrite by oxygen have been calculated to range from 40 to 90 kJ
mol-1, indicating a chemical rather than a mass transport rate-determining step (Lowson
1982; Ciminelli and Osseo-Asare, 1986). However, Koslides and Ciminelli (1992) have

Chapter 2 Review of the Literature 80
suggested that the rate-determining step changes from chemical control to diffusion
control when the temperature is above 100 °C.
The initial oxidation rate of pyrite by oxygen in sodium carbonate solutions has
been found to be inversely proportional to the diameter of the particles (Ciminelli and
Osseo-Asare, 1986). An inverse first order relationship characterizes reactions controlled
by either mass transfer in the liquid phase or by chemical reaction. If the reaction were
limited by diffusion in the solid product, i.e. the iron oxide coating, an inverse
relationship between initial rate and the square of particle size would be expected
(Ciminelli and Osseo-Asare, 1986; Levenspiel, 1999).
2.4.3.5 Mechanism of the oxidation of pyrite
There are a number of reaction mechanisms that have been suggested (Lowson
1982; Goldbaber, 1983). Bailey and Peters (1976) have demonstrated, using 18O as a
marker, that sulfate oxygen originates from water rather than molecular oxygen while
100% of the reactant oxygen becomes product water in pyrite pressure leaching. Rolia
and Tan (1985) have found that very little dissolved oxygen is necessary to generate
thiosulfate indicating an electrochemical process involving water. Thus, an
electrochemical mechanism for the dissolution of pyrite has been proposed (Mishra and
Osseo-Asare, 1988), which involves the formation of thiosulfate as an intermediate
product. The following steps have been suggested for the anodic oxidation of pyrite in
aqueous solutions:
FeS2 (s) + H2O → Fe(OH)S2 (s) + H+ + e- (2.89)
Fe(OH)S2 (s) → FeS2(OH) (s) (2.90)
FeS2(OH) (s) + 3H2O → Fe(OH)2⋅S2(OH)2 (s) + 3H+ + 3e- (2.91)

Chapter 2 Review of the Literature 81
Fe(OH)2⋅S2(OH)2 (s) → Fe2+(aq) + S2O3
2-(ads)
+ 2H+ + H2O + 2e- (2.92)
Thiosulfate is either further oxidized to sulfate through a series of sulfur oxyanions or
may decompose to produce elemental sulfur and bisulfite (see Section 2.2.1.2). With
oxygen as the oxidant in alkaline media, the cathodic process on the pyrite surface is
suggested to occur as in Equations 2.16, 2.19 and 2.20 (see Section 2.1.3.1), with the
formation of hydrogen peroxide as the rate-controlling step.
2.4.4 Alkaline Oxidation of Chalcopyrite
This part of the literature review only briefly outlines the oxidation of
chalcopyrite in alkaline media due to the possible presence of minor amounts of
chalcopyrite in refractory arsenopyrite-pyrite containing gold ores and the effects of
copper on the dissolution of gold in alkaline thiosulfate solutions.
Chalcopyrite is the major source of copper metal. It has a chemical formula
CuFeS2 that is represented as a ionic structure Cu+Fe3+(S2-)2 (Hiskey and Wadsworth,
1981). It has a tetragonal crystal structure and is an n-type semiconductor. It has a lower
rest potential than pyrite, suggesting that it will act as an anode when contact with pyrite
in aqueous solutions (Hiskey and Wadsworth, 1981; Rand, 1977).
The Eh-pH diagram (Peters, 1976) indicates that chalcopyrite is unstable at high
pH values. The relevant oxidation reaction in alkaline media is suggested as (Trahar,
1984):
CuFeS2 + 3H2O = CuS + Fe(OH)3 + S0 + 3H+ + 3e- E° = + 0.547 V (2.93)
Thiosulfate has been detected during the oxidation of CuFeS2 by oxygen in solutions
with pH 9.8 and its concentration in the slurry is reduced in the presence of pyrite,

Chapter 2 Review of the Literature 82
presumably due to its reduction by Fe2+ ions from the oxidation of pyrite (Rao et al.,
1976). Elemental sulfur has also been detected on the surface of CuFeS2 .
In the case of leaching with oxygen in ammoniacal solutions, the generally
observed leaching reaction for chalcopyrite is expressed as (Hiskey and Wadsworth,
1981):
2CuFeS2 + 8.5O2 + 4OH- = 2Cu2+ + Fe2O3 + 4SO42- + 2H2O (2.94)
Cu2+ + 4NH3 = Cu(NH3)42+ (2.95)
Thiosulfate and polythionates are found to be intermediates and subsequently oxidized to
sulfate (Peters, 1976). It has been found that the kinetics for the ammoniacal leaching of
chalcopyrite is approximately half order with respect to hydroxyl, cupric ions and
oxygen at low pressures. At high pressures, the rate becomes zero order with respect to
oxygen. The electrochemical reactions proposed include the anodic dissolution of
CuFeS2:
2CuFeS2 + 38OH- = 2Cu2+ + Fe2O3 + 4SO42- + 19H2O + 34e- (2.96)
and two parallel cathodic reactions involving the discharge of oxygen without and with
the cupric ion autocatalytic effect (Equation 2.16).
The oxidative leaching of chalcopyrite, either in acid or ammoniacal systems, has
drawn substantial interest from a number of investigators with the aim of developing a
new process to extract copper and noble metals from chalcopyrite concentrates.
2.4.5 Eh Measurements
The oxidation or reduction conditions to which sulfide minerals are exposed in
aqueous solutions may be monitored by measuring the potential of an indicator electrode
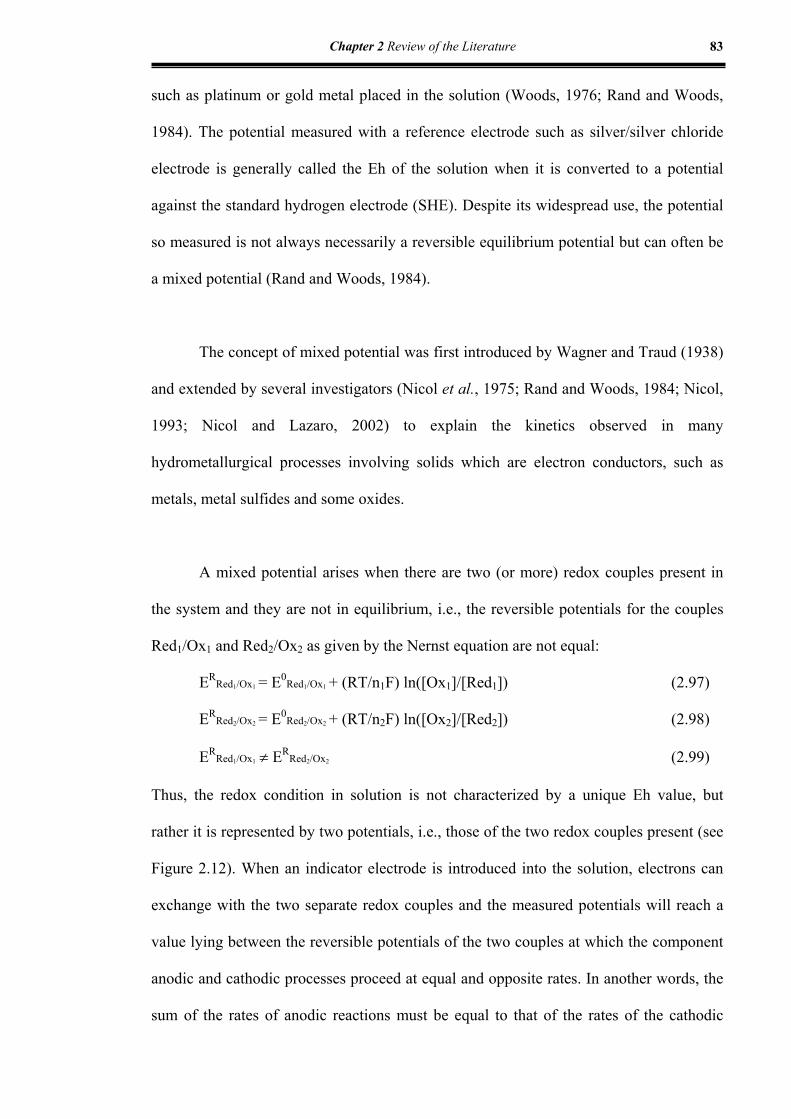
Chapter 2 Review of the Literature 83
such as platinum or gold metal placed in the solution (Woods, 1976; Rand and Woods,
1984). The potential measured with a reference electrode such as silver/silver chloride
electrode is generally called the Eh of the solution when it is converted to a potential
against the standard hydrogen electrode (SHE). Despite its widespread use, the potential
so measured is not always necessarily a reversible equilibrium potential but can often be
a mixed potential (Rand and Woods, 1984).
The concept of mixed potential was first introduced by Wagner and Traud (1938)
and extended by several investigators (Nicol et al., 1975; Rand and Woods, 1984; Nicol,
1993; Nicol and Lazaro, 2002) to explain the kinetics observed in many
hydrometallurgical processes involving solids which are electron conductors, such as
metals, metal sulfides and some oxides.
A mixed potential arises when there are two (or more) redox couples present in
the system and they are not in equilibrium, i.e., the reversible potentials for the couples
Red1/Ox1 and Red2/Ox2 as given by the Nernst equation are not equal:
ERRed1/Ox1 = E0
Red1/Ox1 + (RT/n1F) ln([Ox1]/[Red1]) (2.97)
ERRed2/Ox2 = E0
Red2/Ox2 + (RT/n2F) ln([Ox2]/[Red2]) (2.98)
ERRed1/Ox1 ≠ ER
Red2/Ox2 (2.99)
Thus, the redox condition in solution is not characterized by a unique Eh value, but
rather it is represented by two potentials, i.e., those of the two redox couples present (see
Figure 2.12). When an indicator electrode is introduced into the solution, electrons can
exchange with the two separate redox couples and the measured potentials will reach a
value lying between the reversible potentials of the two couples at which the component
anodic and cathodic processes proceed at equal and opposite rates. In another words, the
sum of the rates of anodic reactions must be equal to that of the rates of the cathodic

Chapter 2 Review of the Literature 84
reactions at the mixed potential, since the net current flow is zero. This is illustrated in
Figure 2.12 (Rand and Woods, 1984).
Mixedpotential
Ox1 + n1e - → Red1 Ox2 + n2e - → Red2
Red2 → Ox2 + n2e -Red1 → Ox1 + n1e -
ER Red1 /Ox1ER Red2 /Ox2
CU
RR
ENT
Cat
hodi
cAn
odic
Figure 2.12 Schematic representation of a mixed potential system (Rand and Woods, 1984).
Mixed potentials in the same system can be different for different indicator
electrodes because the rate of an electrode reaction is dependent on the nature of the
electrode surface. The potential is not determined solely by thermodynamics but also by
the kinetics of the reactions at the electrode/solution interface. Hence the mixed potential
can vary significantly from one electrode surface to another. For example, the Eh
measured by a platinum electrode can differ from that measured by a gold electrode
(Woods, 1976).
The mixed potential will also be influenced by other factors that affect the rate of
each participating reaction. Stirring the solution will enhance the rates of mass-transport
controlled but not chemically controlled processes. Adsorption of impurities can
decrease the rate of an electrocatalytic process and it is often necessary for indicator

Chapter 2 Review of the Literature 85
electrodes to be cleaned before transfer from one system to another in order to obtain
clean, reproducible surfaces (Rand and Woods, 1984).
The mixed potential of an inert electrode in the bulk of a leach solution or pulp is
not identical to that experienced by an oxidizing mineral surface in the same solution
because there can be additional anodic processes involving the mineral surface or
reactions of the mineral with dissolved species in the pulp. Only the mixed potential
measured using the mineral electrode is representative of the dissolution processes
(Woods, 1976; Nicol et al., 1975). However, in some cases such as sulfide flotation, the
mixed potential of sulfide minerals is frequently close to that of a platinum or gold
electrode because both respond in a similar manner (Trahar, 1984). The platinum or gold
electrode employed in a concentrated sulfide mineral slurry may act as a slurry electrode
and take up the potential of the sulfides rather than the potential which the metal
electrode would report in filtered solution (Woods, 1976). Thus, the Eh determined by a
noble metal electrode may, in favourable cases, monitor the relevant electrochemical
condition of the sulfide surface.
2.4.6 Electrochemical Interactions between Sulfide Minerals
Most sulfides are good semiconductors. There are considerable differences
between the reactivities of these sulfides. It has been found that pyrite is a good
electrocatalyst for reduction of oxygen and the evolution of hydrogen, being much more
active than most other sulfide minerals (Rand, 1977). The more active minerals, namely
pyrite, pentlandite, and copper sulfides, are only slightly less active for oxygen reduction
than gold. The order of reactivity for reduction of oxygen at pH 9.06 is pyrite >
chalcopyrite > arsenopyrite > pyrrhotite > galena (Rand, 1977). Thus, pyrite will act as a

Chapter 2 Review of the Literature 86
cathode when in contact with other sulfides including arsenopyrite and chalcopyrite
while these sulfides act as an anode in oxygenated alkaline media. Galvanic coupling
between pyrite and other sulfide minerals can result in an accelerated oxidation rate of
these minerals and passivation of pyrite under leaching conditions (Hiskey and
Wadsworth, 1981).
2.4.7 Effect of Fine Grinding on Sulfide Oxidation
Grinding in steel mills is a common practice in the mineral processing industry,
but the normal ball or autogenous mills become increasingly inefficient at sizes below
about 45 microns. In some gold ores, an important fraction of the gold is locked in
gangue minerals smaller than 45 microns and is therefore not readily amenable to
cyanidation. Ultra fine grinding is particularly useful when treating refractory pyritic
gold ores and calcines in which gold is coarser in size, ranging from 1 to 20 microns
(Corrans and Angove, 1991). A number of studies have been reported using the ultra-fine
grinding technology to leach gold and/or oxidize sulfide minerals in a one step process
(Liddell, 1989; Rossovsky, 1993; Min et al., 1999; Wang et al., 1998; Huang et al.,
1999; Mao et al., 1997). Thus, the use of fine grinding has become a promising treatment
option for some refractory gold ores in recent years and has been extensively reviewed
(Balaz and Liddell, 1999; Balaz, 2000).
It has been claimed that fine grinding will create disorder in the crystal structures
of sulfide minerals, increase the surface area of mineral particles, produce new surfaces
of the minerals, and thus influence the chemical reactivity of the sulfide minerals (Balaz,
2000). Inert pyrite has been found to be more active for oxidation after ultra-fine
grinding and thus fast kinetics of oxidative dissolution of pyrite can be achieved (Huang

Chapter 2 Review of the Literature 87
et al., 1999; Balaz, 2000). Bocharov and Golikov (1967) studied the kinetics of oxidation
of some sulfide minerals during wet-grinding with free access of oxygen. They have
found that grinding pyrite and quartz in a steel mill abrades the metallic iron, which is
little oxidized in alkaline media. The presence of the metallic iron phase establishes
reducing conditions (Rolia and Tan, 1985), and the larger is the relative area of metallic
iron phase in galvanic contact with the sulfide mineral, the greater is the reduction in the
potential of the mineral surface (Rao et al., 1976). Thus, during the grinding of pyrite,
sulfur species of low valence state may be formed, including FeS, SO32-, S2O3
2-,
polythionates and possible elemental sulfur, the amount of which depends on grinding
conditions (Bocharov and Golikov, 1967; Rolia and Tan, 1985). Cases et al. (1993)
detected by XPS the presence of iron oxyhydroxides and oxidized iron-sulfur compounds
(FeSO4·nH2O) on the surface of pyrite after wet-grinding in an iron rod mill and a
stainless steel mill. The surface of arsenopyrite after wet-grinding contains S(-2) and
S(+6) with sulfate sulfur prevailing (Balaz, 2000). Welham (2001) has studied the fine
grinding of a gold-bearing pyrite/arsenopyrite concentrate, and found that the selective
oxidation of arsenopyrite over pyrite is possible by grinding in oxygen, with arsenopyrite
decomposing to arsenic oxide and iron sulfate and pyrite remaining essentially unreacted.
Chalcopyrite was found to be oxidized at a higher rate than pyrite at various pH values
(Bocharov and Golikov, 1967).
2.4.8 Effects of Sulfide Minerals on the Dissolution of Gold
Gold is associated with a variety of minerals in its ores including conductive
sulfide minerals and thus its dissolution could be affected by the presence of these
minerals. Lorenzen and Deventer (1992) have found that the leaching behaviour of gold
in cyanide solutions depends largely on the galvanic interaction between gold and the

Chapter 2 Review of the Literature 88
sulfide minerals and partially on the formation of a passivating film on the gold surface.
Gold in contact with conducting minerals will passivate as a result of the enhanced
magnitude of the cathodic current, resulting in decreased gold dissolution rates.
Chalcopyrite, pyrite and pyrrhotite cause the largest decrease in the rate of gold leaching
when in contact with gold. Galena strongly enhances the dissolution rate owing to the
positive action of dissolved Pb2+ ions on the surface oxidation of gold. In contrast, Liu
and Yen (1995) reported that their results were contrary to those of Lorenzen and
Deventer in oxygen-enriched cyanide solutions. They have concluded that the leaching
behaviour of gold and silver in the presence of various sulfide minerals depends strongly
on both the solubility of the sulfides and the oxygen concentration in solution.
Zhuchkov and Bubeev (1992) studied the effect of the contact of gold with
sulfide minerals on its behaviour in thiosulfate solutions by electrochemical techniques.
They concluded that the presence of sulfide minerals increased the dissolution rate of
gold in the sequence chalcopyrite < pyrrhotite < arsenopyrite < pyrite. The optimum
particle size ratio of sulfide minerals to gold was 5.
2.4.9 Summary
Refractory gold ores containing arsenopyrite and pyrite require breakdown of the
sulfide minerals to liberate the gold for further extraction by cyanidation or other
processes because the gold frequently is very fine and even “invisible”. Ultra-fine
grinding technology may benefit gold leaching from some pyritic ores, but has no major
beneficial effect on the recovery of gold from ores containing arsenopyrite during the
leaching of gold by cyanidation. Ultra-fine grinding can greatly accelerate the oxidation
of sulfides but the possible presence of abraded iron metal may reduce the potential of

Chapter 2 Review of the Literature 89
the leaching system, resulting in the formation of sulfur compounds of low valence state,
such as thiosulfate or polysulfides.
Alkaline oxidation may be the preferred process for the oxidation of sulfide
minerals owing to the instability of these minerals at high pH values. However, it has
received little attention compared with acid oxidation. Arsenopyrite is more easily
oxidized by oxygen than pyrite in alkaline media, but its oxidation chemistry and
mechanism remain unclear although a number of electrochemical studies have been
carried out. For example, it is not known how the arsenic and sulfur components in the
FeAsS mineral are oxidized. Are thiosulfate and elemental sulfur the intermediates of
sulfur oxidation to sulfate? Pyrite is a noble sulfide mineral and not easily oxidized. The
alkaline oxidation of pyrite by oxygen will yield iron hydroxides (or oxides) and sulfate
ions, forming thiosulfate, polythionates, sulfite, and possible sulfur as the intermediates.
Chalcopyrite can also be oxidized at high pH values, forming sulfur, thiosulfate, sulfate
and iron hydroxides. In alkaline systems containing arsenopyrite, chalcopyrite and pyrite
arsenopyrite will be the first to be oxidized and pyrite will be the last.
Thiosulfate formed during the alkaline oxidation of pyrite by oxygen may react
with gold particles, forming dissolved gold complexes. The dissolution rate of gold in
thiosulfate solutions may be influenced by the presence of sulfide minerals, depending
on the nature, amount and particle size of the mineral used. It is not known to what
extent gold dissolves during the alkaline oxidation of arsenopyrite with oxygen.

Chapter 3 Materials and Methods 90
CHAPTER 3 MATERIALS AND METHODS
3.1 Materials and Reagents
Table 3.1 lists the chemical reagents and mineral materials used in this study. All
chemicals except those artificially synthesized in this study were used without further
purification. The details of the mineral materials are described in the respective chapters.
Table 3.1 Chemicals and minerals used
Reagents Purity (%) Supplier Gold wire, 0.5mm diameter 99.9+ ALDRICH Chem Gold rod, 3.5mm diameter 99.9+ ALDRICH Chem Gold powder, spherical, 1.5-3um 99.9+ ALDRICH Chem Platinum wire, 0.5mm diameter 99.9+ ALDRICH Chem Platinum wire, 2mm diameter 99.9+ ALDRICH Chem Na2S2O3·5H2O AR, 99.5 AJAX Chem NaOH AR, 97 AJAX Chem Na2SO4 AR, 99.0 AJAX Chem NH3·H2O AR, 28 APS Chem O2 gas Industrial grade AIR LIQUIDE (WA) N2 gas High purity grade AIR LIQUIDE (WA) (NH4)2SO4 AR, 99.5 APS Chem Na3Au(S2O3)2·2H2O AR, 99.9, Au=35.78% ALFA Chem NaAuCl4·2H2O LR,99.0 ALDRICH Chem CuSO4·5H2O AR, 98.0 AJAX Chem Cu wire, 1mm diameter 99.9 ALDRICH Chem Cu metal powder LR, Precipitated BDH Chem CuO AR, 97.5 AJAX Chem CuS LR HOPKIN & WILLIAMS Cu2S (Djurleite) Mineral Warburton Mission (WA) CuCl LR, 90.0 AJAX Chem

Chapter 3 Materials and Methods 91
Table 3.1 Chemicals and minerals (continued)
Reagents Purity (%) Supplier Na2S·9H2O AR, 98.0 AJAX Chem S, sublimed LR AJAX Chem CS2 AR, 99.5 AJAX Chem Na2SO3 AR, 98.0 AJAX Chem As2O3 AR, 99.99 AJAX Chem NaAsO2 LR, 98.0 BDH Chem Na2HAsO4·7H2O AR, 98.0 AJAX Chem As2S3, amorphous Synthesized, 84.3% This Study Na3AsO3S·12H2O Synthesized, crystal This Study As standard solution AR, 1000 mg l-1 ALDRICH Chem NaHCO3 AR, 99.5 BDH Chem Na2CO3 AR, 99.8 APS Chem Acetonitrile HPLC grade ALDRICH Chem HOOC·C6H4·COOK AR, 99.9 AJAX Chem KBr AR, 99.5 AJAX Chem KCl AR, 99 APS Chem Br2 liquid AR, 99 AJAX Chem (NH4)2SO4·FeSO4·6H2O AR, 99.0 AJAX Chem Fe2(SO4)3·9H2O AR AJAX Chem HNO3 AR, 70% APS Chem HCl AR, 32% SIGMA Chem H2SO4 AR, 98% APS Chem Arsenopyrite (FeAsS) Crystal Socklich, Gemhouse (WA) Pyrite (FeS2) Crystal Murdoch University Gold concentrates Mineral mixtures Wiluna, Macraes, etc.
De-ionized water from a Millipore Milli-Q system was used for the
electrochemical studies and distilled water for the oxidation of sulfide minerals and the
dissolution of gold powders.
Synthesis of amorphous orpiment. The amorphous orpiment used for preparing
thioarsenites was chemically synthesized according to Eary (1992). The preparation
includes the following major steps:

Chapter 3 Materials and Methods 92
a) Preparation of 1000 ml solution containing 0.1 M potassium hydrogen
phthalate (HOOC·C6H4·COOK) and 0.15 M NaAsO2 followed by
deoxygenation using nitrogen for 0.5 hours and control of pH at 4.0.
b) Preparation of 1000 ml 0.23 M Na2S solution followed by deoxygenation.
c) Mixing the Na2S solution with the NaAsO2 solution and stirring the mixture
under nitrogen atmosphere.
d) Addition of diluted hydrochloric acid to the mixture and control of the pH at
4.0 at 25 °C. The amorphous orpiment immediately precipitates from solution
as a bright yellow orange solid according the following reactions:
3Na2S + 2NaAsO2 + 8HCl = As2S3 + 8NaCl +4H2O (3.1)
e) The precipitate is aged for one day at room temperature, then filtered and
washed with deoxygenated distilled water to remove phthalate and other salts
before drying in a vacuum desiccator.
X-ray diffraction patterns of the precipitated orpiment showed only the broad
increase in background scatter that is characteristic of amorphous solids. Diffraction
peaks characteristic of crystal orpiment, realgar, native arsenic or native sulfur were not
observed. After digestion in an acidic bromine-bromide mixture solution (see Appendix
A2) followed by chemical element analyses using ICP (see Section 3.4.2) for As and S,
the synthetic orpiment yielded a molar ratio of S:As of 1.44, giving an overall
composition of As2S2.88, which is in agreement with Eary (1992) and Helz et al. (1995).
In this study, the formula As2S3 is used for convenience. The synthetic orpiment had a
purity of 84.3%, with the balance being mainly moisture.

Chapter 3 Materials and Methods 93
3.2 Apparatus
3.2.1 Electrochemical Set-up
3.2.1.1 Rotating gold disk electrode
The gold rotating disk electrode was made in the workshop at Murdoch
University using a pure gold rod with a diameter of 3.5 mm and 10 mm length, with a
surface area of 0.0962 cm2. The gold rod was attached to a stainless steel holder using
silver epoxy resin followed by mounting in araldite resin (Araldite LY 568), after which
it was given a post-cure process that permitted this electrode to be used at temperatures
as high as 90 °C. The gold disk electrode is graphically shown in Figure 3.1.
Electrode holder
Disk electrode
Disk surface
Figure 3.1 Cross-section of a rotating disk electrode

Chapter 3 Materials and Methods 94
3.2.1.2 Rotating platinum disk electrode
The platinum rotating disk electrode was prepared following the method above
described, using a platinum wire with a diameter of 2 mm and length of 10 mm. The disk
surface area was 0.0314 cm2.
3.2.1.3 Counter electrode
This electrode was a platinum wire of 0.5 mm diameter and 150 mm length. It
was coiled and put in a glass tube with a glass frit that separated the cathodic
compartment from the anodic compartment as illustrated in Figure 3.2.
3.2.1.4 Reference electrode
All measurements were carried out using a silver/silver chloride electrode
(saturated potassium chloride solution, Model PJFO, IONODE) with a potential of 0.199
V (25 °C) against the standard hydrogen electrode (SHE). However, for the sake of
convenience all potentials reported in this work have been converted to the SHE scale.
The measured potential with respect to SHE (Eh) can be obtained by addition of the
potential of this reference electrode against SHE (EhAg/AgCl) to the potential measured
with respect to this reference electrode (E) as described in following equation:
Eh = E + EhAg/AgCl = E + 0.199 (V, at 25 °C) (3.2)
At other temperatures, a temperature coefficient dE/dT = -1.01 mV K-1 for the saturated
KCl, Ag/AgCl electrode was used for potential correction (Reiger, 1994):
EhAg/AgCl = 0.199 – 1.01 × 10⁻³ (T-273) (V) (3.3)

Chapter 3 Materials and Methods 95
3.2.1.5 Electrochemical cell
The electrochemical cell as shown in Figure 3.2 was a typical 100-ml water-
jacketed glass vessel suitable for three electrodes, i.e. a working rotating disk electrode, a
counter electrode and a reference electrode. The cell was fitted with an entry port at the
base for the Luggin capillary which was used to separate the reference electrode from the
working solutions.
3.2.1.6 Electrochemical system
The electrochemical set-up is shown in Figure 3.2. The working disk electrode
was rotated using a stand and a speed controller manufactured in the workshop at
Murdoch University. The potential of the working electrode was controlled with a Model
362 scanning potentiostat (Princeton Applied Research Company, USA) that was linked
initially to a Bausch & Lomb Model 2000 X-Y recorder (Houston Instrument, USA) and
in the later stage of this work to a LabViewTM data acquisition system (National
Instruments, USA). The potential of the working electrode and the current passed
through it were monitored and recorded using the above system. The plots from the X-Y
recorder were digitized using a UMAX Scanner (Model Astra 600S) and WinDig2.5 data
digitizer software. To calculate the charge passed through the working electrode,
Origin5.0 software (Microcal, USA) was used to integrate the area under the relevant
curve in the recorded current-potential or current-time graphs.

Chapter 3 Materials and Methods 96
3.2.2 Oxidation and Leaching System
3.2.2.1 Reactor system
The oxidation and leaching experiments were carried out in a specially designed
1-liter glass reactor with a water jacket, four baffles symmetrically fixed on the inside
wall of the glass vessel, and a plastic (PVC) lid on the center of which a stationary motor
was mounted to control the speed of the agitator by means of a direct current (DC) power
supply. The detailed assembly of the reactor is shown in Figure 3.3. The rotation speed
was calibrated using a tachometer. The reactor was designed to use air for lubrication of
the seal. It had ports on the lid for various probes to monitor pH, dissolved oxygen, and
the potentials of different electrodes in the reaction system. The reactor was also
equipped with inlets for gas injection and for a cooling condenser for use at higher
temperatures. The temperature of the reactor was controlled by circulation of
thermostatted water through the water jacket as shown in Figure 3.4.
3.2.2.2 Gas supply system
In this work, commercially available high pure nitrogen, industrial grade oxygen
and pressured air (400 kPa, meter reading) from the compressed air system at Murdoch
University were used. The gas flow rate was measured using an air flowmeter (GAP
Meter, England) and controlled by adjusting the gas regulators and valves. Prior to
entering the reactor, the gases were pre-saturated with water vapor by bubbling through a
gas scrubber. The oxygen partial pressure in the reaction system was controlled by
adjusting the flowrates of oxygen and nitrogen under same pressures.

Chapter 3 Materials and Methods 97
(a) R
otat
ing
rig(d
) Lug
gin
capi
llary
(g) R
otat
ing
mot
or
(b) E
lect
roch
emic
al c
ell
(c) W
orki
ng e
lect
rode
(e) R
efer
ence
ele
ctro
de
(f) C
ount
er e
lect
rode
(h) R
otat
ing
cont
rolle
r
(i) P
oten
tiost
at
(j) L
abV
iew
syst
em
(k) P
rinte
r
(l) X
-Y re
cord
er
(m) W
ater
bat
h
(n) G
as c
ylin
der
(o) G
as sc
rubb
er
(a)
(d)
(b)
(c)
(g )
(f)
(e)
( j)
(i)
(h)
(l)
(k)
(m) (n
)
(o)
Figu
re 3
.2
A sc
hem
atic
pre
sent
atio
n of
ele
ctro
chem
ical
set u
p.

Chapter 3 Materials and Methods 98
AirSeal
TaflonSeal
PortRubber O-ring
RubberConnection
StainlessSteel
PVC Impeller
PVC Cover
DCMotor
GlassVessel
154
mm
2 m
m
Φ 100 mm
Φ 44 mm
15 m
m
18 m
m
Figure 3.3 Assembly of reactor and agitating units.

Chapter 3 Materials and Methods 99
Figu
re 3
.4
A sc
hem
atic
pre
sent
atio
n of
reac
tor s
yste
m fo
r oxi
datio
n of
sulfi
de m
iner
als a
nd d
isso
lutio
n of
gol
d.

Chapter 3 Materials and Methods 100
3.2.2.3 Monitoring system
a) pH measurement. An Activon pH probe was mounted in the reactor and
immersed in the reaction solution or slurry throughout an experiment. The pH signal was
monitored by an Activon pH meter (Model 101) and recorded with the computer based
LabViewTM data acquisition system. No attempt was made to control the pH at a constant
value. BDH colour coded buffers of pH 7 and pH 10 were used for the calibration of the
pH probe before each use. In the case of pH measurements in alkaline solutions, a pH
value higher than 12 is not considered accurate due to the limited working range of the
pH probe.
b) Eh measurement. The solution or slurry potential during reaction was
continuously monitored and recorded with the LabViewTM data acquisition system using
platinum and gold electrodes. In some experiments involving the oxidation of sulfide
minerals, arsenopyrite or pyrite electrodes were used to monitor the potential response of
the mineral in solutions.
A platinum electrode with a combined Ag/AgCl reference electrode (Metrohm,
Switzerland) was used for the determination of the solution or slurry potential. The
potential response of a gold wire electrode that was constructed in the workshop at
Murdoch University was also recorded simultaneously with the same reference electrode.
Aarsenopyrite and pyrite electrodes were made by embedding a small rectangular chip
(about 3 × 3 × 10 mm) of crystalline arsenopyrite or pyrite mineral in a glass tube filled
with epoxy resin. Conducting silver glue was employed to connect the mineral chip to a
copper wire that was used for exterior connection. Figure 3.5 shows a schematic diagram
of these electrodes. The potential of the arsenopyrite or pyrite electrode was recorded

Chapter 3 Materials and Methods 101
against the Ag/AgCl reference electrode. However, all potentials reported in this study
have been converted to the SHE scale according to Equations 3.2 and 3.3. It should be
pointed out that the reported Eh is generally a mixed potential because there are many
reactions involved during the oxidation of sulfide minerals and the leaching of gold in
the reactor (see Section 2.4.5 for mixed potential).
c) Measurement of dissolved oxygen. Dissolved oxygen in solution was
measured using a TPS dissolved oxygen sensor (Model ED1) which was connected to
the LabViewTM data acquisition system. The relationships between the concentrations of
dissolved oxygen (Caq) and the potentials recorded (E) at various temperatures were
established by recording the potentials of the oxygen probe in solutions of different
concentrations of dissolved oxygen. Zero concentration of dissolved oxygen was
achieved by the addition of a concentrated sulfite solution. The solutions of different
oxygen concentrations were obtained by bubbling compressed air continuously into
solutions of different sodium hydroxide concentrations at various temperatures. Then the
dissolved oxygen concentration was calculated using the following equation established
by Tromans (1998).
Caq = (1 + κ C y ) -η Po2 ƒ(T) (3.4)
where Caq is the molal concentration of dissolved oxygen in a solution of an inorganic
solute; C is the molality of the solute (mol per kg water); Po2 is the partial pressure of
oxygen; ƒ(T) is a temperature-dependent function (Tromans, 1998); the coefficient κ and
the exponents y and η are solute-specific and have positive values. For NaOH solute, κ =
0.102078, y = 1.00044, η = 4.308933. At various temperatures, linear relationships
between the dissolved oxygen and the recorded potential of the oxygen sensor were
calculated and are shown in Table 3.2.

Chapter 3 Materials and Methods 102
Platinum wire
Ag/AgCl
KCl solution
Glass frit
Gold wire
Silver solder
Glass tube
Copper wire
Mineral chip
Silver glue
Copper wire
Mineral surface
Glass tube
Figure 3.5 Schematic presentation of combined Pt-Ag/AgCl electrode, gold and mineral electrodes.
Table 3.2 Relationships between O2 concentration and the potential of O2 sensor
Temperature / °C Relationship (Caq / mg l-1; E / V) 25 Caq = 43.43 E – 0.48 35 Caq = 35.02 E – 0.59 40 Caq = 30.92 E – 0.45 45 Caq = 26.82 E – 0.32 55 Caq = 21.12 E – 0.27

Chapter 3 Materials and Methods 103
3.3 Experimental Methods
3.3.1 Electrochemical Measurements
For electrochemical studies, de-ionized water from a Millipore Milli-Q system
was used for all purposes. Prior to each experiment, the working disk electrode was
polished using P1200 and P2400 grade silicon carbide waterproof paper and rinsed with
de-ionized water, and then put in the test solution in the electrochemical cell when dry.
Nitrogen or oxygen was bubbled through the solution throughout the experiment.
3.3.1.1 Open circuit potential (OCP) measurement
The open circuit potential, or rest potential is that exhibited by an electrode when
immersed in solution without any externally applied potential. It is determined by the
individual reversible potentials and kinetics of all the contributing half-cell reactions
which occur on the electrode so that no net current flows. Therefore, it is a so-called
mixed potential and indicates the potential region for possible reactions on the electrode
in solution. In this work, the OCP was measured under nitrogen or oxygen atmospheres,
using a rotating disk electrode and the Ag/AgCl reference electrode. The potential
difference between the rotating disk electrode and the reference electrode was recorded
as a function of time using the LabViewTM system.
3.3.1.2 Cyclic voltammetry
This electrochemical technique is commonly used to identify the potential region
of possible anodic and cathodic processes taking place on an electrode. In this technique

Chapter 3 Materials and Methods 104
the current is measured as the potential applied to an electrode (by means of a
potentiostat) is changed linearly with time over a potential range, and plotted against the
applied potential on a X-Y chart resulting in a current-potential curve which is called as
cyclic voltammogram as shown in Figure 3.6. A rate of a particular electrode reaction is
indicated by the sign and magnitude of the current and the potential is an indicator of the
equilibrium potential of the reaction. A current peak or plateau generally indicates that
the rate is limited by diffusion of reactants or passivation of the surface (Rieger, 1994).
For diffusion-controlled reactions, the peak current is proportional to the reactant
concentration and to the square root of the potential scan rate (V s-1). If only a single
anodic (positive) or cathodic (negative) sweep is performed, the technique is usually
called linear potential sweep voltammetry (Rieger, 1994).
-30
0
30
60
90
120
150
0 0.2 0.4 0.6 0.8 1
Potential (V)
Cur
rent
den
sity
(µA
cm
-2)
ipa
Epa
Epc
ipc
Figure 3.6 A cyclic voltammogram at 5 mV s-1 of a rotating (500 rpm) gold electrode in 0.1 M NaOH solution at room temperature. Epa = anodic peak potential; Epc = cathodic peak potential; ipa = anodic peak current; ipc = cathodic peak current. The arrows indicate direction of the potential sweep.

Chapter 3 Materials and Methods 105
All voltammograms in this work were initiated after one minute of immersion of
gold or platinum electrode in relevant solutions at room temperatures. The solution in the
electrochemical cell for each voltammetric experiment was purged with high purity
nitrogen gas for 30 minutes prior to the experiment, and during the whole experiment.
3.3.1.3 Constant potential coulometry
This technique is based on Faraday’s laws of electrolysis, i.e. to measure the
charge passed through the electrochemical cell when a constant potential is applied to the
working electrode. If an anodic reaction occurs on the working electrode and N moles of
species R are oxidized to species O (Rieger, 1994),
R - n e- = O (3.5)
the electric charge through the cell, Q, should be equal to N n F (Coulombs), i.e.
Q = N n F (3.6)
where F is Faraday constant (96485 Coulombs mol-1) and n is the number of moles of
electrons per mole of reaction (mol mol-1). If Q and n are known, N can be determined. If
the measured Q’, on the other hand, is larger than the calculated Q according to Equation
3.6 for known values of n and N, there must be other anodic reactions taking place on the
working electrode. Thus, a current efficiency, ξ for the oxidation of R is given as the
following
ξ = Q / Q’ (3.7)
In this work, coulometry was used to study the electrochemical dissolution of
gold in alkaline solutions at potentials lower than 0.4 V which is the standard reduction
potential of oxygen at pH 14, to establish whether gold could dissolve in the solutions
with oxygen. In the coulometric experiments, 30-ml of solution was used in the cell and

Chapter 3 Materials and Methods 106
it was purged with nitrogen gas for 30 minutes. The polished dry gold rotating disk
electrode was then immersed in the solution and the constant potential was applied. The
current was recorded as a function of time using a LabViewTM data acquisition system.
Thus, the charge passed through the cell could be calculated by integration of the area
under the recorded current-time curve using Origin 5.0 software. During some
experiments, a solution sample of 3 ml was taken from the cell at intervals and a fresh 3
ml solution of the same electrolyte concentration was returned to the cell to keep the
solution volume approximately constant. The samples and the final solution were
analyzed for gold by atomic absorption spectrometry (AAS).
3.3.2 Dissolution of Gold
Experiments involving the dissolution of fine gold powder in thiosulfate or
thioarsenate solutions were carried out in the glass reactor shown in Figures 3.3 and 3.4.
Before the run, a known amount of fine gold powder was added into the reactor either as
is or after wet-milling for 30 minutes in a small porcelain ball mill as shown in Figure
3.7. An alkaline solution containing thiosulfate or thioarsenate was added with nitrogen
gas initially bubbled into the reactor. In the study of the effect of copper ions, the
required amount of concentrated cupric sulfate solution was added before adjusting the
pH of the aqueous solution. When the required temperature of 25 °C was achieved,
oxygen was bubbled into the solution to initiate the dissolution of gold. The agitation
was controlled at 800 rpm. During the leaching experiments, samples (5 ml) of the
reacting solution were taken at given intervals and filtered through a 0.45 µm nylon
membrane filter for analysis of gold by AAS. In some tests, gold powder was milled
together with copper metal or copper oxide before addition to the reactor.

Chapter 3 Materials and Methods 107
1. R
otat
ing
mot
or
2. B
alan
ce b
lock
s 3
. Cen
trifu
gal b
all m
ill
4. T
rans
pare
nt sa
fety
cov
er
Mat
eria
l: M
ill v
esse
l - S
tain
less
stee
l or
porc
elai
n,Φ
150
mm
, 500
ml;
Mill
Bal
ls -
Stai
nles
s ste
el o
r po
rcel
ain,
Φ8
mm
, 85
bal
ls
1
23
Insi
de v
iew
Fron
t vie
w
Figu
re 3
.7
Mec
hani
cal m
ill fo
r ultr
a-fin
e gr
indi
ng o
f sul
fide
min
eral
s and
/or g
old
pow
der (
from
Ret
sch,
Ger
man
y).
4
Chapter 3 Materials and Methods 108
The experiments on the reaction of gold with thioarsenites were carried out prior
to the manufacture and setup of the reactor shown in Figures 3.3 and 3.4. In this case, a
500 ml Pyrex glass vessel with a water jacket was used. The lid of the vessel had several
ports for an impeller, a tube for air injection, a platinum electrode, a reference electrode,
and for sampling. In some experiments, the agitation of the solutions was provided using
an IKA-WERK model RW20 overhead stirrer and a Pyrex impeller. A rotating speed of
600 rpm was used to keep the gold power suspended. The temperature of the reaction
system was controlled via a water bath and the water jacket of the reactor. Unless
otherwise stated, tests were performed at 25 °C. The gas used (air or N2) was bubbled
into the reactor after passage through a water-containing bottle immersed in the water
bath and the amount of the gas was controlled by adjusting the flow rate. When the
thioarsenite solution was added into the reactor, nitrogen gas was injected to remove the
dissolved oxygen for 30 minutes. After the required temperature was achieved, a given
amount of fine gold powder was added into the reactor and air was sparged into the
solution to initiate the reaction. During the experiment, the pH of the solution was
measured using an Action pH meter and the mixed potential of the solution was
determined using a multimeter. Aqueous samples were taken from the reaction system at
intervals of time and filtered using a 0.45 µm nylon filter followed by analysis of gold
using AAS. In other experiments without any gas bubbling, a magnetic stirrer was used
to keep the gold powder in suspension and the reactor was covered with a plastic film.
3.3.3 Oxidation of Sulfide Minerals and Gold Concentrates
For the oxidation of pure sulfide minerals, the weighed mineral sample was
milled in a stainless steel ball mill as shown in Figure 3.7 with distilled water (water to
solid mass ratio = 1) in the presence or absence of fine gold powder for 60 minutes. The

Chapter 3 Materials and Methods 109
particle size of the mineral after milling was about 80% passing 4.2 µm as determined
using a laser size analyzer (see Section 3.4.8). The mineral slurry was then immediately
transferred into the reactor shown in Figure 3.4 with constant stirring and nitrogen gas
sparging to prevent possible oxidation by oxygen for 30 minutes. Then the required
amount of concentrated sodium hydroxide solution was added when the preset
temperature was achieved. The experiment was initiated by introducing compressed air
or oxygen gas into the reaction system through a flowmeter and a gas sparger. For
oxidation of refractory gold concentrates, the above procedure was followed without the
addition of fine gold powder. The particle sizes of the Wiluna concentrate samples milled
for 20, 60 or 120 minutes were measured using the laser size analyzer and were found to
be about 80% passing 12.4, 6.0 or 4.7 µm respectively (see Appendix A5). Distilled
water was used throughout these experiments.
During the oxidation experiments, samples (about 17ml) of the reaction slurry
were taken at various stages and filtered through a 0.45 µm nylon membrane filter
(Millipore, USA). The solid residues were returned to the reaction system and about 13
ml distilled water (17 ml × ¾ ≈ 13 ml) was added to keep the reaction volume
approximately constant. The filtrates were analyzed by AAS for As, Au, Cu and Fe, and
by ICP for As and S. The final oxidation products (including filtrate, washings and
residue) were also analyzed for Au, As, S and Fe. For oxidation of refractory gold
concentrates, the quantities of arsenopyrite and pyrite minerals in the residues were also
analyzed and estimated by the wet chemical digestion-ICP analysis, the details of which
can be found in Appendix A2.

Chapter 3 Materials and Methods 110
3.4 Analyses
All chemicals except those artificially synthesized in this study were used without
further purification. A detailed description of the reagents employed in the analyses can
be found in Table 3.1. The thioarsenates used in this study were synthesized in the
laboratory. This section describes the methods and procedures employed for the various
analyses conducted.
3.4.1 Atomic Absorption Spectrometry (AAS)
This technique was applied to determine the concentrations of gold, arsenic,
copper and iron in solution using a GBC Avanta AAS Model 933AA and an
air/acetylene flame.
3.4.1.1 Analysis for gold
Gold standard solutions for AAS were prepared dissolving Na3Au(S2O3)2·2H2O
(AR, 99.9%, Au = 35.78%) in 0.1 M Na2S2O3 solution to produce a concentration of 100
mg l-1 Au and then diluting to 2, 5, 10 mg l-1 Au using 0.1 M Na2S2O3 solution. At the
recommended wavelength of 242.8 nm, the detection limit is 0.08 mg l-1 Au. It was
found that arsenic also absorbed at this wavelength. Therefore, when analyzing samples
containing both gold and arsenic, arsenic was first determined by AAS and then the
absorbance from arsenic of the same concentration was subtracted from the total
absorbance of the samples to obtain the concentrations of gold. The error associated with
this technique for gold was found to be less than 5%.

Chapter 3 Materials and Methods 111
3.4.1.2 Analysis for arsenic
An arsenic standard solution of 1000 mg l-1 As from ALDRICH was employed to
prepare 20, 40, 60, 80, 100 mg l-1 As solutions for analysis by AAS. At the
recommended wavelength of 193.7 nm, the detection limitation of As was 0.7 mg l-1. The
analysis of As by AAS had an uncertainty of ± 5%.
3.4.1.3 Analysis for copper and iron
Dissolved iron standards were prepared from AR grade FeSO4·(NH4)2SO4·6H2O
dissolved in HCl solution and diluted to 2, 4, 6, 8, 10 mg l-1 Fe. Dissolved copper
standards were prepared from CuSO4·5H2O having 1, 2, 4, 5, 10 mg l-1 Cu. At the
wavelengths for copper and iron of 324.8 nm and 248.3 nm respectively, the detection
limits for copper and iron are 0.05 mg l-1. The analysis uncertainty is less than ± 3%.
3.4.2 Inductively Coupled Plasma Spectrometry (ICP)
This instrumental analysis technique was employed mainly for determination of
total dissolved sulfur in solution. It also used for analysis of arsenic in some cases, for
example, for comparison with results by AAS. The instrument is a Varian ICP Model
Liberty 200 located in Environmental Science at Murdoch University and wavelengths of
193.7 nm for arsenic and of 180.7 nm for sulfur were used. The uncertainty of the
analysis for sulfur was ± 5%.
3.4.3 UV/Visible Spectrophotometry

Chapter 3 Materials and Methods 112
This technique was used to qualitatively detect any possible dissolved species
that have absorbance in UV/Visible regions. The instrument was a Shimadzu MultiSpec-
1500 UV/Visible spectrophotometer. It was found using this technique that thiosulfate,
sulfide, sulfite, arsenite, arsenate and thioarsenates all have a positive absorbance while
sulfate has negative absorbance in the 195-300 nm region.
3.4.4 High Pressure Liquid Chromatography (HPLC)
This instrumental analysis technique was used to simultaneously determine
dissolved arsenic species such as arsenite, arsenate, thioarsenates and sulfur species such
as sulfate, sulfite, thiosulfate, tetrathionate and other polythionates. The analysis method
was based on the work reported by Schwedt and Rieckhoff (1996) for thioarsenate
determination, Tan and Dutrizac (1987) for As(III) and As(V) determination and Weir et
al. (1994) for sulfur species.
3.4.4.1 Instrumentation for HPLC
The instrumentation for HPLC consisted of an in-line degassing system (Alltech,
USA), a Waters 501 HPLC pump, a Rheodyne 7725i manual injector valve, a 20-µl
sample loop, a separation column, a Waters 481 LC spectrophotometer, a Waters System
Interface Module (SIM), and a Waters Millenium 32 workstation. Two separation
columns were used: the main analysis column was a PRP-X100 polymer anion exchange
column (Hamilton, USA), 150 mm × 4.1 mm ID, particle size 10 µm; the other was an
AllsepTM SS anion column (from Alltech), 100 mm × 4.6 mm ID, particle size 7 µm,
which was used in some cases for tetrathionate analysis. An All-guard column from
Alltech was employed to protect the separation column. The chromatographic analysis

Chapter 3 Materials and Methods 113
for all species except tetrathionate was carried out using 10 mM bicarbonate/carbonate
buffer solution (8 mM NaHCO3 + 2 mM Na2CO3) with a pH of 9.7 at a flow rate of 2.0
ml min-1 at 19 ± 1 °C using a detector wavelength of 205 nm. A 50-µl syringe was used
to introduce samples to the analysis system. The output was recorded and processed
using Waters Millenium 32 software. A schematic presentation of the instrumentation is
shown in Figure 3.8.
3.4.4.2 Solutions for HPLC
In this work AR grade chemicals were used for preparing standard solutions and
buffer eluants except thioarsenates which were synthesized according to Schwedt and
Riechhoff (1996). De-ionized water from Millipore Milli-Q system was used for all
solutions. All solutions were filtered through a 0.45 um nylon membrane filter
(Millipore, USA) before use.
a) Synthesis of thioarsenates. The thioarsenates (Na3AsO3S and Na3AsO2S2)
was synthesized in the laboratory because of the lack of commercially available reagents.
To prepare sodium monothioarsenate (Na3AsO3S), 1.44 grams of sublimed elemental
sulfur (0.045 mol S) was added to a mixture of 5.00 grams of As2O3 (0.050 mol As) and
6.00 grams of NaOH (0.150 mol Na) in 20 ml distilled water and then the solution was
heated to 100 °C. After 2 hours, the excess sulfur was filtered off and the solution was
cooled slowly to 4 °C. Colorless needle-shaped crystals were obtained and dried in a
vacuum desiccator. This material was mainly Na3AsO3S·12H2O with 16.73% As and a
purity of 98.3% as determined by analysis by AAS and HPLC. The impurities consisted
of minor amounts of Na2SO3, Na2S2O3 and Na3AsO3. The ion chromatogram for a
solution containing 3.03 mM Na3AsO3S is shown in Figure 3.9. The synthesis of

Chapter 3 Materials and Methods 114
dithioarsenate followed a similar procedure to the above but with an increased amount of
sulfur (Schwedt and Rieckhoff, 1996). This material was found to be a mixture of 34.1%
(by mass) Na3AsO2S2 and 16.7% Na3AsO3S as determined by AAS and HPLC. Figure
3.10 shows the ion chromatogram for a 0.25mM Na3AsO2S2 solution prepared using the
synthesized salt.
b) Standard solutions. The standard solutions of thioarsenates for HPLC were
made up by preparing first a solution of 10 mM and then diluting as appropriate using the
eluant. All standard solutions are given in Table 3.3. An arsenite solution of 10 mM was
prepared from As2O3 dissolved in 30 mM NaOH solution and diluted as appropriate. All
other AR chemicals were salts of sodium of the relevant ions (see Table 3.1). It is
noteworthy that the formula of some species has been modified to reflect their form in a
buffer of pH 9.7.
c) Buffer eluants. Sodium hydrogen carbonate, sodium carbonate and
acetonitrile were used to prepare mobile buffer solutions for HPLC. The main eluant was
10 mM bicarbonate/carbonate buffer solution (8 mM NaHCO3 + 2 mM Na2CO3) with a
pH of 9.7. In the analysis of tetrathionate, a solution of acetonitrile-water (50:50 volume
ratio) with 8 mM bicarbonate/carbonate (4 mM NaHCO3 + 4 mM Na2CO3) was
employed as a buffer solution. Prior to use for HPLC, the eluant was filtered through a
0.45 µm nylon membrane filter and degassed for 30 minutes in an ultrasonic apparatus.
d) Sample solutions. Sample solutions without any pretreatment were first
diluted to appropriate concentrations using the buffer solution and filtered through a 0.45
µm nylon membrane filter to protect the separation column. Thereafter, a 20 µl sample
was injected into the HPLC system using a 50-µl syringe.

Chapter 3 Materials and Methods 115
0.0
ALL
TEC
H
on
4 3
21
SIM
Lam
bda-
Max
481
Spec
tro-
phot
o-m
eter
0.05
205
1110
98
65
4
3
2112
7
1 M
obile
buf
fer s
olve
nt
2 O
n lin
e de
gass
ing
syst
em
3 W
ater
s 501
HPL
C p
ump
4 I
n lin
e fil
ter
5 S
yrin
ger
6 R
HEO
DY
NE
man
ual i
njec
tor
7 G
uard
col
umn
8 S
epar
atio
n co
lum
n
9 W
ater
s 481
spec
troph
otom
eter
10 W
ater
s sys
tem
inte
rfac
e m
odul
e
11 M
illen
nium
32 w
orks
tatio
n
12 W
aste
solv
ent
PC
PC
Fi
gure
3.8
In
stru
men
tatio
n se
t-up
for h
igh
pres
sure
liqu
id c
hrom
atog
raph
y.

Chapter 3 Materials and Methods 116
-20
80
180
280
380
480
580
680
780
880
0 10 20 30 4
Retention time (min)
UV
abs
orba
nce
(mV
)
0
a b
c
d
Figure 3.9 Ion chromatogram for a 3.03 mM solution of Na3AsO3S using CO3
2-- HCO3-
eluant with UV detection. (a) H2AsO3-, (b) SO3
2-, (c) HAsO3S2-, (d) S2O32-.
-100
-50
0
50
100
150
200
0 10 20 30 40
Retention time (min)
UV
abs
orba
nce
(mV
) ab
Figure 3.10 Ion chromatogram for a 0.25 mM Na3AsO2S2 solution prepared using the synthesized Na3AsO2S2 with UV detection and CO3
2--HCO3- eluant. (a) HAsO3S2-, (b)
HAsO2S22-.

Chapter 3 Materials and Methods 117
Table 3.3 Standard solutions for HPLC (Unit: mM)
HAsO3S2- HAsO2S22- H2AsO3
- HAsO42- SO3
2- SO42- S2O3
2-
Standard 1 0.10 0.25 0.02 0.5 0.05 0.5 0.10 Standard 2 0.20 0.50 0.04 1.0 0.10 1.0 0.50 Standard 3 0.60 0.75 0.06 2.0 0.20 2.0 1.0
3.4.4.3 Calibration and determination
Calibration curves for each species were established by plotting the peak areas of
the recorded traces as shown in Figures 3.11 and 3.12 against the standard concentrations
using the Waters Millenium 32 software. Linear relationships between the concentrations
and peak areas were obtained and are given in Table 3.4. Also shown are the detection
limits for these species and their retention times on a Hamilton PRP-X100 column with
an eluant containing 2 mM sodium carbonate and 8 mM sodium hydrogen carbonate. It
should be pointed out that the exact retention time for each species is sensitive to the
concentrations of the constituents and the flow rate of the eluant. Note that the peak for
sulfate ions is negative due to its negative absorption in the UV region.
From Figures 3.11 and 3.12, it can be seen that simultaneous analysis of arsenic
species and sulfur species using HPLC is possible on the Hamilton PRP-X100 column
using the sodium carbonate/sodium hydrogen carbonate eluant. The peaks for H2AsO3-,
HAsO3S2-, S2O32-, HAsO2S2
2- are good, but the peaks for HAsO42-, SO3
2-, SO42- tend to
overlap which results in a larger uncertainty in their concentrations, being of the order of
± 10% while the analysis error for H2AsO3-, HAsO3S2-, S2O3
2-, HAsO2S22- was found to
be less than 5%.

Chapter 3 Materials and Methods 118
020406080
100120140160180200
0 5 10 15 20 25 30 35 40
Retention time (min)
UV
abs
orba
nce
(mV
)
a
b
c
d e
Figure 3.11 Ion chromatogram showing peaks for (a) 0.10 mM H2AsO3
- , (b) 2.0 mM HAsO4
2-, (c) 2.0 mM SO42-, (d) 0.60 mM HAsO3S2-, (e) 1.0 mM S2O3
2- using UV detection and CO3
2--HCO3- eluant.
0
50
100
150
200
250
300
0 5 10 15 20 25 30
Retention time (min)
UV
abs
orba
nce
(mV
)
ab
cd
Figure 3.12 Ion chromatogram showing peaks for (a) 0.20 mM HAsO4
2-, (b) 0.25 mM SO3
2-, (c) 0.40 mM HAsO3S2-, (d) 1.0 mM S2O32- using UV detection and CO3
2--HCO3-
eluant.

Chapter 3 Materials and Methods 119
Table 3.4 Calibration curves for various species using HPLC
Species Peak Location
/ min Detection Limit
/ mM Relationship (A: area; C: concentration / mM)
H2AsO3- 1.15 0.008 A = 1450000 C - 9180
HAsO42- 6.8 0.1 A = 54300 C - 14500
SO32- 7.5 0.05 A = 1090000 C - 44800
SO42- 9.6 0.08 A = 68800 C + 476
HAsO3S2- 13 0.005 A = 1520000 C + 3610 S2O3
2- 25 0.02 A = 1480000 C - 16900 HAsO2S2
2- 36 0.005 A = 4241700 C
For the detection of sulfide ions or polysulfides, a new Hamilton PRP-X100
anion column was employed because, on the older Hamilton PRP-X100 column used for
the separation of most arsenic and sulfur species, peaks for sulfide ions occur very close
to that of hydroxyl ions. Sulfide ions were found being well separated from the hydroxyl
ions on the new Hamilton column using the same 10 mM bicarbonate/carbonate eluant
but the retention time was longer. The detection limit for sulfide ions was about 0.2 mM.
For analysis of real samples, arsenic and sulfur species except tetrathionate were
quantitatively determined simultaneously on the Hamilton PRP-X100 column.
Concentrations of each species were calculated from the peak areas of their relevant
peaks on the ion chromatogram using Waters Millennium 32 software. Figure 3.13 gives
a typical ion chromatogram for a real aqueous sample obtained during the oxidation of
arsenopyrite after 3 hours in aerated 0.625 M NaOH at 25 °C. It clearly shows that
monothioarsenate and thiosulfate are the two major products under these conditions.

Chapter 3 Materials and Methods 120
0
100
200
300
400
500
600
700
800
0 5 10 15 20 25 30 35 40
Retention time (min)
UV
abs
orba
nce
(mV
)
ab
c
d
ef
Figure 3.13 Ion chromatogram for a solution obtained during the oxidation of arsenopyrite in aerated 0.625 M NaOH at 25 °C after 3 hour. (a) H2AsO3
-, (b) HAsO42-,
(c) SO32-, (d) HAsO3S2-, (e) S2O3
2-, (f) HAsO2S22-.
3.4.5 X-Ray Diffraction (XRD) Analysis
This technique was employed to qualitatively analyze the composition and
structure of crystal or powder samples such as minerals, residues and gold concentrates.
Detailed results of XRD analysis using a Philips Model 1050 XRD spectrometer for
these solid samples can be found in Chapter 7, Chapter 8 and Appendix A4.
3.4.6 Scanning Electron Microscopy (SEM) Analysis
This instrumental technique was applied for the surface analysis of solid samples
and the surfaces of the disk electrodes. A Philips Model XL20 Scanning Electron
Microscope was used.

Chapter 3 Materials and Methods 121
3.4.7 Optical Microscopy
A Nikon Model EPIPHOT 200 optical microscope was employed to examine the
surface of solid materials, particularly the gold disk electrode before and after dissolution
in various solutions.
3.4.8 Particle Size Analysis
A MICROTRAC Model SRA150 laser size analyzer was used to measure the
particle size distribution after wet-milling of minerals and gold concentrates in the
Retsch centrifugal ball mill (Section 3.3.3).
3.4.9 Wet Chemical Analysis
Wet chemical techniques, followed by AAS and/or ICP were used to quantify
arsenic, sulfur, iron and/ or copper in solid samples such as minerals, gold concentrates,
oxidized residues and the synthetic orpiment. The powdered sulfide materials were
digested in an acidic bromine-bromide mixture before AAS or ICP analysis. The
procedures for the preparation of the bromine-bromide mixture and digestion of sulfide
materials can be found in Appendix A2.
3.4.10 Miscellaneous Analyses
Head assays for gold concentrates and some mineral samples were carried out by
UltraTrace Laboratory, WA. The elemental sulfur content of the leached residues was

Chapter 3 Materials and Methods 122
measured by carbon disulfide (CS2) extraction and weighing after evaporation of the CS2
solvent (sensitivity 0.2 mg) (Fernandez et al., 1996a, b; Papangelakis and Demopoulos,
1990).

Chapter 4 Electrochemical Dissolution of Gold in Alkaline Thiosulfate Solutions 123
CHAPTER 4 ELECTROCHEMICAL DISSOLUTION OF
GOLD IN ALKALINE THIOSULFATE
SOLUTIONS
4.1 Introduction
As reviewed in Chapter 2, one of the most promising alternatives to cyanide is
thiosulfate which is considered as a non-toxic lixiviant, especially for ores and
concentrates which cannot be economically treated due to excessive consumption of
cyanide or which contain so-called preg-robbing components which adsorb the
aurocyanide complex ion. Much work has been carried out with the aim of understanding
and improving the atmospheric ammoniacal thiosulfate leaching process for gold and
silver. Aylmore and Muir (2001) have recently provided a comprehensive review of the
chemistry involved. However, the thiosulfate leaching system has been found to be very
complicated and its process is still not fully understood, which in turn hinders the
development and application of the technology. In particular, the fundamental
electrochemistry of the anodic oxidation of gold and of the cathodic reduction of oxygen
and redox mediators such as the copper(II)/copper(I) couple have not been satisfactorily
explored.
As will be reported in Chapters 7 and 8, thiosulfate was detected as one of the
major oxidation products of arsenopyrite and refractory gold ores containing arsenopyrite
in strongly alkaline solutions. It was suspected that this species could be responsible for

Chapter 4 Electrochemical Dissolution of Gold in Alkaline Thiosulfate Solutions 124
the observation that gold was found to dissolve simultaneously with oxidation of these
minerals i.e. in the absence of cyanide. This chapter therefore summarizes the results of a
study of the anodic dissolution of gold in alkaline thiosulfate solutions by using a
rotating gold disk and electrochemical techniques. This work focuses on the anodic
oxidation of gold at potentials in the region of the mixed potential of gold in oxygenated
solutions, in order to establish whether this process could be responsible for the oxidative
dissolution of the gold by oxygen.
4.2 Results
As reviewed in Chapter 2, the dissolution of gold in aqueous solutions is an
electrochemical process and thus the rate of gold dissolution would be expected to be
dependent upon the potential of the leaching solutions (Nicol, 1993). Since dissolved
oxygen which could oxidize gold in thiosulfate solutions has a standard reduction
potential of 0.401 V at pH 14 (see Section 2.1.3.1), electrochemical studies were focused
on the potential range below 0.4 V.
4.2.1 Open Circuit Potentials
The potential attained by a gold electrode in aerated thiosulfate solutions should
be a mixed potential because of the expected reactions involving oxidation of gold and
reduction of oxygen (see Section 2.4.5). Therefore, open circuit potential (OCP)
measurements were carried out by recording the potential of a rotating gold disk in
alkaline thiosulfate solutions to establish the relevant potential region for anodic
oxidation of gold in alkaline thiosulfate solutions. Figure 4.1 shows the potential of the
gold electrode in a solution containing 1 M Na2S2O3 plus 0.1 M NaOH with nitrogen and

Chapter 4 Electrochemical Dissolution of Gold in Alkaline Thiosulfate Solutions 125
oxygen bubbling respectively. It can be seen that the potential of gold increases from 0.0
V to a value of 0.05 V when exposed to solutions saturated with oxygen. The latter can
be considered as a mixed potential which is within the potential range for the anodic
region observed in the cyclic voltammogram obtained for gold in a solution of 1 M
Na2S2O3 plus 0.1 M NaOH as shown in Figure 4.4. The value of this mixed potential is
in consistent with the rest potential of gold in thiosulfate solutions reported by Wan
(1997). However, the relevant current at the mixed potential is extremely low and not
suitable for accurate coulometric measurements. Thus subsequent electrochemical
dissolution experiments were performed at slightly more positive potentials (≥ 0.2 V).
-0.06
-0.04
-0.02
0
0.02
0.04
0.06
0.08
0 2 4 6 8 10 12
Time (hr)
Pote
ntia
l (V
)
O2
N2
14
Figure 4.1 OCP of a rotating (1000 rpm) gold electrode in 1 M Na2S2O3 + 0.1 M NaOH solutions under nitrogen and oxygen at 23 °C.
Open circuit potentials of the gold electrode in deoxygenated and oxygenated
thiosulfate solutions at a lower pH of 10.6 were also measured in the presence or absence
of ammonia and are shown in Figures 4.2 and 4.3. 0.1 M ammonium sulfate was used as

Chapter 4 Electrochemical Dissolution of Gold in Alkaline Thiosulfate Solutions 126
a supporting electrolyte and the pH adjusted by the addition of ammonia. From Figure
4.2 it can be seen that the OCP of gold in deoxygenated ammonia solution is higher than
in deoxygenated solutions containing thiosulfate at the same pH. Particularly, addition of
ammonia makes the OCP of gold in deoxygenated thiosulfate solution more negative.
This difference of the OCP of gold in deoxygenated solutions suggests that thiosulfate
ions are adsorbed on the surface of gold.
0
0.02
0.04
0.06
0.08
0.1
0.12
0.14
0.16
0 1 2 3 4
Time (hr)
Pote
ntia
l (V
)
(a)(b)
(c)
5
Figure 4.2 Open circuit potentials of a rotating (200 rpm) gold disk electrode in deoxygenated solutions of pH 10.6 at 25 °C. a) 1 M Na2S2O3 + 0.1 M (NH4)2SO4 ; b) 1 M Na2S2O3 ; c) 0.1 M (NH4)2SO4 . The pH of solutions a) and c) was adjusted with ammonia.
On the other hand, as shown in Figure 4.3, gold attains a higher potential in
oxygenated solution containing ammonia alone than in the solution containing thiosulfate
at the same pH. More important is that in the presence of ammonium and ammonia, the
potential of gold in oxygenated thiosulfate solution increases, which suggests that the
addition of ammonia may increase the dissolution rate of gold with oxygen as an oxidant.

Chapter 4 Electrochemical Dissolution of Gold in Alkaline Thiosulfate Solutions 127
0
0.02
0.04
0.06
0.08
0.1
0.12
0.14
0.16
0 1 2 3 4 5 6
Time (hr)
Pote
ntia
l (V
)
(a)
(b)
(c)
Figure 4.3 Mixed potentials of a rotating (200 rpm) gold disk electrode in oxygenated solutions of pH 10.6 at 25 °C. a) 1 M Na2S2O3 + 0.1 M (NH4)2SO4 ; b) 1 M Na2S2O3 ; c) 0.1 M (NH4)2SO4 . Solutions a) and c) were adjusted to pH 10.6 with ammonia.
4.2.2 Cyclic Voltammetry of Gold
4.2.2.1 Thiosulfate solutions
Cyclic voltammograms of gold and platinum electrodes in deoxygenated 1 M
Na2S2O3 and/or 0.1 M NaOH solutions are shown in Figure 4.4. Gold oxidizes in 0.1 M
NaOH solution at a potential higher than 0.6 V (Nicol, 1980b; Wierse et al., 1978) and
no reactions take place on platinum in 0.1 M NaOH solution in this potential range. In
the presence of thiosulfate there are noticeable oxidation currents on both gold and
platinum electrodes at the potentials above about 0.4 V. In the case of gold there is a
current peak at about 0.25 V in the solution containing 1 M Na2S2O3 and 0.1 M NaOH,

Chapter 4 Electrochemical Dissolution of Gold in Alkaline Thiosulfate Solutions 128
which is similar to that reported by Jiang et al. (1991; 1993a), Zhu et al. (1994a) and
Chen et al. (1996). Jiang et al. (1991, 1993a) have suggested that the current peak at
about 0.25 V corresponds to the anodic dissolution of gold by comparison with the
thermodynamic potential but they did not provide evidence for this conclusion. This
current peak can be attributed to either oxidation of thiosulfate or dissolution of gold, or
both.
0
200
400
600
800
1000
1200
1400
0 0.2 0.4 0.6 0.8 1 1.2
Potential (V)
Cur
rent
den
sity
(µA
cm
-2)
Au in Na2S2O3
Pt in Na2S2O3
Pt in NaOH
Au in NaOH
Figure 4.4 Cyclic voltammograms at 5 mV s-1 of rotating (200 rpm) gold and platinum electrodes in deoxygenated 0.1 M NaOH solutions with and without 1 M Na2S2O3 at 23 °C. Sweeps were initiated in a positive direction from the rest potential.
Cyclic voltammograms of the gold and platinum electrodes in a more dilute
solution containing 0.1 M Na2S2O3 plus 0.1 M NaOH are shown in Figure 4.5 from
which it is apparent that the current at about 0.25 V is very small compared to that in the
more concentrated solution. This result is in agreement with Zhu et al. (1994a) who
reported that there was no obvious anodic peak in dilute aqueous thiosulfate solution.

Chapter 4 Electrochemical Dissolution of Gold in Alkaline Thiosulfate Solutions 129
The anodic current at the same potential is somewhat higher on the gold than the
platinum electrode.
-50
0
50
100
0 0.2 0.4 0.6 0.8
Potential (V)
Cur
rent
den
sity
(µA
cm
-2)
Au
Pt
Figure 4.5 Cyclic voltammograms at 5 mV s-1 of rotating (200 rpm) gold and platinum electrodes in deoxygenated solutions containing 0.1 M Na2S2O3 and 0.1 M NaOH at 23 °C.
4.2.2.2 Formation of sulfur film
Anodic oxidation of thiosulfate to tetrathionate and sulfate has been found to
occur in slightly acid or neutral solutions by Glasstone and Hickling (1932). Previous
studies with regard to the electrochemical oxidation of thiosulfate in acid or neutral
solutions on gold and platinum electrodes (Loucka, 1998; Pedraza et al., 1988) have
shown that thiosulfate oxidizes at the potentials investigated, with the formation of a film
consisting of several sulfur bearing species on the electrodes.

Chapter 4 Electrochemical Dissolution of Gold in Alkaline Thiosulfate Solutions 130
The possibility of formation of a sulfur containing film during the anodic
oxidation of thiosulfate in alkaline solutions was investigated in this study by using the
method reported by Pedraza et al. (1988). After sweeping the potential of the gold
electrode for three cycles from 0 to 0.35 V in positive direction starting at 0 V in 1 M
Na2S2O3 solution containing 0.1 M NaOH, the gold electrode was transferred, after
rinsing, to another electrochemical cell containing only 0.1 M Na2SO4 solution for a
potential sweep in the negative direction from 0 V as shown in Figure 4.6. The sweep
was reversed at –0.8 V and reversed again at 1.6 V at 25 °C. The cathodic processes at
potentials less than –0.5 V are supposed to be related to the reduction of the sulfur film,
whereas the higher anodic peaks appearing at potentials greater than 1 V are also
evidence of sulfur species according to Pedraza et al. (1988). Similar behaviour was
reported by Wierse et al. (1978) and Hamilton and Woods (1983) for the reduction of a
sulfur-covered gold electrode in alkaline solutions. Hamilton and Woods (1983) assumed
that mono-layer sulfur coverage on polycrystalline gold involved 0.72 × 10¹⁵ atom cm-2,
equivalent to a deposition charge of 0.23 mC cm-2. In this case, estimation of the charge
involved in the oxidation of the sulfur species indicates that there is a multiple layer of
sulfur on the surface of gold, which is consistent with the results obtained by Loucka
(1998). Wierse et al. (1978) have suggested that the sulfur-like film on the gold surface
is insulating and probably responsible for the reported inhibition of redox reactions on a
gold electrode with such a film.
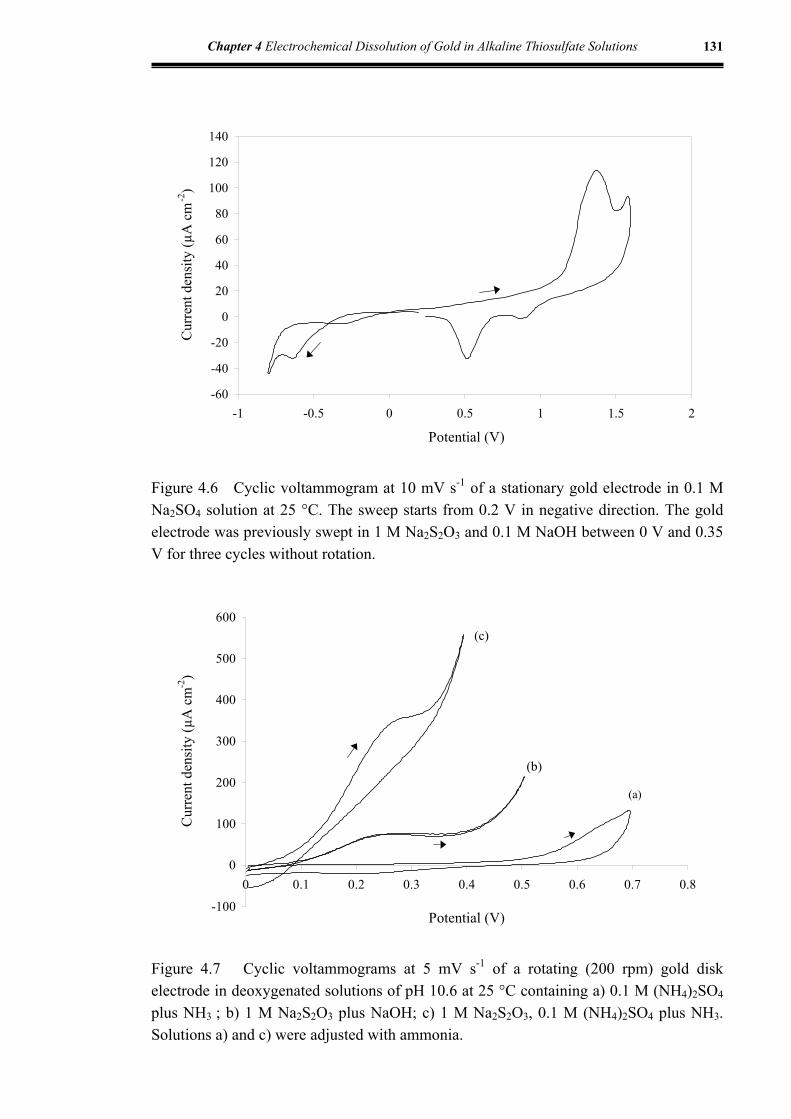
Chapter 4 Electrochemical Dissolution of Gold in Alkaline Thiosulfate Solutions 131
-60
-40
-20
0
20
40
60
80
100
120
140
-1 -0.5 0 0.5 1 1.5 2
Potential (V)
Cur
rent
den
sity
(µA
cm
-2)
Figure 4.6 Cyclic voltammogram at 10 mV s-1 of a stationary gold electrode in 0.1 M Na2SO4 solution at 25 °C. The sweep starts from 0.2 V in negative direction. The gold electrode was previously swept in 1 M Na2S2O3 and 0.1 M NaOH between 0 V and 0.35 V for three cycles without rotation.
-100
0
100
200
300
400
500
600
0 0.1 0.2 0.3 0.4 0.5 0.6 0.7 0.8
Potential (V)
Cur
rent
den
sity
(µA
cm
-2)
(c)
(b)
(a)
Figure 4.7 Cyclic voltammograms at 5 mV s-1 of a rotating (200 rpm) gold disk electrode in deoxygenated solutions of pH 10.6 at 25 °C containing a) 0.1 M (NH4)2SO4 plus NH3 ; b) 1 M Na2S2O3 plus NaOH; c) 1 M Na2S2O3, 0.1 M (NH4)2SO4 plus NH3. Solutions a) and c) were adjusted with ammonia.

Chapter 4 Electrochemical Dissolution of Gold in Alkaline Thiosulfate Solutions 132
4.2.2.3 Effect of ammonia
Since it appears that a sulfur-like film may cover the surface of gold and therefore
retard the dissolution of gold in alkaline thiosulfate solutions, it would be desirable to
eliminate or reduce the passivation of the gold in some ways. Addition of ammonia has
been found to increase the anodic current of gold in thiosulfate solutions (Jiang et al.,
1991 and 1993a; Zhu et al., 1994a; Chen et al., 1996). Hence, cyclic voltammetric
experiments were carried out with deoxygenated thiosulfate solutions in the presence and
absence of ammonia and the results are shown in Figure 4.7. Also shown is the
voltammogram of gold in ammonia solution without thiosulfate. As seen in Figure 4.7,
the anodic current in the solution containing only ammonia and ammonium ions is very
low at potentials below 0.4 V, which is in consistent with the results of leaching
experiments by Meng and Han (1993). However, when ammonia is added into the
thiosulfate solution, the anodic current markedly increases as compared to that in the
thiosulfate solution alone. The reason for this enhancement of the anodic current by
ammonia is possibly due to elimination or reduction of the sulfur film on the surface of
gold electrode as suggested by Figure 4.2.
4.2.2.4 Oxygen reduction
Oxygen reduction on the surface of gold in alkaline thiosulfate solution was
measured by cyclic voltammetry and is shown in Figure 4.8. Clearly, the cathodic
reduction current of oxygen on gold is very small in the mixed potential region of 0 to
0.1 V. This extremely low current suggests that the rate of oxidation of gold by oxygen
in alkaline thiosulfate solution would be very slow.

Chapter 4 Electrochemical Dissolution of Gold in Alkaline Thiosulfate Solutions 133
-250
-200
-150
-100
-50
0
50
-0.25 -0.2 -0.15 -0.1 -0.05 0 0.05 0.1 0.15 0.2 0.25
Potential (V)
Cur
rent
den
sity
(µA
cm
-2)
Figure 4.8 Reduction of oxygen on a rotating (400 rpm) gold disk electrode in 0.1 M Na2S2O3 solution with pH 12 at 25 °C. Potential sweep rate is 10 mV s-1.
4.2.3 Coulometric Experiments
To verify the extent of anodic dissolution of gold in alkaline thiosulfate solutions,
coulometric experiments were carried out by applying a constant potential to the rotating
gold disk in the electrochemical cell containing alkaline thiosulphate solution for several
hours. The current passed through the cell was recorded and the electric charge was
calculated by integration of the current-time transient. After the run, the solution was
analyzed for gold by AAS.
4.2.3.1 Effect of potential
Figure 4.9 and Table 4.1 show the average measured dissolution rates of gold
over a period of 12.5 hours in 1 M Na2S2O3 plus 0.1 M NaOH solutions for potentials in

Chapter 4 Electrochemical Dissolution of Gold in Alkaline Thiosulfate Solutions 134
the range 0.2-0.35 V at 23 °C. Also shown are the rates calculated from the measured
charge assuming a one-electron process (see Chapter 3). It is apparent that the trend in
the data in Figure 4.9 is similar to that observed in the voltammogram of gold shown in
Figure 4.4 with a peak at about 0.25 V. This suggests that the partial passivation on gold
observed in Figure 4.4 is a steady-state effect (Rieger, 1994).
0.0
1.0
2.0
3.0
4.0
5.0
6.0
7.0
0.15 0.2 0.25 0.3 0.35 0.4
Potential (V)
Ave
rage
rate
(10-1
0 mol
cm
-2 s-1
)
Figure 4.9 Anodic dissolution of a rotating (1000 rpm) gold electrode in 1 M Na2S2O3 plus 0.1 M NaOH solutions at different potentials at 23 °C for 12.5 hours. (◊) Calculated from charge; () Measured from dissolved gold.
Table 4.1 Average dissolution rates of gold in 1 M Na2S2O3 and 0.1 M NaOH solutions at various potentials over 12.5 hours at 23 °C, 1000 rpm rotation
Potential / V, SHE
Average Charge / F cm-2 s-1
Dissolution Rate / mol cm-2 s-1
Coulombic Efficiency
0.20 1.49 × 10⁻¹⁰ 4.53 × 10⁻¹¹ 0.30 0.26 4.31 × 10⁻¹⁰ 2.56 × 10⁻¹⁰ 0.59 0.30 3.51 × 10⁻¹⁰ 1.82 × 10⁻¹⁰ 0.52 0.35 6.13 × 10⁻¹⁰ 2.44 × 10⁻¹⁰ 0.40 Note: F is Faraday (96485 C mol-1)

Chapter 4 Electrochemical Dissolution of Gold in Alkaline Thiosulfate Solutions 135
Figure 4.9 shows that in the potential range under study, the average measured
charge is larger than the dissolution rate of gold in 1 M Na2S2O3 plus 0.1 M NaOH
solutions over 12.5 hours, indicating that competing processes occur, which confirms the
conclusion of Zhuchkov et al. (1994) that the anodic current cannot be used without
adjustment to determine the rate of gold dissolution in thiosulfate solutions. As shown in
Table 4.1, the average coulombic efficiency for the dissolution of gold increases from
30% at 0.2 V to 59% at 0.25 V before declining to 40% at 0.35 V. The competing
process involving the oxidation of thiosulfate therefore becomes more prominent at the
higher potentials as was suggested by the results in Figure 4.4.
To better understand the kinetic behaviour of the anodic dissolution of gold in
thiosulfate solution, a similar experiment was performed in a deoxygenated solution
containing 1 M Na2S2O3 and 0.1 M NaOH at a potential of 0.25 V. The results shown in
Figure 4.10 demonstrate that the current passed through the cell increases rapidly at the
start of the experiment achieving a plateau at about 60 µA cm-2 followed by a
progressive decrease to about 15 µA cm-2 after 5 hours, suggesting that the passivation
process is relatively slow at this potential. The measured dissolution rate of gold
followed a similar pattern with a decrease after 5 hours. At 0.5 hour, however, dissolved
gold was not detected indicating that there is an induction period for the dissolution of
gold. Figure 4.11 gives the calculated coulombic efficiency during this experiment.
Clearly, the oxidation of thiosulfate is favored during the first 3 hours after which the
coulombic efficiency for dissolution of gold stabilized at about 55%. Visual and
microscopic examination of the gold electrode after this experiment (Figure 4.12)
revealed the presence of a brown film in addition to corrosion pits on the surface.

Chapter 4 Electrochemical Dissolution of Gold in Alkaline Thiosulfate Solutions 136
0
10
20
30
40
50
60
70
0 2 4 6 8 10 12 14
Time (hr)
Ano
dic
curr
ent d
ensi
ty (µ
A c
m-2
)
0
1
2
3
4
5
Gol
d co
ncen
tratio
n (m
g l-1
)
Figure 4.10 Anodic dissolution of a rotating (200 rpm) gold disk in a solution containing 1 M Na2S2O3 plus 0.1 M NaOH at 0.25 V and 25 °C.
0
0.1
0.2
0.3
0.4
0.5
0.6
0 2 4 6 8 10 12
Time (hr)
Ano
dic
curr
ent e
ffic
ienc
y
14
Figure 4.11 Coulombic efficiency during anodic oxidation of a rotating (200 rpm) gold disk in a deoxygenated solution containing 1 M Na2S2O3 and 0.1 M NaOH at 0.25 V and 25 °C.

Chapter 4 Electrochemical Dissolution of Gold in Alkaline Thiosulfate Solutions 137
Figure 4.12 Optical microscope image of a gold disk after anodic oxidation in 1 M Na2S2O3 and 0.1 M NaOH solutions for 12.5 hours at 0.25 V and 25 °C.
The method of Pedraza et al. (1988) as described above was again utilized to
confirm the existence of the sulfur-like film on the gold electrode. The results of the
voltammograms in 0.1 M Na2SO4 solution are shown in Figure 4.13. The current peak at
a potential of about 1.4 V shown in Figure 4.13 is due to the oxidation of the sulfur-like
film on the gold electrode. An untreated gold electrode gives a much lower current in this
potential region. As before, the charge associated with the peak at 1.4 V is such that
multi-layers are involved. Attempts to collect sufficient material for either chemical or
XRD analysis were not successful.

Chapter 4 Electrochemical Dissolution of Gold in Alkaline Thiosulfate Solutions 138
-100
-50
0
50
100
150
200
250
0 0.2 0.4 0.6 0.8 1 1.2 1.4 1.6 1.8
Potential (V)
Cur
rent
den
sity
(µA
cm
-2)
Figure 4.13 Cyclic voltammograms (10 mV s-1) for gold in 0.1 M Na2SO4 solutions. The sweeps start from 0 V in the positive direction. (- - - -) fresh gold electrode; (——) gold electrode oxidized at 0.25 V in 1 M Na2S2O3 and 0.1 M NaOH solutions for 12.5 hours at 25 °C.
0.0
1.0
2.0
3.0
4.0
5.0
6.0
0 200 400 600 800 1000
Agitation speed (rpm)
Ave
rage
rat
e (1
0 -1
0 mol
cm
-2 s-1
)
Figure 4.14 Effect of rotation on anodic dissolution of gold in alkaline 1 M Na2S2O3 solutions for data from Table 4.2. () measured charge; (◊) measured dissolution of gold.

Chapter 4 Electrochemical Dissolution of Gold in Alkaline Thiosulfate Solutions 139
4.2.3.2 Effect of rotation speed
Figure 4.14 and Table 4.2 show that rotation of the gold disk electrode has little
effect on the anodic dissolution of gold, with the rate without rotation being only slightly
lower than that at rotation speeds of 200 rpm and 1000 rpm. This result suggests the rate
of dissolution of gold is controlled by the rate of the electrochemical reaction rather than
diffusion.
Table 4.2 Effect of rotation speed on the average anodic dissolution rate of gold in a solution containing 1 M Na2S2O3 and 0.1 M NaOH at 0.25 V, 25 °C over 12.5 hours
Rotation Speed
/ rpm Average Charge
/ F cm-2 s-1 Dissolution Rate
/ mol cm-2 s-1 Coulombic Efficiency
0 2.58 × 10⁻¹⁰ 1.45 × 10⁻¹⁰ 0.56 200 3.13 × 10⁻¹⁰ 1.66 × 10⁻¹⁰ 0.53 1000 5.07 × 10⁻¹⁰ 2.71 × 10⁻¹⁰ 0.53
4.2.3.3 Effect of temperature
The effect of temperature on the anodic dissolution of gold was investigated by
carrying out the coulometric experiments at a constant potential of 0.25 V at various
temperatures over 12.5 hours in a solution containing 1 M Na2S2O3 and 0.1 M NaOH.
The results are shown in Table 4.3 which demonstrates that, as expected, a higher
temperature results in a higher average anodic current and dissolution rate of gold. The
coulombic efficiency does not appear to show a consistent trend with temperature but is
generally about 50%. Figure 4.15 shows the current-time transients during these

Chapter 4 Electrochemical Dissolution of Gold in Alkaline Thiosulfate Solutions 140
experiments. It can be seen that the reaction rate is much higher in the initial stage and
after some time decreases to a lower level, which may be due to the formation of a
partially passivating film on the gold surface.
Table 4.3 Effect of temperature on the average anodic dissolution rate of gold in 1 M Na2S2O3 and 0.1 M NaOH solutions at 0.25 V, 200 rpm over 12.5 hours
Temperature
/ °C Average Charge
/ F cm-2 s-1 Dissolution Rate
/ mol cm-2 s-1 Coulombic Efficiency
25 3.13 × 10⁻¹⁰ 1.66 × 10⁻¹⁰ 0.53 35 7.42 × 10⁻¹⁰ 3.77 × 10⁻¹⁰ 0.51 45 15.6 × 10⁻¹⁰ 9.78 × 10⁻¹⁰ 0.63 55 42.0 × 10⁻¹⁰ 17.5 × 10⁻¹⁰ 0.42
0
100
200
300
400
500
600
700
800
0 2 4 6 8 10 12
Time (hr)
Ano
dic
curr
ent d
ensi
ty (µ
A c
m-2
)
55°C
45°C
35°C25°C
14
Figure 4.15 Current-time transients during the anodic dissolution of a rotating (200 rpm) gold disk in a solution containing 1 M Na2S2O3 and 0.1 M NaOH at various temperatures at 0.25 V.

Chapter 4 Electrochemical Dissolution of Gold in Alkaline Thiosulfate Solutions 141
Based on these results, the activation energy of anodic dissolution of gold in 1 M
Na2S2O3 solutions can be estimated as follows. The reaction rate may be expressed by
the Arrhenius equation:
r = A exp-Ea/(RT) (4.1)
where r is the average rate of the reaction (from Table 4.3); A is a pre-exponential factor;
Ea is the activation energy (J mol-1); R is the universal gas constant and T is the absolute
temperature (K). A plot of ln r vs T-1 shown in Figure 4.16 gives an apparent activation
energy of about 65 kJ mol-1 for the dissolution of gold in the alkaline thiosulfate
solutions suggesting that, as expected from the minimal effect of rotation speed on the
rate, the rate of dissolution is chemically controlled at this potential, since diffusion
controlled reactions usually have an activation energy of less than 25 kJ mol-1 (Power
and Ritchie, 1975).
-23
-22.5
-22
-21.5
-21
-20.5
-20
0.003 0.0031 0.0032 0.0033 0.0034
T-1 (K-1)
ln r
Ea = 65.2 kJ mol-1
Figure 4.16 Arrhenius plot for data from Table 4.3.

Chapter 4 Electrochemical Dissolution of Gold in Alkaline Thiosulfate Solutions 142
4.2.3.4 Effect of pH
Table 4.4 and Figure 4.17 summarize the effect of pH on the anodic dissolution
rate of gold in a solution of 1 M Na2S2O3 at various pH values adjusted by the addition of
sodium hydroxide at a potential of 0.25 V. The results indicate that the dissolution rate of
gold increases significantly with increasing pH value of the solution.
Table 4.4 Effect of pH on the average anodic dissolution rate of gold in 1 M Na2S2O3 solutions at 0.25 V, 25 °C and 200 rpm rotation over 12.5 hours
pH Average Charge
/ F cm-2 s-1 Dissolution Rate
/ mol cm-2 s-1 Coulombic Efficiency
10.6 1.03 × 10⁻¹⁰ 0.66 × 10⁻¹⁰ 0.63 12 1.27 × 10⁻¹⁰ 0.88 × 10⁻¹⁰ 0.69 13 3.13 × 10⁻¹⁰ 1.66 × 10⁻¹⁰ 0.53
0.0
1.0
2.0
3.0
4.0
10 11 12 13 14
pH
Ave
rage
rate
(10-
10 m
ol c
m-2 s-
1 )
Figure 4.17 Effect of pH on anodic dissolution of gold in the alkaline 1 M Na2S2O3 solutions for data from Table 4.4. () Measured charge; (◊) Measured dissolution rate of gold.

Chapter 4 Electrochemical Dissolution of Gold in Alkaline Thiosulfate Solutions 143
4.2.3.5 Effect of thiosulfate concentration
The effect of the concentration of thiosulfate was studied by repeating the
experiment in solutions containing 0.1, or 0.5 M Na2S2O3 and 0.1 M NaOH in order to
compare with the results obtained in 1 M Na2S2O3 solution under same conditions. The
results shown in Table 4.5 and Figure 4.18 indicate that there is very little gold
dissolution in the dilute 0.1 M Na2S2O3 solution confirming the result obtained by cyclic
voltammetry in 0.1 M Na2S2O3 solution. The anodic dissolution rate of gold increases
linearly with thiosulfate concentration while the coulombic efficiency decreases as the
thiosulfate concentration increases, which suggests that the reaction order for the
dissolution of gold is one and that the order for thiosulfate oxidation is greater than one.
0
5
10
15
20
25
30
35
0 0.2 0.4 0.6 0.8 1 1.2
[Na2S2O3] (M)
Ave
rage
rate
(10-1
1 mol
cm
-2 s-1
)
Figure 4.18 Effect of Na2S2O3 concentration on anodic oxidation of gold at 0.25 V for data from Table 4.5. (◊) Measured charge; () Dissolved gold.

Chapter 4 Electrochemical Dissolution of Gold in Alkaline Thiosulfate Solutions 144
Table 4.5 Effect of Na2S2O3 concentration on the average anodic dissolution rate of gold in 0.1 M NaOH solutions at 0.25 V, 25 °C, 200 rpm over 12.5 hours
[Na2S2O3]
/ M Average Charge
/ F cm-2 s-1 Dissolution Rate
/ mol cm-2 s-1 Coulombic Efficiency
0.1 6.01 × 10⁻¹² 5.98 × 10⁻¹² 0.99 0.5 9.52 × 10⁻¹¹ 7.44 × 10⁻¹¹ 0.81 1 3.13 × 10⁻¹⁰ 1.66 × 10⁻¹⁰ 0.53
0
10
20
30
40
50
60
70
0 2 4 6 8 10 12
Time (hr)
Ano
dic
curr
ent (
µA c
m-2
)
(a)
(b)
(c)
14
Figure 4.19 Current-time transients during anodic oxidation of gold at 0.25 V in (a) 1.0 M , (b) 0.5 M, (c) 0.1 M Na2S2O3 solutions at 25 °C, 200 rpm.
Figure 4.19 shows the variation of anodic current during the oxidation of gold in
different concentrations of thiosulfate. In the 0.1 M Na2S2O3 solution, the anodic current
is very small whereas the current is much higher in the 0.5 M or 1 M Na2S2O3 solution.
In all cases, the anodic current increases to a high level initially and then gradually
decreases after some time. Considering the results given in Table 4.5, it appears that the
higher current in the initial stage of the anodic oxidation is mainly due to the oxidation of

Chapter 4 Electrochemical Dissolution of Gold in Alkaline Thiosulfate Solutions 145
thiosulfate ions and it depends on the concentration of thiosulfate. The decrease of the
anodic current in the late stage may be attributed to the formation of a partially
passivating film on the surface of gold as suggested in Section 4.2.3.1.
4.2.3.6 Effect of ammonia concentration
The data in Table 4.6 show that the addition of ammonia leads to a higher rate of
dissolution of gold at 0.25 V in thiosulfate solutions compared to the rate in thiosulfate
solutions adjusted to the same pH of 10.6 with NaOH. The rate of oxidation of
thiosulfate also apparently increases in the presence of ammonia. In the absence of
thiosulfate, no gold was detected after 12.5 hours at a potential of 0.25 V.
The current-time transients obtained during these experiments are shown in
Figure 4.20. It is apparent that the anodic oxidation current increases quickly to a
maximum before decreasing over a period of several hours to a steady value which is
significantly greater in the presence of ammonia. In the absence of thiosulfate, there is a
negligibly small current in aqueous ammonia solution.
Table 4.6 Effect of ammonia concentration on the average anodic dissolution rate of gold in 1 M Na2S2O3 solutions at pH 10.6, 0.25 V, 25 °C and 200 rpm over 12.5 hours
Medium Average Charge
/ F cm-2 s-1 Dissolution Rate
/ mol cm-2 s-1 Coulombic Efficiency
1 M S2O32- + 0.2 M NH4
++ NH3 2.13 × 10⁻¹⁰ 1.42 × 10⁻¹⁰ 0.66 1 M S2O3
2- + NaOH 1.03 × 10⁻¹⁰ 0.66 × 10⁻¹⁰ 0.63 0.2 M NH4
+ + NH3 5.17 × 10⁻¹² < 10−12 -

Chapter 4 Electrochemical Dissolution of Gold in Alkaline Thiosulfate Solutions 146
0
10
20
30
40
50
60
70
80
0 2 4 6 8 10 12 14
Time (hr)
Ano
dic
curr
ent d
ensi
ty (µ
A c
m-2
)
(a)
(b)(c)
Figure 4.20 Current-time transients during anodic dissolution of a rotating (200 rpm) gold disk at 0.25 V in solutions of pH 10.6 containing (a) 1 M Na2S2O3, NH3 and 0.1 M (NH4)2SO4 ; (b) 1 M Na2S2O3 and NaOH ; (c) NH3 and 0.1 M (NH4)2SO4 without Na2S2O3 at 25 °C.
The appearance of the electrode was different when examined after each
experiment in that, without the addition of ammonia, a visible yellowish brown film was
present which can be easily rubbed from the surface. On the other hand, no visible film
was observed on the pitted surface after the experiment in the presence of ammonia.
4.3 Discussion
4.3.1 Gold in Thiosulfate Solutions
Measurements of the open circuit potentials of gold in alkaline thiosulfate
solutions without ammonia in the presence or absence of oxygen have shown (Figures

Chapter 4 Electrochemical Dissolution of Gold in Alkaline Thiosulfate Solutions 147
4.1 and 4.3) that the mixed potential of gold in oxygenated thiosulfate solutions is in the
range of 0 to 0.1 V. The cyclic voltammograms shown in Figures 4.4 and 4.5 have
indicated that in this mixed potential region the anodic oxidation rate of gold in
thiosulfate solutions is very low. The reduction of oxygen on gold is also very slow in
this mixed potential region as shown in Figure 4.8. These results suggest that gold could
dissolve in alkaline thiosulfate solutions with oxygen as an oxidizing agent in the
absence of copper ions and ammonia but that its dissolution rate would be extremely
slow.
The dissolution rate of gold at the mixed potential can be estimated from the
experimental results obtained in the coulometric studies. The rate of anodic dissolution
of gold in alkaline thiosulfate solutions in the potential range from 0.2 to 0.35 V has been
established as shown in Table 4.1 and Figure 4.9. It is reasonable to extrapolate the data
in Figure 4.9 to the mixed potential in an oxygenated thiosulfate solution to give a rate of
less than 10-11 mol cm-2 s-1. This value is very low as compared to that in aerated cyanide
solutions of about 5 × 10⁻⁹ mol cm-2 s-1 (Jeffrey and Ritchie, 2000). In a preliminary
study reported by Webster (1986), dissolution of gold was detected in 0.1 M Na2S2O3
solutions without ammonia and copper after reaction with oxygen for 9 weeks. Zhang
and Nicol (2002) have estimated the actual dissolution rate of gold in neutral 0.1 or 1 M
Na2S2O3 solutions to be of the magnitude of 10-13 mol cm-2 s-1 which is similar to the rate
obtained in a 0.2 M Na2S2O3 solution with pH 12 in this study (see Chapter 5). These
estimated dissolution rates of gold in thiosulfate solutions are much lower than that
obtained by Jeffrey (2001) of about 4 × 10⁻⁹ mol cm-2 s-1 in ammoniacal thiosulfate
solutions containing copper ions.

Chapter 4 Electrochemical Dissolution of Gold in Alkaline Thiosulfate Solutions 148
The very low dissolution rate of gold in alkaline thiosulfate solutions may be
associated with the passivation of the surface of gold by a film containing sulfur species.
Figure 4.2 shows that adsorption of thiosulfate ions on the surface of gold occurs which
is reflected by the immediate decrease of the potential of a gold electrode when contacted
with thiosulfate solution. The cyclic voltammograms of gold in alkaline thiosulfate
solutions shown in Figures 4.4 and 4.5 suggest the possibility of adsorption on the
surface of gold (refer to Rieger, 1994) and also the absence of cathodic processes
suggests that the oxidation products are either dissolved or that the anodic process at
potentials studied is irreversible. The current-time transients (Figure 4.10) have
confirmed that the passivation process is relatively slow at a potential of 0.25 V. During
the pre-passive period, oxidation of thiosulfate and adsorption of thiosulfate ions on the
gold surface predominates, as there is an induction period for the dissolution of gold. The
passivation can only be observed several hours later and has been confirmed by the
existence of a multi-layer sulfur film on the surface of gold electrode (Figures 4.6, 4.12
and 4.13). The onset of passivation appears to occur more rapidly at higher temperatures
as shown in Figure 4.14.
From the viewpoint of thermodynamics, it is possible for thiosulfate to undergo
many reactions in the potential region studied. Some possible reactions involving
thiosulfate in alkaline solutions are given in Table 4.7 (Lyons and Nickless, 1968; Pryor,
1960). Thus, the anodic process on the surface of gold in alkaline thiosulfate solution
possibly involves an absorption reaction as the first step:
Au + S2O32- = Au | S2O3
2- (ads) (4.2)
and oxidation reactions as the second step:
2S2O32- (ads) = S4O6
2- (ads) + 2e- (4.3)
S4O62- (ads) = S4O6
2- (aq) (4.4)

Chapter 4 Electrochemical Dissolution of Gold in Alkaline Thiosulfate Solutions 149
Au | S2O32- (ads) = Au(S2O3)
- (ads) + e- (4.5)
Au(S2O3) - (ads) + S2O3
2- = Au(S2O3)23- (4.6)
The tetrathionate could undergo subsequent rapid decomposition to other sulfur species
under alkaline conditions:
S4O62- + 2OH- = S2O3
2- + SO42- + S0 + H2O (4.7)
4S4O62- + 6OH- = 5S2O3
2- + 2S3O62- + 3H2O (4.8)
Reaction 4.8 has been reported to be catalyzed by the presence of thiosulfate ions and the
rate is sensitive to temperature and pH, with higher temperatures and pH leading to rapid
decomposition (Rolia and Chakrabarti, 1982; Byerley et al., 1975). Reaction 4.7 is
thermodynamically possible, thus producing elemental sulfur on gold surface.
Table 4.7 Some possible reactions of thiosulfate in alkaline aqueous solutions.
Reaction E° / V ∆G°298K
/ kJ mol-1 Equation
No. S4O6
2- + 2OH- = S2O32- + SO4
2- + S0 + H2O -161.2 (4.7) 4S4O6
2- + 6OH- = 5S2O32- + 2S3O6
2- + 3H2O -189.4 (4.8) S4O6
2- + 2e- = 2S2O32- 0.08 (4.9)
2SO32- + 3H2O + 4e- = S2O3
2- + 6OH- -0.571 (4.10) S0 + 2e- = S2- -0.476 (4.11) S2O3
2- + 2OH- = SO42- + S2- + H2O -53.8 (4.12)
Note: ∆G°298K data were calculated by using standard free energy data from Pourbaix (1974) except that for S2O3
2- which was calculated from the redox potential E° (0.08 V) for the S4O6
2-/S2O32- couple (King, 1994).
The sulfur could also be formed by discharge of sulfide ions (Chen et al., 1996;
Hamilton and Woods, 1983) in the potential range of 0-0.4 V:
S2- + Au = Au | S0 + 2e- (4.13)
The sulfide ions may be produced from decomposition of thiosulfate on the surface of
gold according to Equation 4.12, particularly at higher temperatures (Pryor, 1960):

Chapter 4 Electrochemical Dissolution of Gold in Alkaline Thiosulfate Solutions 150
S2O32- + 2OH- = SO4
2- + S2- + H2O (4.12)
Figure 4.15 has shown that the passivation on gold occurs more rapidly at higher
temperatures. Hamilton and Woods (1983) have suggested that the sulfur layer on gold is
stable in alkaline solutions, though elemental sulfur is not under these conditions. Wierse
et al. (1978) reported that the adsorbed sulfur layer on gold was insulating and therefore
probably responsible for the inhibition of redox reactions on gold electrodes.
Coulometric studies have shown that the anodic oxidation of gold in thiosulfate
solutions is accompanied by the anodic oxidation of thiosulfate. The maximum possible
rate of these reactions would be controlled by mass transport of thiosulfate to the
electrode surface. This rate can be estimated using the Levich equation for a rotating disk
electrode (Rieger, 1994):
IL = 0.62 n F A C0* D0
2/3 ν -1/6 ω1/2 (4.14)
where IL is the limiting current in Ampere (A); n the number of electrons transferred; F
the Faraday constant, 96485 C mol-1; A the disk area, cm2; D0 the diffusion coefficient,
cm2 s-1; ν the kinematic viscosity, cm2 s –1 (ν = ηs / ds ; ηs is the coefficient of viscosity of
solvent, kg cm-1s-1 and ds the density of the solution, kg cm-3); ω the angular speed, s-1
(2π times the rotation frequency in hertz); C0* the molar concentration of bulk solution,
mol cm-3. By considering a one-electron process such as Equation 4.5 and assuming a
diffusion coefficient for thiosulfate of 1.16 × 10⁻⁵ cm2 s-1 (calculated from the molar
ionic conductivity of thiosufate in aqueous solutions at infinite dilution and 25 °C) and ηs
= 8.9 × 10⁻⁶ kg cm-1 s-1 for water (Rieger, 1994), the limiting current density on a rotating
(200 rpm) disk electrode in an aqueous solution of 1 M Na2S2O3 (calculated ds = 1.16 x
10-3 kg cm-3) can be estimated to be 0.31 A cm-2 or 3.2 × 10⁻⁶ F cm-2 s-1 which is very
much higher than the current densities actually observed. This supports the idea that the

Chapter 4 Electrochemical Dissolution of Gold in Alkaline Thiosulfate Solutions 151
rates of oxidation of thiosulfate and gold are limited by an electrochemical process on the
surface of gold.
The above mechanism for the anodic dissolution reaction of gold in thiosulfate
solutions (Equations 4.5 and 4.6) suggests that the rate of dissolution of gold will be
proportional to the concentration of thiosulfate i.e. first order in thiosulfate. This has
been confirmed by the experimental results in Figure 4.18. The activation energy for
anodic oxidation of gold in thiosulfate solutions has been estimated to be 65 kJ mol-1,
which is close to the value of 60 ± 10 kJ mol-1 estimated by Breuer and Jeffrey (2000) in
0.1 M Na2S2O3 solutions containing copper ions and ammonia and to that of 53.6 kJ mol-
1 for gold dissolution in 50 g l-1 Na2S2O3 solution at pH 8.3 obtained by Zhuchkov and
Bubeev (1990). However, it is much larger than the value of 28.0 kJ mol-1 reported by
Jiang et al. (1993b) which was calculated using the total current at a gold electrode in 1
M Na2S2O3 solution without copper ions and ammonia. The high activation energy
supports the conclusion that the dissolution of gold with thiosulfate is characteristic of
chemically controlled reaction, which is further supported by lack of any effect of the
rotation speed of the electrode on the rate (Figure 4.14).
Figure 4.17 has shown that higher concentrations of hydroxyl ions result in
higher rates of dissolution at a fixed potential. Such results are in consistent with those of
Jiang et al. (1993b) and Chen et al. (1996), but are contrary to those of Zhuchkov and
Bubeev (1990) who observed that the maximum dissolution current decreased with
increasing pH. According to the above proposed mechanism for the anodic processes on
gold, it is possible that the increase of the dissolution rate with pH may be attributed to
partial elimination of the sulfur film on gold surface in solutions with high concentration
of hydroxyl ions, particularly at high temperatures (Pryor, 1960):

Chapter 4 Electrochemical Dissolution of Gold in Alkaline Thiosulfate Solutions 152
4S0 + 4OH- = 2HS- + S2O32- + H2O (4.15)
The current-time transients shown in Figure 4.15 have suggested partial elimination of
the passivating film on the surface of gold.
4.3.2 Effect of Ammonia
With addition of ammonia to an oxygenated thiosulfate solution, the mixed
potential of gold becomes more positive than that in a solution containing only
thiosulfate as shown in Figure 4.3. It is therefore expected that the rate of dissolution
would increase in the presence of ammonia. As seen in Table 4.6 and Figure 4.7,
ammonia does increase the rate of gold dissolution in aqueous thiosulfate solutions,
which confirms the conclusion of Zhu et al. (1994a).
According to Jiang et al. (1993a), the effect of ammonia on the dissolution of
gold is due to the following reactions:
Au + 2NH3 = Au(NH3)2+ + e- (4.16)
Au(NH3)2+ + 2S2O3
2- = Au(S2O3)23- + 2NH3 (4.17)
in which gold is anodically oxidized to form the aurous di-ammine complex, namely,
Au(NH3)2+ which reacts with thiosulfate ions after entering the solution to form the
aurous di-thiosulfate complex, Au(S2O3)23-. It is possible that this mechanism was
suggested in the light of published data for the stability constants for the di-ammine and
di-thiosulfate gold complexes which appeared to be of a very similar magnitude of 1026
(Jiang et al., 1992; Aylmore and Muir, 2001). However, predicted stability constant
based on the linear free energy relationship between the stability constants for the
formation of a number of silver(I) and gold(I) complexes (Hancock et al., 1974) suggests
a much lower stability constant of 1013 for Au(NH3)2+ than that for Au(S2O3)2
3-. Very

Chapter 4 Electrochemical Dissolution of Gold in Alkaline Thiosulfate Solutions 153
recently, Senanayake et al. (2003) studied and reviewed the thermodynamics of aqueous
gold-ammonia-thiosulfate system at 25 °C. They have suggested that more reliable
stability constants for Au(NH3)2+ and Au(NH3)4
3+ could be 1013 and 1033 respectively,
and that the reason for large discrepancy between predicted stability constants and the
measured values (Guan and Han, 1995; Skibsted and Bjerrum, 1974a, b) is due to the
inherent problems associated with the possibility of the disproportionation of gold(I) to
metallic gold and gold(III) as described below:
3Au(NH3)2+ = Au(NH3)4
3+ + 2Au + 2NH3 Ke, 298K = 103.7 (4.18)
where Ke, 298K is the equilibrium constant at 25 °C calculated from the predicted stability
constants. Thus the Au(NH3)43+ ions must be the major species in aqueous ammonia and
a much higher concentration of ammonia is required to stabilize Au(NH3)2+. In addition,
with the much lower stability constant of 1013 for Au(NH3)2+, the standard reduction
potential for reaction 4.16 can be calculated to be 0.922 V which is much higher than
those reported by Guan and Han (1995) and Skibsted and Bjerrum (1974a, b). This high
potential suggests that the formation of Au(NH3)2+ is not favored at low potentials in
aqueous ammonia solutions.
If the formation of the gold(I) ammine complexes is important, a measurable rate
of dissolution of gold should be obtained in the potential region studied in solutions
containing only ammonia. This was not observed in present study, supporting the view
that Au(NH3)2+ is not formed under these experimental conditions. The cyclic
voltammogram of gold in ammonia solution at 25 °C shown in Figure 4.7 indicates that
there is an extremely low anodic current below 0.4 V. This is in agreement with Breuer
and Jeffrey (2002) and was confirmed by the potentiostatic measurements at 0.25 V that
resulted in no measurable dissolution of gold in that solution as shown in Table 4.6.
Furthermore, Meng and Han (1993) have reported the kinetics of the oxidative

Chapter 4 Electrochemical Dissolution of Gold in Alkaline Thiosulfate Solutions 154
dissolution of gold is very poor at room temperatures and significant gold dissolution in
ammoniacal solutions occurs only at temperatures greater than 120 °C. Guan and Han
(1996) have used galvanostatic tests to show that dissolution of gold in 1 M ammonia
solutions at pH 10 does occur at 135 °C.
Thus, it appears unlikely that the above mechanism is responsible for the role of
the ammonia but that the primary role of the ammonia in enhancing the dissolution of
gold is associated with its ability to reduce the partial passivation of the gold surface.
Figure 4.2 suggests that ammonia may reduce the adsorption of thiosulfate ion and
thereby the passivation of the dissolution reaction. This is supported by the fact that a
film on the surface of gold was not visually observed after anodic oxidation at 0.25 V in
ammoniacal 1 M Na2S2O3 at pH 10.6, whereas under the same conditions the gold
surface was covered by an obvious film in a 1 M Na2S2O3 solution containing NaOH.
The possible role of ammonia may be described by the following reaction (Peters, 1976):
12S0 + 6OH- = 2S52- + S2O3
2- + 3H2O (4.19)
4.4 Conclusions
The cyclic voltammetric and coulometric studies have shown that anodic
dissolution of gold can be measured in alkaline thiosulfate solutions at ambient
temperatures at potentials above about 0.2 V. Thiosulfate ions undergo oxidative
decomposition on the gold surface in the same potential region with the formation of a
sulfur-like surface film which acts to partially passivate the surface for the dissolution of
gold. The rate of the anodic dissolution of gold at constant potential has been found to be
electrochemically controlled with activation energy of 65 kJ mol-1, and the rate is

Chapter 4 Electrochemical Dissolution of Gold in Alkaline Thiosulfate Solutions 155
enhanced by increases in pH, concentration of thiosulfate and temperature of the
solutions.
Addition of ammonia to the thiosulfate solution results in increased dissolution of
gold at fixed potentials due possibly to the partial elimination of the passivating film.
Measurement of the mixed potential of a gold electrode in oxygenated thiosulfate
solutions has shown that open circuit dissolution of the gold will occur with a rate which
is significantly lower than that achieved by conventional cyanidation or the copper-
catalyzed dissolution in ammoniacal thiosulfate solutions.

Chapter 5 Effect of Cu on Dissolution of Au in Alkaline Thiosulfate Solutions 156
CHAPTER 5 EFFECT OF COPPER ON THE
DISSOLUTION OF GOLD IN ALKALINE
THIOSULFATE SOLUTIONS
5.1 Introduction
As reviewed in Chapter 2, thiosulfate appears to be the most promising
alternative to cyanide for gold leaching, although much research work on thiosulfate
leaching of gold over the last three decades has not resulted in its commercial
introduction (Aylmore and Muir, 2001). Perhaps the main reason for this is the poor
understanding of the thiosulfate leaching system which has been found to be very
complicated (Wan, 1997), thus in turn hindering the development and application of the
technology. In particular, the fundamental electrochemistry of the anodic oxidation of
gold and of the cathodic reduction of oxygen and the role of redox mediators such as the
copper(II)/copper(I) couple have not been satisfactorily explored.
The results presented in Chapter 4 have confirmed that dissolution of gold is very
slow in the absence of ammonia due to formation of a sulfur-like film as a result of
decomposition of thiosulfate on the surface of gold. It has been known that for leaching
to occur at a reasonable rate, thiosulfate, ammonia and copper(II) must be present in
solution (Wan, 1997; Abbruzzese et al., 1995; Zipperian et al., 1988). Copper(II) ions
have been found to have a strong catalytic effect on the dissolution rate of gold in the
presence of ammonia (Tyurin and Kakovskii, 1960; Ter-Arakelyan et al., 1984; Breuer

Chapter 5 Effect of Cu on Dissolution of Au in Alkaline Thiosulfate Solutions 157
and Jeffrey, 2002). The main role of copper(II) ions in the dissolution of gold is believed
to be the oxidation of metallic gold by the cupric tetra-ammine complex ions as
expressed in the following reaction:
Au + 5S2O32- + Cu(NH3)4
2+ = Au(S2O3)23- + 4NH3 + Cu(S2O3)3
5- (5.1)
On the other hand, cupric tetra-ammine ions can also be reduced to cuprous thiosulfate
complex ions by thiosulfate as shown in the reaction (Breuer and Jeffrey, 2003):
2Cu(NH3)42+ + 8S2O3
2- = 2Cu(S2O3)35- + 8NH3 + S4O6
2- (5.2)
Consequently, the concentration of copper(II) ions present in the leaching solution is an
important factor in determining both the stability of thiosulfate and the leaching of gold.
Oxygen is required to convert copper(I) to copper(II) for further gold leaching. The
oxidation of copper(I) by oxygen in ammoniacal thiosulfate solutions is known to occur
readily and represented by reaction 5.3 (Byerley et al., 1973; 1975):
2Cu(S2O3)35- + 8NH3 + ½O2 + H2O = 2Cu(NH3)4
2+ + 6S2O32- + 2OH- (5.3)
However, recent results (Van Wensveen and Nicol, 2003) have shown that the copper(I)
thiosulfate complexes are only oxidized at very slow rates relative to those of the
copper(I) ammine complexes.
A freshly prepared solution of sodium thiosulfate containing copper(I) ions is
known to be able to dissolve silver metal and silver sulfide from sulfidic ores even in the
absence of ammonia. The dissolution rate of silver metal in a solution of sodium cuprous
thiosulfate is nine times higher than that in a solution containing sodium thiosulfate alone
(Mellor, 1929). The enhanced solvent power of sodium cuprous thiosulfate for silver
metal compared with that of sodium thiosulfate has been attributed to the redox
mediating effect of the copper ions. On the other hand, gold apparently does not dissolve
in the sodium cuprous thiosulfate solution any more rapidly than in a solution of sodium
thiosulfate alone (Mellor, 1929). Although the role of copper ions in the copper-

Chapter 5 Effect of Cu on Dissolution of Au in Alkaline Thiosulfate Solutions 158
ammonia-thiosulfate leaching system for gold is generally accepted, the behaviour of
gold in thiosulfate solutions containing copper without ammonia is less clear despite
some published work on the leaching of gold in thiosulfate solutions (Breuer and Jeffrey,
2000 and 2002; Breuer et al., 2002).
As will be reported in Chapters 7 and 8, thiosulfate was detected as one of the
major oxidation products of sulfide minerals in strongly alkaline solutions. In addition,
up to 1 mM copper was also detected in the leaching solutions. It was suspected that
these species could be responsible for the observation that gold was found to dissolve
simultaneously with oxidation of these minerals in the absence of cyanide and ammonia.
An electrochemical study of the dissolution of gold in alkaline thiosulfate solutions
without copper has been reported in Chapter 4. This Chapter will report on an
investigation of the dissolution of gold in copper bearing thiosulfate solutions in the
absence of ammonia.
Detailed experimental can be found in Chapter 3. Unless otherwise stated, all
experiments were carried out in solutions containing 0.2 M thiosulfate at 25 °C using a
gold disk rotated at 400 rpm. The potential scan rate in the electrochemical experiments
was 5 mV s-1.
5.2 Chemistry of Copper in Thiosulfate Solutions
As reviewed in Chapter 2, copper ions in aqueous solutions containing excess of
thiosulfate exist in the form of stable (thiosulfato)copper(I) complexes. In a small excess
of thiosulfate, cuprous sulfide may be formed as a result of the decomposition of
thiosulfate. An Eh-pH diagram for the copper-thiosulfate-water system at 25 °C shown in

Chapter 5 Effect of Cu on Dissolution of Au in Alkaline Thiosulfate Solutions 159
Figure 5.1 summarizes the stability regions of the various copper species under different
conditions. It can be seen that metallic copper is not stable in aqueous thiosulfate
solutions. Various copper oxides, sulfides and other species may exist depending on the
solution potential and pH. Cuprous thiosulfate is the predominant species in solution at
the potentials normally encountered in the leaching of gold.
Eh
(V)
14121086420
1.0
0.8
0.6
0.4
0.2
0.0
-0.2
-0.4
-0.6
-0.8
-1.0
pH
Cu
CuS
Cu2S
CuO
Cu(S2O3)22- Cu3(OH)4
2+
Cu(
OH
) 42-
HCuO2-
Cu(S2O3)35-
Cu2+
Cu+
Cu(OH)42-
Figure 5.1 An Eh-pH diagram for Cu-S2O3
2--H2O system at 25 °C (conditions: 0.2 M S2O3
2-, 0.5 mM Cu2+). The dotted line marks the stability region of water, the dashed line is the predominance area for soluble ions and the solid lines define the most stable species in the system. The thermodynamic data used can be found in Appendix A.1.
It has been long known that copper(II) can catalyze the oxidation of thiosufate by
a variety of oxidizing agents, including oxygen in aqueous solutions while the oxidation
of thiosulfate by oxygen under ambient conditions in the absence of copper ions is

Chapter 5 Effect of Cu on Dissolution of Au in Alkaline Thiosulfate Solutions 160
known to be extremely slow (Rabai and Epstein, 1992; Rolia and Chakrabarti, 1982).
The catalytic activity of copper is usually explained by assuming that the copper(II) ion
undergoes a facile, rapid reduction by the thiosulfate ion to copper(I), followed by a fast
oxidation of copper(I) to copper(II) as described in reactions 5.4 and 5.5:
2Cu2+ + 2S2O32- = 2Cu+ + S4O6
2- (5.4)
2Cu+ + Ox = 2Cu2+ + Ox 2- (5.5)
Reaction 5.4 is thermodynamically favored. From the redox potentials of 0.08 and
0.153V for S4O62-/S2O3
2- and Cu2+/Cu+ respectively (King, 1994), its standard reaction
free energy ∆G° is evaluated to be -14.1 kJ mol-1 at 25 °C. The formation of stable
copper(I) thiosulfate complexes further decreases the free energy change for reaction 5.4.
Reaction 5.5 in which the thiosulfate complexes are involved has been found to be very
slow (Van Wensveen and Nicol, 2003).
5.3 Results
5.3.1 Mixed Potential Measurements
Figure 5.2 shows the mixed potential of a rotating gold disk electrode in aerated
0.2 M Na2S2O3 solutions containing different copper sulfate concentrations at pH 7 and
12 at room temperature. In the solutions of pH 7, the potential of the gold electrode
reaches a maximum before decreasing to a steady value of about 0.1 V at longer times.
Initially, the potential increases with an increase in the concentration of copper. In the
solutions of pH 12, the initial potential of the gold similarly increases with copper
concentration but this is not true after longer times. It also appears that the final potential
is lower at the higher pH value. At pH 7, the final potentials are very similar suggesting

Chapter 5 Effect of Cu on Dissolution of Au in Alkaline Thiosulfate Solutions 161
that there should be little effect of copper on the rate of dissolution at this pH value. At
pH 12, the trend with copper concentration is not clear. These results suggest that copper
could initially increase the dissolution rate of gold in thiosulfate solutions and that a
higher pH may have a negative effect on the rate of dissolution.
0
0.02
0.04
0.06
0.08
0.1
0.12
0.14
0.16
0.18
0 5 10 15 20 25 30 35
Time (min)
Pote
ntia
l (V
)
pH 7, 4 mM Cu pH 7, 2 mM Cu pH 7, no Cu
pH 12, 0.5 mM pH 12, no Cu
pH 12, 5 mM
Figure 5.2 Variation of the potential of a rotating gold electrode in aerated 0.2 M thiosulfate solutions at different pH values and copper concentrations.
In other experiments, the effect of copper on the mixed potential of a gold
electrode can be clearly seen in aerated 0.2 M Na2S2O3 solutions at pH 7 as shown in
Figure 5.3. In these experiments, a given amount of cupric sulfate or cuprous thiosulfate
solution was added to the solution at the times indicated to produce a concentration of 2
mM copper. The mixed potential of gold increases immediately to a higher value and
then gradually decreases to the normal level. By comparison, the mixed potentials of a

Chapter 5 Effect of Cu on Dissolution of Au in Alkaline Thiosulfate Solutions 162
platinum electrode under same conditions do not change measurably on addition of
copper ions. It is also obvious that platinum has a higher potential than gold in thiosulfate
solutions, suggesting that platinum is more inert than gold in aerated thiosulfate
solutions. It is possible that the increase in the potential of gold is associated with the
formation of an intermediate copper(II) complex which can act to oxidize the gold. It is
well known that the oxidation of thiosulfate by copper(II) ions involves the intermediate
formation of a copper(II) thiosulfate complex, Cu(S2O3)22- (Rabai and Epstein, 1992; see
Figure 5.1).
0
0.05
0.1
0.15
0.2
0.25
0.3
0.35
0.4
0.45
0 5 10 15 20 25 30
Time (min)
Pote
ntia
l (V
)
Pt
Au
Cu+ addition
Cu2+ addition
Cu2+ addition
Figure 5.3 Effect of the addition of copper ions (2 mM Cu) on the mixed potentials of rotating gold and platinum electrodes in aerated 0.2 M thiosulfate solutions at pH 7.

Chapter 5 Effect of Cu on Dissolution of Au in Alkaline Thiosulfate Solutions 163
5.3.2 Anodic Polarization
Anodic polarization experiments were carried out to investigate the anodic
behaviour of gold and platinum in thiosulfate solutions with and without copper ions.
The results are shown in Figures 5.4 - 5.7. It is apparent that the anodic current becomes
larger in the presence of copper than in its absence on both gold and platinum electrodes.
The increase in anodic current is more obvious on the gold electrode, which suggests that
copper ions could assist in the dissolution of gold in the thiosulfate solutions. Clearly,
with 5 mM copper the anodic current appears to increase with the potential with a peak at
a potential of about 0.28 V. This result indicates that the surface may become partially
passivated during oxidation.
-20
-10
0
10
20
30
40
50
60
70
80
0 0.1 0.2 0.3 0.4 0.5 0.6
Potential (V)
Cur
rent
den
sity
(µA
cm
-2)
5 mM Cu
0.5 mM Cu
no Cu
Figure 5.4 Anodic polarization of a rotating platinum electrode in deoxygenated 0.2 M thiosulfate solutions containing 0 mM (·······), 0.5 mM (——) and 5 mM (-----) Cu ions at pH 7.

Chapter 5 Effect of Cu on Dissolution of Au in Alkaline Thiosulfate Solutions 164
-5
0
5
10
15
20
25
30
35
40
45
0 0.1 0.2 0.3 0.4 0.5 0.6
Potential (V)
Cur
rent
den
sity
(µA
cm
-2)
5 mM Cu
0.5 mM Cu
no Cu
Figure 5.5 Anodic polarization of a rotating gold electrode in deoxygenated 0.2 M thiosulfate solutions containing 0 mM (·······), 0.5 mM (——) and 5 mM (-----) Cu ions at pH 7.
-5
0
5
10
15
20
25
30
35
40
45
0 0.1 0.2 0.3 0.4 0.5 0.6
Potential (V)
Cur
rent
den
sity
(µA
cm
-2)
Pt with 5 mM CuPt with 0.5 mM CuPt with no Cu
Figure 5.6 Anodic polarization of a rotating platinum electrode in deoxygenated 0.2 M thiosulfate solutions containing 0 mM (·······), 0.5 mM (-----) and 5 mM (——) Cu ions at pH 12.

Chapter 5 Effect of Cu on Dissolution of Au in Alkaline Thiosulfate Solutions 165
-5
0
5
10
15
20
25
30
35
40
45
0 0.1 0.2 0.3 0.4 0.5 0.6
Potential (V)
Cur
rent
den
sity
(µA
cm
-2) Au with 0.5 mM Cu
Au with 5 mM Cu
Au with no Cu
Figure 5.7 Anodic polarization of a rotating gold electrode in deoxygenated 0.2 M thiosulfate solutions containing 0 mM (·······), 0.5 mM (-----) and 5 mM (——) Cu ions at pH 12.
-5
0
5
10
15
20
25
30
35
40
45
0 0.1 0.2 0.3 0.4 0.5 0.6
Potential (V)
Cur
rent
den
sity
(µA
cm
-2)
pH 12
pH 10.9
pH 7
Figure 5.8 Anodic polarization curves of a rotating gold electrode in deoxygenated 0.2 M thiosulfate solutions containing 0.5 mM Cu ions at various pH values.

Chapter 5 Effect of Cu on Dissolution of Au in Alkaline Thiosulfate Solutions 166
The effect of pH on the anodic oxidation of gold electrode in 0.2 M thiosulfate
solutions with 0.5 mM copper is summarized in Figure 5.8. It is apparent that pH has a
significant influence only at potentials above about 0.3 V, which could be due to the
more favourable formation of copper(II) species at higher potentials and pH values
(Figure 5.1). The effect of copper ions on the anodic behaviour in the region of the mixed
potential in aerated solutions is, however, significant at both pH values.
5.3.3 Coulometric Measurements
It has been shown that gold dissolves during anodic oxidation in alkaline
thiosulfate solutions in the absence of copper and ammonia (Chapter 4). The anodic
current of the gold electrode in thiosulfate solutions containing copper shown above
could be associated with either the oxidative dissolution of gold, the oxidation of
copper(I) to copper(II) and/or the oxidation of thiosulfate. Coulometric measurements
were therefore carried out in deoxygenated 0.2 M thiosulfate solutions containing copper
ions at pH 12 by applying a constant potential of 0.3 V to the gold electrode and
recording the anodic current as a function of time. After potentiostatic oxidation, the
thiosulfate solutions were analyzed for Au by AAS. The average dissolution rates of gold
and current efficiencies (assuming a one-electron process) were calculated and are shown
in Table 5.1.
Table 5.1 Average rates of anodic dissolution of gold in 0.2 M thiosulfate solutions with different copper at 0.3 V, pH 12 and 20 °C
Copper / mM Average Charge
/ F cm-2 s-1 Au Dissolution / mol cm-2 s-1
Coulombic Efficiency
0 5.17 × 10⁻¹² 2.07 × 10⁻¹² 0.40 0.5 6.46 × 10⁻¹² 2.11 × 10⁻¹² 0.33 5 2.50 × 10⁻¹¹ 6.50 × 10⁻¹² 0.26

Chapter 5 Effect of Cu on Dissolution of Au in Alkaline Thiosulfate Solutions 167
As seen in Table 5.1, gold dissolves and its dissolution rate increases slightly
with increasing concentration of copper at 0.3 V. However, the coulombic efficiency
decreases with increasing copper concentration. This fact suggests that the presence of
copper in thiosulfate solutions enhances not only the dissolution of gold but also the
oxidation of thiosulfate. The potentiostatic current-time transients shown in Figure 5.9
reveal that the anodic currents are high initially and then decrease gradually to very low
levels, suggesting that, as in the absence of copper ions, passivation of both the oxidation
of gold and of thiosulfate occurs in this potential region.
0
5
10
15
20
25
30
35
40
0 5 10 15 20 25
Time (hr)
Ano
dic
curr
ent (
µA c
m-2
) 5 mM Cu
0.5 mM Cu
0 mM Cu
Figure 5.9 Current-time transients at the gold electrode in 0.2 M thiosulfate solutions with and without copper at 0.3 V, pH 12 and 20 °C.

Chapter 5 Effect of Cu on Dissolution of Au in Alkaline Thiosulfate Solutions 168
5.3.4 Gold Dissolution in Thiosulfate Solutions Containing Copper
To further investigate the effect of copper on the dissolution of gold, leaching
experiments were performed in oxygenated thiosulfate solutions in the presence or
absence of copper. The effect of milling of the gold particles on the rate of dissolution
was also investigated. Figure 5.10 shows the dissolution rate of unmilled and milled fine
gold powder in 0.2 M Na2S2O3 solutions at pH 12 with or without copper. Obviously,
copper (in the form of either ions, metal or oxide) enhances the rate of gold dissolution.
The effect appears to be greatest with dissolved copper although higher concentrations of
copper ions appears to be disadvantageous, which is possibly due to the instability of
copper in alkaline solutions. It is noteworthy that the rate of gold dissolution decreases
after a relatively rapid reaction in the early stages, which is consistent with the results in
Figure 5.9. Apparently, milling of gold powder assists with the dissolution of gold
especially in the presence of copper. The appreciable effect of milling on the dissolution
of gold is probably associated with the increased surface area of gold. The potential of a
gold electrode in the leach solutions was found to be about 0.11 V which is similar to the
mixed potential of gold reported in Figure 5.2.
5.4 Discussion
5.4.1 Electrochemical Oxidation
Electrochemical experiments have shown that even without ammonia, copper in
thiosulfate solutions has a positive effect on the anodic behaviour of gold. The presence
of copper in thiosulfate solutions enhances not only the dissolution of gold but also the
oxidation of thiosulfate at constant potentials, which is similar to that observed in the

Chapter 5 Effect of Cu on Dissolution of Au in Alkaline Thiosulfate Solutions 169
presence of ammonia (Breuer and Jeffrey, 2002). In the presence of ammonia, the role of
copper is relatively well understood in terms of the chemistry of the copper ammine
complexes. However, in the absence of ammonia, the role of copper is not obvious.
0123456789
10
0 10 20 30 40 50 60 70 8
Time (hr)
Perc
enta
ge d
isso
lved
Au
0
Figure 5.10 Dissolution of gold powder in oxygenated 0.2 M thiosulfate solutions at pH 12 with (solid line) and without (dashed line) copper at 25 °C. Fine gold powder (0.1 g) was wet-milled (diamonds) in a porcelain mill or added without milling (circles). The copper was used as (♦, •) 0.5 mM CuSO4, (♦) 2 mM CuSO4, (♦) 20% CuO (by mass, milled with gold) and (♦) 20% Cu powder (by mass, milled with gold) respectively.
A stability constant (3.6 x 10⁴ M-2) for the unstable bis(thiosulfato)copper(II),
Cu(S2O3)22-, has been determined by Rabai and Epstein (1992). Using this stability
constant and relevant thermodynamic data in Appendix A.1, the standard free energy of
formation of Cu(S2O3)22- can be calculated to be -998.7 kJ mol-1. By using this value and
assuming that the thiosulfatocopper(I) complexes are oxidized to Cu(S2O3)22-, standard
reduction potentials can be calculated as shown for the following half reactions.

Chapter 5 Effect of Cu on Dissolution of Au in Alkaline Thiosulfate Solutions 170
Cu(S2O3)22- + e- = Cu(S2O3)
- + S2O32- E° = 0.499 V (5.6)
Cu(S2O3)22- + e- = Cu(S2O3)2
3- E° = 0.611 V (5.7)
Cu(S2O3)22- + S2O3
2- + e- = Cu(S2O3)35- E° = 0.694 V (5.8)
Thus in the present electrochemical studies with copper ions in 0.2 M thiosulfate
solutions at pH 12, the concentration of the copper(II) complex, Cu(S2O3)22- at an applied
potential of 0.3 V can be calculated to be very low. Although this copper(II) species is
not shown at pH about 12 in the Eh-pH diagram of Figure 5.1, it is nevertheless possible
that it could be formed and therefore account for the oxidation of thiosulfate.
The role of copper in the oxidation of thiosulfate may also be due to the
participation of other forms of copper(II) formed from the oxidation of copper(I) ions.
From Figure 5.1, it can be seen that at pH about 12 and potential of 0.3 V, the most
stable aqueous species of copper(II) is HCuO2- which may oxidize thiosulfate to
tetrathionate given that the standard reduction potential for the S4O62-/S2O3
2- couple is
0.08 V. The reaction between HCuO2- and thiosulfate could be described as:
2HCuO2- + 2H2O + 8S2O3
2- = 2Cu(S2O3)35- + 6OH- + S4O6
2- (5.9)
The effect of copper on the dissolution of gold may also be explained in terms of
the above copper(II) species. Given that the standard reduction potential for the
Au(S2O3)23-/Au couple is 0.153 V (refer to Chapters 2 and 4; Bard, 1975), both
Cu(S2O3)22- and HCuO2
- may oxidize gold at a pH value of 12. Thus, possible reactions
between gold and these two copper(II) species could be given by
Cu(S2O3)22- + Au + 3S2O3
2- = Au(S2O3)23- + Cu(S2O3)3
5- (5.10)
HCuO2- + Au + H2O + 5S2O3
2- = Au(S2O3)23- + Cu(S2O3)3
5- + 3OH- (5.11)

Chapter 5 Effect of Cu on Dissolution of Au in Alkaline Thiosulfate Solutions 171
The higher currents and lower current efficiency for gold dissolution shown in Table 5.1
in copper-containing thiosulfate solutions are possibly associated with the oxidation of
copper(I) to copper(II) followed by rapid reactions of the copper(II) species with
thiosulfate, i.e. catalysis of the thiosulfate oxidation by copper.
On the other hand, the role of copper is possibly also associated with the partial
elimination or reduction of the sulfur-like passivating film on the surface of gold. As
suggested in Chapter 4, gold in thiosulfate solutions could be covered by a sulfur-like
film resulted from the decomposition of thiosulfate and oxidation of sulfide ions.
Cuprous ions in thiosulfate solutions could react with the S2- ion to form cuprous sulfide,
Cu2S as shown in the reaction:
2Cu(S2O3)35- + S2- = Cu2S + 6S2O3
2- (5.12)
The standard free energy ∆G° at 25 °C for this reaction was calculated to be -122.0 kJ
mol-1, suggesting that it is thermodynamically favorable. Thus, copper may partially
prevent the oxidative adsorption of sulfur and in turn enhance the dissolution of gold.
5.4.2 Dissolution of Gold with Oxygen
Leaching experiments have confirmed the catalytic effect of copper on the
dissolution of gold in thiosulfate solutions without ammonia. The Eh-pH diagram in
Figure 5.1 suggests that at the mixed potential (< 0.12 V) in oxygenated thiosulfate
solutions, copper exists in the form of the copper(I) thiosulfate complexes. Thus the
possible explanation for the dissolution of gold in the coulometric studies at 0.3 V may
not apply to the dissolution of gold with oxygen.

Chapter 5 Effect of Cu on Dissolution of Au in Alkaline Thiosulfate Solutions 172
The role of copper in the dissolution of gold in oxygenated thiosulfate solutions
could be due to formation of a copper-thiosulfate-oxygen intermediate which has a
higher reduction potential. Figure 5.2 shows that gold attains a higher potential when
initially contacting an aerated thiosulfate solution in the presence of copper. Figure 5.3
shows that after copper ions (either cuprous or cupric) are added into aerated thiosulfate
solutions, the potential of gold electrode immediately increases to a higher value before
gradually decreasing to a lower value of about 0.1 V. The increase in the potential of
gold electrode probably implies the formation of an intermediate which has a higher
reduction potential. The intermediate could be formed from a cuprous thiosulfate
complex and oxygen:
Cu(S2O3)35- + O2 = [(S2O3)3Cu·O2]5- (5.13)
in which oxygen molecule is bound to copper(I) which has an apparent coordination
number of 4. In this way cuprous thiosulfate acts as a carrier of oxygen to expedite redox
reactions as in the case of dissolution of silver metal in cuprous thiosulfate solutions
(Mellor, 1929). Similar intermediates have been suggested in the reactions between
oxygen and other cuprous complex ions in copper-catalyzed autoxidation reactions in
aqueous solutions (Hopf et al., 1983; Pecht and Anbar, 1968; Nord, 1955; Zuberbuhler,
1967). However, these intermediates have not been identified chemically or
spectrophotometrically in their free or complexed forms during copper(I) autoxidation
(Zuberbuhler, 1983). This is not unexpected given the high reactivity of these
intermediates (Zuberbuhler, 1983). In the current study, the increase in the potential of
the gold electrode could be an indicator of the presence of this intermediate which
probably acts as an oxidant for the dissolution of gold and oxidation of thiosulfate. The
possible overall reactions between this intermediate and gold or thiosulfate could be
given by the reactions:

Chapter 5 Effect of Cu on Dissolution of Au in Alkaline Thiosulfate Solutions 173
[(S2O3)3Cu·O2]5- + 4Au + 8S2O32- + 2H2O = 4Au(S2O3)2
3- + Cu(S2O3)35- + 4OH-
(5.14)
[(S2O3)3Cu·O2]5- + 4S2O32- + 2H2O = 2S4O6
2- + Cu(S2O3)35- + 4OH- (5.15)
The initial rate of dissolution per unit area of gold in oxygenated thiosulfate
solutions can be estimated as follows, assuming that all the gold particles are spherical
and have the same size (3 µm).
Initial rate = - (1/S) (dNAu/dt) (5.16)
where S is the total surface area of all gold particles; dNAu/dt is the dissolution rate of
gold in moles per unit time. The value of S can be calculated from
S = np Sp = Sp WAu / (ρ Vp) (5.17)
where np, Sp, Vp are the number of gold particles, the surface area and volume of one
gold particle respectively; WAu is the mass of the gold powder used; ρ is the specific
gravity of gold (ρ = 19.32 g cm-3). For spherical particles with a diameter of d, Equation
5.17 can be rewritten as
S = π d2 WAu / (ρ π d3/6) = 6WAu / (ρ d) (5.18)
Thus, the initial dissolution rate can be described as
Initial rate = - (dNAu/dt) (ρ d) / (6WAu) (5.19)
The dissolution fraction of gold at time t, X = 1- N/N0 and WAu = N0 MAu where N is the
number of moles of gold at time t and N0 the initial number of moles of gold. Thus
Initial rate = (dXAu/dt) (ρ d) / (6 MAu) (5.20)
where MAu is the molar weight of gold (196.97 g mol-1). Based on the above and the data
in Figure 5.10, the initial dissolution rate of wet-milled gold powder in oxygenated
alkaline 0.2 M thiosulfate solution in the presence of 0.5 mM copper was calculated to be
3.5 × 10⁻¹¹ mol cm-2 s-1. Similarly, the rate of wet-milled gold powder in oxygenated 0.2

Chapter 5 Effect of Cu on Dissolution of Au in Alkaline Thiosulfate Solutions 174
M thiosulfate solution without copper was estimated to be about 1.5 × 10⁻¹³ mol cm-2 s-1,
while the rate of unmilled gold powder in oxygenated 0.2 M thiosulfate solution without
copper was only about 6 × 10-15 mol cm-2 s-1. These values indicate that a small amount
of copper can significantly accelerate the initial rate of dissolution of gold. However, this
rate in the presence of copper is still low compared with that obtained by Jeffrey (2001)
of about 4 × 10⁻⁹ mol cm-2 s-1 in ammoniacal thiosulfate solutions containing copper ions.
The appreciable effect of milling on the dissolution of gold is probably associated with
the increased surface area of gold.
Figure 5.10 shows that gold initially dissolves relatively rapidly in copper bearing
thiosulfate solutions but that the rate gradually decreases with time, which is consistent
with results in Figure 5.9. As suggested in Chapter 4, it is possible that a sulfur-like film
could be formed on the oxidized gold surface in thiosulfate solutions, which inhibits
further dissolution of gold. Some yellow brownish spots were observed under the
microscope on a gold disk after it had been reacted with oxygenated copper bearing
thiosulfate solutions at room and elevated temperatures, supporting passivation of the
surface of gold.
5.4.3 Possible Complex of Gold with Copper in Thiosulfate Solutions
It has been shown that copper accelerates the dissolution of gold in thiosulfate
solutions in the presence of oxygen. A possible reason has been suggested above for this
observation. However, some consideration should be given to the possibility of the
formation of a mixed gold-copper-thiosulfate complex of the type (Au,Cu)(S2O3)23-.
Webster (1986) suggested that gold might substitute into the silver-thiosulfate complex
to form a thiosulfate complex of the type (Au,Ag)(S2O3)23- in his study on the solubility

Chapter 5 Effect of Cu on Dissolution of Au in Alkaline Thiosulfate Solutions 175
of gold and silver in thiosulfate solutions. In the current study, similar evidence for a
combined gold-copper-thiosulfate complex has been obtained in experiments aimed at
the precipitation of copper from solutions used in the leaching of gold by sulfide ions.
When sulfide (S2-) ions were added into solutions containing gold-thiosulfate and
copper-thiosulfate and mixed for 15 minutes, almost all the gold and copper precipitated,
but no precipitation of gold occurred from the solutions containing only gold (Table 5.2).
The co-precipitation of gold with copper is unlikely to be a consequence of adsorption
onto the cuprous sulfide (Cu2S) precipitate because after mixing with either cupric
sulfide (CuS) reagent, djurleite(Cu1.98S) mineral or freshly prepared Cu2S (obtained from
mixing of cuprous thiosulfate with sulfide ions), the concentration of gold in thiosulfate
solutions containing both gold and copper remained constant while that of copper
increased (Table 5.2). In the absence of copper, gold-thiosulfate appears to be stable in
the presence of sulfide ions. From these results it is tentatively concluded that gold is
precipitated by the decomposition of the combined gold-copper-thiosulfate complex in
the presence of sulfide ions. However, more evidence for a possible gold-copper-
thiosulfate complex needs to be obtained to confirm this postulate.
Table 5.2 Atomic absorption assay of gold- and copper-thiosulfate bearing solutions, before and after reaction with selected reagents
Initial Concentration / mg l-1 Final Concentration / mg l-1 Reagents
Au Cu Au Cu Na2S 21 25 0 0.2 Na2S 28 0.2 28 0.2 CuS 21 25 19 878
Djurleite(Cu1.98 S) 21 25 19 117 Fresh Cu2S 5.8 21 4.8 340

Chapter 5 Effect of Cu on Dissolution of Au in Alkaline Thiosulfate Solutions 176
5.5 Conclusions
Both electrochemical and dissolution experiments have shown that copper ions
enhance the rate of gold dissolution in the absence of ammonia at ambient temperatures.
Electrochemical studies have shown that copper has a positive effect on the anodic
dissolution of gold with increasing concentrations of copper resulting in higher
dissolution rates of gold at a potential of 0.3 V. The pH of thiosulfate solutions
containing copper appears to affect the anodic currents only at potentials above about
0.3V. Studies on the dissolution of gold powder in alkaline oxygenated thiosulfate
solutions containing low concentrations of copper have shown that the role of copper in
enhancement of the dissolution rate of gold is probably associated with the formation of
a copper-thiosulfate-oxygen intermediate which has a higher reduction potential, but the
mechanism for this remains unclear. On the other hand, the possibility of the formation
of mixed copper-gold-thiosulfate complexes could not be ruled out and this possibility
needs to be further investigated using other techniques. As expected, milling of gold
powder assists with the dissolution of gold in thiosulfate solutions, especially in the
presence of copper.

Chapter 6 The Dissolution of Gold in Thioarsenate / Thioarsenite Solutions 177
CHAPTER 6 THE DISSOLUTION OF GOLD IN
THIOARSENATE/THIOARSENITE
SOLUTIONS
6.1 Introduction
Analyses of the solutions from the alkaline oxidation of pure arsenopyrite (in
Chapter 7) will show that thioarsenates are present. Thioarsenites are also possible
components of the solution (Nagy et al., 1966; Rossovsky, 1993) although these ions
were not detected in this study. As reported in Section 2.3, several possible gold
thioarsenite complexes have been suggested as being formed during the dissolution of
gold in arsenic sulfide solutions at 200-300 °C. It is, therefore, reasonable to investigate
the possibility of reaction of gold with these ions in alkaline solutions at ambient
temperatures and pressures in order to explain the dissolution of gold during the alkaline
oxidation of arsenopyrite by oxygen (see Chapter 7).
In this study, the behaviour of gold in monothioarsenate (AsO3S3-) solutions and
in solutions containing some thioarsenites is reported. The experiments were carried out
at 25 °C in alkaline solutions of pH 12 with a gold disk electrode at a rotation speed of
1000 rpm unless otherwise stated. In voltammetric experiments, a potential sweep rate of
10 mV s-1 was used.

Chapter 6 The Dissolution of Gold in Thioarsenate / Thioarsenite Solutions 178
6.2 Dissolution in Alkaline Monothioarsenate Solutions
As outlined in Chapter 2, the chemistry of thioarsenates is poorly understood and
there do not appear to be any reports in the literature on the possible formation of gold
thioarsenate complexes or the reaction between gold and thioarsenate ions in aqueous
solutions. However, the monothioarsenate (AsO3S3- or S-AsO33-) ion resembles the
thiosulfate (S2O32- or S-SO3
2-) ion in structure, which suggests that the monothioarsenate
ion could react with gold in alkaline solutions. In the following sections, some aspects of
the behaviour of gold in alkaline solutions of monothioarsenate are described.
6.2.1 The Electrochemical Behaviour of Gold
6.2.1.1 Mixed potential measurements
Mixed potentials for gold were measured by recording the potential of a rotating
gold disk electrode in alkaline thioarsenate solutions to establish the relevant potential
region for the oxidative dissolution of gold. Figure 6.1 shows the potentials of gold in
oxygenated 0.1 M and 0.5 M Na3AsO3S solutions respectively. It appears that the mixed
potential of gold is located between –0.05 V and 0.16 V, which is within the potential
range for anodic oxidation observed in the cyclic voltammogram shown in Figure 6.2. It
is also apparent that the potential is lower in the solution containing the higher
concentration of thioarsenate.

Chapter 6 The Dissolution of Gold in Thioarsenate / Thioarsenite Solutions 179
6.2.1.2 Cyclic voltammetry
Figure 6.2 shows the cyclic voltammogram of a stationary gold electrode in
deoxygenated 0.1 M Na3AsO3S solution. It can be seen that an anodic process occurs in a
potential region from about -0.1 V to 0.66 V. A partial passivation occurs at a potential
of about 0.4 V and the anodic current increases again when the potential increases to
about 0.6 V. Figure 6.3 compares the cyclic voltammograms of gold and platinum under
the same conditions. It is apparent that the anodic current on gold is slightly higher than
on the platinum at potentials below about 0.4 V. There is no indication of passivation in
the case of platinum. The passivation of the gold electrode in 0.1 M Na3AsO3S solution
can be seen more clearly in Figure 6.4. When the gold electrode is subjected to
successive potential sweeps between –0.15 to 0.5 V, the current decreases with each
successive sweep.
-0.04
0.01
0.06
0.11
0.16
0.21
0 0.5 1 1.5 2 2.5 3 3
Time (hr)
Pote
ntia
l (V
)
Au / 0.1M Na3AsO3S
Au / 0.5M Na3AsO3S
.5
Figure 6.1 Mixed potentials for a rotating (400 rpm) gold electrode in oxygenated alkaline AsO3S3- solutions. (- - - -) 0.1 M Na3AsO3S solution, pH 12; (——) 0.5 M Na3AsO3S solution, pH 13.

Chapter 6 The Dissolution of Gold in Thioarsenate / Thioarsenite Solutions 180
-50
0
50
100
150
200
250
300
-0.6 -0.4 -0.2 0 0.2 0.4 0.6 0.8
Potential (V)
Cur
rent
den
sity
(µA
cm
-2)
Figure 6.2 Cyclic voltammogram of a stationary gold electrode in deoxygenated 0.1 M Na3AsO3S solution at pH 12. Sweep initiated in negative direction from -0.1 V.
-100
102030405060708090
-0.2 0 0.2 0.4 0.6
Potential (V)
Cur
rent
den
sity
(µA
cm
-2)
Au
Pt
Figure 6.3 Cyclic voltammograms of rotating gold and platinum electrodes in deoxygenated 0.1 M Na3AsO3S solutions at pH 12. Sweeps were initiated in a positive direction from -0.15 V.

Chapter 6 The Dissolution of Gold in Thioarsenate / Thioarsenite Solutions 181
-10
0
10
20
30
40
50
60
-0.2 -0.1 0 0.1 0.2 0.3 0.4 0.5 0.6
Potential (V)
Cur
rent
den
sity
(µA
cm
-2) 1
2
3
Au
Figure 6.4 Successive voltammograms of a rotating gold electrode in deoxygenated 0.1 M Na3AsO3S solutions at pH 12.
-100
102030405060708090
-0.2 0 0.2 0.4 0.6
Potential (V)
Cur
rent
den
sity
(µA
cm
-2)
no rotation
1000 rpm
Figure 6.5 Cyclic voltammograms of gold with and without rotation in deoxygenated 0.1 M Na3AsO3S solutions at pH 12.

Chapter 6 The Dissolution of Gold in Thioarsenate / Thioarsenite Solutions 182
The effect of rotation of the electrode is shown in Figure 6.5 from which it is
apparent that the anodic current is higher at potentials above about 0.2 V at a stationary
electrode, suggesting that the anodic process could involve the formation of a soluble
species which undergoes further oxidation. By comparison with Figure 4.5 (see Section
4.2.2.1), it can be seen that the anodic current density is higher in monothioarsenate than
in thiosulfate solutions.
0
20
40
60
80
100
120
140
0 2 4 6 8 10 12
Time (hr)
Ano
dic
curr
ent (
µA c
m-2
)
14
Figure 6.6 Variation with time of the anodic current on a rotating (200 rpm) gold electrode at 0.25 V in a deoxygenated 0.5 M Na3AsO3S solution at pH 13.
6.2.1.3 Coulometric measurements
In order to establish the relative rates of oxidation of gold and of the
monothioarsenate ion, a coulometric experiment was carried out by applying a potential
of 0.25 V to the gold electrode in 0.5 M monothioarsenate solution at pH 13 and 25 °C
for about 12.5 hours. It was found that gold dissolved with an average dissolution rate of
2.0 × 10⁻¹¹ mol cm-2 s-1, which is of the same order of magnitude as that of gold in 0.5 M

Chapter 6 The Dissolution of Gold in Thioarsenate / Thioarsenite Solutions 183
thiosulfate solution (Chapter 4). The anodic current recorded during the coulometric test
is shown in Figure 6.6 from which it is clear that the current decreases with time,
indicating a passivation process. The average current efficiency for the dissolution of
gold was calculated to be 6% assuming a one-electron process. This indicates that the
oxidation of monothioarsenate predominates at a potential of 0.25 V.
6.2.1.4 Cathodic reduction of oxygen
The mixed potential of gold in oxygenated monothioarsenate solutions is between
–0.05 V to 0.1 V. The cathodic behaviour of oxygen on the gold electrode in
monothioarsenate solutions was thus investigated in the potential range between –0.2 and
0.2 V. Figure 6.7 shows a cyclic voltammogram for the cathodic reduction of oxygen in
0.1 M AsO3S3- solution at pH 12. Apparently, the cathodic current of oxygen on gold is
very small in the potential region of 0 to 0.1 V, confirming that the rate of oxidation of
gold by oxygen will be very low.
-500
-400
-300
-200
-100
0
100
-0.3 -0.2 -0.1 0 0.1 0.2 0.3
Potential (V)
Cur
rent
den
sity
(µA
cm
-2)
Figure 6.7 Cathodic reduction of oxygen on a rotating (400 rpm) gold electrode in an oxygenated 0.1 M AsO3S3- solution at pH 12.
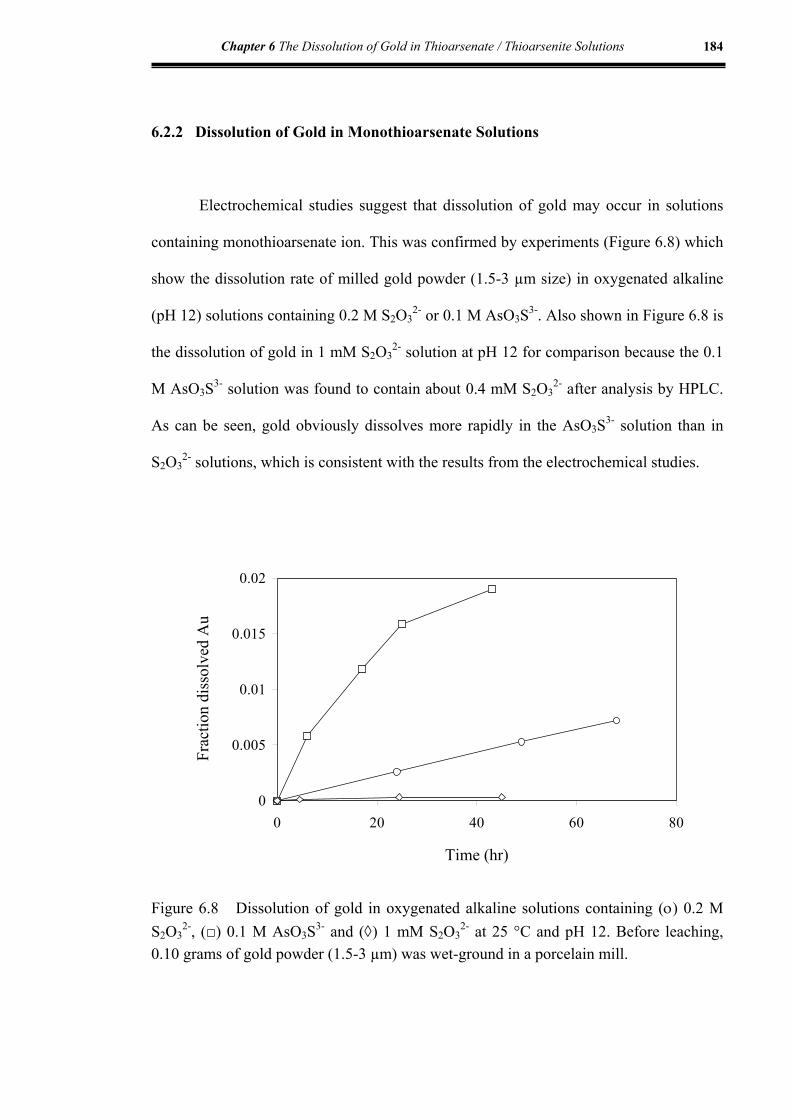
Chapter 6 The Dissolution of Gold in Thioarsenate / Thioarsenite Solutions 184
6.2.2 Dissolution of Gold in Monothioarsenate Solutions
Electrochemical studies suggest that dissolution of gold may occur in solutions
containing monothioarsenate ion. This was confirmed by experiments (Figure 6.8) which
show the dissolution rate of milled gold powder (1.5-3 µm size) in oxygenated alkaline
(pH 12) solutions containing 0.2 M S2O32- or 0.1 M AsO3S3-. Also shown in Figure 6.8 is
the dissolution of gold in 1 mM S2O32- solution at pH 12 for comparison because the 0.1
M AsO3S3- solution was found to contain about 0.4 mM S2O32- after analysis by HPLC.
As can be seen, gold obviously dissolves more rapidly in the AsO3S3- solution than in
S2O32- solutions, which is consistent with the results from the electrochemical studies.
0
0.005
0.01
0.015
0.02
0 20 40 60
Time (hr)
Frac
tion
diss
olve
d A
u
80
Figure 6.8 Dissolution of gold in oxygenated alkaline solutions containing (ο) 0.2 M S2O3
2-, () 0.1 M AsO3S3- and (◊) 1 mM S2O32- at 25 °C and pH 12. Before leaching,
0.10 grams of gold powder (1.5-3 µm) was wet-ground in a porcelain mill.

Chapter 6 The Dissolution of Gold in Thioarsenate / Thioarsenite Solutions 185
6.2.3 Discussion
Electrochemical studies have shown that gold may dissolve in alkaline
monothioarsenate solutions with a rate which is comparable to that in alkaline thiosulfate
solutions. The reactivity of monothioarsenate with gold could be associated with
coordinating ability of the sulfur atom in the AsO3S3- ion because sulfur is a soft
polarizable electron donor (see Section 2.1.2). By analogy with thiosulfate, the
mechanism of the anodic reaction of gold with monothioarsenate could be:
Au + AsO3S3- = Au | SAsO33- (ads) (6.1)
Au | SAsO33- (ads) = Au(SAsO3)2- (ads) + e- (6.2)
Au(SAsO3)2- (ads) + SAsO33- = Au(SAsO3)2
5- (6.3)
Figures 6.4 and 6.6 have shown that there is a passivation process which occurs
on the surface of gold in monothioarsenate solutions. As the monothioarsenate ion has a
similar structure as the thiosulfate ion, it is possible that this passivation is similar to that
in thiosulfate solutions and could result from the formation of a sulfur-like film on the
surface of gold, leading to a low anodic current efficiency for the dissolution of gold. By
analogy with oxidation of thiosulfate (see Chapter 4), the anodic oxidation of
monothioarsenate could involve the following reactions:
AsO3S 3- (ads) + 2OH- = AsO43- + S0 (ads) + H2O + 2e- (6.4)
2SAsO3 3- (ads) = (O3AsS-SAsO3)4- (ads) + 2e- (6.5)
(O3AsS-SAsO3)4- (ads) = (O3AsS-SAsO3)4- (aq) (6.6)
The (O3AsS-SAsO3)4- ion could rapidly oxidize or decompose to other species:
(O3AsS-SAsO3)4- + 4OH- = 2AsO43- + 2S0 + 2H2O + 2e- (6.7)
(O3AsS-SAsO3)4- + 2OH- = AsO3S3- + AsO43- + S0 + H2O (6.8)

Chapter 6 The Dissolution of Gold in Thioarsenate / Thioarsenite Solutions 186
However, more detailed work with respect to the chemistry of thioarsenate needs to be
carried out in order to characterize the reactions of gold in monothioarsenate solutions.
The leaching experiments have shown that gold can dissolve in oxygenated
alkaline monothioarsenate solutions at ambient temperatures and its dissolution rate is
measurably higher than that in thiosulfate solutions under similar conditions. The
dissolution reaction could be expressed as
4Au + O2 + 8AsO3S3- + 2H2O = 4Au(AsO3S)25- + 4OH- (6.9)
The initial rate of dissolution per unit area of gold in oxygenated AsO3S3- solution may
be estimated according to Equation 5.20 in Chapter 5, assuming that all the gold particles
are spherical and have the same size (3 µm). Using the data in Figure 6.8, the initial
dissolution rate of gold in oxygenated alkaline 0.1 M AsO3S3- solution was calculated to
be 1.3 × 10⁻¹² mol cm-2 s-1. Similarly, the leaching rate of gold in oxygenated 0.2 M
thiosulfate solution at pH 12 was estimated to be about 1.5 × 10⁻¹³ mol cm-2 s-1. These
values are about an order of magnitude less than those found for the anodic oxidation at
0.25 V.
In many hydrometallurgical leaching systems involving dissolution of a solid,
mass transfer of reactants to the solid-liquid interface is often rate controlling
(Wadsworth and Miller, 1979; Nicol, 1987). If the overall dissolution rate of gold in
oxygenated solutions containing 0.1 M AsO3S3- is limited by the rate of mass transport of
dissolved oxygen to the metal surface, the maximum rate of dissolution may be given by
Fick’s first law of diffusion, and described by the following equation (Wadsworth and
Miller, 1979):
Rmax = kL [O2] (6.10)

Chapter 6 The Dissolution of Gold in Thioarsenate / Thioarsenite Solutions 187
where Rmax is the maximum rate of dissolution per unit area, mol cm-2 s-1; kL the mass
transfer coefficient of dissolved oxygen, cm s-1; [O2] the concentration of dissolved
oxygen, mol cm-3. For suspended spherical particles of 3 µm diameter in aqueous
solution, kL is about 0.065 cm s-1 (Wadsworth and Miller, 1979; also see Appendix A3).
If the solubility of oxygen in 0.1 M electrolyte solutions at 25 °C and one atmosphere
partial pressure is assumed to be 32 mg l -1, i.e. 10-6 mol cm-3 (Tromans, 1998), the
maximum rate of gold dissolution will be 6.5 × 10⁻⁸ mol cm-2 s-1. This value is much
higher than the measured rate in the above experiments. This calculation confirms that
the rate of dissolution of gold in oxygenated monothioarsenate solution will be
chemically controlled.
6.3 Dissolution in Alkaline Thioarsenite Solutions
As reviewed in Section 2.3.2 in Chapter 2, there are many forms of thioarsenite
and the chemistry of thioarsenite is poorly understood. Synthetic solutions of thioarsenite
generally contain various arsenic species (Young and Robins, 2000; Mellor, 1929), and,
for this reason, the electrochemistry experiments on the behaviour of gold in thioarsenite
solutions were not carried out. However, some experiments involving the dissolution of
gold were carried out.
Two solutions containing thioarsenites were used in these experiments. Solution
(A) was prepared by dissolving 13.29 grams of synthetic amorphous orpiment (As2S3,
84.3% purity) in a solution containing 26.84 grams of sodium sulfide (Na2S·9H2O) at a
pH of 12. The molar ratio of Na2S to orpiment was 2.45, so that the arsenic-sulfur
species was stoichiometrically close to the form As2S54-, with a concentration of about
0.046 M.

Chapter 6 The Dissolution of Gold in Thioarsenate / Thioarsenite Solutions 188
Solution (B) was prepared by dissolving 7.00 grams of synthetic amorphous
orpiment of 84.3% purity in 500 ml of a solution containing 9.00 grams of sodium
hydroxide. According to Remy et al. (1956), this solution with pH 12.7 should contain
0.024 M AsS33- and 0.024 M AsO3
3- as suggested by the following equation (see Section
2.3.2):
As2S3 + 6OH- = AsS33- + AsO3
3- + 3H2O (6.11)
6.3.1 Dissolution of Gold
Figure 6.9 summarizes the results of an experiment in which fine gold powder
(100 mg) was contacted with an aerated solution (300 ml) of solution (A) at 25 °C. The
agitation of the solution was provided by a magnetic stirrer. It is apparent that the pH of
the solution decreased gradually from 12 to 10.5 while gold dissolved to some extent
with the concentration reaching 1 mg l-1 after 21 hours. During the experiment, the
potential of the solution increased gradually with time, achieving a stable value of about
0.1 V after 4 hours. This potential is similar to that observed during the alkaline
oxidation of refractory gold concentrates containing arsenopyrite and pyrite (see Chapter
8).
The results of a similar experiment with solution (B) in the presence of air are
shown in Figure 6.10. As can be seen, the pH and potential profiles are similar to those in
Figure 6.9, while the dissolved gold concentration was much lower, at 0.3 mg l-1 after 24
hours.
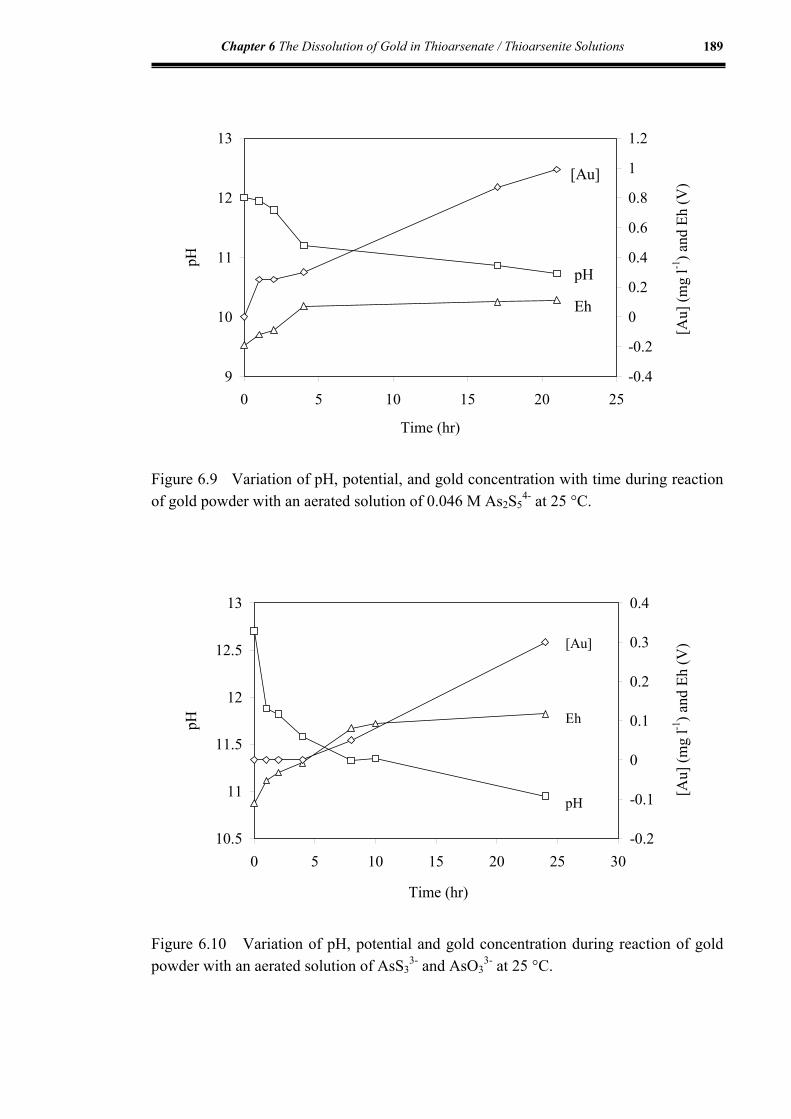
Chapter 6 The Dissolution of Gold in Thioarsenate / Thioarsenite Solutions 189
9
10
11
12
13
0 5 10 15 20 25
Time (hr)
pH
-0.4
-0.2
0
0.2
0.4
0.6
0.8
1
1.2
[Au]
(mg
l-1) a
nd E
h (V
)[Au]
pH
Eh
Figure 6.9 Variation of pH, potential, and gold concentration with time during reaction of gold powder with an aerated solution of 0.046 M As2S5
4- at 25 °C.
10.5
11
11.5
12
12.5
13
0 5 10 15 20 25 30
Time (hr)
pH
-0.2
-0.1
0
0.1
0.2
0.3
0.4
[Au]
(mg
l-1) a
nd E
h (V
)[Au]
Eh
pH
Figure 6.10 Variation of pH, potential and gold concentration during reaction of gold powder with an aerated solution of AsS3
3- and AsO33- at 25 °C.

Chapter 6 The Dissolution of Gold in Thioarsenate / Thioarsenite Solutions 190
Table 6.1 shows the effects of time, temperature and atmosphere on the extent of
dissolution of gold in thioarsenite solutions. It is clear by comparison between Tests 2
and 3 that gold dissolution is favored by higher temperatures, while, as expected, the
presence of oxygen has a positive effect on the dissolution of gold (see Tests 1, 2 and 4).
Table 6.1 Results of testwork on the dissolution of gold in thioarsenite solutions
Test No.
Au used (mg)
Solution (100 ml)
Gas bubbling
Temperature (°C)
Time (hr)
[Au] (mg l-1 )
1 20 A N2 25 10 0.13 2 28 A Air 25 10 0.6 3 28 A Air 50 10 1.1 4 28 A None 25 10 1.5 5 50 A None 25 24 4.6 6 30 B None 25 20 0.4
6.3.2 Discussion
It has been shown that gold dissolves in alkaline thioarsenite solutions but that
the kinetics of the reaction is extremely slow. It is evident that the rate of dissolution is
dependent on the composition, potential and temperature of the solution. Comparison of
Figure 6.9 with Figure 6.10 indicates that under similar conditions the dissolution of gold
is greater in the As2S54- solution than the alkaline solution containing AsS3
3- and AsO33-.
Since the chemistry of thioarsenite is poorly understood, it is not certain which ions are
responsible for the reaction i.e. coordinate with gold(I), although several possible gold
complexes with thioarsenites have been suggested (see Section 2.3.3). According to

Chapter 6 The Dissolution of Gold in Thioarsenate / Thioarsenite Solutions 191
Webster (1990) and Eary (1992), amorphous orpiment dissolves under alkaline
conditions to produce arsenite and sulfide ions while Young and Robins (2000) and
Remy et al. (1956) suggest that the As3S63- or AsS3
3- ion could be formed in sulfide free
alkaline solutions in addition to arsenite (see Equations 2.69 and 2.70 in Chapter 2). If
the sulfide ion is formed, it will react with the auric ion to precipitate gold sulfide in
oxygen free solutions, in addition to which the auric ion is not stable in alkaline
solutions, forming a yellow brown precipitate, gold(III) hydroxide (Remy et al., 1956;
Mellor, 1929).
8AuCl4- + 9S2- + 8OH- = 8AuS + 32Cl- + SO4
2- + 4H2O (6.12)
AuCl4- + 3OH- = Au(OH)3 + 4Cl- (6.13)
Preliminary experiments, however, showed that no apparent reactions were observed
when an auric chloride (NaAuCl4) solution containing 13.6 mg l-1 Au was mixed with an
equal volume of the 0.024 M AsS33- solution at pH 12.7. The gold concentration of the
resulting solution (pH 12) was found to be 6.5 mg l-1 gold, which indicates that almost all
the gold remained in the solution. The fact that no precipitation occurred suggests that
gold(III) ions possibly react with thioarsenite ions, forming stable soluble complexes or
that auric ions are reduced by thioarsenite forming thioarsenite complexes of gold(I).
In alkaline 0.046 M As2S54- solutions which were prepared by dissolving As2S3 in
Na2S solution, the AsS2(SH)2-, AsS(SH)2- and AsS(SH)(OH)- ions probably exist
according to Helz et al. (1995). These ions could react with gold forming stable
complexes. Thus, when a fresh 0.046 M As2S54- solution was mixed with an equal
volume of NaAuCl4 solution containing 13.6 mg l-1 Au, no precipitation was observed
and all the gold was still present in solution at pH 12 even after 3 days. This explanation
is also supported by the theoretical calculations of Tossell (2000b) who has suggested
that the complex AuAsS(SH)(OH) is more stable than the aquo ion of Au(I) and that

Chapter 6 The Dissolution of Gold in Thioarsenate / Thioarsenite Solutions 192
other complexes of gold with the ligands AsS(SH)(OH)- or AsS(SH)2- are possible. The
dissolution behaviour of gold in thioarsenite solutions is possibly associated with the
sulfur in thioarsenite as in the case of polysulfides, thiosulfate, thiocyanate, thiourea or
other sulfur bearing ligands which form complexes with gold(I).
6.4 Conclusions
Some aspects of the electrochemistry of gold in alkaline monothioarsenate
solutions and the dissolution of gold in monothioarsenate and thioarsenite solutions have
been studied. Electrochemical studies have shown that gold dissolves at a measurable
rate in monothioarsenate solutions at a potential of 0.25 V, which is confirmed by
leaching experiments in the presence of oxygen. The low current efficiency of about 6%
for the anodic oxidation of gold indicates that the oxidation of thioarsenate is the
predominant reaction in this potential region. There is evidence that the formation of a
passivating film inhibits the dissolution of the gold. It has also been found that gold
dissolves in thioarsenite solutions and its dissolution rate is dependent on the
composition, temperature and oxygen concentration of the solution. Possible forms of
gold complexes with these species have been discussed.

Chapter 7 Simultaneous Oxidation of Sulfide Minerals and Dissolution of Au in Alkaline Solutions 193
CHAPTER 7 SIMULTANEOUS OXIDATION OF SULFIDE
MINERALS AND DISSOLUTION OF GOLD
IN ALKALINE SOLUTIONS
7.1 Introduction
As mentioned in Chapter 1, one of the major challenges currently experienced by
the gold industry is the efficient recovery of precious metals from refractory ores and
concentrates containing arsenopyrite (FeAsS) and pyrite (FeS2) which are important host
minerals for gold. These minerals are required to be broken down by oxidation in order
to expose the gold to cyanide or other lixiviants. Although several pretreatment options
for the oxidation of these minerals have found industrial application such as roasting,
pressure oxidation and bio-oxidation (Sparrow and Woodcock, 1995), they still have
some drawbacks, particularly in their application to small or low grade operations.
Alkaline oxidation may be a preferred treatment option for arsenical sulfide ores
in certain situations and has several technical merits (Deng, 1995). However, in
comparison with many developed processes carried out under acidic conditions, the
alkaline oxidation route has received very limited attention for refractory gold ores and
only the Barrick Mercur Gold Mine, Nevada, used alkaline pressure oxidation on
commercial scale as pretreatment of refractory gold ores (Thomas, 1991a; Thomas and
Williams, 2000). The drawbacks of alkaline oxidation route such as the use of relatively
expensive reagents, such as sodium hydroxide (NaOH) and higher operating pressure

Chapter 7 Simultaneous Oxidation of Sulfide Minerals and Dissolution of Au in Alkaline Solutions 194
have prevented the commercial application of this process (Deng, 1995). In recent years,
novel attempts have been made to increase gold recovery and decrease the costs of
alkaline oxidation processes, including simultaneous oxidation of ores and leaching of
gold with cyanide (Mao et al., 1997; Min et al., 1999; Rossovsky, 1993) and leaching
with a lime-sulfur mixture (Lan and Zhang, 1996; Fang and Han, 2002).
As reviewed in Chapter 2, the oxidation of pyrite has been extensively studied in
acid and alkaline media (Ciminelli and Osseo-Asare, 1995a, b; Tao et al., 1994; Mycroft
et al., 1990; Lowson, 1982; Goldhaber, 1983; Mishra and Osseo-Asare, 1988). In
alkaline solutions, the predominant sulfur species produced during pyrite oxidation are
thiosulfate and sulfite as described in reactions 7.1 and 7.2 (Goldhaber, 1983).
4FeS2 + 7O2 + 6H2O = 4FeOOH + 8H+ + 4S2O32- (7.1)
4FeS2 + 11O2 + 10H2O = 4FeOOH + 16H+ + 8SO32- (7.2)
Unlike pyrite, there is less information available related to the aqueous alkaline oxidation
of arsenopyrite in the literature. Although the chemistry of arsenopyrite oxidation in acid
media has been studied by Papangelakis and Demopoulos (1990) and Fernandez (1992),
and the electrochemical studies on the alkaline oxidation of arsenopyrite have been
carried out, there is little work reported for the dissolution chemistry of arsenopyrite in
oxygenated alkaline media. Generally, it is believed that the overall reaction for the
arsenoyrite oxidation in strong alkalis is as follows (Kostina and Chernyak, 1979):
2FeAsS + 10OH- + 7O2 = Fe2O3 + 2AsO43- + 2SO4
2- + 5H2O (7.3)
But there still is some debate about the intermediate products of arsenopyrite oxidation.
The formation of thioarsenite (AsS33-) and thiosulfates in alkaline solutions has been
reported during the atmospheric oxidation of gold bearing arsenical ores (Nagy et al.,
1966; Rossovsky, 1993).

Chapter 7 Simultaneous Oxidation of Sulfide Minerals and Dissolution of Au in Alkaline Solutions 195
During an ongoing investigation into the oxidation of refractory gold ores
containing arsenopyrite and pyrite, it was found (Zhang and Nicol, 1999) that gold
dissolved simultaneously with oxidation of these ores by dissolved oxygen in alkaline
solutions in the absence of cyanide. This study, therefore, was aimed at an investigation
of the chemistry of oxidation of pure arsenopyrite and pyrite in alkaline solutions with
dissolved oxygen, and the dissolution behaviour of pure gold during the oxidation of
these minerals in order to develop an understanding of the chemistry of a possible new
process for gold recovery from refractory sulfidic gold ores.
This chapter focuses on the characterization of the products of oxidation of sulfur
and arsenic with a view to possible correlations of gold dissolution with the nature and
concentration of the oxidation products. The minerals used in this study are described in
the following section, and the detailed experimental procedure and analytical techniques
can be found in Chapter 3.
During experiments aimed at the study of the kinetics of the reactions,
experimental conditions were adjusted such that only one experimental parameter was
varied at a time. Unless otherwise stated, all experiments were carried out in 500 ml of
1.25 M NaOH solution using 50 g l-1 mineral sample and 66 mg fine gold powder at 25
°C, 1400 rpm stirring speed and 1 l min-1 flow rate of air. Prior to oxidation, the gold was
wet-ground together with the mineral for 60 minutes in a stainless steel mill.
7.2 Sulfide Minerals
In this study two arsenopyrite samples were used. One sample was obtained from
China through Gemstone House in Western Australia. X-ray diffraction analysis (Figure
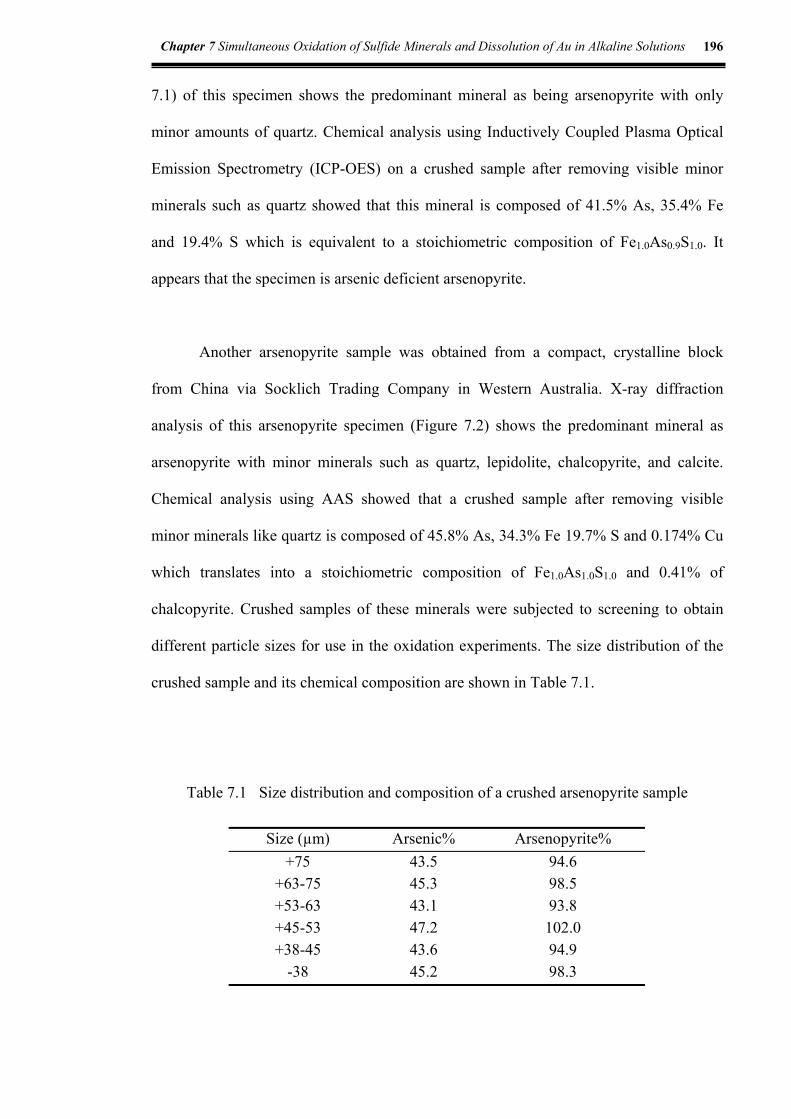
Chapter 7 Simultaneous Oxidation of Sulfide Minerals and Dissolution of Au in Alkaline Solutions 196
7.1) of this specimen shows the predominant mineral as being arsenopyrite with only
minor amounts of quartz. Chemical analysis using Inductively Coupled Plasma Optical
Emission Spectrometry (ICP-OES) on a crushed sample after removing visible minor
minerals such as quartz showed that this mineral is composed of 41.5% As, 35.4% Fe
and 19.4% S which is equivalent to a stoichiometric composition of Fe1.0As0.9S1.0. It
appears that the specimen is arsenic deficient arsenopyrite.
Another arsenopyrite sample was obtained from a compact, crystalline block
from China via Socklich Trading Company in Western Australia. X-ray diffraction
analysis of this arsenopyrite specimen (Figure 7.2) shows the predominant mineral as
arsenopyrite with minor minerals such as quartz, lepidolite, chalcopyrite, and calcite.
Chemical analysis using AAS showed that a crushed sample after removing visible
minor minerals like quartz is composed of 45.8% As, 34.3% Fe 19.7% S and 0.174% Cu
which translates into a stoichiometric composition of Fe1.0As1.0S1.0 and 0.41% of
chalcopyrite. Crushed samples of these minerals were subjected to screening to obtain
different particle sizes for use in the oxidation experiments. The size distribution of the
crushed sample and its chemical composition are shown in Table 7.1.
Table 7.1 Size distribution and composition of a crushed arsenopyrite sample
Size (µm) Arsenic% Arsenopyrite% +75 43.5 94.6
+63-75 45.3 98.5 +53-63 43.1 93.8 +45-53 47.2 102.0 +38-45 43.6 94.9
-38 45.2 98.3

Chapter 7 Simultaneous Oxidation of Sulfide Minerals and Dissolution of Au in Alkaline Solutions 197
0
50
100
150
200
250
300
20 30 40 50 60 70 80Degrees 2-Theta
Cou
nts
FeAsS
Figure 7.1 X-ray diffraction diagram for pure arsenopyrite sample from Gemstone House. Wavelength of 1.7902Å (Co).
0
1000
2000
3000
4000
5000
6000
7000
20 30 40 50 60 70 80Degrees 2-Theta
Cou
nts
FeAsS
Figure 7.2 X-ray diffraction diagram for pure arsenopyrite sample from Socklich Trading Company. Wavelength of 1.7902Å (Co).
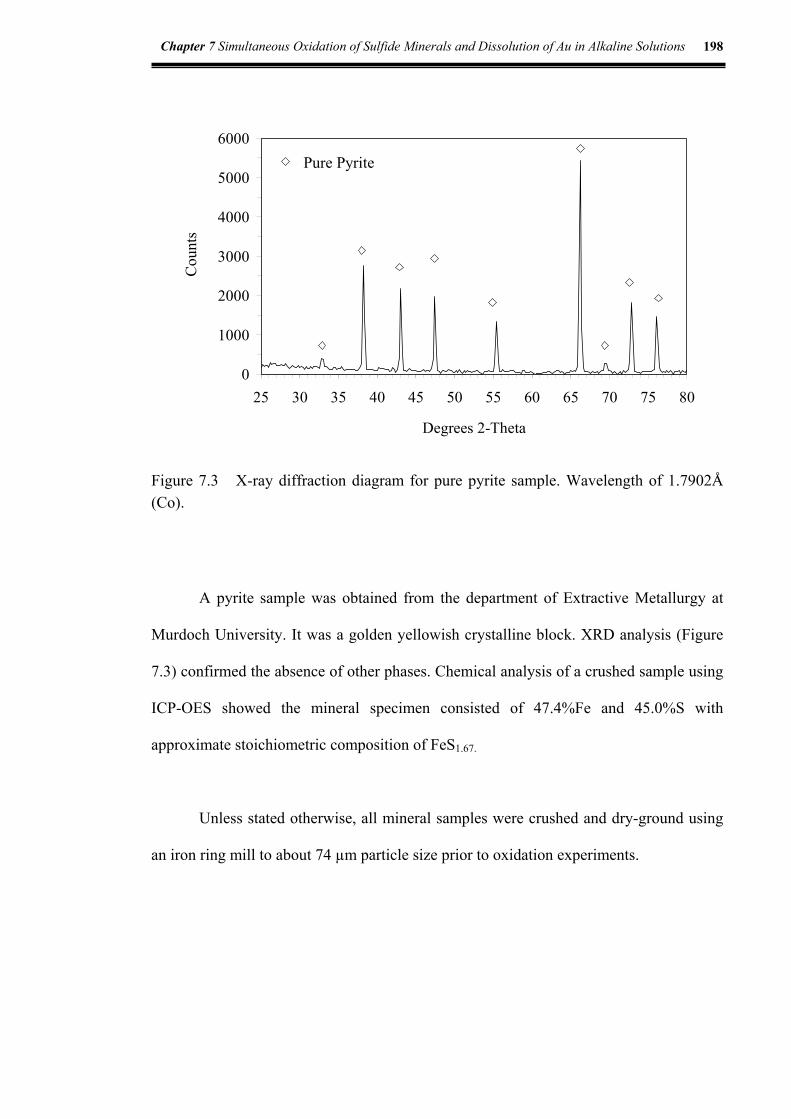
Chapter 7 Simultaneous Oxidation of Sulfide Minerals and Dissolution of Au in Alkaline Solutions 198
0
1000
2000
3000
4000
5000
6000
25 30 35 40 45 50 55 60 65 70 75 80
Degrees 2-Theta
Cou
nts
Pure Pyrite
Figure 7.3 X-ray diffraction diagram for pure pyrite sample. Wavelength of 1.7902Å (Co).
A pyrite sample was obtained from the department of Extractive Metallurgy at
Murdoch University. It was a golden yellowish crystalline block. XRD analysis (Figure
7.3) confirmed the absence of other phases. Chemical analysis of a crushed sample using
ICP-OES showed the mineral specimen consisted of 47.4%Fe and 45.0%S with
approximate stoichiometric composition of FeS1.67.
Unless stated otherwise, all mineral samples were crushed and dry-ground using
an iron ring mill to about 74 µm particle size prior to oxidation experiments.

Chapter 7 Simultaneous Oxidation of Sulfide Minerals and Dissolution of Au in Alkaline Solutions 199
7.3 Results 7.3.1 Oxidation of Pyrite and Gold in Alkaline Solutions
As many studies have been reported in relation to the oxidation of pyrite, only
one experiment was carried out with pyrite in the presence of gold powder in order to
observe the behaviour of gold and other species during the alkaline oxidation of pyrite
with dissolved oxygen. Figure 7.4 shows the molar ratios of the main sulfur species to
total dissolved sulfur obtained by analysis of aqueous solutions during the oxidation in
aerated 1.25 M NaOH solution of pyrite which was milled with gold powder. In this
experiment, about 60% of the pyrite sample was oxidized after 24 hours. Elemental
sulfur was observed as a fine white dispersion in the slurry during the oxidation and
found to constitute about 0.3% (by mass) of the final residue after 24 hours. This
experiment confirmed the formation of thiosulfate and sulfite during the alkaline
oxidation of pyrite by oxygen (Goldhaber, 1983). Sulfate is obviously formed as a
product of the oxidation of sulfite after long leaching times.
0
0.1
0.2
0.3
0.4
0.5
0.6
0.7
0.8
0 5 10 15 20 25
Time (hr)
Frac
tion
of su
lfur s
peci
es
Figure 7.4 Atomic molar ratios of sulfur species to total dissolved sulfur during the oxidation of pyrite by air. (◊) S2O3
2-; (∆) SO42-; () SO3
2-. (pulp density =100 g l-1 , 56 mg gold powder).

Chapter 7 Simultaneous Oxidation of Sulfide Minerals and Dissolution of Au in Alkaline Solutions 200
Figure 7.5 shows the variations in the solution potential, pH, dissolved O2
concentration, and Figure 7.6 gives the concentrations of Au, Cu, Fe and thiosulfate
during the oxidation. The pulp potential reported during the oxidation is in the range –0.6
V to 0.2 V. Thiosulfate reached its highest concentration after 24 hours while 5.6% of the
gold dissolved after 24 hours. Copper and iron were also detected in trace amounts in the
leach solutions. The dissolution of copper is probably due to a trace amount of copper in
the pyrite and its reaction with thiosulfate. Polysulfides were not detected by ion
chromatography nor through the reaction of cupric ions with the solutions, which is
consistent with the previous studies (Goldhaber, 1983). From these results it appears that
gold is dissolved with thiosulfate as the lixiviant in the potential range of 0 to 0.2 V and
the pH region of 10.5 to 13.5.
-0.7-0.6-0.5-0.4-0.3-0.2-0.1
00.10.20.3
0 5 10 15 20 25
Time (hr)
Pote
ntia
l of P
t (V
)
0
2
4
6
8
10
12
14
[Au]
, [O
2] (p
pm);
pH
Figure 7.5 Variation of solution potential (×), pH (), concentration of gold (◊) and dissolved oxygen (∆) during the oxidation of pyrite by air (pulp density =100 g l-1 , 56 mg gold powder).

Chapter 7 Simultaneous Oxidation of Sulfide Minerals and Dissolution of Au in Alkaline Solutions 201
0
0.1
0.2
0.3
0 5 10 15 20 25
Time (hr)
[S2O
32-] (
M)
0
1
2
3
4
5
6
7
8
[Au]
, [C
u], [
Fe] (
ppm
)
Figure 7.6 Variation of concentrations of Au(◊), Cu(), Fe(×) and thiosulfate(∆) during the oxidation of pyrite by air (pulp density =100 g l-1 , gold added =56mg).
7.3.2 Oxidation of Arsenopyrite in Alkaline Solutions
Alkaline oxidation of arsenopyrite was carried out under various experimental
conditions of temperature, oxygen partial pressure, alkalinity, pulp density, particle size
and stirring speed. Typical experimental results obtained for the reaction stoichiometry
during oxidation are given in Figures 7.7 to 7.9 which show the molar ratios of the
various soluble species obtained by analysis of aqueous samples taken at different stages
of the oxidation in aerated 1.25 M NaOH solutions. The stoichiometric molar ratio of
dissolved S/As has been found to be 1.0 (Figure 7.7) throughout the oxidation. After 24
hours about 95% of the arsenopyrite was oxidized by chemical analysis of the oxidation
residue for arsenic and sulfur.

Chapter 7 Simultaneous Oxidation of Sulfide Minerals and Dissolution of Au in Alkaline Solutions 202
0
50
100
150
200
250
0 50 100 150 200 250
Total arsenic in solution (mM)
Tota
l sul
fur i
n so
lutio
n (m
M)
Figure 7.7 Molar ratio of total sulfur/ total arsenic during the oxidation of arsenopyrite with air.
0
0.1
0.2
0.3
0.4
0.5
0.6
0.7
0 5 10 15 20 25
Time (hr)
Frac
tion
of su
lfur s
peci
es
Figure 7.8 Molar fractions of sulfur species/total dissolved sulfur during the oxidation of arsenopyrite with air. (◊) S2O3
2-; (∆) AsO3S3-; () SO32-.

Chapter 7 Simultaneous Oxidation of Sulfide Minerals and Dissolution of Au in Alkaline Solutions 203
0
0.1
0.2
0.3
0.4
0.5
0.6
0.7
0.8
0 5 10 15 20 25Time (hr)
Frac
tion
of a
rsen
ic sp
ecie
s
Figure 7.9 Molar fractions of arsenic species/total dissolved arsenic during the oxidation of arsenopyrite with air. (◊) HAsO4
2-; (∆) AsO3S3-; () H2AsO3-.
It appears that monothioarsenate and sulfite are the initial products of
arsenopyrite oxidation while thiosulfate is not. After 12 hours, the concentrations of
various species tend to be constant, with the molar ratio of monothioarsenate to total
dissolved sulfur or arsenic being 1/3 and that of thiosulfate to total dissolved sulfur and
arsenate to total dissolved arsenic being 2/3. Other than the sulfur species, thiosulfate and
sulfite, and the arsenic species, arsenate, arsenite and monothioarsenate, small amounts
of dithioarsenate (AsO2S23-), sulfate and polythionates (SnO6
2-, n = 3-5) were also
detected with concentrations less than 5 mM by ion chromatographic analysis of the
solutions. As in the case of the oxidation of pyrite, sulfide or polysulfide ions were not
detected by ion chromatography which is not unexpected because of the presence of
significant amounts of iron in an oxidizing environment and high pH (Goldhaber, 1983).
This study clearly shows that thiosulfate, monothioarsenate and arsenate are the
predominant species in solutions, the relative ratios of which are dependant on the
oxidation conditions such as alkalinity, oxygen pressure and reaction time.

Chapter 7 Simultaneous Oxidation of Sulfide Minerals and Dissolution of Au in Alkaline Solutions 204
Figure 7.10 Scanning electron micrograph of arsenopyrite particles after oxidation in an aerated 1.25 M NaOH solution.
In this typical experiment, elemental sulfur was neither observed nor determined
in the oxidation residue as an intermediate product. Chemical analysis for iron and
arsenic after dissolving the dried residue in 3 M HCl solutions indicated that the residue
consisted predominantly of iron hydroxide possibly in the form of FeOOH with a very
small amount of arsenic probably as iron arsenate (FeAsO4). X-ray diffraction analysis of
this residue showed that almost all the arsenopyrite minerals had been oxidized and that
amorphous iron oxides were formed because there was no significant peak detected in
the XRD analysis. Figure 7.10 shows a SEM photograph of the oxidized residue of
milled arsenopyrite which indicates that the particles are very fine and porous.

Chapter 7 Simultaneous Oxidation of Sulfide Minerals and Dissolution of Au in Alkaline Solutions 205
Figure 7.11 Optical microscopic photograph of an arsenopyrite electrode after oxidation in an aerated 1.25 M NaOH solution. The yellowish bright spots are the surface of arsenopyrite and the brownish color indicates the presence of iron hydroxide.
Figure 7.11 shows the surface of an arsenopyrite electrode immersed in reacting
pulp during oxidation of arsenopyrite in aerated 1.25 M NaOH solution. Clearly, the
electrode is covered by an amorphous porous brownish iron hydroxide which may hinder
the transport of reactants and products to and from the surface of the mineral during
oxidation. This may explain why the extent of oxidation of arsenopyrite in alkaline
media increases linearly and rapidly in the initial stage before decreasing at later stages
as shown in the following sections.

Chapter 7 Simultaneous Oxidation of Sulfide Minerals and Dissolution of Au in Alkaline Solutions 206
7.3.3 Effect of Milling of Gold with Arsenopyrite
These experiments investigated the behaviour of milled or unmilled gold during
the oxidation of arsenopyrite and were carried out in aerated 1.25 M NaOH solutions at
25 °C using 50 grams of pure arsenopyrite wet-milled with or without 55 mg gold fine
powder for 1 hour. In the latter case, the gold powder was directly added into the pulp of
milled arsenopyrite prior to oxidation. The results are shown in Figures 7.12, 7.13 and
7.14.
As seen in Figure 7.12, about 5% of gold wet-milled with arsenopyrite dissolves
after 24 hours, whereas the gold directly added into the reaction system effectively does
not dissolve. As expected, there are no marked differences in the dissolution rates of
arsenic and iron between the two experiments. The extent of dissolution of arsenic
increases with time, reaching about 60% in 12 hours and increasing slowly with time
thereafter. Possible reasons for the slower dissolution rate of arsenopyrite in the later
stages are the increase of the thickness of the iron hydroxide films on the surface of the
arsenopyrite particles which may retard the mass transport of reactants such as oxygen
and the consumption of the reactant, namely, sodium hydroxide. It is interesting to note
that a significant and increasing amount of iron starts to dissolve when the pH becomes
less than 12. Figures 7.13 and 7.14 show that there are small differences in the
concentrations of oxygen, thiosulfate and monothioarsenate between the two
experiments.

Chapter 7 Simultaneous Oxidation of Sulfide Minerals and Dissolution of Au in Alkaline Solutions 207
0
0.1
0.2
0.3
0.4
0.5
0.6
0.7
0.8
0 5 10 15 20 25Time (hr)
Frac
tion
diss
olve
d
AsFeAu
Figure 7.12 Dissolution of Au (◊), As () and Fe (ο) during oxidation of arsenopyrite milled with (white, dashed line) and without (black, solid line) gold powder (pulp density =100 g l-1, 55 mg gold).
-0.6
-0.5
-0.4
-0.3
-0.2
-0.1
0
0.1
0.2
0 5 10 15 20 25
Time (hr)
Pote
ntia
l of P
t (V
)
0
2
4
6
8
10
12
14
[O2]
(ppm
) and
pH
EPt
pH
[O2]
Figure 7.13 Variation of the potential (), pH (∆) and dissolved oxygen (ο) of the pulp during oxidation of arsenopyrite milled with (white) and without (black) gold (pulp density =100 g l-1, 55 mg gold).

Chapter 7 Simultaneous Oxidation of Sulfide Minerals and Dissolution of Au in Alkaline Solutions 208
0
0.02
0.04
0.06
0.08
0.1
0.12
0.14
0.16
0 5 10 15 20 25Time (hour)
Con
cent
ratio
n (M
)
[S2O32- ]
[AsO3S3- ]
Figure 7.14 Variation of the concentrations of thiosulfate () and monothioarsenate (∆) during oxidation of arsenopyrite milled with (white) and without (black) gold (pulp density =100 g l-1, 55 mg gold).
The presence of dissolved iron in the solutions is possibly related to the presence
of soluble arsenic species because ferric ions are not normally stable in alkaline media.
This was tested by a preliminary investigation of the solubility of ferric ions in aqueous
solutions of monothioarsenate or arsenate at various pH values by adjustment using
dilute NaOH or sulfuric acid solutions. The experimental results shown in Table 7.2
indicate that ferric ions form clear stable or metastable complexes with monothioarsenate
and arsenate in aqueous solutions with pH of 8 to 11. The brown solutions have remained
stable even after one year.

Chapter 7 Simultaneous Oxidation of Sulfide Minerals and Dissolution of Au in Alkaline Solutions 209
Table 7.2 Solubility of ferric ions in monothioarsenate and arsenate solutions
[Fe] / g l-1
pH 0.01 M AsO3S3- 0.05 M AsO4
3- Appearance
11 0.31 1.48 Brown clear solution 10 0.38 1.18 Brown clear solution 9 1.30 - Brown clear solution 8 - 0.45 Brown clear solution
The higher dissolution rate of gold during the oxidation of arsenopyrite milled
with gold could be attributed to a greater surface area and a better dispersion of the gold
particles after wet-grinding. However, it is difficult to determine the size distribution of
the gold particles before and after milling with the mineral, although an effort was made
to analyze the arsenopyrite sample milled with the gold powder by using a Scanning
Electron Microscope (SEM) technique. Figure 7.15 shows some fine gold particles found
in the milled arsenopyrite and the surface components of one gold particle are listed in
Table 7.3.
Table 7.3 Semi-quantitative SEM/EDAX analysis of a fine gold particle after wet-grinding
Element Mass% Molar%
Gold (Au) 94.6 83.2 Iron (Fe) 3.3 10.2
Arsenic (As) 1.5 3.5 Sulfur (S) 0.6 3.2

Chapter 7 Simultaneous Oxidation of Sulfide Minerals and Dissolution of Au in Alkaline Solutions 210
Figure 7.15 SEM photograph of fine gold particles wet-milled together with arsenopyrite in a stainless steel mill. The white spots are gold particles. The original unmilled gold particles are 1.5 - 3 µm in size.
It can be seen that there is no apparent change in the sizes of gold particles after
wet-grinding. However, the data shown in Table 7.3 indicate a molar ratio of As:S:Fe of
around 1:1:3, which seems to suggest the occurrence of chemical reactions of
arsenopyrite on the surface of gold. Thus, mechanochemical interactions between gold
and the arsenopyrite mineral should be taken into account in the interpretation of the
higher dissolution rate of gold during the alkaline oxidation of arsenopyrite. According
to Balaz (2000), S(-2) and S(+6) can be found on the surface of mechanically activated
arsenopyrite samples with sulfate sulfur prevailing. It is possible that some of the gold
particles could react with sulfides or the As-S group forming solid compounds that are
more easily soluble in thiosulfate solutions.

Chapter 7 Simultaneous Oxidation of Sulfide Minerals and Dissolution of Au in Alkaline Solutions 211
Figure 7.16 shows the X-ray diffraction patterns of the arsenopyrite mineral
before and after wet-milling with gold powders. No obvious differences can be observed
which is not unexpected given that the X-ray diffraction technique normally cannot
detect components with a mass less than 5% of the total.
0
2000
4000
6000
20 30 40 50 60 70 80
Degrees 2-Theta
Cou
nts
a
b
c
ab
c
pure FeAsS pure FeAsS milled
pure FeAsS milled with Au
Figure 7.16 XRD diagrams for wet-milled arsenopyrite minerals in the presence and absence of gold powder. Wavelength of 1.7902Å (Co).
7.3.4 Effect of Particle Size on the Dissolution of Arsenopyrite
The results of experiments conducted with three size fractions of arsenopyrite
samples (-10 µm, +38-45 µm, and +63-75 µm) are shown in Figures 7.17 and 7.18.
These experiments were carried out using 30 g l-1 pulp density in aerated 1.25 M NaOH
solutions without the addition of gold powder. As shown in Figure 7.17, the oxidation

Chapter 7 Simultaneous Oxidation of Sulfide Minerals and Dissolution of Au in Alkaline Solutions 212
rate of arsenopyrite increases as expected with decreasing particle size. With ultra-fine
particles (less than 10 µm, average size 4.2 µm), the rate of oxidation is rapid and almost
constant for the first 5 hours after which the rate reduces with time until complete
oxidation is achieved after about 12 hours. In the cases of the coarser particle sizes, the
rate of oxidation is significantly lower and remains nearly constant for 24 hours. Figure
7.18 shows that the concentrations of thiosulfate and monothioarsenate in the reacting
slurry with ultra-fine particles of arsenopyrite are much higher than those with coarser
sizes of arsenopyrite. These results suggest that ultra-fine milling of arsenopyrite could
assist in the dissolution of gold because of the formation of higher concentrations of
thiosulfate and monothioarsenate.
0
0.2
0.4
0.6
0.8
1
0 5 10 15 20 25Time (hr)
Frac
tion
diss
olve
d FeAsS
Figure 7.17 Dissolution rates of arsenopyrite with different particle sizes in aerated 1.25 M NaOH solutions (pulp density =30 g l-1). (◊) -10 µm; () +38-45 µm; (∆) +63-75 µm.

Chapter 7 Simultaneous Oxidation of Sulfide Minerals and Dissolution of Au in Alkaline Solutions 213
Figure 7.18 Variation of thiosulfate and monothioarsenate during oxidation of pure arsenopyrite of different particle sizes in 1.25 M NaOH solutions (pulp density:30 g l-1). (◊) -10 µm; () +38-45 µm; (∆) +63-75 µm.
7.3.5 Effect of Stirring Speed on the Dissolution of Arsenopyrite and Gold
Stirring speed has a significant effect on the oxidation rate of arsenopyrite in
alkaline or acid solutions under oxygen pressures (Ciminelli and Osseo-Asare, 1995a, b;
Koslides and Ciminelli, 1992; Papangelakis and Demopoulos, 1990). Koslides and
Ciminelli (1992) reported that over 800 rpm rotation in their reactor the reaction rate
became independent of the stirring speed. In this study only two stirring speeds, 600 rpm
and 1400 rpm, were selected to assess the effect of agitation on the rate of dissolution of
arsenopyrite and gold.
The experimental results shown in Figure 7.19 highlight the noticeable
differences in the dissolution rates of arsenopyrite and gold. At 600 rpm agitation, gold
does not dissolve and only 41% of the arsenopyrite is oxidized after 24 hours, whereas
with a strong agitation of 1400 rpm, 8.3% of the gold and 95.2% of the arsenopyrite

Chapter 7 Simultaneous Oxidation of Sulfide Minerals and Dissolution of Au in Alkaline Solutions 214
dissolve after 24 hours. Figures 7.20 and 7.21 show the concentrations of thiosulfate,
oxygen and monothioarsenate and the potential of a gold electrode in the reaction slurry
during these experiments.
0
0.2
0.4
0.6
0.8
1
0 5 10 15 20 25
Time (hr)
Frac
tion
diss
olve
d
As at 1400rpm
As at 600rpm
Au at 1400rpm
Au at 600rpm
Figure 7.19 Dissolution rate of arsenopyrite and gold in 1.25 M NaOH solutions with different agitation speeds (pulp density =50 g l-1, 66 mg gold).
It can be seen that at 600 rpm agitation, the concentrations of thiosulfate,
monothioarsenate and oxygen in the pulp and the potential of gold electrode are much
lower than those at the higher 1400 rpm stirring speed, which suggests that mass transfer
of oxygen in the bulk solution could be limiting the reaction rates at the lower agitation
speed. Thus, based on these data, the stirring speed of 1400 rpm was chosen as the
standard condition for the experiments because it ensured more efficient mass transfer of
oxygen as well as adequate suspension of the solid particles. From these results, it can
also be concluded that at lower potentials the initial oxidation product is mainly
monothioarsenate.

Chapter 7 Simultaneous Oxidation of Sulfide Minerals and Dissolution of Au in Alkaline Solutions 215
0
10
20
30
40
50
60
70
80
0 5 10 15 20 25
Time (hr)
[S2O
32-] (
mM
)
012345678910
[O2]
(ppm
)
O2 at 1400 rpm
S2O32- at 1400 rpm
S2O32- at 600 rpm
O2 at 600 rpm
Figure 7.20 Variations of the concentrations of thiosulfate and oxygen during the oxidation of arsenopyrite in 1.25 M NaOH solutions with different agitation speeds (pulp density =50 g l-1, 66 mg gold).
Figure 7.21 Potential of gold electrode and concentration of monothioarsenate during the oxidation of arsenopyrite in aerated 1.25 M NaOH solutions at two agitation speeds (pulp density =50 g l-1, 66 mg gold). () 1400 rpm; (◊) 600 rpm.

Chapter 7 Simultaneous Oxidation of Sulfide Minerals and Dissolution of Au in Alkaline Solutions 216
7.3.6 Effect of Pulp Density on the Dissolution of Arsenopyrite and Gold
For a given amount of sodium hydroxide, changes in the solids concentration
would lead to different concentrations of oxidation products which could influence the
dissolution of the gold. Figures 7.22 to 7.27 show the variation with time of the
dissolution rate of arsenopyrite, the concentrations of dissolved gold, thiosulfate and
monothioarsenate, the solution potentials, pH and dissolved oxygen during the oxidation
of arsenopyrite in aerated 1.25 M NaOH solutions at different pulp densities. Before the
experiment, different quantities of the arsenopyrite mineral were wet-milled together
with 60mg of gold powder and the same amount of NaOH was used for each experiment.
It can be seen that a lower solids concentration results in higher oxidation rates of
both arsenopyrite and gold. On the other hand, lower concentrations of thiosulfate and
monothioarsenate (Figure 7.24) are formed when a lower pulp density of arsenopyrite is
used. The potentials of the slurries (Figures 7.26 and 7.27) are between –0.7 V and 0.12
V. It appears that gold starts to dissolve at potentials above -0.1 V. These results are
rather unexpected and dissimilar to the behaviour of pyrite. Thus, if the concentration of
thiosulfate is lower at the lower pulp densities, then one could expect a lower rate of gold
dissolution. Perhaps other species involving arsenic, for example, monothioarsenate,
could be involved in the dissolution of gold in the case of arsenopyrite.

Chapter 7 Simultaneous Oxidation of Sulfide Minerals and Dissolution of Au in Alkaline Solutions 217
00.10.20.30.40.50.60.70.80.9
1
0 5 10 15 20 25
Time (hr)
Frac
tion
diss
olve
d
30 g l-1 FeAsS
50 g l-1 FeAsS
100 g l-1 FeAsS
Figure 7.22 Oxidation of arsenopyrite in aerated 1.25 M NaOH solutions at different pulp densities (60 mg gold).
02468
101214161820
0 5 10 15 20 25
Time (hr)
[Au]
(ppm
)
30 g l-1 FeAsS
50 g l-1 FeAsS
100 g l-1 FeAsS
Figure 7.23 Variation of the gold dissolved during the oxidation of arsenopyrite in aerated 1.25 M NaOH solutions at different pulp densities (60 mg gold).

Chapter 7 Simultaneous Oxidation of Sulfide Minerals and Dissolution of Au in Alkaline Solutions 218
Figure 7.24 Generation of thiosulfate and monothioarsenate during the oxidation of arsenopyrite in aerated 1.25 M NaOH solution at different pulp densities (60 mg gold). (◊) 30 g l-1 ; () 50 g l-1 ; (∆) 100 g l-1.
Figure 7.25 Variation of pH values and oxygen concentrations during the oxidation of arsenopyrite in aerated 1.25 M NaOH at different pulp densities (60 mg gold). (◊) 30 g l-1 ; () 50 g l-1 ; (∆) 100 g l-1.

Chapter 7 Simultaneous Oxidation of Sulfide Minerals and Dissolution of Au in Alkaline Solutions 219
Figure 7.25 shows the pH value and oxygen concentration of the pulp during the
oxidation at different pulp densities. As expected, the pH of the pulp decreases more
markedly with time at the higher pulp concentrations. The concentration of dissolved
oxygen decreases in the initial stage indicating relatively rapid initial oxidation rate of
arsenopyrite. During the later stages, the oxygen concentration increases to the saturated
value, suggesting that the oxidation rate of arsenopyrite has decreased substantially due
to either complete oxidation or depletion of the available alkali. From Figure 7.22 and
7.25, it can be seen that at the lowest pulp density the oxidation of arsenopyrite is
completed in 12 hours after which a higher concentration of oxygen is observed, whereas
at the highest pulp density the oxygen concentration is lower even during the later stages
of oxidation.
The potentials of the gold, platinum and arsenopyrite electrodes during the
oxidation of arsenopyrite with 30 g l-1 pulp density were also recorded as shown in
Figure 7.26. The difference between the potentials of the gold and platinum electrodes is
small, with the potential of gold slightly lower than that of platinum as could be expected
due to the dissolution of gold. The potential of arsenopyrite is, as expected in a mixed
potential system, also lower and increases with time in the range of –0.5 V to 0 V which
is in agreement with previous work on the anodic behaviour of arsenopyrite (Nicol and
Guresin, 2000 and 2003). Figure 7.27 compares the mixed potentials of gold and
arsenopyrite electrodes during oxidation at different pulp densities. It appears that the
potential of arsenopyrite during the later stage of oxidation at 30 g l-1 density is low,
suggesting a strong dependence of the mixed potential of arsenopyrite on the alkalinity
which is consistent with the studies by Nicol and Guresin (2000 and 2003).

Chapter 7 Simultaneous Oxidation of Sulfide Minerals and Dissolution of Au in Alkaline Solutions 220
-0.6
-0.5
-0.4
-0.3
-0.2
-0.1
0
0.1
0.2
0 5 10 15 20 25
Time (hr)
Pote
ntia
l (V
)
FeAsS
Au
Pt
Figure 7.26 Potentials of gold, platinum and arsenopyrite electrodes during the oxidation of arsenopyrite in aerated 1.25 M NaOH solutions (pulp densities = 30 g l-1).
-0.8-0.7-0.6-0.5-0.4-0.3-0.2-0.1
00.10.2
0 5 10 15 20 25
Time (hr)
Pote
ntia
l (V
)
30 g l-1 FeAsS
50 g l-1 FeAsS
100 g l-1 FeAsS
FeAsS
Au
Figure 7.27 Variation of potentials of gold (solid lines) and arsenopyrite (dashed lines) electrodes during the oxidation of arsenopyrite in aerated 1.25 M NaOH solutions at different pulp densities. (◊) 30 g l-1 ; () 50 g l-1 ; (∆) 100 g l-1.

Chapter 7 Simultaneous Oxidation of Sulfide Minerals and Dissolution of Au in Alkaline Solutions 221
It can also be seen from Figure 7.27 that the mixed potential of gold in the later
stage of the oxidation of arsenopyrite is lower at 30 g l-1 pulp density than at 100 g l-1
density whereas the dissolution of gold (Figure 7.23) is higher at 30 g l-1 pulp density
than at 100 g l-1 pulp density. Given the data shown in Figure 7.25, the unexpected
results could be due to a relatively strong dependence of the mixed potential of gold on
the alkalinity which agrees with the electrochemical studies regarding to the mixed
potentials of gold in alkaline thiosulfate solutions shown in Section 4.2.1 in Chapter 4,
and due to the effect of the concentration of dissolved oxygen on the rate.
7.3.7 Effect of Oxygen Partial Pressure
Since as suggested by the above results the dissolved oxygen concentration may
affect the rate of oxidation of both arsenopyrite and gold, the role of oxygen was
determined by using air, a mixture of air and oxygen gas, a mixture of nitrogen and
oxygen and pure oxygen at a flowrate of 1 l min-1 at 25 °C. The results of a series of tests
conducted at various partial pressures of oxygen are plotted in Figures 7.28 and 7.29. It is
clear that an increase in oxygen pressure favors the overall oxidation kinetics of both
arsenopyrite and gold.
It is also apparent that the dissolution rate of gold is characterized by an induction
period, followed by a rapid increase in the rate at higher oxygen partial pressures,
whereas at lowest oxygen pressure i.e. air, the extent of dissolution of gold shows an
approximately linear increase with time after a longer induction period. This
phenomenon can be understood by considering the variation of the thiosulfate
concentration during the oxidation at various oxygen partial pressures as shown in Figure

Chapter 7 Simultaneous Oxidation of Sulfide Minerals and Dissolution of Au in Alkaline Solutions 222
7.30. When higher oxygen pressures are employed, the thiosulfate concentration is
higher in the initial stage of the oxidation than when air is used, thus resulting in a higher
rate of dissolution of the gold. In support of this is the fact that when higher oxygen
pressures were used, the potential of the slurries increased from -0.6 V at the beginning
of the oxidation to about 0 V after 2 hours whereas the slurry potential reached the same
level only after 7 hours when air was used.
0
0.2
0.4
0.6
0.8
1
0 5 10 15 20 25 30
Time (hr)
Frac
tion
diss
olve
d Fe
AsS
101.3kPa
66.4kPa
50.7kPa
21.3kPa
Figure 7.28 Effect of oxygen partial pressure on the oxidation of arsenopyrite in 1.25 M NaOH solutions.
7.3.8 Effect of NaOH Concentration
Arsenopyrite requires hydroxyl ions for its oxidation (Equation 7.3). Thus, a
series of runs were conducted at various initial NaOH concentrations to determine the
effect of the NaOH concentration on the rate of oxidation of arsenopyrite and gold with
air. Figures 7.31, 7.32 and 7.33 give the results of these experiments.

Chapter 7 Simultaneous Oxidation of Sulfide Minerals and Dissolution of Au in Alkaline Solutions 223
0
0.05
0.1
0.15
0.2
0.25
0 5 10 15 20 25 30Time (hr)
Frac
tion
diss
olve
d go
ld
21.3 kPa
50.7 kPa
66.4 kPa101.3 kPa
Figure 7.29 Effect of oxygen partial pressure on gold dissolution during the oxidation of arsenopyrite in 1.25 M NaOH solutions.
0
20
40
60
80
100
0 5 10 15 20 25 30
Time (hr)
[S2O
3 2-
] (m
M)
101.3 kPa
66.4 kPa50.7 kPa21.3 kPa
Figure 7.30 Variation of thiosulfate formed during the oxidation of arsenopyrite in 1.25 M NaOH solutions at various oxygen partial pressures.

Chapter 7 Simultaneous Oxidation of Sulfide Minerals and Dissolution of Au in Alkaline Solutions 224
0
0.2
0.4
0.6
0.8
1
0 5 10 15 20 25
Time (hr)
Frac
tion
diss
olve
d Fe
AsS
2.08 M NaOH
1.25 M NaOH
0.625 M NaOH
Figure 7.31 Oxidation of arsenopyrite with air in solutions of different initial NaOH concentrations.
0
0.04
0.08
0.12
0.16
0.2
0 5 10 15 20 25
Time (hr)
Frac
tion
diss
olve
d go
ld
0.625 M NaOH
1.25 M NaOH
2.08 M NaOH
Figure 7.32 Dissolution rates of gold during the oxidation of arsenopyrite with air in different NaOH solutions.

Chapter 7 Simultaneous Oxidation of Sulfide Minerals and Dissolution of Au in Alkaline Solutions 225
Apparently, the extent of oxidation of arsenopyrite after 10 hours is greater when
a higher initial concentration of NaOH is employed. However, higher concentrations of
NaOH result in a slightly lower initial rate of oxidation of arsenopyrite, which may be
due to the decrease in oxygen solubility in solutions of high ionic strength (Narita et al.,
1983). In 0.625 M NaOH solution, 63% oxidation is achieved due to the lack of
sufficient NaOH for the complete oxidation of the arsenopyrite. Thus, the stoichiometric
requirement of NaOH for the oxidation of arsenopyrite by oxygen in these experiments is
about 30 grams assuming that Equation 7.3 applies, whereas in the experiment with
0.625 M NaOH solution the quantity of NaOH used is only 12.5 grams which is only
about 41% of the stoichiometric. In this comparison it should be noted that the oxidation
reaction given by Equation 7.3 cannot apply because of the apparent difference in the
extent of oxidation between that achieved (63%) and calculated (41%).
Figure 7.32 shows the significant effect of the initial NaOH concentration on the
dissolution of gold during oxidation of arsenopyrite. Again an induction period can be
observed. Gold starts to dissolve after 3 hours in 0.625 M and 1 M NaOH solutions and
later in 2.08 M NaOH solution. As before, this phenomenon can be attributed to the slow
formation of thiosulfate in the more concentrated NaOH solution as demonstrated in
Figure 7.33. It is worth noting that there is a significant effect of hydroxyl ions on the
dissolution rate of gold after 12 hours despite the fact that the concentrations of
thiosulfate in the different solutions are similar after 12 hours (about 70 mM). This
behaviour is in agreement with electrochemical studies of the dissolution of gold in
thiosulfate solutions in which the anodic reactivity of gold increased with an increase in
pH (Chapter 4).

Chapter 7 Simultaneous Oxidation of Sulfide Minerals and Dissolution of Au in Alkaline Solutions 226
0
20
40
60
80
0 5 10 15 20 25
Time (hr)
[S2O
3 2-] (
mM
) 0.625 M NaOH
1.25 M NaOH
2.08 M NaOH
Figure 7.33 Formation of thiosulfate during the oxidation of arsenopyrite with air in different NaOH solutions.
0
0.2
0.4
0.6
0.8
1
0 5 10 15 20 25 30
Time (hr)
Frac
tion
diss
olve
d Fe
AsS
55 °C
45 °C
35 °C25 °C
Figure 7.34 Oxidation of arsenopyrite in 1.25 M NaOH solutions with air at different temperatures (pulp density = 50 g l-1).

Chapter 7 Simultaneous Oxidation of Sulfide Minerals and Dissolution of Au in Alkaline Solutions 227
7.3.9 Effect of Temperature
Figure 7.34 shows the variation of the extent of oxidation of arsenopyrite with
time for temperatures from 25 °C to 55 °C. As expected, an increase in temperature
improved the kinetics of oxidation of arsenopyrite. Figure 7.35 shows the variation of
gold dissolved during the oxidation of arsenopyrite at different temperatures. In the
initial stages of oxidation, no obvious difference can be seen between the experiments at
increasing temperature. However, it is apparent that there is an optimum temperature of
about 35 °C at which the extent of gold dissolution appears to attain the highest value,
while at 55 °C gold appears to cease dissolution after 12 hours. The concentration of
thiosulfate, however, does not appear to vary with the increasing temperature (Figure
7.36). On the other hand, as shown in Figure 7.37 the dissolved oxygen concentration
decreases with an increase in temperature and this could account for the reduced rate at
the higher temperatures. Figure 7.38 shows that there is no apparent difference in the
mixed potential of the gold electrode at various temperatures but the potentials of gold
are higher than those of arsenopyrite as expected.
0
0.04
0.08
0.12
0.16
0 5 10 15 20 25 30
Time (hr)
Frac
tion
diss
olve
d go
ld
55 °C
25 °C
45 °C
35 °C
Figure 7.35 Dissolution rates of gold during the oxidation of arsenopyrite by air in 1.25 M NaOH solutions at different temperatures (pulp density = 50 g l-1).

Chapter 7 Simultaneous Oxidation of Sulfide Minerals and Dissolution of Au in Alkaline Solutions 228
0102030405060708090
0 5 10 15 20 25
Time (hr)
[S2O
3 2-] (
mM
)
25 °C
35 °C
45 °C
55 °C
Figure 7.36 Variation of thiosulfate concentration during the oxidation of arsenopyrite in aerated 1.25 M NaOH solutions at different temperatures (pulp density = 50 g l-1).
0
2
4
6
8
10
0 5 10 15 20 25 30
Time (hr)
[O2]
(ppm
)
25 °C
35 °C
45 °C55 °C
Figure 7.37 Variation of oxygen concentration during the oxidation of arsenopyrite by air in 1.25 M NaOH solutions at different temperatures (pulp density = 50 g l-1).

Chapter 7 Simultaneous Oxidation of Sulfide Minerals and Dissolution of Au in Alkaline Solutions 229
Figure 7.38 Mixed potentials of gold and arsenopyrite electrodes during the oxidation of arsenopyrite by air in 1.25 M NaOH solutions at different temperatures.
7.3.10 Effect of the Addition of Thiosulfate or Sulfur
The above experimental results have suggested that thiosulfate could be the
lixiviant of gold. Thus addition of thiosulfate to the reacting pulp could be expected to
have a positive effect on gold dissolution during oxidation. It is possible that the addition
of elemental sulfur could also have an effect on the rate of dissolution of gold. Therefore,
three experiments were carried out in which arsenopyrite was oxidized in aerated 1.25 M
NaOH solution in the presence or absence of 0.05 M added thiosulfate, and in the
presence of 0.1 g elemental sulfur. It should be pointed out that the arsenopyrite sample
used in these tests contained 0.174% Cu and that the elemental sulfur was wet-milled
together with the mineral and gold powder.

Chapter 7 Simultaneous Oxidation of Sulfide Minerals and Dissolution of Au in Alkaline Solutions 230
00.10.20.30.40.50.60.70.80.9
1
0 5 10 15 20 25
Time (hr)
Frac
tion
diss
olve
d Fe
AsS
with S2O32- addition
with S0 addition
with no addition
Figure 7.39 Oxidation of arsenopyrite in 1.25 M NaOH solution in the presence and absence of 0.05 M thiosulfate, and in the presence of 0.1 g sulfur.
0
5
10
15
20
25
30
0 5 10 15 20 25
Time (hr)
[Au]
, [C
u] (p
pm)
with S2O32- addition
with S0 addition
with no addition
Figure 7.40 Concentrations of gold (solid lines) and copper (dotted lines) during the oxidation of arsenopyrite with 0.1 g sulfur (∆), with (ο) and without (◊) 0.05 M thiosulfate in 1.25 M NaOH solutions.

Chapter 7 Simultaneous Oxidation of Sulfide Minerals and Dissolution of Au in Alkaline Solutions 231
0
0.02
0.04
0.06
0.08
0.1
0.12
0.14
0.16
0 5 10 15 20 25
Time (hr)
[S2O
3 2-] (
M)
with S2O32- addition
with S0 addition
with no addition
Figure 7.41 Effect of the addition of thiosulfate or elemental sulfur on the concentration of thiosulfate during the oxidation of arsenopyrite in aerated 1.25 M NaOH solutions.
The main experimental results are shown in Figures 7.39, 7.40 and 7.41. It can be
seen that the extent and rate of oxidation of arsenopyrite is not changed when 0.05 M
thiosulfate is initially added into 1.25 M NaOH solution. However, the dissolution of
both gold and copper are improved in the presence of higher concentrations of thiosulfate
as shown in Figure 7.40. Figure 7.41 suggests that oxidation rate of thiosulfate with air is
rather slow because the difference of the concentrations of thiosulfate at the same
reaction time during the two experiments is nearly constant. It is worth noting the
dissolution of copper which is probably due to complexation of copper ions with
thiosulfate ions. As found and reported in Chapter 5, the dissolved copper can catalyze
the dissolution of gold in thiosulfate solutions.
It has been shown in Section 7.3.1 that small amounts of elemental sulfur may be
formed during the alkaline oxidation of pyrite. It was suspected that sulfur could play a

Chapter 7 Simultaneous Oxidation of Sulfide Minerals and Dissolution of Au in Alkaline Solutions 232
role in the dissolution of gold in alkaline solutions. Figures 7.40 and 7.41 clearly
demonstrate that addition of milled sulfur has increased the dissolution of gold and
copper without increasing the concentration of thiosulfate. This observation implies that
the sulfur could have reacted with gold and copper during milling, resulting in more
rapid dissolution of gold and copper in the thiosulfate solution. Thus, additional
experiments were carried out in which 50 mg gold fine powder was first wet-milled with
0.1 grams of elemental sulfur in a porcelain ball mill for 1 hour before being leached in
the presence and absence of added thiosulfate. The results are shown in Table 7.4.
Table 7.4 Dissolution of gold in oxygenated alkaline NaOH solutions after milling with elemental sulfur (600 ml solution, pH 12, 25 °C, 0.1 g sulfur)
With no addition of S2O3
2- With 0.1 M S2O32- Time
(hr) [Au] /ppm [S2O32-] /mM [SO3
2-] /mM [Au] /ppm [S2O32-] /mM
16 0.00 0.2 0.2 - 100 19 0.00 - - 0.12 100 30 0.00 - - 0.31 100 48 0.00 0.6 0.3 0.64 100
Obviously, no dissolution of gold is detected without the addition of thiosulfate
even after the gold is wet-milled with sulfur. Oxidation of the elemental sulfur is
obviously very slow at room temperatures as shown by the low concentrations of
thiosulfate and sulfite formed. As expected, sulfide ions were not detected by ion
chromatographic analysis. However, dissolution of gold does occur to some extent in the
0.1 M thiosulfate solution when the gold is wet-milled with sulfur followed by oxidation
with oxygen. Therefore, it is believed that the dissolution of gold during the oxidation of
pyrite and arsenopyrite is due to its reaction with thiosulfate.

Chapter 7 Simultaneous Oxidation of Sulfide Minerals and Dissolution of Au in Alkaline Solutions 233
7.3.11 Reactions between Arsenite and Sulfur Species
The above studies have shown that thioarsenates are important products of the
oxidation of arsenopyrite with air under ambient temperatures and pressures. To better
understand the dissolution mechanism of arsenopyrite, reactions between arsenite and
sulfur species such as thiosulfate and polysulfides were studied by using ion
chromatographic analysis to determine the species present in various solutions. The
experiments were carried out by mixing arsenite solutions with thiosulfate solutions or
polysulfide solutions to form a solution containing 2 mM AsO33-, 2 mM S2O3
2-, 10 mM
NaOH or a solution of 2 mM AsO33-, 2 mM polysulfides, 10 mM NaOH. The polysulfide
solution was prepared by dissolving equimolar amounts of elemental sulfur and base (as
sodium hydroxide) solution with heating. Thus the polysulfide solution was a mixture
containing Sn2- (n ≥ 2), S2O3
2- and SO32- with S2
2- probably predominant. The analysis of
2 mM polysulfide solution by HPLC indicated the presence of 0.64 mM S2O32- and 0.26
mM SO32-. After mixing, the solutions were analyzed using HPLC for various species at
various times. The results are given in Table 7.5.
Table 7.5 clearly shows that the reaction between arsenite and thiosulfate is very
slow at room temperatures. It appears that thiosulfate is formed after 4 days in the case of
mixing arsenite with polysulfides and the dithioarsenate concentration decreases with
time after its formation, implying that thiosulfate could be produced by the
decomposition of dithioarsenate. The concentration of monothioarsenate appears to
remain constant, suggesting a possible slow rate of monothioarsenate decomposition. An
additional experiment (results not shown) on the oxidation of monothioarsenate with
oxygen in an aqueous solution of pH 12 indicated that the concentration of
monothioarsenate remained essentially constant over 24 hours, suggesting a very slow

Chapter 7 Simultaneous Oxidation of Sulfide Minerals and Dissolution of Au in Alkaline Solutions 234
oxidation of monothioarsenate. The formation of thiosulfate, therefore, could probably
be attributed to the formation and decomposition of dithioarsenates.
Table 7.5 Concentrations of the various species formed in the reactions of arsenite with sulfur species at 25 °C (Units: mM)
Time 0 hour 0.5 hour 4 days 8 days 6 months
AsO33- 2.1 1.57 0.73 0.49 0
AsO3S3- 0 0.08 0.45 0.34 0.45 SO3
2- 0.26 0.60 1.00 1.09 0.72 S2O3
2- 0.54 0.54 0.54 0.75 1.18 AsO2S2
3- 0 0.35 * 0.07 0 AsO4
3- 0 # # # 1.78
Reaction of AsO3
3- with Sn
2-, n ≥ 2
SO42- 0 # # # 0.88
AsO33- 2.1 * 2.10 2.04 1.98
S2O32- 2.1 * 2.10 1.90 2.10
AsO3S3- 0 # # # #
Reaction of AsO3
3-
with S2O3
2- SO32- 0 # # # #
* Not Determined; # Not Measurable.
7.4 Discussion
7.4.1 Chemistry of the Oxidation of Pyrite
Experimental results have shown that thiosulfate, sulfite and small amounts of
elemental sulfur are formed during the alkaline oxidation of pyrite by oxygen or air at
ambient temperatures and pressures, which are in agreement with the results reported by
Goldhaber (1983), Mishra and Osseo-Asare (1988) and Hamilton and Woods (1981). An

Chapter 7 Simultaneous Oxidation of Sulfide Minerals and Dissolution of Au in Alkaline Solutions 235
approximate stoichiometry of the overall process of pyrite oxidation in alkaline solutions
with air is given by the following reaction:
12FeS2 + 11O2 + 32NaOH + 2H2O = 12Fe(OH)3 + 8Na2S2O3 + 8Na2SO3 (7.4)
This is based mainly on the results (Figure 7.4) which show that in the initial stages of
the oxidation, the atomic molar ratio of thiosulfate to total dissolved sulfur is about 2/3
and that of sulfite to total dissolved sulfur is about 1/3. Sulfate is believed to be formed
as a product of the oxidation of sulfite by oxygen. Small amounts of polythionates
(SnO62-, n = 3-5) as the oxidation products of thiosulfate could also be formed during the
oxidation of pyrite in alkaline media as reported by Goldhaber (1983) and Xu and
Schoonen (1995), although analysis for these species was not carried out in this study.
However, the concentrations of polythionates in strongly alkaline solutions are well
known to be low due to decomposition to thiosulfate and sulfite (Rolia and Chakrabarti,
1982).
As found by Goldhaber (1983), sulfide and polysulfides were not detected in the
reacting solutions. The small amounts of sulfur found in this study probably resulted
from the oxidation of sulfide or polysulfides with oxygen (Equation 2.49; Figure 2.2)
under alkaline conditions as suggested by Chen and Morris (1972) and Goldhaber
(1983).
7.4.2 Chemistry of the Oxidation of Arsenopyrite
7.4.2.1 Speciation of arsenic and sulfur
The results of Figure 7.7 have confirmed that the alkaline oxidation of
arsenopyrite at ambient temperatures and pressures is stoichiometric in regard to the

Chapter 7 Simultaneous Oxidation of Sulfide Minerals and Dissolution of Au in Alkaline Solutions 236
constituent elements of the mineral. There appears to be no formation of any
intermediate sulfide-containing solid phase as suggested by Sanchez and Hiskey (1991)
and Wang et al. (1992). The measured pulp potentials during the alkaline oxidation are in
the range of -0.6 to 0.2 V (Figure 7.13), which is in agreement with the thermodynamic
values (Figure 2.10 in Section 2.4.2.2) and the electrochemical measurements carried out
by Nicol and Guresin (2000 and 2003), and corresponds to the initial oxidation step of
arsenopyrite in alkaline solutions as suggested by Sanchez and Hiskey (1991) and Nicol
and Guresin (2003). Thus, arsenic and sulfur species of low oxidation states would be
formed.
However, ion chromatographic and chemical analyses in this study have shown
that the arsenic and sulfur species formed as oxidation products of arsenopyrite, are very
different from those suggested by most of the previous studies (Sanchez and Hiskey,
1991; Rossovsky, 1993; Wang et al., 1992; Nicol and Guresin, 2003). Thioarsenites as
proposed by Rossovsky (1993) and elemental sulfur as suggested by Sanchez and Hiskey
(1991) were not detected in this study. Figures 7.8, 7.9 and 7.14 clearly show that a new
species, namely, monothioarsenate is one of the prominent products of the oxidation of
arsenopyrite by oxygen in aqueous alkaline solutions. Furthermore, dithioarsenate as a
minor ion has also been identified during the oxidation. Similar to the oxidation of pyrite,
sulfide or polysulfides were not detected by either HPLC analysis or qualitative tests for
sulfide ions in solution, which is not unexpected because of the presence of significant
amounts of iron in an oxidizing environment and due to the rapid oxidation of sulfide
and polysulfides to sulfite or thiosulfate (Chen and Morris, 1972). The absence of
elemental sulfur in oxidized residues appears to be consistent with the thermodynamics
of the oxidation of arsenopyrite as shown in the Eh-pH diagram (Figure 2.9) which
shows that elemental sulfur would not be formed at pH values higher than 8. As will be
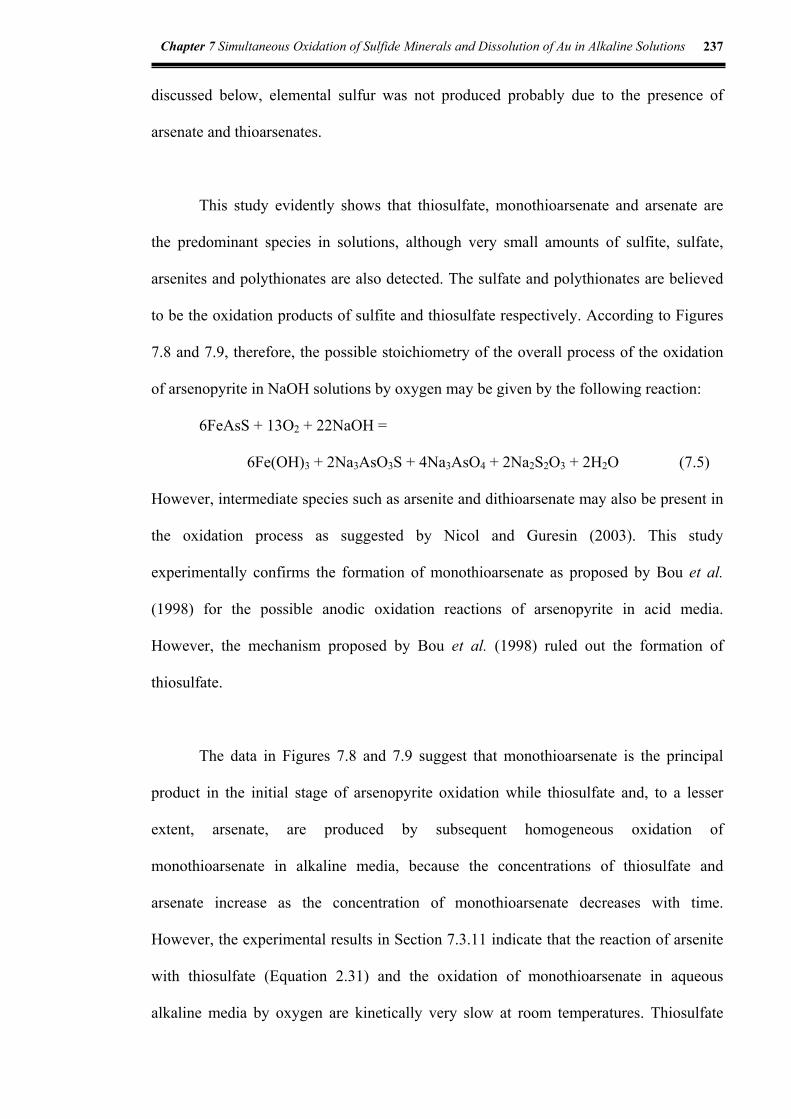
Chapter 7 Simultaneous Oxidation of Sulfide Minerals and Dissolution of Au in Alkaline Solutions 237
discussed below, elemental sulfur was not produced probably due to the presence of
arsenate and thioarsenates.
This study evidently shows that thiosulfate, monothioarsenate and arsenate are
the predominant species in solutions, although very small amounts of sulfite, sulfate,
arsenites and polythionates are also detected. The sulfate and polythionates are believed
to be the oxidation products of sulfite and thiosulfate respectively. According to Figures
7.8 and 7.9, therefore, the possible stoichiometry of the overall process of the oxidation
of arsenopyrite in NaOH solutions by oxygen may be given by the following reaction:
6FeAsS + 13O2 + 22NaOH =
6Fe(OH)3 + 2Na3AsO3S + 4Na3AsO4 + 2Na2S2O3 + 2H2O (7.5)
However, intermediate species such as arsenite and dithioarsenate may also be present in
the oxidation process as suggested by Nicol and Guresin (2003). This study
experimentally confirms the formation of monothioarsenate as proposed by Bou et al.
(1998) for the possible anodic oxidation reactions of arsenopyrite in acid media.
However, the mechanism proposed by Bou et al. (1998) ruled out the formation of
thiosulfate.
The data in Figures 7.8 and 7.9 suggest that monothioarsenate is the principal
product in the initial stage of arsenopyrite oxidation while thiosulfate and, to a lesser
extent, arsenate, are produced by subsequent homogeneous oxidation of
monothioarsenate in alkaline media, because the concentrations of thiosulfate and
arsenate increase as the concentration of monothioarsenate decreases with time.
However, the experimental results in Section 7.3.11 indicate that the reaction of arsenite
with thiosulfate (Equation 2.31) and the oxidation of monothioarsenate in aqueous
alkaline media by oxygen are kinetically very slow at room temperatures. Thiosulfate

Chapter 7 Simultaneous Oxidation of Sulfide Minerals and Dissolution of Au in Alkaline Solutions 238
probably comes from the decomposition and/or oxidation of dithioarsenates which could
be formed either from the reactions of arsenite with polysulfides (Equations 7.6 and 7.7;
Mellor, 1929) or from the reaction of monothioarsenate with polysulfides (Equation 7.8).
AsO33- + S2
2- = AsO3S3- + S2- (7.6)
AsO33- + S2
2- + H2O = AsO2S23- + 2OH- (7.7)
AsO3S3- + S22- + O2 = AsO2S2
3- + SO32- (7.8)
Schwedt and Rieckhoff (1996) have reported that dithioarsenate is not stable in alkaline
media. The possible reaction for the formation of thiosulfate from dithioarsenate could
be:
AsO2S23- + 2O2 + 2OH- = S2O3
2- + AsO43- + H2O (7.9)
in which arsenate is also produced. The rate of oxidation of dithioarsenate may be fast in
the presence of oxygen. Thus, the formation of dithioarsenate may be important for the
production of thiosulfate and this also suggests the possible presence of polysulfides or
sulfur as intermediates on the surface of oxidized arsenopyrite particles.
Although polysulfides were not detected in aqueous solutions or solid residues in
present work, Nesbitt and coworkers (1995) have reported, by using x-ray photoelectron
and auger electron spectroscopy techniques, that reaction of arsenopyrite with air-
saturated water produces polysulfides and thiosulfate on the surface of the reacted
mineral, all primarily at the expense of disulfide (S22-). In this case, the disulfide S2
2- ion
should be represented more accurately as a dianionic group, (AsS)2-. They have also
reported that on an unoxidized surface of arsenopyrite (Fe2+(AsS)2-), sulfur is present as
disulfide (S22-, 78 atomic%), monosulfide (S2-, 15%), and as polysulfides (Sn
2-, 7%)
while arsenic is predominantly present as As(-1) with 15% present as As(0). Buckley and
Walker (1988) have reported that most of arsenic has an oxidation state of three rather
than five in air-saturated alkaline solution and that sulfur also occurs on a reacted surface

Chapter 7 Simultaneous Oxidation of Sulfide Minerals and Dissolution of Au in Alkaline Solutions 239
of arsenopyrite. Therefore, reactions 7.6 and 7.7 could occur on the surface of
arsenopyrite in aerated alkaline solutions. Figures 7.8 and 7.9 show that in the early stage
of oxidation about 60-70% (by atom) of AsO3S3-, 10% S2O32- and 15% SO3
2- (probably
from the oxidation of S2-, Equation 7.10) are formed. The ratios of these species suggest
that the monothioarsenate ion could have its origins in the (AsS)2- group and that
thiosulfate is produced from polysulfides with dithioarsenate being the intermediate. On
the other hand, the sulfite could react with polysulfides, thus forming thiosulfate as
described in Equation 7.11.
2S2- + 3O2 = 2SO32- (7.10)
SO32- + S2
2- = S2O32- + S2- ∆G˚298K = -23.8 kJ mol-1 (7.11)
It is apparent that the oxidation of arsenopyrite in alkaline media is a complex process
that involves many possible reactions such as the simultaneous dissolution and oxidation
of arsenic and sulfur and the oxidation, hydrolysis and precipitation of iron. The actual
reaction mechanism is not completely understood and should be further investigated.
7.4.2.2 Products of oxidation of iron
One important feature of the oxidation of iron-bearing sulfides in alkaline media
is the precipitation of hydrated iron oxide compounds on the surface of the reacting
mineral. The oxide often forms a coating whose properties depend on the experimental
conditions as well as on the texture of the parent phase (Caldeira et al., 2003; Burkin and
Edwards, 1963). The characteristics of the oxide coating determine the rate of mass
transfer through the layer and, thus, the overall rate of decomposition of the minerals
(Ciminelli and Osseo-Asare, 1986 and 1995a, b; Burkin and Edwards, 1963; Kostina and
Chernyak, 1979). Examination of an almost completely oxidized residue of arsenopyrite
by SEM (Figure 7.10) and chemical analyses, and an optical microscopic analysis of an
Chapter 7 Simultaneous Oxidation of Sulfide Minerals and Dissolution of Au in Alkaline Solutions 240
arsenopyrite electrode (Figure 7.11) have confirmed the formation of an amorphous
porous iron oxide (such as ferrihydrite) or hydroxide (such as FeOOH) on the surface of
arsenopyrite mineral (Koslides and Ciminelli, 1992; Hiskey and Sanchez, 1995 and
Bhakta et al., 1989). In addition, small amounts of iron arsenate were detected in the
oxidized residue, probably as FeAsO4.
An interesting and unexpected feature found in this study is the dissolution of
iron in alkaline solutions during the oxidation of arsenopyrite at pH values below 11
(Figure 7.12). Table 7.2 has confirmed the dissolution of ferric ions in alkaline solutions
containing arsenate or monothioarsenate. This is unexpected because ferric ions usually
precipitate as ferric hydroxides or iron arsenates under alkaline conditions (Robins, 1987;
Krause and Ettel, 1989). In fact, the work of Krause and Ettel (1989) on the solubility of
synthetic scorodite (FeAsO4·2H2O) at room temperatures has showed that the dissolution
of iron and arsenic increases significantly with increasing pH above pH 5, with the iron
concentration being 52 ppm at pH 7.92. However, the mechanism of iron dissolution in
alkaline arsenic bearing solutions is not known. From the Table 7.2, it is possible that
ferric ions react with arsenate or monothioarsenate forming metastable species. This
feature of iron dissolution may assist with the further decomposition of arsenopyrite
under certain conditions such as the catalytic role of the Fe(III)/Fe(II) couple in acid
media for the oxidation of arsenopyrite (Ruitenberg et al., 1999; Nicol and Lazaro,
2002). In this case, the dissolved metastable species of iron in alkaline arsenic solutions
may act as catalysts for the oxidation of arsenopyrite by oxygen. Further studies of this
aspect should be made.

Chapter 7 Simultaneous Oxidation of Sulfide Minerals and Dissolution of Au in Alkaline Solutions 241
7.4.3 Kinetics of the Oxidation of Arsenopyrite
The primary objective of this study was to investigate the chemistry and kinetics
of the dissolution of gold. However, as gold dissolves simultaneously during the alkaline
oxidation of arsenopyrite with oxygen, it is important to also establish the kinetics (and,
if possible) the mechanism of the oxidation of the mineral. As an introduction, the
general concepts of heterogeneous reaction kinetics and its relevance to this work are
briefly summarized.
Heterogeneous reactions are reactions that occur at the interfaces of two or more
phases in a system. Hydrometallurgical processes often involve heterogeneous reactions
which take place between a solid phase and a solute in an aqueous solution. Some
processes can involve three phases such as gold cyanidation and pressure oxidation of
sulfides in which the gas phase is also implicated. These reactions usually contain the
following major steps (Marsden and House, 1992):
(1) Mass transport of gaseous reactants (where relevant) into the solution phase
and subsequent dissolution;
(2) Mass transport of reacting species through the solution/solid boundary layer,
to the solid surface;
(3) Chemical (or electrochemical) reaction at the solid surface, including
adsorption and desorption at the solid surface;
(4) Mass transport of produced species through the boundary layer into bulk
solution.
The rate-limiting step for a sequential reaction path is determined by the slowest
step in the sequence. If this slow step is mass transfer, the reaction is said to be diffusion

Chapter 7 Simultaneous Oxidation of Sulfide Minerals and Dissolution of Au in Alkaline Solutions 242
controlled. In contrast, when the slow step is a chemical (or electrochemical) reaction at
the surface of the solid, the rate is referred to as being chemically controlled. The rate
determining step may change for a reaction if conditions change: for example, if a
reactant concentration is increased, a reaction may change from mass transport to
chemically controlled as more reagent is available to be transported to the reaction
surface. For chemically controlled reactions the Arrhenius activation energy (Ea) is
large, typically greater than 40 kJ mol-1, while for mass transport controlled reactions Ea
is small, between 5 and 20 kJ mol-1 (Marsden and House, 1992).
In heterogeneous solid-liquid reaction systems, rates of reactions are often
proportional to both the total surface area of the solid and the concentrations of reacting
species. For reaction between a solid, B, and a solute, A as described in the following
simplified reaction:
bB (s) + A (aq) → B----A (products) (7.12)
the rate of reaction may be defined by the general expression
dNB/dt = - S b k0 k’ [A] m (7.13)
where dNB/dt is the rate of reaction in moles per unit time, S is the solid surface area, b is
the stoichiometric number of moles of the solid reacting with one mole of the solute, [A]
is the solution concentration of the solute, k’ is the rate constant, k0 is the concentration
of reactive surface sites (in moles per unit area) and m is the reaction order with respect
to [A]. Based on this general expression, various kinetic models for heterogeneous solid-
liquid reactions have been developed, including shrinking sphere and shrinking core
models for various solid geometries (Levenspiel, 1999).
In this study the oxidation of arsenopyrite was carried out at high pulp densities
and the concentrations of NaOH and oxygen were not constant during the experiments

Chapter 7 Simultaneous Oxidation of Sulfide Minerals and Dissolution of Au in Alkaline Solutions 243
(see Figures 7.13, 7.20 and 7.37). In addition, iron oxide layers are formed on the
reacting mineral surface and thus the simple kinetic models for heterogeneous solid-
liquid reactions are not applicable to the present study. For this reason, initial reaction
theory is utilized below in an attempt to derive rate equations for the oxidation reactions.
7.4.3.1 Initial reaction orders
The initial rate of arsenopyrite oxidation in NaOH solutions can be described by
an expression of the following type:
- (1/S) dN/dt = b k [O2] m [OH-] n (7.14)
where S is the total interfacial area of arsenopyrite particles, m2; dN/dt is the number of
moles of arsenopyrite reacted per unit time, mol s-1; b is the stoichiometric number of
moles of arsenopyrite reacting with one mole of oxygen; k is the apparent rate constant;
[O2] is the concentration of dissolved O2 , mol l-1; [OH-] is the concentration of hydroxyl
ion, mol l-1; m and n are the reaction orders for oxygen and hydroxyl ion respectively.
The fraction (X) of arsenopyrite reacted at time t, is given by the following
equation
X = 1- N/N0 (7.15)
where N and N0 are the respective numbers of moles of arsenopyrite present at time t and
t = 0 . By differentiating Equation 7.15 and combining with Equation 7.14, one obtains
dX/dt = S b k [O2] m [OH-] n / N0 (7.16)
The partial pressure of oxygen Po2 can be used to substitute for oxygen
concentration in the above rate expression, since Henry’s law (Pray et al., 1952) i.e. [O2]

Chapter 7 Simultaneous Oxidation of Sulfide Minerals and Dissolution of Au in Alkaline Solutions 244
= Kh-1 Po2 (Kh = Henry law constant) applies at fixed ionic strength and temperature
(Narita et al., 1983). Thus, the initial rate of arsenopyrite oxidation becomes
R0 = dX/dt = S b k Kh-m Po2 m [OH-] n / N0 (7.17)
A plot of the logarithm of R0 at t = 0 versus the logarithm of the partial pressure of
oxygen, when other variables remain constant, would result in a straight line with slope
m, the reaction order with respect to oxygen partial pressure. R0 in this case is the
derivative at time zero, (dX/dt)t = 0 . This can conveniently be obtained by fitting a
polynomial equation to the data of the reacted fraction (X) versus time (t). Third or
fourth order (degree) polynomial regression using Excel program was performed to
obtain the best fit parameters to the experimental data.
Therefore, based on initial reaction rates from Figure 7.28, Figure 7.42 was
obtained which shows that the resulting straight line (correlation coefficient = 0.99) at
low oxygen pressures has a slope of 1 while at high oxygen pressures the slope of the
straight line is near zero. This result indicates that the oxidation reaction of pure
arsenopyrite in NaOH solutions at low pressures is first order in oxygen whereas at high
pressures oxygen has a negligible effect on the rate. It should be emphasized that the
number of experimental points on which this conclusion is based is rather small.
The reaction order of zero found at higher oxygen partial pressures (> 66 kPa)
agrees with the results of Koslides and Ciminelli (1992) who reported that the rate of
alkaline oxidation of arsenopyrite is almost independent of oxygen partial pressure in the
range of 132.7-1061.6 kPa. They suggested a possible Langmuir-type adsorption reaction
occurring on the surface of arsenopyrite. The approximate first order dependence of
arsenopyrite oxidation in alkaline media on O2 for partial pressures less than 1
atmosphere has not been found in the literature, although Papangelakis and Demopoulos

Chapter 7 Simultaneous Oxidation of Sulfide Minerals and Dissolution of Au in Alkaline Solutions 245
(1990) reported a first order dependence of arsenopyrite oxidation on oxygen partial
pressure in the range of 2 to 10 atmospheres in acid solutions. Similar results for the
oxidation of pyrite by oxygen in aqueous solutions were found in some studies
(Ciminelli and Osseo-Asare, 1995a, b; Lawson, 1982; Goldhaber, 1983). Goldhaber
(1983) suggested that the first order dependence on O2 at low Po2 for pyrite oxidation is
actually a pseudo-first order dependence which breaks down at higher Po2. He further
pointed out that the rate of pyrite oxidation could not be limited by an adsorption
process. Accordingly, the behaviour of the oxidation rate of arsenopyrite with respect to
oxygen in alkaline solutions may not necessarily suggest an adsorption-controlling
mechanism.
-2.5
-2
-1.5
-1
-0.5
0
2.5 3 3.5 4 4.5 5 5.5
lnPo2 (kPa)
lnR
0 (hr
-1)
slope = 1.06
slope = 0
Figure 7.42 Effect of oxygen partial pressure on the initial rate of arsenopyrite oxidation (Data from Figure 7.28).
Using the polynomial regression method, initial rates calculated from Figure 7.17
are inversely proportional to the initial particle size, d0 , considered here as the average of
the screen apertures used, as shown in Figure 7.43. An inverse first order relationship

Chapter 7 Simultaneous Oxidation of Sulfide Minerals and Dissolution of Au in Alkaline Solutions 246
characterizes reactions controlled by either mass transfer in the liquid phase or by
chemical reaction (Levenspiel, 1999). If the reaction were limited by diffusion in the
solid product, i.e., the iron oxide coating, an inverse relationship between initial rate and
the square of the particle size would be expected.
-5
-4.5
-4
-3.5
-3
-2.5
-2
-1.5
-1
1 1.5 2 2.5 3 3.5 4 4.5
lnd0
lnR
0
slope = -1.0
Figure 7.43 Logarithms of initial rates versus logarithms of average particle sizes (Data from Figure 7.17).
The apparent activation energy for arsenopyrite oxidation by air in alkaline media
can be described using the Arrhenius equation:
k = A exp-Ea/(RT) (7.18)
where k is the apparent rate constant; A is a pre-exponential factor; T is the absolute
temperature (K); Ea is the apparent activity energy (J mol-1); R is the universal gas
constant.

Chapter 7 Simultaneous Oxidation of Sulfide Minerals and Dissolution of Au in Alkaline Solutions 247
At a given temperature T and NaOH concentration [OH-], the oxygen
concentration [O2]T as a function of temperature can be calculated from the expression
proposed by Narita et al. (1983):
[O2]T = ([O2]298K) exp(1336T-1- 4.48) (7.19)
As the temperature increases, the actual concentration of dissolved oxygen in solution
decreases. By substituting the oxygen concentration in Equation 7.16 with Equation 7.19
and m = 1 (first order), and substituting k with Equation 7.18, one obtains
R0 = dX/dt = (SA/N0) ([O2]298K [OH-]n) exp1336T -1- 4.48 -Ea/(RT) (7.20)
Taking the logarithms of both sides of Equation 7.20 and rearranging it, one gets
LnR0 -1336T -1 = B-Ea/(RT) (7.21)
where B = ln(SA[O2]298K [OH-]n /N0) - 4.48
-6.6-6.5-6.4-6.3-6.2-6.1
-6-5.9-5.8-5.7-5.6
3 3.05 3.1 3.15 3.2 3.25 3.3 3.35 3.4
T -1 x 10³ (K -1)
lnR
0-13
36 T
-1
Slope = - Ea R-1 = -1.897Ea = 15.8 kJ mol-1
Figure 7.44 Arrhenius plot for the oxidation of arsenopyrite (Data from Figure7.34).
Thus, with the initial rates R0 calculated as above using data in Figure 7.34, a plot
of lnR0-1336T-1 versus T-1 was constructed as shown in Figure 7.44, from which an

Chapter 7 Simultaneous Oxidation of Sulfide Minerals and Dissolution of Au in Alkaline Solutions 248
activation energy of 15.8 kJ mol-1 can be calculated. This value is very similar to that of
15.1 kJ mol-1 obtained by Koslides and Ciminelli (1992), slightly lower than those
reported by Bhakta et al. (1989) and Taylor and Amoah-Forson (1987) who quoted
values of 20.3 kJ mol-1 and 23.8 kJ mol-1 respectively. This magnitude of the activation
energy is typical of reactions under diffusion control, suggesting that mass transfer of
reactants may be the rate-controlling step. Considering the effects of particle size and
stirring, mass transport of oxygen could control the oxidation rate of arsenopyrite at low
oxygen partial pressures.
If the rate of arsenopyrite oxidation is controlled by mass transfer of oxygen to
the mineral, the actual mass transfer coefficient of oxygen calculated from the present
study should be comparable with that which can be estimated from the semi-theoretical
correlation for freely falling spherical particles suspended in a stirred reactor
(Wadsworth and Miller, 1979). Calculation of the actual mass transfer coefficient of
oxygen can be made as follows.
Figure 7.17 has shown that the dissolution rate of arsenopyrite for particles of
+38-45 µm is approximately constant. For the small extent of reaction in this case the
concentrations of O2 and OH- during the experiment may be assumed to be constant. For
a reaction controlled by diffusion of oxygen through a liquid boundary film, Equation
7.14 becomes
- (1/S) dN/dt = b km [O2] = constant (7.22)
km is the mass transfer coefficient of oxygen. Using Equation 7.15, one obtains
dX/dt = S b km [O2]/N0 (7.23)
For spherical particles of radius r , N0 = 4π r03 ρ/3 M and S = 4π r2 .Thus,
dX/dt = (3 b M r2/r03 ρ) km [O2] (7.24)

Chapter 7 Simultaneous Oxidation of Sulfide Minerals and Dissolution of Au in Alkaline Solutions 249
At time t = 0,
(dX/dt)t = 0 = (3 b M/r0 ρ) km [O2] (7.25)
where r0 is the radius of arsenopyrite particles at time t = 0; M, ρ are the molar mass and
specific density of arsenopyrite respectively. Some electrochemical studies (Nicol and
Guresin, 2003; Sanchez and Hiskey, 1991; Beattie and Poling, 1987; Kostina and
Chernyak, 1976) have suggested the electrochemical nature of the oxidation of
arsenopyrite in aerated and oxygenated alkaline solutions. Thus, the anodic oxidation of
arsenopyrite is assumed to be
FeAsS + 19OH- = Fe(OH)3 + AsO43- + SO4
2- + 8H2O + 14e- (7.26)
The cathodic reduction of oxygen in alkaline solutions may be (Nicol and Guresin, 2003)
O2 + 2H2O + 2e- = H2O2 + 2OH- (7.27)
On this basis, the stoichiometric number b would be 2/14 or 1/7. The concentration of
dissolved oxygen in aerated 1.25 M NaOH solution ([OH-] = 1.25 M) at 25 °C can be
estimated according to Narita et al. (1983) (also see below):
[O2] = 0.21 × 3.12 × 10-5 × 40.2 × exp(-0.433[OH-]), mol l-1 (7.28)
For the experiment using particles of +38-45 µm size with average diameter of 42 µm,
(dX/dt)t = 0 can be calculated to be about 2.0 × 10⁻² hr-1 or 5.5 × 10⁻⁶ s-1. For M = 162.83 g
mol-1 and ρ = 6.0 g cm-3, the calculated mass transfer coefficient km
km = (dX/dt) t = 0 (r0 ρ)/ (3 b M [O2]) = 6.5 × 10⁻³ cm s-1 (7.29)
This calculated mass transfer coefficient for oxygen is comparable to the minimum mass
transfer coefficient k* estimated to be about 10.6 × 10⁻³ cm s-1 (See Appendix A3 and
refer to Wadsworth and Miller, 1979). However, the stoichiometric number b, according
to Equation 7.5, is 6/13 which is larger than 1/7 leading to an even smaller mass transfer
coefficient of oxygen. This suggests that the oxidation rate of arsenopyrite by oxygen of
low pressures in alkaline solutions may be only partially controlled by mass transport of
oxygen, which is consistent with the results obtained by Nicol and Guresin (2003).

Chapter 7 Simultaneous Oxidation of Sulfide Minerals and Dissolution of Au in Alkaline Solutions 250
The rates of processes such as the cyanidation of gold, silver and copper, the
dissolution of copper and nickel in ammoniacal solutions have been found to controlled
by mass transport of oxygen (Wadsworth and Miller, 1979). However, in the present
case, the reduction of oxygen requires more negative potentials because of the shift of
the potential for the reaction
O2 + 2H2O + 4e- = 4OH- (7.30)
to lower potentials with increasing pH. This was confirmed by Nicol and Guresin (2003)
in an electrochemical study of this reaction on arsenopyrite in concentrated alkaline
solutions.
The effect of hydroxyl ions on the overall rate of arsenopyrite oxidation may be
calculated after making corrections for the effect of the hydroxyl concentration on the
solubility of oxygen. According to Narita et al. (1983), oxygen solubility as a function of
NaOH concentration solution is expressed by the following:
[O2] = 3.12 × 10 -5 [O2]0 exp(-0.433[OH-]) (7.31)
where [O2] is the oxygen solubility in NaOH solution at 25 °C, mol l-1; [O2]0 is the
saturation solubility of O2 in pure water at 25 °C (mg l-1) at the given oxygen pressure;
[OH-] is the NaOH concentration, mol l-1. Thus, at constant oxygen partial pressures and
temperatures, the concentration of dissolved oxygen will decrease exponentially with
increasing NaOH concentration. By combining Equation 7.16 with Equation 7.31 and
assuming m = 1, one gets
R0 = dX/dt = 3.12 × 10 -5 S k [O2]0 exp(-0.433[OH-] ) [OH-]n/ N0 (7.32)
or lnR0 + 0.433[OH-] = n ln[OH-] + ln(3.12 × 10 -5 S k [O2]0/N0) (7.33)
Considering the initial conditions in Figure 7.31, a plot of lnR0+ 0.433[OH-] versus
ln[OH-] would result in a straight line with slope n. By using the same procedure, an

Chapter 7 Simultaneous Oxidation of Sulfide Minerals and Dissolution of Au in Alkaline Solutions 251
apparent reaction order of about 0.09 was obtained as shown in Figure 7.45, which can
be compared with that of 0.27 obtained by Koslides and Ciminelli (1992) for
arsenopyrite oxidation during their studies on the pressure oxidation of a sulfide
concentrate in NaOH solutions. A similar reaction order of 0.1 with respect to the
hydroxyl ion has also been reported for the oxidation of pyrite in alkaline media
(Ciminelli and Osseo-Asare, 1986 and 1995). These data indicate that the alkalinity has a
negligible effect on the oxidation rate of arsenopyrite in aerated alkaline solutions.
Considering the possible errors involved in the data, the variations in activity coefficients
and the effect of oxygen on the rate, it seems reasonable to assume therefore that the
oxidation of arsenopyrite is zero order with respect to the hydroxyl concentration. The
apparent zero order for the hydroxyl ion concentration may be a result of the combined
but converse effects of alkalinity on the anodic oxidation of arsenopyrite and cathodic
reduction of oxygen as reported by Nicol and Guresin (2003).
-1.38
-1.36
-1.34
-1.32
-1.3
-1.28
-1.26
-1.24
-1.22
-0.6 -0.4 -0.2 0 0.2 0.4 0.6 0.8
ln[OH -]
lnR
0 + 0
.433
[OH
- ]
slope = 0.09
Figure 7.45 Determination of the apparent reaction order of arsenopyrite with respect to NaOH concentration (Data from Figure 7.31).

Chapter 7 Simultaneous Oxidation of Sulfide Minerals and Dissolution of Au in Alkaline Solutions 252
Summarizing the above calculations, the overall rate of arsenopyrite oxidation
with oxygen at ambient temperatures and pressures in alkaline solutions is believed to be
partially limited by the rate of mass transfer of dissolved oxygen to the surface of
arsenopyrite, and the rate of reaction may be expressed as:
- dN/dt = S k’ exp(-15.8 kJ/RT) Po2 = S k’ exp(-1900 T-1) Po2 (7.34)
where k’ is a constant and Po2 < 1 atm.
7.4.3.2 Mechanism for arsenopyrite oxidation
The above observations on the chemistry and kinetics of arsenopyrite oxidation in
aerated alkaline solutions may be integrated into a mechanistic interpretation of the
reaction. Such a proposed mechanism must necessarily be highly speculative because
evidence regarding the occurrence of some reactions is still weak or lacking. Yet it is
nonetheless useful to suggest a possible mechanism as a basis for further studies.
Since arsenopyrite is a semiconducting mineral and behaves as an electrocatalyst
for oxygen reduction, the acid pressure oxidation of arsenopyrite has been interpreted as
an electrochemical process (Papangelakis and Demopoulos, 1990). Moreover, Bou et al.
(1998) proposed an electrochemical reaction mechanism for gold deposition on the
surface of arsenopyrite in acid solutions based on the electrochemical theory of Osseo-
Asare (1992) for pyrite. It is therefore reasonable to assume that the alkaline oxidation of
arsenopyrite with oxygen is also electrochemical in nature. Thus the surface of
arsenopyrite is envisaged to consist of sites on which anodic and cathodic reactions are
believed to occur. The cathodic process for the reduction of oxygen may involve the
mass transfer of dissolved oxygen to cathodic sites, adsorption of oxygen on the active

Chapter 7 Simultaneous Oxidation of Sulfide Minerals and Dissolution of Au in Alkaline Solutions 253
sites and subsequent fast reduction reactions of oxygen as described in the following
equations, with the mass transfer of dissolved oxygen being the slowest reaction step:
1) Mass transfer of O2
O2 (aq, bulk) → O2 (aq, surface) (7.35)
2) Physisorption of O2
O2 (aq, surface) + FeAsS (s) ↔ FeAsS· O2 (ads) (7.36)
3) Electron transfer reactions
FeAsS· O2 (ads) + H2O + 2e- → FeAsS (s) + H2O2 + 2OH- (7.37)
The anodic process for oxidation of arsenopyrite could involve physisorption of hydroxyl
ion and subsequent electron transfer reactions as given in the following:
1) Adsorption of OH- ion
FeAsS (s) + OH- (aq) → FeAsS· OH- (ads) (7.38)
2) First electron transfer
FeAsS· OH- (ads) → Fe(OH)AsS (ads) + e- (7.39)
3) Transposition of OH to As or Fe sites
Fe(OH)AsS(ads) ↔ FeAs(OH)S(ads) (7.40)
4) Further electron transfer
[FeAs(OH)S(ads) ↔ Fe(OH)AsS(ads)] + 5OH- →
Fe(OH)3 + As(OH)3S(ads) + 5e- (7.41)
5) Formation and decomposition of thioarsenates
As(OH)3S (ads) ↔ H3AsO3S (ads) (7.42)
H3AsO3S (ads) + 3OH- → AsO3S3- + 3H2O (7.43)
2H3AsO3S (ads) + 8OH- → AsO33- + AsO4
3- + S22- + 7H2O (7.44)
AsO33- + S2
2- → AsO3S3- + S2- (7.45)
AsO33- + S2
2- + H2O → AsO2S23- + 2OH- (7.46)
6) Formation of thiosulfate, sulfite and arsenate

Chapter 7 Simultaneous Oxidation of Sulfide Minerals and Dissolution of Au in Alkaline Solutions 254
S2- + 6OH- → SO32- + 3H2O + 6e- (7.47)
2S2- + 6OH- → S2O32- + 3H2O + 8e- (7.48)
AsO2S23- + 10OH- → S2O3
2- + AsO43- + 5H2O + 8e- (7.49)
AsO33- + 2OH- → AsO4
3- + H2O + 2e- (7.50)
SO32- + 2OH- → SO4
2- + H2O + 2e- (7.51)
The initial anodic oxidation of arsenopyrite may be expressed as:
FeAsS + 6H2O → Fe(OH)3 + H3AsO3S + 6H+ + 6e- (7.52)
or in alkaline media:
FeAsS + 6OH- → Fe(OH)3 + H3AsO3S + 6e- (7.53)
The initial cathodic reduction of oxygen may be written as:
O2 + 2H2O + 2e- → H2O2 + 2OH- (7.54)
The following information could support this mechanism:
1). The molar ratio of monothioarsenate to total dissolved arsenic is higher in the
initial stage of the oxidation of arsenopyrite while the ratio of arsenate to total
dissolved arsenic is initially lowest;
2). The molar ratio of thiosulfate to total dissolved sulfur increases with reaction
time whereas the ratio of sulfite to total sulfur decreases with time at long
times;
3). The first four anodic steps produce 6 electrons which is in agreement with the
results of Sanchez and Hiskey (1991);
4). Most of the oxidized arsenic has an oxidation state of III rather than V and
sulfur is not directly oxidized to elemental sulfur as reported by Buckley and
Walker (1988);
5). The electrochemical studies reported by Nicol and Guresin (2003) suggest that
the cathodic reduction of oxygen to peroxide may precede reduction to water.

Chapter 7 Simultaneous Oxidation of Sulfide Minerals and Dissolution of Au in Alkaline Solutions 255
7.4.4 Dissolution of Gold
Figures 7.5 and 7.6 have shown that gold dissolves during the alkaline oxidation
of pyrite by air in the potential range of about 0-0.2 V at pH values less than 13. The
concentration of thiosulfate in the slurry has been found to be greater than 0.1 M. These
conditions under which gold dissolves are consistent with the results of the
electrochemical study of the dissolution of gold in alkaline thiosulfate solutions as
described in Chapter 4. The overall dissolution rate of the gold powder (1.5-3 µm) during
the oxidation of pyrite was calculated to be about 2 × 10-12 mol cm-1 s-1 which is also
similar to the rate obtained in Chapter 4. Similar results have been reported by Lulham
(1989) on the dissolution of gold during the oxidation of pyrite in aqueous carbonate
solutions. Hence, the dissolution of gold is believed to be associated with the presence of
thiosulfate generated by oxidation of the mineral.
The experimental results given in Chapter 5 have confirmed the dissolution of
gold in oxygenated 0.2 M thiosulfate solution at pH 12 in the presence or absence of
copper. However, the dissolution rate of gold in the absence of copper has been shown to
be extremely slow being about 6 × 10-15 mol cm-2 s-1 which is much lower than the rate
of gold dissolution during the oxidation of pyrite. Although the leaching rate of gold was
increased to about 1.5 × 10⁻¹³ mol cm-2 s-1 after wet milling of the gold powder, this
value is still relatively low. It has been shown in Chapter 5 that the presence of copper
(in the form of either copper ions, oxides or metal) in alkaline thiosulfate solutions
significantly accelerated the leaching rate of gold by oxygen with the rate being greater
than 1 × 10-12 mol cm-2 s-1. The data in Figure 7.6 has shown that a small amount of
dissolved copper was detected during the alkaline oxidation of pyrite and it can be

Chapter 7 Simultaneous Oxidation of Sulfide Minerals and Dissolution of Au in Alkaline Solutions 256
assumed that copper plays an important role in accelerating the leaching rate of gold
under these conditions by a mechanism which is not known and is beyond the scope of
this study.
As reported in Section 7.3.1, small amounts of elemental sulfur were detected
during the alkaline oxidation of pyrite, and in Section 7.3.10 no dissolution of gold was
detected in oxygenated alkaline solutions without thiosulfate even after the gold powder
was wet ground with elemental sulfur. However, gold was found to dissolve in
oxygenated 0.1 M thiosulfate solution as shown in Table 7.4, which suggests that gold
could have reacted with thiosulfate. At room temperature the kinetics of the oxidation of
elemental sulfur by oxygen has been found to be very slow in alkaline solutions. The
oxidation of elemental sulfur only resulted in very low concentrations of thiosulfate and
sulfite (< 1 mM) and sulfide was not detected by HPLC analysis. Therefore, the
complexing of gold with sulfide or polysulfides must be ruled out.
The results in Section 7.3 have also shown that gold dissolves into alkaline
thiosulfate-bearing solutions during the oxidation of arsenopyrite by air and that the rate
of dissolution of gold strongly depends on the temperature, stirring speed, concentrations
of oxygen, NaOH and arsenopyrite in the reaction system. As in the case of pyrite, the
dissolution of gold is believed to be due to the complexing of gold with thiosulfate.
However, the possible reaction of monothioarsenate with gold should also been
considered, because the results outlined in Chapter 6 have shown that gold may dissolve
in alkaline monothioarsenate solutions in the presence of oxygen. In this work the
concentrations of monothioarsenate were determined to be similar to those of thiosulfate,
and the initial concentration of monothioarsenate was higher than that of thiosulfate
during the oxidation of arsenopyrite.

Chapter 7 Simultaneous Oxidation of Sulfide Minerals and Dissolution of Au in Alkaline Solutions 257
The effect of milling on the rate and extent of dissolution of gold requires some
consideration because it has been shown that gold dissolved only after the gold powder
was wet milled with the arsenopyrite samples. There are probably several reasons for this
observation, two of which are discussed below. The first is that the sulfide mineral itself
has a positive effect on the dissolution of gold in thiosulfate solutions at various pH
values, as reported by Zhuchkov and Bubeev (1992) who found that the rate-enhancing
effect of sulfide minerals increased in the following sequence
chalcopyrite < pyrrhotite < arsenopyrite < pyrite
The second is the possible formation of gold sulfide intermediates which could explain
the positive effect of elemental sulfur (when milled with the gold powder) on the
dissolution of gold during the oxidation of arsenopyrite as reported in Section 7.3.10.
According to Balaz (2000), S(-2) and S(+6) predominate on the surface of mechanically
activated arsenopyrite samples with sulfate sulfur prevailing, while Nesbitt et al. (1995)
reported that polysulfides could be present on the surface of reacted arsenopyrite. It is,
therefore, possible that some of the gold particles could react with sulfide, polysulfides
or an As-S group forming solid gold-sulfide intermediates that are more easily soluble in
thiosulfate solutions. In another word, mechanical grinding may activate part of the gold
particles to react with the arsenopyrite mineral and enable the dissolution of gold in
alkaline thiosulfate solutions. However, this mechanism needs further investigation.
7.5 Summary and Conclusions
The alkaline oxidation of arsenopyrite and pyrite at ambient temperatures (25-55
oC) and pressures (1 atm) has been found to be accompanied by the simultaneous
dissolution of gold without the addition of cyanide. The pertinent reaction products and

Chapter 7 Simultaneous Oxidation of Sulfide Minerals and Dissolution of Au in Alkaline Solutions 258
stoichiometries have been determined using chromatographic techniques. For the first
time a new product of arsenopyrite oxidation, namely, monothioarsenate has been
identified and quantitatively determined. Arsenopyrite reacts with oxygen yielding
mainly thiosulfate, thioarsenates, arsenate and sulfite, with monothioarsenate being the
principal product in the initial stage of oxidation. In alkaline media elemental sulfur is
not a product of the oxidation of arsenopyrite but is one of the minor products of pyrite
oxidation. Thiosulfate has been confirmed to be the dominant product of pyrite
oxidation. The formation of porous coatings of ferric hydroxide has been confirmed in
the oxidation of arsenopyrite. An approximate stoichiometry of the overall process of
pyrite oxidation in alkaline solutions with air is given by the following reaction:
12FeS2 + 11O2 + 32NaOH + 2H2O = 12Fe(OH)3 + 8Na2S2O3 + 8Na2SO3 (7.4)
In the case of arsenopyrite, the reaction is more complex and the following reaction may
be used to approximately express the overall process of arsenopyrite oxidation in alkaline
solution with oxygen.
6FeAsS + 13O2 + 22NaOH =
6Fe(OH)3 + 2Na3AsO3S + 4Na3AsO4 + 2Na2S2O3 + 2H2O (7.5)
The kinetics of the alkaline oxidation of arsenopyrite has been studied. Particle
size, oxygen concentration and stirring speed are the variables that most affect the
oxidation rate of arsenopyrite at ambient temperatures and pressures. Based on an
analysis of the initial rate data, the rate of arsenopyrite oxidation with air in NaOH
solutions may be represented by the following expression:
- (1/S) dN/dt = k’ exp(-1900 T-1) Po2 (7.55)
where N is the number of moles of arsenopyrite , t is the time, S the total surface area of
arsenopyrite particles, k’ a constant, T the absolute temperature and Po2 the oxygen

Chapter 7 Simultaneous Oxidation of Sulfide Minerals and Dissolution of Au in Alkaline Solutions 259
partial pressure. A reaction mechanism has been proposed and discussed based on this
study.
Gold (added as powder) has been found to dissolve simultaneously during the
alkaline oxidation of both arsenopyrite and pyrite, which reaction appears to be
associated with the complex reactions between gold and thiosulfate. In the case of
arsenopyrite, monothioarsenate possibly also plays a role in the dissolution of gold in the
alkaline solutions. The dissolution rate of gold depends on wet-grinding of the reacting
materials, temperature, stirring speed, and the concentrations of oxygen, NaOH and
arsenopyrite in the reaction system.

Chapter 8 The Oxidation of Sulfide Concentrates and the Simultaneous Dissolution of Gold 260
CHAPTER 8 THE OXIDATION OF SULFIDE
CONCENTRATES AND THE
SIMULTANEOUS DISSOLUTION OF GOLD
8.1 Introduction
As discussed in Chapter 1, the objective of the oxidative treatment of
arsenopyrite or pyrite is to breakdown the mineral and thereby to expose precious metals
to cyanide or other lixiviants. There are a great number of studies reported in the
literature on two-step processes for the extraction of gold/silver from refractory gold
ores, involving the oxidation of sulfide minerals as a first step and the leaching of
previous metals in the second step (Sparrow, and Woodcock, 1995; Souza and Ciminelli,
1992). In order to reduce capital and operating costs, one step processes for direct
extraction of gold have been studied, including simultaneous chemical (and/or
electrochemical) oxidation in acid solutions with strong oxidants (Deng, 1995; Linge and
Welham, 1997), simultaneous oxidation of ores and leaching of gold with cyanide in
alkaline solutions (Mao et al., 1997; Min et al., 1999), simultaneous oxidation of pyrite
and leaching of gold in alkaline carbonate solutions (Lulham, 1989), and gold leaching
with a lime-sulfur mixture (Lan and Zhang, 1996; Fang and Han, 2002).
Chapter 7 has shown that gold may dissolve simultaneously during the alkaline
oxidation of arsenopyrite or pyrite by oxygen when gold is wet-milled with the mineral.
This one-step method may form the basis for a novel process for extraction of gold from

Chapter 8 The Oxidation of Sulfide Concentrates and the Simultaneous Dissolution of Gold 261
refractory sulfidic gold concentrates. Thus it is necessary to investigate the extent of gold
dissolution during the alkaline oxidation of refractory gold concentrates in order to
evaluate the feasibility of the process. This chapter, therefore, highlights experimental
work carried out on the oxidation of selected refractory arsenical gold concentrates in
alkaline solutions and the simultaneous dissolution of gold. The effects of the
concentrations of sodium hydroxide and oxygen, particle size and temperature on the
recovery of gold were examined using a commercially available flotation concentrate
containing arsenopyrite. The characteristics of the flotation concentrates used are
described in the following section, and detailed experimental procedure and analytical
techniques can be found in Chapter 3.
The oxidation of arsenopyrite and pyrite by oxygen in alkaline media may be
expressed by Equations 7.4 and 7.5 respectively. Thus the required amount of sodium
hydroxide for complete oxidation of a given amount of the arsenopyrite or pyrite mineral
can be calculated and is given in Table 8.1. It is clear from Table 8.1 that if the gold
concentrate contains 20% of arsenopyrite, 180 kg sodium hydroxide per ton of the gold
concentrate is required theoretically for complete oxidation of arsenopyrite by oxygen.
Note that the values are very similar for arsenopyrite and pyrite.
Table 8.1 Sodium hydroxide required for complete oxidation of arsenopyrite or pyrite
Sodium Hydroxide Need / kg t-1 Concentration of Pyrite or Arsenopyrite in Gold Ores / % Arsenopyrite Pyrite
10 90 88.9 15 135 133.4 20 180 177.8 25 225 222.3 30 270 266.7 35 315 311.2 40 360 355.6

Chapter 8 The Oxidation of Sulfide Concentrates and the Simultaneous Dissolution of Gold 262
8.2 Gold Concentrates
In this work several flotation gold concentrates containing arsenopyrite were
utilized in the oxidation tests. Table 8.2 summarizes the samples and the chemical
analyses for the main elements.
Table 8.2 Fire assay (Au) and ICP analyses of the flotation gold concentrates
Head Grades Samples
Au / g t-1 As / % ST / % Fe / % Cu / % Wiluna Concentrate 94.2 8.29 22.4 25.1 0.164 Macraes Concentrate 82.3 10.7 22.3 25.8 0.122 Salsigne Concentrate 23.0 14.8 33.3 38.6 -
Unknown Concentrate 414 15.4 35.7 40.9 0.035
8.2.1 Wiluna Concentrate
The flotation concentrate obtained from Wiluna Gold Mines in Western Australia
contained mainly pyrite and arsenopyrite as sulfidic minerals, with stibnite being a minor
component. The non-sulfide (gangue) component of the concentrate was dominated by
quartz and carbonate minerals. The XRD pattern of a Wiluna sample is given in Figure
A4.1 in Appendix A4. By calculation from the chemical composition, the sample
contained 18.0% arsenopyrite, 35.0% pyrite and 0.473% chalcopyrite.
In Wiluna primary sulfide ores approximately 95% of the gold was locked within
the sulfide lattice, the remainder being very fine free native gold. About 70% to 80% of
the gold in sulfides was in arsenopyrite, with pyrite and stibnite where present,

Chapter 8 The Oxidation of Sulfide Concentrates and the Simultaneous Dissolution of Gold 263
containing the balance (Guresin, 1999). This concentrate is treated using a bacterial
oxidation process at Wiluna. The particle size of the concentrate was 80% passing 75
µm.
8.2.2 Macraes Concentrate
This came from the Macraes Gold Mine in New Zealand and the particle size was
80% passing 119 µm. The dominant components of the Macraes flotation concentrate
were pyrite and arsenopyrite. Minor amounts of pyrrhotite, chalcopyrite, quartz and other
gangue minerals were also present. The XRD diagram for a Macraes sample can be
found in Figure A4.2 in Appendix A4. The concentrate had a black color because of the
high carbonaceous mineral content which added to the refractory nature of the material.
Almost all sulfur in the sample was present as sulfidic sulfur. The concentrate sample
contained 23.3% arsenopyrite, 32.8% pyrite and 0.351% chalcopyrite according to the
more detailed analysis shown in Table 8.3. The mineralogical deportment of the gold
was not known.
8.2.3 Salsigne Concentrate
A sample of flotation concentrate from Mines d'Or de Salsigne, France was also
used for the oxidation and dissolution of gold. The dominant components of the Salsigne
concentrate were pyrite and arsenopyrite with other minor minerals such as pyrrhotite,
chalcopyrite, chlorite, mica, quartz, siderite and a trace of rutile (Guresin, 1999). The
amount of arsenopyrite was estimated to be about 32% based on the data in Table 8.2.
The particle size of the original sample was nominally - 40 µm.

Chapter 8 The Oxidation of Sulfide Concentrates and the Simultaneous Dissolution of Gold 264
Table 8.3 Average head assays of the Macraes concentrate sample
Element Average Assay Au / g t-1 82.3 Ag / g t-1 5.8 Pt / g t-1 < 0.01 Pd / g t-1 < 0.01 As / % 10.7
CTotal / % 3.92 COrganic / % 3.30
Fe / % 25.8 STotal / % 22.3
SSulfide / % 22.1 Al / % 4.45
Cu / g t-1 1220 Sb / g t-1 652
8.2.4 An Unknown Concentrate
A flotation concentrate of unknown origin containing arsenopyrite and pyrite was
also used in this work. It was found to be coarser than the other samples used. By
calculation from the chemical composition, the sample contained about 33.5%
arsenopyrite, 54.4% pyrite and 0.10% chalcopyrite, assuming that all sulfur exists in the
form of arsenopyrite, pyrite and chalcopyrite.
8.3 Results
An extensive set of experiments was carried out with the Wiluna concentrate and
a more limited set (because of limited quantities of material) with the other concentrates.

Chapter 8 The Oxidation of Sulfide Concentrates and the Simultaneous Dissolution of Gold 265
In experiments to investigate the effects of various conditions on the rate of the process,
all experimental conditions remained constant except for the parameter under
investigation. Unless otherwise stated, all experiments were carried out in 600 ml of 1.56
M NaOH solution using 250 g l-1 solid sample (solid-liquid ratio = 1:4) at 25 °C, 1400
rpm stirring speed and 1 l min-1 flow rate of air. Prior to oxidation, each sample of the
gold concentrate was wet-milled for 60 minutes in a stainless steel ball mill.
During each experiment, slurry samples were taken at various times and filtered.
The filtrates were analyzed by AAS for Au, Cu and Fe, by ICP for As and S, and by
HPLC for dissolved species of sulfur and arsenic. Cumulative dissolution rates at
different reaction times of total Au, As, S, Cu and Fe were calculated based on the results
of filtrate analyses and shown in the following sections. An example of calculation of the
cumulative dissolution rates can be found in Appendix A6. In addition, the final oxidized
residue after each experiment was analyzed for total Au, As, S and Fe, arsenopyrite and
pyrite by wet chemical digestion-ICP analysis described in Appendix A2. The
dissolution rates calculated from analyses of the residue for total Au, As, S and Fe were
found to be within 10% of those calculated from the filtrate analyses.
8.3.1 Oxidation of Wiluna Concentrate
8.3.1.1 Effect of milling time
The results shown in Chapter 7 have indicated that gold only dissolves when it is
wet-milled with the arsenopyrite or pyrite mineral and it could be expected that milling
of the concentrate sample (or its particle size) would have an effect on the extent of gold
dissolution during alkaline oxidation. Figures 8.1 and 8.2 compare the dissolution of Au,

Chapter 8 The Oxidation of Sulfide Concentrates and the Simultaneous Dissolution of Gold 266
Cu, As, S and Fe as a function of reaction time after milling for various times. The
particle sizes after wet-milling for 20, 60 and 120 minutes in a stainless steel ball mill
were 80% less than 12.4, 6.0 and 4.7 µm respectively (refer to size analyses in Appendix
A5). It can be clearly seen that increasing the milling time or decreasing the particle size
of the sample significantly increases the dissolution rate of gold, copper, arsenic, sulfur
and iron. Also apparent is an induction period for gold dissolution which is possibly
related to the release of gold after oxidation of sulfide minerals or to the generation of a
lixiviant for gold.
The higher dissolution rate of arsenic than sulfur suggests that the arsenopyrite
mineral oxidizes more rapidly than pyrite under these conditions. The results of analyses
of oxidized residues after 48 hours’ oxidation showed that more than 90% of the
arsenopyrite minerals were oxidized while more than 60% of the pyrite minerals were
left unoxidized in the residues. As the percentage of pyrite (35%) in original Wiluna gold
concentrate is much higher than that of arsenopyrite (18%), the dissolution of sulfur is
thus less than 50%. The fact that the oxidation rates of arsenopyrite are higher than the
dissolution rates of arsenic suggests the formation of intermediate solid products of
arsenopyrite and/or precipitation of arsenic probably as iron arsenates. The decrease in
the arsenic concentration at long times as shown in Figure 8.2 confirms the precipitation
of arsenic. It should be noted that copper dissolves in the later stage of arsenopyrite
oxidation, which is important because copper can catalyze the dissolution of gold in
alkaline thiosulfate solutions. Figure 8.3 shows that the rate of thiosulfate formation also
increases with milling time. The concentration of thiosulfate is high (up to 0.25 M) while
that of monothioarsenate is low and less than 0.05 M. A comparison of the extraction of
gold with the potential of the slurry suggests that gold dissolution starts at potentials
above about 0 V.

Chapter 8 The Oxidation of Sulfide Concentrates and the Simultaneous Dissolution of Gold 267
0
0.1
0.2
0.3
0.4
0.5
0.6
0.7
0.8
0 10 20 30 40 5Time (hr)
Frac
tion
diss
olve
d
0
AuCu
Figure 8.1 Effect of milling time on rates of extraction of Au (——) and Cu (········) during the oxidation of Wiluna concentrate with air. (∆) 120 min; (◊) 60 min; () 20 min.
0
0.2
0.4
0.6
0.8
1
0 10 20 30 40
Time (hr)
Frac
tion
diss
olve
d
50
As
S
Fe
Figure 8.2 Effect of milling time on rates of extraction of As (——), S (− · − · −) and Fe (········) during the oxidation of Wiluna concentrate with air. (∆) 120 min; (◊) 60 min; () 20 min.

Chapter 8 The Oxidation of Sulfide Concentrates and the Simultaneous Dissolution of Gold 268
-0.8
-0.6
-0.4
-0.2
0
0.2
0 10 20 30 40 50
Time (hr)
Pote
ntia
l of g
old
(V)
0
0.1
0.2
0.3
0.4
[AsO
3S3-
] ; [S
2O32-
] (M
)
[S2O3 2-]
Potential
[AsO3S 3-]
Figure 8.3 Variation of concentrations of thiosulfate (——) and monothioarsenate (----) and the potential of gold (········) during the oxidation of Wiluna concentrate with air for various milling times. (∆) 120 min; (◊) 60 min; () 20 min.
8.3.1.2 Effect of the concentration of NaOH
The oxidation of milled Wiluna concentrate was carried out in NaOH solutions of
various concentrations. Figures 8.4, 8.5 and 8.6 show the results of these experiments.
Figure 8.4 shows that the dissolution rates of gold and copper are higher in the 1.56 M
NaOH solution than in the other solutions, suggesting a possible adverse effect of
hydroxyl ions on the dissolution of gold. However, by comparison with the results in
Figure 8.6, the lower dissolution of gold in solutions of high NaOH concentration
appears to be due to the lower concentration of dissolved oxygen (see Section 8.3.1.3).
The analyses of the oxidized residues indicated that the extent of oxidation of
arsenopyrite after 48 hours was 92.4%, 93.9% and 94.2% and that of pyrite was 31.8%,
41.9% and 43.5% in NaOH solutions of 1.56 M, 1.88 M and 2.19 M respectively.

Chapter 8 The Oxidation of Sulfide Concentrates and the Simultaneous Dissolution of Gold 269
0
0.1
0.2
0.3
0.4
0.5
0.6
0 10 20 30 40
Time (hr)
Frac
tion
diss
olve
d
50
Au
Cu
Figure 8.4 Dissolution of gold (——) and copper (········) during the oxidation of milled Wiluna concentrate in different NaOH solutions with air. (◊) 1.56 M; () 1.88 M; (∆) 2.19 M.
00.10.20.30.40.50.60.70.80.9
1
0 10 20 30 40Time (hr)
Frac
tion
diss
olve
d
50
As
S
Figure 8.5 Dissolution of arsenic (——) and sulfur (········) during the oxidation of milled Wiluna concentrate in different NaOH solutions with air. (◊) 1.56 M; () 1.88 M; (∆) 2.19 M.

Chapter 8 The Oxidation of Sulfide Concentrates and the Simultaneous Dissolution of Gold 270
0
0.05
0.1
0.15
0.2
0.25
0.3
0.35
0.4
0 10 20 30 40 50
Time (hr)
[S2O
32-] (
M)
0
5
10
15
[O2]
(mg
l-1)
[S2O32-]
[O2]
Figure 8.6 Variation of concentration of thiosulfate (——) and dissolved oxygen (········) during the oxidation of milled Wiluna concentrate in different NaOH solutions with air. (◊) 1.56 M; () 1.88 M; (∆) 2.19 M.
8.3.1.3 Effect of oxygen concentration
The results in Chapter 7 have shown that the oxygen partial pressure has a
significant effect on the rate of oxidation of arsenopyrite and the dissolution of gold. In
this case, only one experiment using pure oxygen gas was carried out to compare with
the above experiments using air. The results are given in Figures 8.7, 8.8 and 8.9. It is
apparent that the use of oxygen instead of air results in higher concentration of dissolved
oxygen in the pulp and a corresponding higher oxidation rate of arsenopyrite and
dissolution rate of gold and copper, especially in the early stages of the oxidation. The
extents of oxidation of arsenopyrite and pyrite (by residue analyses) after 48 hours were
93.8% and 42.9% respectively when oxygen was used, while the rates with air were
92.4% and 31.8% respectively. The concentration of thiosulfate is also much higher

Chapter 8 The Oxidation of Sulfide Concentrates and the Simultaneous Dissolution of Gold 271
initially when oxygen is used. These results are clearly in agreement with those found in
Chapter 7.
0
0.1
0.2
0.3
0.4
0.5
0.6
0.7
0 10 20 30 40
Time (hr)
Frac
tion
diss
olve
d
50
AuCuFe
Figure 8.7 Dissolution of gold (——), copper (− · − · −) and iron (········) during the oxidation of milled Wiluna concentrate with air (◊) and oxygen ().
00.10.20.30.40.50.60.70.80.9
1
0 10 20 30 40
Time (hr)
Frac
tion
Dis
solv
ed
50
As
S
Figure 8.8 Dissolution of arsenic (——) and sulfur (········) during the oxidation of milled Wiluna concentrate with air (◊) and oxygen ().

Chapter 8 The Oxidation of Sulfide Concentrates and the Simultaneous Dissolution of Gold 272
0
3
6
9
12
15
18
0 10 20 30 40 50
Time (hr)
[O2]
(mg
l-1)
0
0.1
0.2
0.3
0.4
[S2O
32-] (
M)
[S2O32-]
[O2]
Figure 8.9 Variation of concentrations of thiosulfate (——) and dissolved oxygen (········) during the oxidation of milled Wiluna concentrate with air (◊) and oxygen ().
8.3.1.4 Effect of temperature
The effects of temperature on the rates of oxidation of Wiluna concentrate and
the dissolution of gold are shown in Figure 8.10, 8.11 and 8.12. When higher
temperatures are used, the induction period for gold dissolution becomes longer (Figure
8.10) although the dissolution rate of gold increases at higher temperatures. Increasing
temperature also results in the increase in the dissolution rates of copper and iron. The
analyses of the final residues showed that the extent of oxidation of arsenopyrite at the
various temperatures was 92.4% (25 °C), 93.8% (40 °C) and 93.6% (55 °C), and the
corresponding quantities for pyrite were 31.8% (25 °C), 40.4% (40 °C) and 41.3% (55
°C). Examination of the variation in concentrations of dissolved oxygen and thiosulfate
in the pulp (Figure 8.12), indicates that in the initial stage of reaction, the oxidation of
the minerals at higher temperatures is faster so that there is insufficient dissolved oxygen

Chapter 8 The Oxidation of Sulfide Concentrates and the Simultaneous Dissolution of Gold 273
available for the oxidation of gold, and that in the later stage, part of the dissolved
oxygen is employed to oxidize soluble species such as thiosulfate.
0
0.1
0.2
0.3
0.4
0.5
0.6
0.7
0.8
0.9
0 10 20 30 40
Time (hr)
Frac
tion
diss
olve
d
50
Au
Cu
Fe
Figure 8.10 Dissolution of gold (——), copper (········) and iron (− · − · −) during the oxidation of milled Wiluna concentrate with air at various temperatures. (◊) 25 °C; () 40 °C; (∆) 55 °C.
0
0.1
0.2
0.3
0.4
0.5
0.6
0.7
0.8
0 10 20 30 40 5
Time (hr)
Frac
tion
diss
olve
d
As
S
0
Figure 8.11 Dissolution of arsenic (——) and sulfur (······) during the oxidation of milled Wiluna concentrate with air at various temperatures. (◊) 25 °C; () 40 °C; (∆) 55 °C.

Chapter 8 The Oxidation of Sulfide Concentrates and the Simultaneous Dissolution of Gold 274
0
0.1
0.2
0.3
0.4
0 10 20 30 40 50
Time (hr)
[S2O
32-] (
M)
012345678910
[O2]
(mg
l-1)
[S2O32-]
[O2]
Figure 8.12 Variation of concentrations of thiosulfate (——) and dissolved oxygen (········) during the oxidation of milled Wiluna concentrate with air at various temperatures. (◊) 25 °C; () 40 °C; (∆) 55 °C.
The results shown above clearly indicate that temperature has two opposing
effects on the rates of sulfide oxidation and gold dissolution. The first is to increase the
oxidation rate of the minerals and gold, while the second is that lower solubility of
oxygen at the higher temperatures and the increased oxidation rate result in lower
concentrations of dissolved oxygen under the conditions of these experiments. Thus, to
increase the rate of dissolution of gold, it is important to increase both the temperature
and concentration of dissolved oxygen.
8.3.1.5 Effect of extended reaction time
The above results have indicated that both oxidation of sulfides and dissolution of
gold may increase further after two days. It was therefore decided to carry out

Chapter 8 The Oxidation of Sulfide Concentrates and the Simultaneous Dissolution of Gold 275
experiments over extended reaction times. Figures 8.13, 8.14 and 8.15 show the effect of
time on the oxidation of gold and sulfide minerals at 25 °C. These results also serve to
illustrate the reproducibility of the experimental results. It can be seen that the
dissolution rates of gold, copper, sulfur and arsenic gradually decrease after about 24
hours but that the dissolution of gold is still increasing above 70% even after 4 days. The
analyses of the oxidized residues indicated that the extent of oxidation of arsenopyrite
was 95.5% while that for pyrite was 41.7% after 4 days while after 2 days 92.4% of the
arsenopyrite and 31.8% of the pyrite had been oxidized. The dissolved arsenic
concentration decreases after 24 hours, which is probably related to the formation of
some insoluble iron arsenate compounds. The concentration of thiosulfate also gradually
decreases after 24 hours while that of sulfate increases, presumably as a result of the
oxidation of thiosulfate.
0
0.1
0.2
0.3
0.4
0.5
0.6
0.7
0.8
0 20 40 60 80
Time (hr)
Frac
tion
diss
olve
d
100
Au
Cu
Figure 8.13 Dissolution of gold (◊) and copper (∆) during the oxidation of milled Wiluna concentrate at different times. (········) 2 days; (——) 4 days.

Chapter 8 The Oxidation of Sulfide Concentrates and the Simultaneous Dissolution of Gold 276
0
0.1
0.2
0.3
0.4
0.5
0.6
0.7
0.8
0 20 40 60 80
Time (hr)
Frac
tion
diss
olve
d
100
As S
Fe
Figure 8.14 Dissolution of arsenic (◊), sulfur (∆) and iron () during the oxidation of milled Wiluna concentrate at different times. (········) 2 days; (——) 4 days.
0
0.05
0.1
0.15
0.2
0.25
0.3
0 20 40 60 80
Time (hr)
Con
cent
ratio
n of
spec
ies (
M)
100
Figure 8.15 Concentration profiles of thiosulfate (∆), arsenate (), sulfite (o) and sulfate (◊) during the oxidation of milled Wiluna concentrate at different times. (········) 2 days; (——) 4 days.

Chapter 8 The Oxidation of Sulfide Concentrates and the Simultaneous Dissolution of Gold 277
In summary, it has been demonstrated that in excess of 70% of the gold in the
refractory Wiluna flotation concentrate is dissolved simultaneously during the oxidation
of the concentrate in alkaline solutions. Partial oxidation is required before the
dissolution of gold commences. Increasing oxygen concentration and temperature result
in an increase in the dissolution rate of gold while a decrease in particle size leads to
higher dissolution rate of gold. Excess amounts of sodium hydroxide reduce the
concentration of dissolved oxygen in the reacting system, thus delaying the oxidation of
gold. Copper and iron are also dissolved after partial oxidation of the sulfide minerals.
The concentration of monothioarsenate is lower than 0.05 M while that of thiosulfate is
high up to 0.25 M, and the thiosulfate is gradually oxidized to other species such as
sulfate at longer reaction times.
8.3.2 Oxidation of Macraes Concentrate
Several experiments on the alkaline oxidation of the Macraes flotation
concentrate and the simultaneous dissolution of gold were carried out at 25 °C. The
results of a typical test are given in Figures 8.16 and 8.17. It can be seen that, as in the
case of the Wiluna concentrate, gold starts to dissolve only after the mineral is partly
oxidized after which the gold dissolves at an approximately linear rate to a maximum
dissolution of about 72% after 48 hours.

Chapter 8 The Oxidation of Sulfide Concentrates and the Simultaneous Dissolution of Gold 278
00.10.20.30.40.50.60.70.80.9
1
0 10 20 30 40 5
Time (hr)
Frac
tion
diss
olve
d
0
Figure 8.16 Dissolution of gold (o), arsenic (◊), sulfur (), copper (∆) and iron (x) during the oxidation of milled Macraes concentrate with air at 25 °C.
0
0.05
0.1
0.15
0.2
0.25
0.3
0 10 20 30 40 5
Time (hr)
Con
cent
ratio
n of
spec
ies (
M)
0
Figure 8.17 Variation of concentrations of thiosulfate (◊), arsenate (∆), sulfite () and monothioarsenate (o) during the oxidation of milled Macraes concentrate with air at 25 °C.

Chapter 8 The Oxidation of Sulfide Concentrates and the Simultaneous Dissolution of Gold 279
Figure 8.16 shows that the dissolution of arsenic is higher than that of sulfur,
suggesting that the oxidation rate of arsenopyrite is higher than that of pyrite, which is
also similar to the results obtained with the Wiluna concentrate. In fact, the extent of
oxidation of arsenopyrite by analyses of the solid residue after 48 hours was 97% and
that of pyrite was 36.2%. The dissolution of copper indicates partial oxidation of
chalcopyrite. Figure 8.17 shows that the concentrations of thiosulfate and arsenate are
high while those of monothioarsenate and sulfite are low, suggesting the faster oxidation
rate of monothiosulfate and sulfite in this reacting system.
8.3.3 Oxidation of Salsigne Concentrate
A single experiment on the oxidation of the Salsigne concentrate sample was
carried out at 25 °C for 48 hours in 300 ml 2.08 M NaOH solution with 100 grams of the
sample milled to 90% passing 5 micron. The amount of NaOH used is equivalent to 250
kg per ton of the concentrate. The overall results of the experiment are given in Table 8.4
which shows that about 76% of the gold in the sample is dissolved with the dissolution of
arsenic being about 70%. The calculated dissolution rates of gold by analyses of the solid
residue and the solutions are consistent. Small amounts of iron were found in the solution
after 48 hours.
Table 8.4 Oxidation of Salsigne concentrate with air at 25 oC for 48 hours
Arsenic Dissolution / %
Gold Dissolution (by solution) / %
Gold Dissolution (by residue) / %
Iron in solution / g l-1
69.3 76.0 76.8 0.49

Chapter 8 The Oxidation of Sulfide Concentrates and the Simultaneous Dissolution of Gold 280
8.3.4 Oxidation of Unknown Concentrate
A flotation concentrate of unknown origin was available with a high gold
concentration of 414 g t-1 and was included in the test work. The experiment was carried
out under the following conditions: 150 grams of the sample in 600 ml distilled water,
45.2 grams of sodium hydroxide (calculated from Table 8.1 according to the arsenopyrite
content), 25 °C, 1400 rpm stirring speed, 1 l min-1 air flowrate. The sample was wet
milled for 60 minutes.
The results are shown in Figures 8.18 and 8.19. The gold starts to dissolve after
about 12 hours when more than 40% of arsenic is dissolved from the sample. The
concentration of thiosulfate at 12 hours is about 0.16 M while that of monothioarsenate is
low at 0.03 M. The concentration of thiosulfate at 50 hours increases to 0.4 M whereas
that of monothioarsenate decreases to zero.
The dissolution of arsenic reaches 83% after 50 hours (the oxidation of
arsenopyrite and pyrite by residue analyses being 97% and 28% respectively) at which
time the extent of gold dissolution is only 21%. The relevant dissolution rates of copper
and iron are 36% and 7% respectively.

Chapter 8 The Oxidation of Sulfide Concentrates and the Simultaneous Dissolution of Gold 281
00.1
0.20.30.40.50.60.70.80.9
0 10 20 30 40 50 6
Time (hr)
Frac
tion
diss
olve
d
Au
As
Cu
Fe
S
0
Figure 8.18 Dissolution of gold (◊), arsenic (), sulfur (×), copper (∆) and iron (o) during the oxidation of milled unknown concentrate with air at 25 °C.
0
0.1
0.2
0.3
0.4
0.5
0 10 20 30 40 5
Time (hr)
Con
cent
ratio
n of
spec
ies (
M)
S2O32-
AsO3S3-
0
Figure 8.19 Variation of the concentrations of thiosulfate (∆) and monothioarsenate () during the oxidation of milled unknown concentrate with air at 25 °C.
Chapter 8 The Oxidation of Sulfide Concentrates and the Simultaneous Dissolution of Gold 282
8.4 Discussion
Experimental tests on several refractory concentrates have shown that gold can be
dissolved during the alkaline oxidation of these sulfide concentrates with air without
addition of a lixiviant such as cyanide. The dissolution of gold appears to be correlated
with the concentration of thiosulfate and probably occurs as a result of the complex
reactions of gold with thiosulfate. The alternative reaction with monothioarsenate as a
lixiviant does not appear likely given the low concentration of monothioarsenate during
the oxidation process. This conclusion is in agreement with the studies of Lulham (1989)
who reported the dissolution of gold from pyritic ores in Na2CO3 solutions in the
presence of thiosulfate and the results of Fang and Han (2002) who studied the leaching
of gold with sulfur and Ca(OH)2 under oxygen pressures. The dissolution rate of gold in
the gold concentrates can be estimated by considering the oxidation of the Wiluna
sample (milled for 60 minutes) at 25 °C as shown in Figure 8.1 and using Equation 5.20
in Chapter 5 (assuming spherical particles of gold):
RAu = (dXAu/dt) (ρ d) / (6 MAu) (8.1)
where RAu is the initial dissolution rate of gold in moles per unit time per unit surface
area (mol cm-2 s-1); XAu is the dissolution fraction of gold; MAu is the molar weight of
gold (196.97 g mol-1); ρ is the specific gravity of gold (19.32 g cm-3); d is the diameter of
spherical gold particles (cm). From Figure 8.1 it can be seen that X increases
approximately linearly with time at 25 °C. Thus dXAu/dt can be assumed to be a constant
and for X = 0.58 at 48 hours,
dXAu/dt = 0.58/(48 × 3600) = 3.35 × 10⁻⁶ (s-1) (8.2)
Assuming d = 1 µm = 10-4 cm, RAu = 5.5 × 10⁻¹² mol cm-2 s-1. If d = 0.1 µm, RAu = 5.5 x
10-13 mol cm-2 s-1, and d = 0.01 µm, RAu = 5.5 × 10⁻¹⁴ mol cm-2 s-1. These estimated

Chapter 8 The Oxidation of Sulfide Concentrates and the Simultaneous Dissolution of Gold 283
values for the dissolution rate of gold in the concentrate sample are much higher than the
value of about 6 × 10-15 mol cm-2 s-1 as estimated in Chapter 5 for the dissolution rate of
gold powder in oxygenated alkaline thiosulfate solutions without copper and ammonia.
These values are similar to the rate (1.5 × 10⁻¹³ mol cm-2 s-1) of wet-milled 1.5-3 µm gold
powder in oxygenated alkaline thiosulfate solutions without copper (Chapter 5). This
comparison suggests that the size of gold particles in the concentrates may be very fine
i.e. less than 0.1 µm so that gold in sulfide minerals dissolves much faster than with
powders, which is in consistent with the mineralogy of Wiluna gold concentrate in which
most of the gold occurs in arsenopyrite as microscopic or invisible grains.
There is an induction period for the dissolution of gold, which probably results
from the slow rate of formation of thiosulfate ions by oxidation of sulfide minerals but
also the requirement of oxidation of the minerals for occluded gold grains to be exposed
to thiosulfate and oxygen. Mineralogical analysis of the Wiluna concentrate has shown
that the gold is mostly locked in sulfide minerals (it is probable that other refractory gold
concentrates have similar features). Thus the oxidation or decomposition of the sulfide
minerals such as arsenopyrite or pyrite is required to release the gold in order for gold to
react with the thiosulfate formed during the oxidation of these minerals with dissolved
oxygen. From all the experimental results on the oxidation of Wiluna gold concentrate,
the relationship between the dissolution of gold and the dissolution of total sulfur and
arsenic in the concentrate have been established and shown in Figures 8.20. Based on the
analyses of the oxidized residues, the correlations of the dissolution of gold with the
oxidation of sulfidic sulfur, arsenopyrite and pyrite are given in Figure 8.21.

Chapter 8 The Oxidation of Sulfide Concentrates and the Simultaneous Dissolution of Gold 284
0
0.1
0.2
0.3
0.4
0.5
0.6
0.7
0.8
0.9
0 0.1 0.2 0.3 0.4 0.5 0.6 0.7 0.8 0.9 1
Fraction dissolved S and As
Frac
tion
diss
olve
d A
u
AsS
Figure 8.20 Correlation of the dissolution of gold with the dissolution of arsenic (+) and sulfur (o) during the oxidation of milled Wiluna concentrate at various conditions.
0.2
0.3
0.4
0.5
0.6
0.7
0.8
0.9
0 0.1 0.2 0.3 0.4 0.5 0.6 0.7 0.8 0.9 1
Fraction dissolved or oxidized
Frac
tion
diss
olve
d A
u
Figure 8.21 Correlation of the dissolution of gold with the oxidation of arsenopyrite () and pyrite (o) and with the dissolution of sulfur (∆) and arsenic (+) based on analyses of residues after 48 hours' oxidation of milled Wiluna concentrate under various conditions.

Chapter 8 The Oxidation of Sulfide Concentrates and the Simultaneous Dissolution of Gold 285
It appears from Figure 8.20 that the dissolution of gold increases with the
dissolution of sulfur. The analytical results of the final oxidation residues as given in
Figure 8.21 also shows that the dissolution of gold correlates with the dissolution of
sulfur. It was found from the analyses of the residues that, as expected, the extent of
dissolution of sulfur varied approximately linearly with the oxidation of sulfidic sulfur.
Thus the dissolution of gold increases with the extent of sulfur oxidation, suggesting that
most of gold in the Wiluna concentrate is associated with the sulfide minerals. From
Figure 8.20 it can be seen that in the initial stage of the oxidation the dissolution of
arsenic rapidly increases up to about 90% while the extent of gold dissolution increases
with the dissolution of arsenic but reaches only about 20%, suggesting that most of the
gold probably is locked in arsenopyrite as very fine grains so that most of the
arsenopyrite is required to be oxidized to release the gold. On the other hand, the low
dissolution of gold at the beginning may be related to the low mixed potential of gold in
the reacting slurry as shown in Figure 8.3. As the oxidation of the concentrate proceeds,
the mixed potential of gold increases gradually and the dissolution of gold also increases
up to 80%, while the rate of dissolution of arsenic decreases slowly. The faster increase
in the dissolution of gold in this stage is believed to be associated with the reaction of
released fine particles of gold with thiosulfate generated by the oxidation reaction,
whereas the loss of arsenic is due to the precipitation of arsenic probably as iron
arsenates and/or other intermediates. Figure 8.21 shows that almost all of the
arsenopyrite actually is oxidized after 48 hours but the dissolution of arsenic is only
about 60-70%, confirming the precipitation of arsenic into the residues. As seen from
Figure 8.21, 80% of gold dissolution from the Wiluna concentrate can be achieved after
more than 90% of arsenopyrite and only 40% of pyrite are oxidized, which also seems to

Chapter 8 The Oxidation of Sulfide Concentrates and the Simultaneous Dissolution of Gold 286
suggest that the dissolution of gold correlates mainly with the oxidation of arsenopyrite
and not that of pyrite.
Figures 8.2 and 8.20 show that the dissolution rate of arsenic is higher than that
of sulfur, suggesting that the oxidation rate of arsenopyrite is more rapid than that of
pyrite despite the higher proportion of pyrite than arsenopyrite in the concentrate, which
has been confirmed by the analyses of final oxidized residues for arsenopyrite and pyrite
as shown in Figure 8.21. These results are in consistent with the published data (Hiskey
and Wadsworth, 1981; Rand, 1977) which have indicated that pyrite is a more noble
sulfide mineral oxidation and would act as a cathode when in contact with other sulfides
including arsenopyrite and chalcopyrite and accelerate the oxidation of these minerals.
The mixed potential of gold in the reacting slurry (Figure 8.3) is between -0.1 V and 0.2
V which value falls between the rest potential of arsenopyrite and that of pyrite in
alkaline solutions (Vreugde, 1982), confirming the prior oxidation of arsenopyrite to
pyrite.
The dissolution of copper shown in Figure 8.1 could result from the oxidation of
chalcopyrite in the concentrates as suggested by Lazaro-Baez (2001) and Hiskey and
Wadsworth (1981):
CuFeS2 = CuS + Fe2+ + S0 + 2e- E° = 0.294 V (8.3)
CuFeS2 = Cu2+ + Fe2+ + 2S0 + 4e- E° = 0.442 V (8.4)
CuFeS2 + 3H2O = Cu2+ + Fe2+ + S2O32- + 6H+ + 8e- E° = 0.470 V (8.5)
and the formation of copper-thiosulfate complexes:
2Cu2+ + 8S2O32- = S4O6
2- + 2Cu(S2O3)35- ∆G°298K = -170.5 kJ mol-1 (8.6)
4CuS + 10S2O32- + 3O2 = 4Cu(S2O3)3
5- ∆G°298K = -954.0 kJ mol-1 (8.7)
The copper dissolved may accelerate the dissolution of gold as discussed in Chapter 5.

Chapter 8 The Oxidation of Sulfide Concentrates and the Simultaneous Dissolution of Gold 287
Since the dissolution of gold appears to be due to the reaction of gold with
thiosulfate, the concentration of oxygen as the oxidant would be expected to have an
important effect on the rate of gold dissolution. Experimental tests on the Wiluna
concentrate sample have confirmed the positive role of dissolved oxygen and that
increasing oxygen concentration or partial pressure would accelerate the rate of
dissolution of gold.
The apparent minor detrimental effect of higher concentrations of sodium
hydroxide can be attributed to the reduced levels of dissolved oxygen at the higher
concentrations of sodium hydroxide and the shift to more negative potentials of the
cathodic reduction of oxygen. Increasing temperature has two opposing effects on the
rate of gold dissolution. An expected increase in the oxidation rate of arsenopyrite, pyrite
and gold at higher temperatures is counteracted by a decrease in the concentration of
dissolved oxygen under the conditions of the experiments. Therefore, the dissolution rate
of gold at higher temperatures shown in Figure 8.10 is lower in the first 12 hours but
increases in the later stages of oxidation as the concentration of oxygen increases.
Figure 8.13 shows that the dissolution rate of gold is low and constant after an
initial rapid increase. This behaviour is very similar to that of gold found in the
thiosulfate solutions with copper present as described in Chapter 5, suggesting the
occurrence of passivation of gold in thiosulfate solutions.
The oxidation of the Macraes gold concentrate as shown in Figures 8.16 and 8.17
shows similar results to that of Wiluna concentrate, indicating that Macraes concentrate
could probably have similar mineralogical features to those of the Wiluna concentrate.

Chapter 8 The Oxidation of Sulfide Concentrates and the Simultaneous Dissolution of Gold 288
However, the experimental results shown in Figure 8.18, for the oxidation of the
unknown gold concentrate, indicate that the dissolution of gold (about 20% after 48
hours) is considerably low despite a high gold content of more than 400 g t-1 in the
concentrate. One possible reason for the low recovery of gold could be that most of the
gold in the unknown concentrate is associated with pyrite which needs to be completely
oxidized before gold particles can be exposed to the thiosulfate lixiviant. In fact, the
oxidation rate of pyrite by analysis of the residue after 48 hours was low with only about
28% oxidation while 97% of the arsenopyrite had been oxidized. Additionally, the gold
in the unknown concentrate may not occur as microscopic grains or invisible gold as in
arsenopyrite.
Therefore, the extraction of gold during the alkaline oxidation of refractory
sulfide gold concentrates depends on not only the concentration of gold in the
concentrates but also on the mineralogy and deportment of gold with the host minerals.
More detailed investigations of this aspect need to be carried out.
8.5 Conclusions
Several refractory gold sulfide-bearing concentrates have been tested for the
dissolution of gold during the alkaline oxidation of these concentrates without the
addition of cyanide. For rapid and effective dissolution of gold, it is required to oxidize
the gold-bearing sulfide minerals to release the gold particles in the minerals. Fine-
grinding of the concentrate samples will increase the rate of oxidation of the sulfide
minerals in alkaline solutions as will an increase in temperature and concentration of
dissolved oxygen. The rate of oxidation of arsenopyrite is greater than that of pyrite
under the conditions of these experiments.

Chapter 8 The Oxidation of Sulfide Concentrates and the Simultaneous Dissolution of Gold 289
The simultaneous dissolution of gold is attributed to the reaction of gold with
thiosulfate ions generated during the alkaline oxidation of the sulfide minerals. It is
suggested that the monothioarsenate ion could possibly play only a minor role in the
dissolution of gold because of the low concentration of this species in the reacting pulp.
Copper dissolved from the oxidation of copper minerals such as chalcopyrite may
accelerate the dissolution of the gold.
The results obtained in this limited assessment of the applicability of the
chemistry to the recovery of gold from selected sulfide concentrates have shown promise
and could provide the basis of a new process for direct extraction of gold from refractory
arsenical gold concentrates in one step without using lixiviants such as cyanide.

Chapter 9 Summary and Recommendations 290
CHAPTER 9 SUMMARY AND RECOMMENDATIONS
This chapter summarizes the principal results of this study carried out on the
simultaneous dissolution of gold during the alkaline oxidation of arsenopyrite and pyrite,
the electrochemistry and leaching of gold in alkaline thiosulfate and thioarsenate
solutions and on the practical extraction of gold from refractory sulfide concentrates
without the use of cyanide. Recommendations for further work in this area are also made.
9.1 Summary
A major finding in this study is that the alkaline oxidation of refractory gold
concentrates containing arsenopyrite and pyrite with oxygen at ambient temperatures and
pressures is accompanied by the simultaneous dissolution of gold without the addition of
cyanide. Studies of the alkaline oxidation of some selected refractory sulfide gold
concentrates have shown that up to 80% of gold can be extracted in a one-step process
without cyanide, suggesting a new possible approach for extraction of gold from
refractory sulfide gold concentrates.
A detailed study on the chemistry of the products formed during the dissolution
of arsenopyrite and pyrite in alkaline solutions has been carried out by way of high
performance liquid chromatography (HPLC). Previously unidentified oxidation products
of arsenopyrite, namely, thioarsenates, have been identified and quantitatively
determined. Arsenopyrite reacts with oxygen yielding mainly thiosulfate, thioarsenates,
arsenate and sulfite, with monothioarsenate being the principal product in the initial stage

Chapter 9 Summary and Recommendations 291
of arsenopyrite oxidation. Sulfur appears not to be the oxidation product of arsenopyrite
but is one of the oxidation products of pyrite in alkaline media. Thiosulfate has been
confirmed to be the dominant product of pyrite oxidation. Ferric hydroxide in the form of
porous layers on the mineral particles is the oxidation product of both arsenopyrite and
pyrite. An approximate stoichiometry for the overall process of pyrite oxidation in
alkaline solutions with air is given by the following reaction:
12FeS2 + 11O2 + 32NaOH + 2H2O = 12Fe(OH)3 + 8Na2S2O3 + 8Na2SO3 (9.1)
In the case of arsenopyrite, the reaction below may be used to approximately express the
overall process of arsenopyrite oxidation in alkaline solution with oxygen.
6FeAsS + 13O2 + 22NaOH =
6Fe(OH)3 + 2Na3AsO3S + 4Na3AsO4 + 2Na2S2O3 + 2H2O (9.2)
The study of the kinetics of the alkaline oxidation of arsenopyrite has shown that
variables such as particle size, oxygen concentration, and stirring speed have the most
significant effect on the rate at ambient temperatures and pressures. The initial oxidation
rate of arsenopyrite in NaOH solutions may be represented by the following expression:
- (1/S) dN/dt = k’ exp(-1900 T-1 ) Po2 (9.3)
A reaction mechanism for the oxidation of arsenopyrite has been proposed, which
involves an anodic process for arsenopyrite oxidation involving hydroxyl ions and a
cathodic process for oxygen reduction. The overall rate of oxidation is partially
controlled by mass transfer of dissolved oxygen.
Gold, either as added powder or as a constituent of the concentrates has been
found to dissolve simultaneously during the alkaline oxidation of both arsenopyrite and
pyrite, which appears to be associated with the complex reactions between gold and
thiosulfate. The dissolution rate of gold is dependent on wet-milling of the reacting

Chapter 9 Summary and Recommendations 292
materials, temperature, stirring speed, concentrations of oxygen, NaOH and arsenopyrite
in the reaction system. Small amounts of copper in the form of copper sulfide minerals in
the concentrates have also been found to dissolve simultaneously, most likely due to
reaction with thiosulfate. The solubility of iron from the sulfide minerals in weak
alkaline media appears to be a result of reaction of dissolved iron with arsenates.
Electrochemical studies of gold in thiosulfate solutions have shown that anodic
dissolution of gold can be measured in alkaline thiosulfate solutions at ambient
temperatures at potentials above about 0.2 V. Thiosulfate ions undergo oxidative
decomposition on the gold surface in the same potential region with the formation of a
sulfur-like surface film which acts to partially passivate the surface for the dissolution of
gold. The anodic dissolution of gold at constant potentials has been found to be
electrochemically controlled with an activation energy of 65 kJ mol-1, and the rate has
been enhanced by increases in pH, temperature and concentrations of thiosulfate and
ammonia. Open circuit dissolution of gold in oxygenated thiosulfate solutions can occur
with a rate which is significantly lower than that achieved by conventional cyanidation or
by the copper-catalyzed dissolution in ammoniacal thiosulfate solutions.
The effect of copper on the dissolution of gold in alkaline thiosulfate solutions in
the absence of ammonia has been investigated by ways of electrochemical and leaching
techniques. It is found that while copper ions catalyze the reaction rate of gold with
thiosulfate they also accelerate the rate of oxidation of thiosulfate. It is proposed that the
catalytic role of copper in enhancing the rates of dissolution of gold and oxidation of
thiosulfate in oxygenated thiosulfate solutions in the absence of ammonia is possibly
associated with the formation of a copper-thiosulfate-oxygen intermediate species, which
acts as an oxidant. It is also possible that a mixed copper-gold-thiosulfate complex is

Chapter 9 Summary and Recommendations 293
formed and plays a role in the increase of the dissolution rate of gold in ammonia-free
thiosulfate solutions. As expected, milling of gold powder assists with the dissolution of
gold in thiosulfate solutions, especially in the presence of copper. The positive effect of
copper on the dissolution of gold may account for the simultaneous dissolution of gold
during the alkaline oxidation of refractory gold concentrates containing arsenopyrite and
pyrite.
A preliminary investigation into possible reactions of gold with arsenical
compounds such as monothioarsenate and thioarsenites has been conducted using
electrochemical and leaching approaches. Electrochemical studies have shown that gold
dissolves at a measurable rate in monothioarsenate solutions at potential of 0.25 V,
which is confirmed by leaching experiments in the presence of oxygen. It appears that
the formation of a passivating film inhibits the dissolution of the gold. It is also found
that gold dissolves in thioarsenite solutions, with the dissolution rate depending on the
composition, temperature and oxygen concentration of the solution. The reactions of
gold with thioarsenates and thioarsenites are attributed to be presence of the active sulfur
atoms in these arsenical compounds that are soft electron donors as in the case of
polysulfides, thiosulfate, thiocyanate, thiourea or other sulfur bearing ligands which can
form complexes with gold. The reactivity of gold with monothioarsenate suggests that
thioarsenates may play a role in the dissolution of gold accompanying the alkaline
oxidation of refractory gold concentrate containing arsenopyrite.
In summary, the results of this study demonstrate that the alkaline oxidation of
fine-ground refractory gold concentrates containing arsenopyrite and pyrite with air in
the absence of cyanide is accompanied by the simultaneous dissolution of gold as a result
of reactions of gold with thiosulfate. The fraction of gold dissolved depends on the

Chapter 9 Summary and Recommendations 294
mineralogy and particle size of the ore sample, oxygen concentration, alkalinity, pulp
density, agitation and the availability of copper in the sample. This work has suggested
an alternative one-step process for the direct extraction of gold from refractory sulfide-
bearing gold ores without the use of cyanide.
9.2 Recommendations for Future Work
As mentioned above, direct extraction of gold from refractory arsenical gold
concentrates by alkaline oxidation with air at ambient temperatures and pressures is
possible. However, it is worth noting that this study was carried out on a laboratory scale.
For practical, commercial use, much further work is necessary to be conducted on a
larger scale to examine the efficiency of the process investigated in this study. Each ore
or concentrate has a characteristic mineralogy and deportment of gold and therefore the
feasibility of the proposed process needs to be carefully evaluated for each particular ore.
The following activities could be considered for further investigation.
1. A more extensive study of the mechanism of the dissolution of gold using
thiosulfate as the lixiviant in order to increase the leaching rate of gold.
2. A detailed investigation aimed at a fuller understanding of the effect of ammonia
on the dissolution of gold in thiosulfate solutions.
3. Detailed studies on the mechanism of arsenopyrite oxidation in alkaline solutions.
4. Extension of this work to higher temperatures and pressures such as those under
consideration for pressure oxidation of arsenopyrite concentrates.
5. Examination of the use of some additives such as ammonia or sulfite to increase
the recovery of gold from refractory concentrates.

Chapter 9 Summary and Recommendations 295
6. Studies on the relationship between the mineralogy and the recovery of gold in
order to establish the applicability of the process to concentrates from different
sources.
7. An investigation into the recovery of gold from the pregnant solutions produced
from the alkaline oxidation of refractory sulfide bearing concentrates.
8. Disposal of the arsenic-containing solutions to meet environmental regulations for
health and safety.
9. Development of methods for the recovery and recycle of alkali in the process.
10. Scale-up experiments using appropriate large reactors or vessels to evaluate the
feasibility of the one-step gold extraction process for a selection of some refractory
gold concentrates.
11. Minimization of reagent consumption for commercial use.

References 296
REFERENCES
Abbruzzese, C., Fornari, P., Massidda, R., Veglio, F. and Ubaldini, S. (1995),
Thiosulfate leaching for gold hydrometallurgy. Hydrometallurgy, 39 (1-3): 265-
276.
Adams, M. D. (1994), The elution of gold from activated carbon at room temperature
using sulfide solutions. J. S. Afr. Inst. Min. Metall., August: 187-198.
Ahlberg, E., Forssberg, K. S. E. and Wang, X. (1990), The surface oxidation of pyrite in
alkaline solution. J. Appl. Electrochem., 20 (6): 1033-1039.
Ahmed, S. M. (1978), Electrochemical studies of sulphides. I. The electrocatalytic
activity of galena, pyrite and cobalt sulphide for oxygen reduction in relation to
xanthate adsorption and flotation. Intl. J. Miner. Process., 5: 163-174.
Akhmedzhanova, G. M., Nekrasov, I. Y. and Tikhomirova, V. I. (1991), Effect of arsenic
on the solubility of gold in the gold-arsenic-0.1 N hydrochloric acid system at 200
and 300 oC. Dokl. Akad. Nauk SSSR, 319 (2): 471-474.
Akhmedzhanova, G. M., Nekrasov, I. Y., Tikhomirova, V. I. and Konyushok, A. A.
(1988), Solubility of gold in sulfide-arsenic solutions at 200-300 oC. Dokl. Akad.
Nauk SSSR, 300 (6): 1453-1456.
Akinfiev, N. N., Zotov, A. V. and Nikonorov, A. P. (1992), Thermodynamic analysis of
equilibria As(III)-S(II)-O-H system. Geochem. Intl., 29 (12): 109-121.
Anon. (1999), Metallurgical testwork on flotation concentrates for Acacia Resources Pty
Ltd. (Independent Metallurgical Laboratories Pty Ltd: Perth, Australia). Project
No. 1486, 23 pp.
Arkhipova, G. P., Kogan, I. A. and Tagunov, A. A. (1975), Autoclave oxidation of
arsenopyrite in gold-containing products. Tr. Vses. Nauch.-Issled. Inst. Zolota
Redk. Metal., 35: 454-461.
Aylmore, M. G. and Muir, D. M. (2001), Thiosulfate leaching of gold- A review. Miner.
Eng., 14 (2): 135-174.
Bailar, J. C., Emeleus, H. J., Nyholm, R. and Trotman-Dickenson, A. F. (1973),
Comprehensive Inorganic Chemistry. Vol. 3 and 4, (Pergamon: Oxford, England).

References 297
Bailey, L. K. and Peters, E. (1976), Decomposition of pyrite in acids by pressure
leaching and anodization: the case for an electrochemical mechanism. Can. Metall.
Q., 15 (4): 333-344.
Balaz, P. (2000), Extractive Metallurgy of Activated Minerals. (Elsevier: Amsterdam).
290 pp.
Balaz, P. and Liddell, K. (1999), Ultrafine grinding in the processes of gold recovery.
Miner. Slovaca, 31 (3-4): 337-340.
Barbosa-Filho, O., Trindade, R. B. E. and Araujo, V. V. (1995), Dissolution of gold by
thiosulfate: A study with a rotating disk. In Congresso Anual - Associacao
Brasileira de Metalurgia e Materiais, Sao Paulo. Vol. 4 (Tecnologia Mineral e
Tratamento de Residuos de Processos ; Reciclagem de Materiais Metalicos).
(Associacao Brasileira de Metalurgia e Materiais: Sao Paulo, Brazil). pp 265-279.
Barbosa-Filho, O. and Monhemius, A. J. (1994a), Leaching of gold in thiocyanate
solutions - Part 1: chemistry and thermodynamics. Trans. Inst. Min. Metall., Sect.
C, 103 (May-Aug.): C105-C110.
Barbosa-Filho, O. and Monhemius, A. J. (1994b), Leaching of gold in thiocyanate
solutions - Part 2: redox processes in iron(III)--thiocyanate solutions. Trans. Inst.
Min. Metall., Sect. C, 103 (May-Aug.): C111-C116.
Barbosa-Filho, O. and Monhemius, A. J. (1994c), Leaching of gold in thiocyanate
solutions - Part 3: rates and mechanism of gold dissolution. Trans. Inst. Min.
Metall., Sect. C, 103 (May-Aug.): C117-C125.
Barin, I. (1989), Thermochemical Data of Pure Substances, (VCH: Weinheim, Federal
Republic of Germany). 94 pp.
Barkley, D. J., Charbonneau, J. R., chenier, M. J., Glasgow, C. C. and Graham, J. A.
(1993), Study of permanently coated columns for the high-performance liquid
chromatographic determinations of sulfur anions in environmental samples from
metallurgical processes. J. Chromatogr., 642: 371-377.
Barton, P. B. (1969), Thermochemical study of the system Fe-As-S. Geochim.
Cosmochim. Acta, 33: 841-857.
Beattie, M. J. V. and Poling, G. W. (1987), A study of the surface oxidation of
arsenopyrite using cyclic voltammetry. Intl. J. Miner. Process., 20 (1-2): 87-108.
Beattie, M. J. V., Raudsepp, R., Sarkar, K. M. and Childs, A. M. (1985), The arseno
process for refractory gold ores. In Impurity Control and Disposal, Proc. 15th CIM
Annu. Hydrometall. Meet., Vancouver, Vol. 9. (Ed.) Oliver, A. (Can. Inst. Min.
Metall. Soc., Hydrometall. Sect.: Montreal, Quebec, Canada). pp 1-11.

References 298
Berezowsky, R. M., Sefton, V. B. and Gormely, L. S. (1978), Recovery of precious
metals from metal sulfides. US Patent No 4070182. 13 pp.
Berezowsky, R. M. G. S. and Sefton, V. B. (1979), Recovery of gold and silver from
oxidation leach residues by ammoniacal thiosulfate leaching. Paper presented at
108th AIME Annu. Meet., New Orleans. (Amer. Inst. Min. Metall. Petroleum
Engrs., Inc.: New York, USA). 17 pp.
Bhakta, P., Langhans, J. W., Jr. and Lei, K. P. V. (1989), Alkaline oxidative leaching of
gold-bearing arsenopyrite ores. U.S. Bur. Mines Rep. Invest., RI 9258, 16 pp.
Bocharov, V. A. and Golikov, A. A. (1967), Oxidation of sulfide minerals during
grinding. Tsvetn. Met., 40 (7): 26-31.
Bou, C., Cruells, M., Romero, M. T. and Vinals, J. (1998), Kinetics of the interaction of
gold chloride solutions on arsenopyrite. Hydrometallurgy, 48 (3): 343-360.
Breuer, P. L. and Jeffrey, M. I. (2000), Thiosulfate leaching kinetics of gold in the
presence of copper and ammonia. Miner. Eng., 13 (10-11): 1071-1081.
Breuer, P. L. and Jeffrey, M. I. (2002), An electrochemical study of gold leaching in
thiosulfate solutions containing copper and ammonia. Hydrometallurgy, 65 (2-3):
145-157.
Breuer, P. L. and Jeffrey, M. I. (2003) Copper catalyzed oxidation of thiosulfate by
oxygen in gold leach solutions. Miner. Eng., 16 (1): 21-30.
Breuer, P. L., Jeffrey, M. I., Tan, E. H. K. and Bott, A. W. (2002), The electrochemical
quartz crystal microbalance as a sensor in the gold thiosulfate leaching process. J.
Appl. Electrochem., 32 (10): 1167-1174.
Buckley, A. N. and Walker, G. W. (1988), The surface composition of arsenopyrite
exposed to oxidizing environments. Appl. Surf. Sci., 35 (2): 227-240.
Buckley, A. N. and Woods, R. (1987), The surface oxidation of pyrite. Appl. Surf. Sci.,
27 (4): 437-452.
Burkin, A. R. (1966), The Chemistry of Hydrometallurgical Processes. (E. & F. N.:
Spon, London). 157 pp.
Burkin, A. R. and Edwards, A. M. (1963), The formation of insoluble iron oxide coatings
during the alkali pressure leaching of pyrite. In 6th International Congress of
Mineral Processing, Cannes, France. (Ed.) Roberts, A. (Pergamon: New York,
USA). pp 199-209.
Byerley, J. J., Fouda, S. A. and Rempel, G. L. (1973), Kinetics and mechanism of the
oxidation of thiosulfate ions by copper(II) ions in aqueous ammonia solution. J.
Chem. Soc., Dalton Trans., (8): 889-893.

References 299
Byerley, J. J., Fouda, S. A. and Rempel, G. L. (1975), Activation of copper(II) ammine
complexes by molecular oxygen for the oxidation of thiosulfate ions. J. Chem.
Soc., Dalton Trans., (13): 1329-1338.
Caldeira, C. L., Ciminelli, V. S. T., Dias, A. and Osseo-Asare, K. (2003), Pyrite
oxidation in alkaline solutions: nature of the product layer. Intl. J. Miner. Process.,
72 (1-4): 373-386.
Cao, C., Hu, J. and Gong, Q. (1992), Leaching gold by low concentration thiosulfate
solution. In Randol Gold Forum '92, Vancouver. (Randol Intl. Ltd.: Golden, CO,
USA). pp 293-298.
Cases, J. M., Donato, P. D., Kongolo, M. and Michot, L. J. (1993), Interaction between
finely ground pyrite with potassium amylxanthate in flotation: Influence of pH,
grinding media and collector concentration. In XVIII International Mineral
Processing Congress, Publ. Series No. 3/93, Vol.5. (Australas. Inst. Min. Metall.:
Parkville, Vic). pp 663-668.
Chen, J., Deng, T., Zhu, G. and Zhao, J. (1996), Leaching and recovery of gold in
thiosulfate based system: A research summary at ICM. Trans. Indian Inst. Met., 49
(6): 841-849.
Chen, J. J. and Pang, X. T. (1997), Study on leaching of gold from calcine of copper
bearing pyrite by thiocyanate. Huangjin, 18 (3): 33-37.
Chen, K. Y. and Morris, J. C. (1972), Kinetics of oxidation of aqueous sulfide by
oxygen. Environ. Sci. Technol., 6 (6): 529-537.
Chilton, C. H. (1958), Leach licks arsenic bugaboo in metal ore. Chem. Eng. (N.Y.), 65
(1): 80-82.
Ciminelli, V. S. T. (1987), Oxidation of pyrite in alkaline solutions and heterogeneous
equilibria of sulfur- and arsenic-containing minerals in cyanide solutions. PhD
Thesis. (The Pennsylvania State University: University Park, PA, USA). 234 pp.
Ciminelli, V. S. T. and Osseo-Asare, K. (1986), Kinetics of pyrite oxidation by oxygen
in sodium carbonate solution. In Hydrometallurgical Reactor Design and Kinetics,
Proc. Metall. Soc. Annu. Meet., New Orleans. (Eds) Bautista, R. G., Weseley, R. J.
and Warren, G. W. (The Metallurgical Society, Inc.: Warrendale, PA, USA). pp
129-147.
Ciminelli, V. S. T. and Osseo-Asare, K. (1995a), Kinetics of pyrite oxidation in sodium
carbonate solutions. Metall. Mater. Trans. B, 26B (2): 209-218.
Ciminelli, V. S. T. and Osseo-Asare, K. (1995b), Kinetics of pyrite oxidation in sodium
hydroxide solutions. Metall. Mater. Trans. B, 26B (4): 677-685.

References 300
Clarke, M. B. and Helz, G. R. (2000), Metal-thiometalate transport of biologically active
trace elements in sulfidic environments. 1. Experimental evidence for copper
thioarsenite complexing. Environ. Sci. Technol., 34 (8): 1477-1482.
Cornelis, K., Hurlbut, C. S. and Dana, J. D. (1985), Manual of Mineralogy (after James
D. Dana). 20th Edition. (John Wiley and Sons: New York, USA). 596 pp.
Corrans, I. J. and Angove, J. E. (1991), Ultra fine milling for the recovery of refractory
gold. Miner. Eng., 4 (7-11): 763-776.
Cotton, F. A. and Wilkinson, G. (1988), Advanced Inorganic Chemistry: A
Comprehensive Text. 5th Edition. (John Wiley - Interscience Publ.: New York,
USA). 1455 pp.
Craig, J. R. and Vaughan, D. J. (1990), Compositional and textural variations of the
major iron and base-metal sulphide minerals. In Sulphide Deposits. (Ed.) Gray, P.
M. J. (Instn. Min. Metall.: London, UK). pp 1-16.
Dadgar, A. (1989), Refractory concentrate gold leaching: cyanide vs. bromine. J. Metals,
41 (12): 37-41.
Damjanovic, A., Genshaw, M. A. and Bockris, J. O’M. (1967), Hydrogen peroxide
formation in oxygen reduction at gold electrodes. II. Alkaline solution. J.
Electroanal. Chem., 15 (2/3): 173-180.
Davis, A. and Tran, T. (1991), Gold dissolution in iodide electrolytes. Hydrometallurgy,
26 (2): 163-177.
Davis, A., Tran, T. and Young, D. R. (1993), Solution chemistry of iodide leaching of
gold. Hydrometallurgy, 32 (2): 143-159.
De Jager, N. and Nicol, M. J. (1997), A novel electrometallurgical process for the
treatment of refractory gold concentrates. In Aqueous Electrotechnologies:
Progress in Theory and Practice, Proc. TMS Annu. Meet., Orlando. (TMS:
Warrendale, PA, USA). pp.401-420.
Deng, T. (1992), Chemical oxidation of iron sulphide minerals for metals recovery.
Miner. Proc. Extra. Metall. Rev., 10: 325-345.
Deng, T. (1995), Aqueous pressure oxidation of minerals - A salient development in
hydrometallurgy. Miner. Proc. Extra. Metall. Rev., 12: 185-222.
Dhawale, S. W. (1993), Thiosulfate: an interesting sulfur oxoanion that is useful in both
medicine and industry - but is implicated in corrosion. J. Chem. Educ., 70 (1): 12-
14.
Dove, P. M. and Rimstidt, J. D. (1985), The solubility and stability of scorodite,
FeAsO4·2H2O. Am. Mineral., 70 (7-8): 838-844.

References 301
Dunn, J. G. and Chamberlain, A. C. (1997), The recovery of gold from refractory
arsenopyrite concentrates by pyrolysis-oxidation. Miner. Eng., 10 (9): 919-928.
Dunn, J. G., Graham, J. and Linge, H. G. (1989), The treatment of refractory gold ore.
Chem. Australia, 56 (11): 401-404.
Eary, L. E. (1992), The solubility of amorphous As2S3 from 25 to 90 oC. Geochim.
Cosmochim. Acta, 56 (6): 2267-2280.
Ennaoui, A., Fiechter, S., Jaegermann, W. and Tributsch, H. (1986),
Photoelectrochemistry of highly quantum efficient single-crystalline n-FeS2
(pyrite). J. Electrochem. Soc., 133 (1): 97-106.
Fang, Z.-h. and Han, B.-l. (2002), Leaching gold using oxidation products of elemental
sulfur in Ca(OH)2 solution under oxygen pressure. Guocheng Gongcheng Xuebao,
2 (3): 230-234.
Fernandez, P. G. (1992), The oxidation of arsenopyrite in acid. PhD Thesis. (Curtin
University of Technology: Bentley, Western Australia). 187 pp.
Fernandez, P. G., Linge, H. G. and Wadsley, M. W. (1996a), Oxidation of arsenopyrite
(FeAsS) in acid. Part I. Reactivity of arsenopyrite. J. Appl. Electrochem., 26 (6):
575-583.
Fernandez, P. G., Linge, H. G. and Willing, M. J. (1996b), Oxidation of arsenopyrite
(FeAsS) in acid. Part II. Stoichiometry and reaction scheme. J. Appl. Electrochem.,
26 (6): 585-591.
Fleming, C., Wells, J. and Thomas, K. G. (2002), Gold recovery from thiosulfate leach
solutions and slurries using ion-exchange resin eluted with polythionate. US Patent
No 6344068. 12 pp.
Fleming, C. A. (1986), A process for the simultaneous recovery of gold and uranium
from South African ores. In Gold 100, Vol.2: Extractive Metallurgy of Gold. (Ed.)
Fivaz, C. E. (S. Afr. Inst. Min. Metall.: Johannesburg, S. Afr.). pp 301-319.
Fleming, C. A. (1998), Thirty years of turbulent change in the gold industry. CIM Bull.,
91 (1025): 55-67.
Flett, D. S., Derry, R. and Wilson, J. C. (1983), Chemical study of thiosulfate leaching of
silver sulfide. Trans. Inst. Min. Metall., Sect. C, 92 (Dec.): 216-223.
Fraser, K. S., Walton, R. H. and Wells, J. A. (1991), Processing of refractory gold ores.
Miner. Eng., 4 (7-11): 1029-1041.
Gallagher, N. P., Hendrix, J. L., Milosavljevic, E. B., Nelson, J. H. and Solujic, L.
(1990), Affinity of activated carbon towards some gold(I) complexes.
Hydrometallurgy, 25 (3): 305-316.

References 302
Gasparrini, C. (1983), The mineralogy of gold and its significance in metal extraction.
CIM Bull., 76 (851): 144-153.
Gilbert, S. R., Bounds, C. O. and Ice, R. R. (1987), Comparative economics of bacterial
leaching and roasting for an auriferous pyrite concentrate. In BIOMINET, Proc.
Annu. Gen. Meet., CANMET Spec. Publ. 86-9. (CANMET: Ottawa, Canada). pp
53-70.
Glasstone, S. and Hickling, A. (1932), Studies in electrolytic oxidation. Part I. The
electrolytic oxidation of sodium thiosulfate at a platinum anode. J. Chem. Soc., :
2345-2356.
Goldhaber, M. B. (1983), Experimental study of metastable sulfur oxyanion formation
during pyrite oxidation at pH 6-9 and 30 oC. Amer. J. Sci., 283 (3): 193-217.
Greenwood, N. N. and Earnshaw, A. (1997), Chemistry of the Elements. (Butterworth-
Heinemann: Oxford, UK). 547 pp.
Grigor'eva, T. A. and Sukneva, L. S. (1981), Effect of sulfur, antimony trisulfide and
arsenic trisulfide on gold solubility. Geokhimiya, (10): 1534-1540.
Groenewald, T. (1975), Electrochemical studies on gold electrodes in acidic solutions of
thiourea containing gold(I) thiourea complex ions. J. Appl. Electrochem., 5 (1): 71-
78.
Guan, Y. C. and Han, K. N. (1995), The electrochemical study of the deposition of gold
onto copper and zinc in ammoniacal solutions. J. Electrochem. Soc., 142 (4): 1139-
1144.
Guan, Y. C. and Han, K. N. (1996), The electrochemical study on the dissolution
behavior of gold in ammoniacal solutions at temperatures above 100 oC. J.
Electrochem. Soc., 143 (6): 1875-1880.
Guresin, N. (1999), The oxidation of arsenopyrite by iron (VI) in alkaline solution.
Report for the A. J. Parker CRC for Hydrometallurgy. (Murdoch University: Perth,
Western Australia). 170 pp.
Hamilton, I. C. and Woods, R. (1981), An investigation of surface oxidation of pyrite
and pyrrhotite by linear potential sweep voltammetry. J. Electroanal. Chem., 118:
327-343.
Hamilton, I. C. and Woods, R. (1983), An investigation of the deposition and reactions
of sulfur on gold electrodes. J. Appl. Electrochem., 13 (6): 783-794.
Han, K. N. and Meng, X. (1992), Extraction of gold and silver from ores and other
materials using ammonia as solvent. US Patent No 5114687. 5 pp.

References 303
Hancock, R. D., Finkelstein, N. P. and Evers, A. (1974), Linear free energy relations in
aqueous complex-formation reactions of the d10 metal ions. J. Inorg. Nucl. Chem.,
36 (11): 2539-2543.
Helz, G. R., Tossell, J. A., Charnock, J. M., Pattrick, R. A. D., Vaughan, D. J. and
Garner, C. D. (1995), Oligomerization in As(III) sulfide solutions: theoretical
constraints and spectroscopic evidence. Geochim. Cosmochim. Acta, 59 (22):
4591-4604.
Hemmati, M., Hendrix, J. L., Nelson, J. H. and Milosavljevic, E. B. (1989), Study of the
thiosulfate leaching of gold from carbonaceous ore and the quantitative
determination of thiosulfate in the leached solution. In Extractive Metallurgy '89.
(Instn. Min. Metall.: London, UK). pp 665-678.
Hiskey, J. B. and Atluri, V. P. (1988), Dissolution chemistry of gold and silver in
different lixiviants. Miner. Proc. Extra. Metall. Rev., 4: 95-134.
Hiskey, J. B. and Sanchez, V. M. (1995), Alkaline pressure oxidation of a gold-bearing
arsenopyrite concentrate. Miner. Prec. Extra. Metall. Rev., 15 (1-4): 61-74.
Hiskey, J. B. and Schlitt, W. J. (1982), Aqueous oxidation of pyrite. In Interfacing
Technology in Solution Mining, Proc. 2nd SME-SPE Intl. Solution Min. Symp.
(Eds) Schlitt, W. J. and Hiskey, J. B. (SME-AIME: Littleton, CO, USA). pp 55-74.
Hiskey, J. B. and Wadsworth, M. E. (1981), Electrochemical processes in the leaching of
metal sulfides and oxides. In Process and Fundamental Considerations of Selected
Hydrometallurgical Systems. (Ed.) Kuhn, M. C. (SME-AIME: New York, USA).
pp 304-325.
Hogfeldt, E. (1982), Stability constants of metal-ion complexes. Part A: Inorganic
ligands. In IUPAC Chemical Data Series, No.21. (Pergamon: Oxford, UK).
Hopf, F. R., Rogic, M. M. and Wolf, J. F. (1983), Kinetic study of the reduction of
molecular oxygen by cuprous chloride and cuprous acetate in pyridine. J. Phys.
Chem., 87 (23): 4681-4686.
Hu, J. and Gong, Q. (1991), Substitute sulfate for sulfite during extraction of gold by
thiosulfate solution. In Randol Gold Forum '91, Cairns. (Randol Intl. Ltd.: Golden,
CO, USA). pp 333-336.
Huang, Y., Wang, W. and Qian, X. (1999), Pretreatment of refractory gold ore with
ultra-fine grinding. Huangjin, 20 (3): 28-31.
Hunter, R. M., Stewart, F. M., Darsow, T. and Fogelsong, M. L. (1996), Leaching
method and apparatus for recovery of precious metals from ores using hydrogen
sulfide in solution from anaerobic bacteria. WO Patent No 9600308. 46 pp.

References 304
Hunter, R. M., Stewart, F. M., Darsow, T., Fogelsong, M. L., Mogk, D. W., Abbott, E.
H. and Young, C. A. (1998), New alternative to cyanidation: biocatalyzed bisulfide
leaching. Miner. Proc. Extra. Metall. Rev., 19 (1-4): 183-197.
Jeffrey, M. I. (2001), Kinetic aspects of gold and silver leaching in ammonia-thiosulfate
solutions. Hydrometallurgy, 60 (1): 7-16.
Jeffrey, M. I., Breuer, P. L. and Choo, W. L. (2001), A kinetic study that compares the
leaching of gold in the cyanide, thiosulfate, and chloride systems. Metall. Mater.
Trans. B, 32B (6): 979-986.
Jeffrey, M. I. and Ritchie, I. M. (2000), Leaching of gold in cyanide solutions in the
presence of impurities. I. The effect of lead. J. Electrochem. Soc., 147 (9): 3257-
3262.
Jiang, T., Chen, J. and Xu, S. (1991), Electrochemistry of gold leaching with thiosulfate.
(I). Behaviour and mechanism of anodic dissolution of gold. Huangjin, 12 (9): 41-
45.
Jiang, T., Chen, J. and Xu, S. (1993a), Electrochemistry and mechanism of leaching gold
with ammoniacal thiosulfate. In XVIII International Mineral Processing Congress,
Publ. Series No. 3/93, Vol.5. (Australas. Inst. Min. Metall.: Parkville, Vic). pp
1141-1146.
Jiang, T., Jin, C. and Shi, X. (1993b), A kinetic study of gold leaching with thiosulfate.
In Hydrometallurgy: Fundamentals, Technology and Innovations, Proc. 4th Milton
E. Wadsworth Intl. Symp. (Eds) Hiskey, J. B. and Warren, G. W. (Soc. Min.
Metall. Explor., Inc.: Littleton, CO, USA). pp 119-126.
Jiang, T., Xu, S., Chen, J. and Wu, Z. (1992), A theoretical study on gold extraction by
thiosulfate leaching: chemical and thermodynamical principles of gold leaching.
Huangjin, 13 (2): 31-34.
Kakovskii, I. A. (1957), The theory of hydrometallurgy of the noble metals. Izv. Akad.
Nauk S.S.S.R., Otd. Tekh. Nauk, (7): 29-34.
Kakovskii, I. A. and Kosikov, E. M. (1975), Study of the kinetics of oxidation of some
sulfide minerals. Obogashch. Rud, 20 (3): 18-21.
Kakovskii, I. A. and Tyurin, N. G. (1962), Reaction of gold in polysulfide solution at
elevated temperatures and pressures. Izv. Vyssh. Uchebn. Zaved., Tsvetn. Met., 5
(2): 104-111.
Kerley, B. J., Jr. (1981), Recovery of precious metals from difficult ores. US Patent No
4269622. 5 pp.

References 305
Kerley, B. J., Jr. (1983), Recovery of precious metals from difficult ores. US Patent No
4369061. 7 pp.
Kim, S. K. and Sohn, Y. S. (1990), Extraction of gold from a gold ore by ammonium
thiosulfate leaching. J. Korean Inst. Met., 28 (12): 1048-1053.
King, R. B. (1994), Encyclopedia of Inorganic Chemistry. Vol. 3. (John Wiley & Sons:
Chichester, UK). 1054 pp.
Klemenc, A. (1939), Electrolytic reactions at the anode as the effect of the hydroxyl. Z.
Physik. Chem., A185: 1-36.
Kontopoulos, A. and Stefanakis, M. (1989), Process selection for the Olympias
refractory gold concentrate. In Precious Metals ’89. (Eds) Jha, M. C., and Hill, S.
D. (TMS: Warrendale, PA, USA). pp 179-209.
Kontopoulos, A. and Stefanakis, M. (1990), Process options for refractory sulfide gold
ores: technical, environmental and economic aspects. In EPD Congress 1990,
Proc. TMS Annu. Meet., Anaheim. (Ed.) Gaskell, D. R. (TMS: Warrendale, PA,
USA). pp 393-412.
Koslides, T. and Ciminelli, V. S. T. (1992), Pressure oxidation of arsenopyrite and pyrite
in alkaline solutions. Hydrometallurgy, 30 (1-3): 87-106.
Kostina, G. M. and Chernyak, A. S. (1976), Electrochemical conditions for the oxidation
of pyrite and arsenopyrite in alkaline and acid solutions. Zh. Prikl. Khim.
(Leningrad), 49 (7): 1534-1539.
Kostina, G. M. and Chernyak, A. S. (1979), Study of the mechanism of electrochemical
oxidation of arsenopyrite and pyrite in caustic soda solutions. Zh. Prikl. Khim.
(Leningrad), 52 (7): 1532-1535.
Krause, E. and Ettel, V. A. (1989), Solubilities and stabilities of ferric arsenate
compounds. Hydrometallurgy, 22 (3): 311-337.
Krauskopf, K. B. (1951), The solubility of gold. Econ. Geol., 46: 858-870.
Kudryk, V. and Kellogg, H. H. (1954), Mechanism and rate-controlling factors in the
solution of gold in cyanide solution. J. Metals, 6: 541-548.
Kuzmina, N. N. and Songina, O. A. (1963), Oxidation of sulfite, sulfide, and thiosulfate
at a rotating platinum anode. Izv. Vyssh. Uchebn. Zaved., Khim. Khim. Tekhnol., 6
(2): 201-208.
Lakin, H. W., Curtin, G. C., Hubert, A. E., Shacklette, H. T. and Doxtader, K. G. (1974),
Geochemistry of gold in the weathering cycle. U.S. Geol. Survey Bull., Vol. 1330.
80 pp.

References 306
Lan, X. and Zhang, J. (1996), Method for extracting precious metals with modified lime-
sulfur mixture. Faming Zhuanli Shenqing Gongkai Shuomingshu, (Xi'an Uni.
Archit. Sci. Technol., China). CN Patent No 1128296. 7 pp.
Langhans, J. W., Jr., Lei, K. P. V. and Carnahan, T. G. (1992), Copper-catalyzed
thiosulfate leaching of low-grade gold ores. Hydrometallurgy, 29 (1-3): 191-203.
Lawrence, R. W. and Bruynesteyn, A. (1983), Biological preoxidation to enhance gold
and silver recovery from refractory pyritic ores and concentrates. CIM Bull., 76
(857): 107-110.
Lazaro-Baez, M. I. (2001), Electrochemistry of the leaching of chalcopyrite. PhD Thesis.
(Murdoch University: Perth, Western Australia). 311 pp.
Levenspiel, O. (1999), Chemical Reaction Engineering. (John Wiley & Sons: New York,
USA). 668 pp.
Li, J. and Wadsworth, M. E. (1993), Raman spectroscopy of electrochemically oxidized
pyrite and optimum conditions for sulfur formation. In Hydrometallurgy:
Fundamentals, Technology and Innovations, Proc. 4th Milton E. Wadsworth Intl.
Symp. (Eds) Hiskey, J. B. and Warren, G. W. (Soc. Min. Metall. Explor., Inc.:
Littleton, CO, USA). pp 127-141.
Li, X., Ke, J., Meng, X. and Li, B. (1992), Chlorine leaching of gold-bearing sulfide
concentrate and its calcine. Hydrometallurgy, 29 (1-3): 205-215.
Liddell, K. S. (1989), Development of the metprotech ultra-fine milling process. In The
Role of the Practical Metallurgist. (Mine Metall. Managers Assoc.: Johannesburg,
S. Afr.). pp 56-60.
Lin, H. K., Sohn, H. Y. and Wadsworth, M. E. (1986), The kinetics of leaching of
chalcopyrite and pyrite grains in primary copper ore by dissolved oxygen. In
Hydrometallurgical Reactor Design and Kinetics, Proc. Metall. Soc. Annu. Meet.,
New Orleans. (Eds) Bautista, R. G., Weseley, R. J. and Warren, G. W. (The
Metallurgical Society, Inc.: Warrendale, PA, USA). pp 149-168.
Linge, H. G. and Jones, W. G. (1993), Electrolytic oxidation of arsenopyrite slurries.
Miner. Eng., 6 (8-10): 873-882.
Linge, H. G. and Welham, N. J. (1997), Gold recovery from a refractory arsenopyrite
(FeAsS) concentrate by in-situ slurry oxidation. Miner. Eng., 10 (6): 557-566.
Liu, G. Q. and Yen, W. T. (1995), Effects of sulphide minerals and dissolved oxygen on
the gold and silver dissolution in cyanide solution. Miner. Eng., 8 (1/2): 111-123.
Liu, J. Q. and Nicol, M. J. (2002), Thermodynamics and kinetics of the dissolution of
gold under pressure oxidation conditions in the presence of chloride. In Chloride

References 307
Metallurgy 2002: Practice and Theory of Chloride/Metal Interaction, Proc. 32nd
Annu. Hydrometall. Meet., Vol.1. (Eds) Peek, E. M. L. and Van Weert, G.
(Metallurgical Society: Montreal, QC, Canada). pp 41-54.
Loeken, S. and Tremel, W. (1998), K2AuPS4, Tl2AuPS4, K2AuAsS4, and KAu5P2S8.
Syntheses, structure, and properties of quaternary gold thiophosphate and
thioarsenate compounds. Eur. J. Inorg. Chem., (2): 283-289.
Lorenzen, L. and Van Deventer, J. S. J. (1992), Electrochemical interactions between
gold and its associated minerals during cyanidation. Hydrometallurgy, 30 (1-3):
177-194.
Loucka, T. (1998), Adsorption and oxidation of thiosulfate on a platinum electrode in
acid solution. Collect. Czech. Chem. Commun., 63: 20-30.
Lowson, R. T. (1982), Aqueous oxidation of pyrite by molecular oxygen. Chem. Rev.,
(5): 461-497.
Luganov, V. A., Plakhin, G. A., Luganov, A. V. and Gorbatenko, G. V. (1996),
Oxidizing roasting of arsenic gold bearing concentrates with the soda presence. In
Randol Gold Forum '96, Olympic Valley. (Ed.) McPherson, N. N. (Randol Intl.
Ltd.: Golden, CO, USA). pp 253-256.
Lulham, J. P. (1989), Gold recovery from pyritic ores by alkaline leaching. EP Patent No
316094. (Eur. Pat. Appl.). 8 pp.
Luther III, G. W. (1987), Pyrite oxidation and reduction: Molecular orbital theory
considerations. Geochim. Cosmochim. Acta, 51 (12): 3193-3199.
Lyons, D. and Nickless, G. (1968), Lower oxy-acids of sulfur. In Inorganic Sulphur
Chemstry. (Ed.) Nickless, G. (Elsevier: Amsterdam). pp 509-533.
Macintyre, J. E. (1992), Dictionary of Inorganic Compounds. Vol. 1. (Chapman & Hall:
London, UK). pp 76-131.
Malatt, K. A. (1999), Bacterial oxidation of pure arsenopyrite by a mixed culture. In
Biohydrometallurgy and the Environment Toward the Mining of the 21st Century.
(Eds) Amils, R. and Ballester, A. (Elsevier: Amsterdam). pp 411-421.
Mao, A., Qiu, G., Deng, Z., Shi, X., Xu, J. and Wang, D. (1997), One-step leaching of
some refractory gold concentrate containing arsenic and theory analysis. J. Centr.
S. Uni. Technol. China (English Ed.), 4 (2): 92-95.
Marsden, J. and House, I. (1992), The Chemistry of Gold Extraction. (Ellis Horwood
Ltd.: London, UK). 597 pp.
Martell, A. E. and Smith, R. M. (1982), Critical Stability Constants, Vol. 5: First
Supplement. (Plenum Press: New York, USA). 413 pp.

References 308
Mason, P. G., Pendreigh, R., Wicks, F. D. and Kornze, L. D. (1984), Selection of the
process flowsheet for the Mercur gold plant. In Precious Metals: Mining,
Extraction and Processing. (Eds) Kudryk, V., Corrigan, D. A. and Liang, W.
(Metall. Soc. AIME: Warrendale, PA, USA). pp 435-445.
McAuliffe, C. A. (1987), Phosphorus, arsenic, antimony and bismuth ligands. In
Comprehensive Coordination Chemistry, Vol. 2. (Eds) Wilkinson, G., Gillard, R.
D. and McCleverty, J. A. (Pergamon: Oxford, London). pp. 293; 989-1066.
McKibben, M. A. and Barnes, H. L. (1986), Oxidation of pyrite in low temperature
acidic solutions: Rate laws and surface textures. Geochim. Cosmochim. Acta, 50
(7): 1509-1520.
Mellor, J. W. (1929), A Comprehensive Treatise on Inorganic and Theoretical
Chemistry, Vol. III and IX. (Longman Group: London, UK).
Meng, X. and Han, K. N. (1993), The dissolution behavior of gold in ammoniacal
solutions. In Hydrometallurgy: Fundamentals, Technology and Innovations, Proc.
4th Milton E. Wadsworth Intl. Symp. (Eds) Hiskey, J. B. and Warren, G. W. (Soc.
Min. Metall. Explor., Inc.: Littleton, CO, USA). pp 205-221.
Meyer, R. E. (1979), Electrochemistry of iron sulfide (FeS2). J. Electroanal. Chem., 101
(1): 59-71.
Michell, D. and Woods, R. (1978), Analysis of oxidized layers on pyrite surfaces by x-
ray emission spectroscopy and cyclic voltammetry. Aust. J. Chem., 31 (1): 27-34.
Min, X., Chai, L., Zhong, H. and Zhang, C. (1999), New technology of ball milling alkali
treatment, cyanide leaching for arsenic refractory gold concentrates. Huangjin, 20
(2): 31-34.
Mishra, K. K. and Osseo-Asare, K. (1988), Aspects of the interfacial electrochemistry of
semiconductor pyrite (FeS2). J. Electrochem. Soc., 135 (10): 2502-2509.
Miura, Y., Saitoh, A. and Koh, T. (1997), Determination of sulfur oxyanions by ion
chromatography on a silica ODS column with tetrapropylammonium salt as an ion-
pairing reagent. J. Chromatogr. A, 770 (1 + 2): 157-164.
Morimoto, N. and Clark, L. A. (1961), Arsenopyrite crystal - chemical relations. Am.
Mineral., 46: 1449-1469.
Moses, C. O., Nordstrom, D. K., Herman, J. S. and Mills, A. L. (1987), Aqueous pyrite
oxidation by dissolved oxygen and by ferric iron. Geochim. Cosmochim. Acta, 51
(6): 1561-1571.
Mycroft, J. R., Bancroft, G. M., McIntyre, N. S., Lorimer, J. W. and Hill, I. R. (1990),
Detection of sulfur and polysulfides on electrochemically oxidized pyrite surfaces

References 309
by x-ray photoelectron spectroscopy and Raman spectroscopy. J. Electroanal.
Chem., 292 (1-2): 139-152.
Nagpal, S., Dahlstrom, D. and Oolman, T. (1994), A mathematical model for the
bacterial oxidation of a sulfide ore concentrate. Biotechnol. Bioeng., 43 (5): 357-
364.
Nagy, I., Mrkusic, P. and McCullock, H. W. (1966), Chemical treatment of refractory
gold ores: Literature survey. (National Institute for Metallurgy: Johannesburg, S.
Afr.). Report No.38. 87 pp.
Naito, K., Hayata, H. and Mochizuki, M. (1975), Reactions of polythionates: Kinetics of
the cleavage of trithionate ion in aqueous solutions. J. Inorg. Nucl. Chem., 37 (6):
1453-1457.
Naito, K., Yoshida, M., Shieh, M.-C. and Okabe, T. (1970), Chemical behavior of low
valence sulfur compounds. III. Production of ammonium sulfamate by the
oxidation of ammonium thiosulfate. Bull. Chem. Soc. Jap., 43 (5): 1365-1372.
Narita, E., Lawson, F. and Han, K. N. (1983), Solubility of oxygen in aqueous electrolyte
solutions. Hydrometallurgy, 10: 21-37.
Nekrasov, I. Y. (1996), Geochemistry, Mineralogy and Genesis of Gold Deposits. (A.A.
Balkema: Rotterdam). 329 pp.
Nekrasov, I. Y. and Gamyanin, G. N. (1978), Relation between gold and cobalt
mineralization in arsenide formation deposits. Dokl. Akad. Nauk SSSR, 243 (3):
752-755.
Nesbitt, H. W., Muir, I. J. and Pratt, A. R. (1995), Oxidation of arsenopyrite by air and
air-saturated, distilled water, and implications for mechanism of oxidation.
Geochim. Cosmochim. Acta, 59 (9): 1773-1786.
Nickel, E. H. (1968), Structural stability of minerals with the pyrite, marcasite,
arsenopyrite, and loellingite structures. Can. Mineral., 9 (3): 311-321.
Nicol, M. J. (1980a), The anodic behavior of gold. Part I. Oxidation in acidic solutions.
Gold Bull., 13 (2): 46-55.
Nicol, M. J. (1980b), The anodic behavior of gold. Part II. Oxidation in alkaline
solutions. Gold Bull., 13 (3): 105-111.
Nicol, M. J. (1993), The role of electrochemistry in hydrometallurgy. In
Hydrometallurgy: Fundamentals, Technology and Innovations, Proc. 4th Milton E.
Wadsworth Intl. Symp. (Eds) Hiskey, J. B. and Warren, G. W. (Soc. Min. Metall.
Explor., Inc.: Littleton, CO, USA). pp 43-62.

References 310
Nicol, M. J., Fleming, C. A. and Paul, R. L. (1987), The chemistry of the extraction of
gold. In The Extractive Metallurgy of Gold in South Africa. Vol. 2. (Ed.) Stanley,
G. G. (S. Afr. Inst. Min. Metall.: Johannesburg, S. Afr.). pp 831-905.
Nicol, M. J. and Guresin, N. (2000), A novel approach to the oxidation of arsenical
refractory gold concentrates. In Minor Elements 2000: Processing and
Environmental Aspects of As, Sb, Se, Te and Bi. (Ed.) Young, C. A. (Soc. Min.
Metall. Explor., Inc.: Littleton, CO, USA). pp 157-169.
Nicol, M. J. and Guresin, N. (2003), Anodic behaviour of arsenopyrite and cathodic
reduction of ferrate(VI) and oxygen in alkaline solutions. J. Appl. Electrochem.,
33:1017-1024.
Nicol, M. J. and Lazaro, I. (2002), The role of EH measurements in the interpretation of
the kinetics and mechanisms of the oxidation and leaching of sulfide minerals.
Hydrometallurgy, 63:15-22.
Nicol, M. J., Needes, C. R. S. and Finkelstein, N. P. (1975), Electrochemical model for
the leaching of uranium dioxide. 1. Acid media. In Leaching and Reduction in
Hydrometallurgy. (Instn. Min. Metall.: London, UK). pp 1-11.
Nicol, M. J. and O'Malley, G. P. (2001), Recovery of gold from thiosulfate solutions and
pulps with ion-exchange resins. In Cyanide: Social, Industrial and Economic
Aspects, Proc. TMS Annu. Meet. (Ed.) Young C. A. (TMS: Warrendale, PA, USA).
pp 469-483.
Niinae, M., Komatsu, N., Nakahiro, Y., Wakamatsu, T. and Shibata, J. (1996),
Preferential leaching of cobalt, nickel and copper from cobalt-rich ferromanganese
crusts with ammoniacal solutions using ammonium thiosulfate and ammonium
sulfite as reducing agents. Hydrometallurgy, 40: 111-121.
Nord, H. (1955), Kinetics of the autoxidation of cuprous chloride in hydrochloric acid
solution. Acta Chem. Scand., 9: 430-437.
O'Reilly, J. W., Dicinoski, G. W., Shaw, M. J. and Haddad, P. R. (2001),
Chromatographic and electrophoretic separation of inorganic sulfur and sulfur-
oxygen species. Anal. Chim. Acta, 432 (2): 165-192.
Osseo-Asare, K. (1989), Solution chemistry and separation process in precious and rare
metals systems. In Precious and Rare Metals Technologies. (Eds) Torma, A. E.
and Gundiler, I. H. (Elsevier: Amsterdam). pp 113-135.
Osseo-Asare, K. (1992), Semiconductor electrochemistry and hydrometallurgical
dissolution processes. Hydrometallurgy, 29: 61-90.

References 311
Panayotov, V., Stamenov, S. T., Todorova, E. K., Gentchev, F. and Feodorov, R. (1994),
Electrochemical stimulation and improvement of the non-cyanidation leaching of
precious metals from low-grade raw materials, flotation concentrates and wastes.
In Chemical Metallurgy: Fourth Meeting of the southern Hemisphere on Mineral
Technology and Third Latin-American Congress on Froth Flotation. Vol.3. (Eds)
Wilkomirsky, I., Sanchez, M. and Hecker, C. (University of Concepcion:
Concepcion, Chile). pp 305-315.
Panchenko, A. F. and Lodeishchikov, V. V. (1971), Evaluation of gold solvents. In
Obogashch. Rud. Peskov Blagorod. Metal. (Ed.) Ivanovskii, M. D. (Nauka:
Moscow, USSR). pp 122-124.
Pangum, L. S. and Browner, R. E. (1996), Pressure chloride leaching of a refractory gold
ore. Miner. Eng., 9 (5): 547-556.
Papangelakis, V. G. and Demopoulos, G. P. (1990), Acid pressure oxidation of
arsenopyrite. Part I. Reaction chemistry. Can. Metall. Q., 29 (1): 1-12.
Pecht, I. and Anbar, M. (1968), Oxidation of bis(bipyridyl)copper(I) ions by oxygen and
by hydrogen peroxide. J. Chem. Soc. A, 8: 1902-1904.
Pedraza, A. M., Villegas, I. and Freund, P. L. (1988), Electro-oxidation of thiosulfate ion
on gold: study by means of cyclic voltammetry and auger electron spectroscopy. J.
Electroanal. Chem., 250 (2): 443-449.
Perez, A. E. and Galaviz, H. D. (1987), Method for recovery of precious metals from
difficult ores with copper-ammonium thiosulfate. US Patent No 4654078. 9 pp.
Peters, E. (1976), Direct leaching of sulfides: chemistry and applications. Metall. Trans.,
B, 7B (4): 505-517.
Peters, E. (1986), Leaching of sulfides. In: Advances in Mineral Processing. (Ed.)
Somasundaran, P. (SME-AIME: Littleton, CO, USA). pp 445-462.
Plaksin, I. N. and Masurova, A. A. (1959), Oxidation of arsenopyrite by oxygen under
pressure and elevated temperature in alkali medium. Izv. Vyssh. Uchebn. Zaved.,
Tsvetn. Met., 2 (4): 97-105.
Pouradier, J. and Gadet, M. C. (1969), Electrochemistry of gold salts. VII.
Thiosulfatoaurate. J. Chim. Phys., 66 (1): 109-112.
Pourbaix, M. (1974), Atlas of Electrochemical Equilibria in Aqueous Solutions. 2nd Ed.
(National Association of Corrosion Engineers: Houston, Texas). 644 pp.
Power, G. P. and Ritchie, I. M. (1975), Metal displacement reactions. In Modern Aspects
of Electrochemistry, Vol. 11. (Eds.) Bockris, J. O’ M. and Conway, B. E. (Plenum
Press: London, UK). pp 199-250.

References 312
Prasad, S. (1987), Electrometric investigation of an acid-thioarsenite system and the
formation of different thioarsenites. Anales de la Asociacion Quimica Argentina,
75 (1): 83-89.
Pray, H. A., Schweickert, C. E. and Minnich, B. H. (1952), Solubility of hydrogen,
oxygen, nitrogen, and helium in water at elevated temperatures. J. Ind. Eng. Chem.,
44: 1146-1151.
Pryor, W. A. (1960) The kinetics of the disproportionation of sodium thiosulfate to
sodium sulfide and sulfate. J. Am. Chem. Soc., 82: 4794-4797.
Puddephatt, R. J. and Vittal, J. J. (1994), Gold: inorganic & coordination chemistry. In
Encyclopedia of Inorganic Chemistry. (Ed.) King, R. B. (John Wiley & Sons:
Chichester, UK). pp 1320-1331.
Rabai, G. and Epstein, I. R. (1992), Systematic design of chemical oscillators. 83.
Equilibria and kinetics of the fast interaction between copper(II) and thiosulfate
ions in aqueous solution. Inorg. Chem., 31 (15): 3239-3242.
Rand, D. A. J. (1977), Oxygen reduction on sulfide minerals. Part III. Comparison of
activities of various copper, iron, lead and nickel mineral electrodes. J.
Electroanal. Chem., 83: 19-32.
Rand, D. A. J. and Woods, R. (1984), Eh measurements in sulphide mineral slurries. Intl.
J. Miner. Process., 13: 29-42.
Rao, S. R., Moon, K. S. and Leja, J. (1976), Effect of grinding media on the surface
reactions and flotation of heavy metal sulfides. In Flotation: A. M. Gaudin
Memorial Volume, Vol. 1. (Ed.) Fuerstenau, M. C. (Amer. Inst. Min. Metall.
Petroleum Engrs., Inc.: New York, USA). pp 509-527.
Rapson, W. S. (1997), New chloride leaching process for gold extraction from refractory
ores. Gold Bull., 30 (1): 20.
Reiger, P. H. (1994), Electrochemistry. (Chapman & Hall: New York). 444 pp.
Remy, H., Anderson, J. S. and Kleinberg, J. (1956), Treatise on Inorganic Chemistry,
Vol. 2. (Elsevier: Amsterdam). 800 pp.
Renders, P. J. and Seward, T. M. (1989), The stability of hydrosulfido- and sulfido-
complexes of gold(I) and silver(I) at 25 oC. Geochim. Cosmochim. Acta, 53 (2):
245-253.
Richardson, S. and Vaughan, D. J. (1989), Arsenopyrite: A spectroscopic investigation
of altered surfaces. Mineral. Mag., 53 (370): 223-229.
Robins, R. G. (1987), Solubility and stability of scorodite, FeAsO4·2H2O: Discussion.
Am. Mineral., 72 (7-8): 842-844.

References 313
Robins, R. G. and Jayaweera, L. D. (1992), Arsenic in gold processing. Miner. Proc.
Extra. Metall. Rev., 9: 255-271.
Roine, A. (1994), Outokumpu HSC Chemistry for Windows: Chemical reaction and
equilibrium software with extensive thermodynamic database Version 2.0.
Outokumpu research of Finland.
Rolia, E. and Chakrabarti, C. L. (1982), Kinetics of decomposition of tetrathionate,
trithionate, and thiosulfate in alkaline media. Environ. Sci. Technol., 16 (12): 852-
857.
Rolia, E. and Tan, K. G. (1985), The generation of thiosalts in mills processing complex
sulphide ores. Can. Metall. Q., 24 (4): 293-302.
Rossovsky, S. N. (1993), Alkaline leaching of refractory gold arsenosulphide
concentrates. CIM Bull., 86 (971): 140-141.
Ruitenberg, R., Hansford, G. S., Reuter, M. A. and Breed, A. W. (1999), The ferric
leaching kinetics of arsenopyrite. Hydrometallurgy, 52 (1): 37-53.
Sanchez, V. M. and Hiskey, J. B. (1991), Electrochemical behavior of arsenopyrite in
alkaline media. Miner. Metall. Process., 8 (1): 1-6.
Schmid, G. M. and Curley-Fiorino, M. E. (1975), Gold. In Encyclopedia of
Electrochemistry of the Elements, Vol. IV-3. (Ed.) Bard, A. J. (Marcel Dekker:
New York, USA). pp 87-178.
Schmitz, P. A., Duyvesteyn, S., Johnson, W. P., Enloe, L. and McMullen, J. (2001),
Ammoniacal thiosulfate and sodium cyanide leaching of preg-robbing Goldstrike
ore carbonaceous matter. Hydrometallurgy, 60 (1): 25-40.
Schraufnagel, R. A. (1983), Arsenic in energy sources: a future supply or an
environmental problem? In Arsenic: Industrial, Biomedical, Environmental
Perspectives. (Eds) Lederer, W. H. and Fensternheim, R. J. (Van Nostrand
Reinhold: Gaithersburg, MD). pp 17-40.
Schwedt, G. and Rieckhoff, M. (1996), Separation of thio- and oxothioarsenates by
capillary zone electrophoresis and ion chromatography. J. Chromatogr. A, 736 (1 +
2): 341-350.
Senanayake, G., Perera, W. N. and Nicol, M. J. (2003), Thermodynamic studies of the
gold(III)/(I)/(0) redox system in ammonia-thiosulfate solutions at 25 oC. In
Hydrometallurgy 2003 - Fifth International Conference in Honor of Professor Ian
Ritchie, Vancouver, Vol. 1. (Eds) Young, C. A., Alfantazi, A. M., Anderson, C. G.,
Dreisinger, D. B., Harris, B. and James, A. (TMS: Warrendale, PA). pp 155-168.

References 314
Seward, T. M. (1973), Thio complexes of gold and the transport of gold in hydrothermal
ore solutions. Geochim. Cosmochim. Acta, 37 (3): 379-399.
Seward, T. M. (1981), Metal complex formation in aqueous solutions at elevated
temperatures and pressures. Physics and Chemistry of the Earth (1956-1998), 13-
14 (Chem. Geochem. Solutions High Temp. Pressures): 113-132.
Seward, T. M. (1993), The hydrothermal geochemistry of gold. In Gold Metallogeny and
Exploration. (Ed.) Foster, R. P. (Chapman & Hall: London, UK). pp 40-61.
Shenberger, D. M. and Barnes, H. L. (1989), Solubility of gold in aqueous sulfide
solutions from 150 to 350 oC. Geochim. Cosmochim. Acta, 53 (2): 269-278.
Shuey, R. T. (1975), Arsenopyrite - FeAsS. In Semiconductucting Ore Minerals.
(Elsevier: New York, USA). pp 205-219.
Sill, H. A. (1958), Removal of arsenic and sulfur from mixed ores or concentrates. DE
Patent No 1040798.
Sillen, L. G. and Martell, A. E. (1964), Stability Constants of Metal-Ion Complexes,
Special Publ. No.17. (The Chemical Society: Burlington House, London, UK).
Sisenov, G. K., Bogdanovskaya, V. A. and Tarasevich, M. R. (1988), Redox reactions of
arsenopyrite in aqueous electrolyte solutions. Elektrokhimiya, 24 (6): 788-793.
Skibsted, L. H. and Bjerrum, J. (1974a), Studies on gold complexes. I. Robustness,
stability and acid dissolution of the tetramminegold(III) ion. Acta Chem. Scand.,
A28 (7): 740-746.
Skibsted, L. H. and Bjerrum, J. (1974b), Studies on gold complexes. II. The equilibrium
between gold(I) and gold(III) in the ammonia system and the standard potentials of
the couples involving gold, diamminegold(I) and tetramminegold(III). Acta Chem.
Scand., A28 (7): 764-770.
Skibsted, L. H. and Bjerrum, J. (1977), Studies on gold complexes. III. The standard
electrode potentials of aqua gold ions. Acta Chem. Scand., A31 (2): 155-156.
Smith, R. M. and Martell, A. E. (1976), Critical Stability Constants, Vol. 4: Inorganic
Complexes. (Plenum Press: New York, USA). pp 86-87.
Souza, A. V. and Ciminelli, V. S. T. (1992), Alkaline pressure oxidation for treatment of
refractory gold concentrate. In Extracao de Ouro: Fundamentos, Pratica e Meio
Ambiente. (Eds) Ciminelli, V. S. T. and Salum, M. J. G. (ABTM: Belo Horizonte,
Brazil). pp 177-196. Available from V.S.T. Ciminelli, Universidade Federal de
Minas Gerais, Belo Horizonte, Brazil.

References 315
Sparrow, G. J. and Woodcock, J. T. (1995), Cyanide and other lixiviants leaching
systems for gold with some practical applications. Miner. Process. Extra. Metall.
Rev., 14: 193-247.
Spycher, N. F. and Reed, M. H. (1989), Arsenic(III) and antimony(III) sulfide
complexes: An evaluation of stoichiometry and stability from existing
experimental data. Geochim. Cosmochim. Acta, 53 (9): 2185-2194.
Stenhouse, J. F. and Armstrong, W. M. (1952), The aqueous oxidation of pyrite. Can.
Inst. Mining Met. Bull., No.477: 49-53.
Steudel, R. and Holdt, G. (1986), Ion-pair chromatographic separation of polythionates
SnO62- with up to thirteen sulfur atoms. J. Chromatogr., 361: 379-384.
Sullivan, A. M. and Kohl, P. A. (1997), Electrochemical study of the gold thiosulfate
reduction. J. Electrochem. Soc., 144 (5): 1686-1690.
Suzuki, I. (1999), Oxidation of inorganic sulfur compounds: chemical and enzymatic
reactions. Can. J. Microbiol., 45: 97-105.
Syrtlanova, T. S., Mineev, G. G., Smagunov, V. N. and Perepelitsa, L. S. (1979),
Improvement in the alkaline decomposition of an arsenopyrite-pyrite concentrate
by dry dispersion. Izv. Sib. Otd. Akad. Nauk SSSR, Ser. Khim. Nauk, (3): 50-55.
Szekeres, L. (1974), Analytical chemistry of the sulfur acids. Talanta, 21 (1): 1-44.
Tan, L. K. and Dutrizac, J. E. (1987), Simultaneous determination of arsenic(III) and
arsenic(V) in metallurgical processing media by ion chromatography. J.
Chromatogr., 405: 247-261.
Tan, S. W. and Bell, P. R. F. (1990), A study on the dissolution of gold in sodium
bisulfide solutions. In Chemeca’ 90, 18th Australas. Chem. Eng. Conference,
Auckland. (Chemical Engineering Group: Auckland, N. Z.). pp 962-968.
Tao, D. P., Li, Y. Q., Richardson, P. E. and Yoon, R. H. (1994), The incipient oxidation
of pyrite. Colloids and Surfaces A: Physicochemical and Engineering Aspects, 93:
229-239.
Taylor, B. E., Wheeler, M. C. and Nordstrom, D. K. (1984), Stable isotope geochemistry
of acid mine drainage: experimental oxidation of pyrite. Geochim. Cosmochim.
Acta, 48 (12): 2669-2678.
Taylor, P. R. and Amoah-Forson, B. (1987), Hydrothermal oxidation of arsenopyrite in
alkaline medium. Paper presented at 117th AIME Annu. Meet., Phoenix. (AIME:
Warrendale, PA). 12 pp.

References 316
Ter-Arakelyan, K. A., Bagdasaryan, K. A., Oganyan, A. G., Mkrtchyan, R. T. and
Babayan, G. G. (1984), Sodium thiosulfate in extraction of gold from ores. Izv.
Vyssh. Uchebn. Zaved., Tsvetn. Metall., (5): 72-76.
Thomas, K. G. (1991a), Barrick gold autoclaving processes. In World Gold '91, Cairns,
Publ. Series 2. (Australas. Inst. Min. Metall.: Parkville, Vic.). pp 89-97.
Thomas, K. G. (1991b), Economics of treating gold ores. CIM Bull., 84 (953): 33-37.
Thomas, K. G. (1991c), Alkaline and acidic autoclaving of refractory gold ores. J.
Metals, 43 (2): 16-19.
Thomas, K. G., Fleming, C., Marchbank, A. R. and Dreisinger, D. (1998), Gold recovery
from refractory carbonaceous ores by pressure oxidation, thiosulfate leaching, and
resin-in-pulp adsorption. US Patent No 5785736.
Thomas, K. G. and Williams, R. A. (2000), Alkaline and acid autoclaves at Barrick gold;
A review. In EPD Congress 2000, Proc. TMS Annu. Meet., Nashville. (TMS:
Warrendale, PA). pp 433-449.
Tossell, J. A. (2000a), Metal-thiometalate transport of biologically active trace elements
in sulfidic environments. 2. Theoretical evidence for copper thioarsenite
complexing. Environ. Sci. Technol., 34 (8): 1483-1488.
Tossell, J. A. (2000b), Theoretical studies on metal thioarsenites and thioantimonides:
synergistic interactions between transition metals and heavy metalloids. Geochem.
Trans., (3): 1-12.
Tossell, J. A. (2001), Computing the properties of the copper thioarsenite complex,
CuAsS(SH)(OH). Inorg. Chem., 40 (25): 6487-6492.
Tossell, J. A., Vaughan, D. J. and Burdett, J. K. (1981), Pyrite, marcasite, and
arsenopyrite type minerals: crystal chemical and structural principles. Phys. Chem.
Miner., 7 (4): 177-184.
Touro, F. J. and Wiewiorowski, T. K. (1992), Gold recovery from refractory gold ores
using sulfurous acid as leaching agent. US Patent No 5147618. 12 pp.
Tozawa, K., Inui, Y. and Umetsu, Y. (1981), Dissolution of gold in ammoniacal
thiosulfate solution. Paper presented at 110th Annual Meeting of AIME, Chicago.
(TMS-AIME: Warrendale, PA). Paper Selection A-81-25: 12 pp.
Trahar, W. J. (1984), The influence of pulp potential in sulfide flotation. In Principles of
Mineral Flotation: The Wark Symposium. Series No.40. (Eds) Jones, M. H. and
Woodcock, J. T. (Australas. Inst. Min. Metall.: Parkville, Vic.). pp 117-130.
Tromans, D. (1998), Oxygen solubility modeling in organic solutions: concentration,
temperature and pressure effects. Hydrometallurgy, 50: 279-296.

References 317
Tykodi, R. J. (1990), In praise of thiosulfate. J. Chem. Educ., 67 (2): 146-149.
Tyurin, N. G. and Kakovskii, I. A. (1960), The behavior of gold and silver in the
oxidation zone of sulfide deposits. Izv. Vyssh. Uchebn. Zaved., Tsvetn. Metall., 3
(2): 6-13.
Umetsu, Y. and Tozawa, K. (1972), Recovery of gold and silver in leaching residues. 2.
Dissolution of gold in ammoniacal sodium thiosulfate solution. Tohoku Daigaku
Senko Seiren Kenkyusho Iho, 28 (1): 97-104.
Van Vensveen, C. and Nicol, M. J. (2003), Unpublished data.
Van Weert, G., Fair, K. J. and Schneider, J. C. (1986), Prochem's NITROX process. CIM
Bull., 79 (895): 84-85.
Vaughan, D. J. and Tossell, J. A. (1983), Electronic structures of sulfide minerals -
theory and experiment. Phys. Chem. Miner., 9 (6): 253-262.
Vaughan, J. P., Bacigalupo-Rose, S. and Dunne, R. C. (1989), Mineralogy and
processing characteristics of arsenical gold ores. (Minerals and Energy Research
Institute of Western Australia, Perth, WA). Report No.51. 85 pp.
Virnig, M. J. and Sierokoski, J. M. (1997), Economical recovery of precious metal from
ores containing precious metal, such as gold and silver, from aqueous ammoniacal
thiosulfate leach solutions. WO Patent No 9749474. (PCT Intl. Appl.: USA).33 pp.
Vogel, A. I. (1962), A Text-Book of Quantitative Inorganic Analysis. 3rd Ed. (Longman
Group: London, UK). 1216 pp.
Von Michaelis, H. (1987), The prospects for alternative leach reagents: Can precious
metals producers get long without cyanide? Eng. & Min. J., 188 (June): 42-47.
Vreugde, M. J. A. (1982), Flotation characteristics of arsenopyrite. PhD Thesis. (The
University of British Columbia: Vancouver, Canada). 166 pp.
Wadsworth, M. E. and Miller, J. D. (1979), Hydrometallurgical processes. In Rate
Processes of Extractive Metallurgy. (Eds) Sohn, H. Y. and Wadsworth, M. E.
(Plenum Press: New York, USA). pp 133-244.
Wadsworth, M. E., Zhu, X. and Li, J. (1993), Electrochemistry of pyrite. In
Hydrometallurgy: Fundamentals, Technology and Innovations, Proc. 4th Milton E.
Wadsworth Intl. Symp. (Eds). Hiskey, J. B. and Warren, G. W. (Soc. Min. Metall.
Explor., Inc.: Littleton, CO, USA). pp 85-99.
Wagner, C. and Traud, W. (1938), The interpretation of corrosion phenomena by super-
imposition of electrochemical partial reactions and the formation of potentials of
mixed electrodes. Z. Elektrochem., 44: 391-402.

References 318
Wan, R. Y. (1997), Importance of solution chemistry for thiosulfate leaching of gold. In
World Gold '97 Conference, Singapore, Publ. Series No. 2. (Australas. Inst. Min.
Metall.: Parkville, Vic). pp 159-162.
Wan, R. Y. and Brierley, J. B. (1997), Thiosulfate leaching following biooxidation
pretreatment for gold recovery from refractory carbonaceous-sulfidic ore. Min.
Eng., (August): 76-80.
Wang, D., Li, D., Qu, G. and Hu, Y. (1993), A new gold lixiviant - CSUT(1). In XVIII
International Mineral Processing Congress, Publication Series No. 3/93, Vol.5.
(Australas. Inst. Min. Metall.: Parkville, Vic). pp 1137-1140.
Wang, D., Mao, A., Qiu, G. and Xu, J. (1998), Thermodynamic analyses of FeAsS, FeS2
and Au in NaClO-NaOH solution and one-step leaching of gold. Youse Jinshu, 50
(1): 40-44.
Wang, X. H., Ahlberg, E. and Forssberg, K. S. E. (1992), Electrochemical study of
surface oxidation and collectorless flotation of arsenopyrite. J. Appl. Electrochem.,
22 (11): 1095-1103.
Webster, J. G. (1986), The solubility of gold and silver in the system gold-silver-sulfur-
oxygen-water at 25 oC and 1 atm. Geochim. Cosmochim. Acta, 50 (9): 1837-1845.
Webster, J. G. (1990), The solubility of As2S3 and speciation of As in dilute and sulfide-
bearing fluids at 25 and 90 oC. Geochim. Cosmochim. Acta, 54 (4): 1009-1017.
Wei, D. and Osseo-Asare, K. (1996), Semiconductor electrochemistry of particulate
pyrite: dissolution via hole and electron pathways. J. Electrochem. Soc., 143 (10):
3192-3198.
Weir, S. I., Butler, E. C. V. and Haddad, P. R. (1994), Ion chromatography with UV
detection for the determination of thiosulfate and polythionates in saline waters. J.
Chromatogr. A, 671: 197-203.
Weissberg, B. C. (1970), Solubility of gold in hydrothermal alkaline sulphide solutions.
Econ. Geol., 65: 551-556.
Welham, N. J. (2001), Mechanochemical processing of gold-bearing sulfides. Miner.
Eng., 14 (3): 341-347.
Wheelock, T. D. (1981), Oxydesulfurization of coal in alkaline solutions. Chem. Eng.
Commun., 12: 137-159.
White, H. A. (1905), The solubility of gold in thiosulfates and thiocyanates. J. Chem.
Metall. Min. Soc. S. Afr., (5): 109-111.
Wierse, D. G., Lohrengel, M. M. and Schultze, J. W. (1978), Electrochemical properties
of sulfur adsorbed on gold electrodes. J. Electroanal. Chem., 92 (2): 121-131.

References 319
Williams, P. A. and Anthony, E. Y. (1990), Redox leaching of platinum group metals
from ore concentrates. WO Patent No 9015887. (PCT Intl. Appl.: USA). 10 pp.
Williams, W. J. (1979), Handbook of Anion Determination. (Butterworths: London,
UK). 768 pp.
Wood, S. A., Tait, C. D. and Janecky, D. R. (2002), A Raman spectroscopic study of
arsenite and thioarsenite species in aqueous solution at 25 oC. Geochem. Trans.,
(3): 31-39.
Woods, R. (1976), Electrochemistry of sulfide flotation. In Flotation: A. M. Gaudin
Memorial Volume, Vol. 1. (Ed.) Fuerstenau, M. C. (Amer. Inst. Min. Metall.
Petroleum Engrs., Inc.: New York, USA). pp 298-333.
Wu, M., Meng, Y., Su, S., Zhang, P. and Feng, X. (1999), Enhanced alkali-leaching
process for arsenic and sulfur containing refractory gold ore. Faming Zhuanli
Shenqing Gongkai Shuomingshu (Inst. Met. Research, Chinese Acad. Sci., China).
CN Patent No 1228480. 6 pp.
Xu, J., Qiu, X. and Wang, Y. (1999), Arsenic removal from gold ore by leaching with
sodium hydroxide. Huaxue Shijie, 40 (10): 518-520.
Xu, Y. and Schoonen, M. A. A. (1995), The stability of thiosulfate in the presence of
pyrite in low-temperature aqueous solutions. Geochim. Cosmochim. Acta, 59 (22):
4605-4622.
Yang, J., Chen, W. and Zhao, Z. (1997), The electrochemical investigation of Na2CO3
effect on the oxidation mechanism of arsenopyrite. Zhongnan Gongye Daxue
Xuebao (China), 28 (2): 142-145.
Yang, T., Chen, Z., Bin, W., Chen, Q. and Lu, Y. (1992), Gold leaching in sodium
polysulfide solution. Zhongnan Kuangye Xueyuan Xuebao, 23 (6): 687-692.
Yen, W. T., Guo, H. and Deschenes, G. (1999), Development in percolation leaching
with ammonium thiosulfate for gold extraction of a mild refractory ore. In EPD
Congress 1999, Proc. TMS Annu. Meet., San Diego. (Ed.) Mishra, B. (TMS:
Warrendale, PA). pp 441-455.
Yen, W. T. and Pindred, R. A. (1989), Gold and silver extraction with non-cyanide
reagents from a refractory complex sulphide ore. In Processing of Complex Ores.
(Eds) Dobby, G. S. and Rao, S. R. (Pergamon: Toronto, Canada). pp 421-428.
Young, R. S. (1971), Chemical Analysis in Extractive Metallurgy. (Charles Griffin &
Company: London, UK). pp 23-27; 315-319.
Young, C. A. and Robins, R. G. (2000), The solubility of As2S3 in relation to the
precipitation of arsenic from process solutions. In Minor Elements 2000:

References 320
Processing and Environmental Aspects of As, Sb, Se, Te and Bi. (Ed.) Young, C.
A. (Soc. Min. Metall. Explor., Inc.: Littleton, CO, USA). pp 381-391.
Yu, J.-k. and Fang, Z.-h. (2000), Electrochemical study on anodic oxidation of
arsenopyrite in ammonia solutions. Zhongguo Youse Jinshu Xuebao, 10 (4): 572-
575.
Zakaznova-Iakovleva, V. P. and Seward, T. M. (2002), Spectrophotometric study of
thioarsenite speciation in high temperature aqueous solutions. Geochim.
Cosmochim. Acta, 66A: 869.
Zhang, H. G. (1997), Some aspects of the use of thiourea in gold processing. PhD Thesis.
(Murdoch University: Perth, Western Australia). 231 pp.
Zhang, H. G. and Nicol, M. J. (2002), AMIRA Project P420B Research Progress Report.
Zhang, J., Lan, K., Ding, F., Yuan, Z. and Yang, L. (1992a), Leaching gold and silver by
lime-sulfur-synthetic-solution (LSSS). Part I. Synthesizing the LSSS and
dissolving pure gold and silver with it. In Precious Metals 1992, Proc. 16th IPMI
Intl. Conference, Scottsdale. (Intl. Precious Met. Inst.: Pensocola, FL, USA). pp
389-393.
Zhang, J., Lan, X., Ding, F., Yuan, Z. and Shuai, S. (1992b), Leaching gold and silver by
lime-sulfur-synthetic-solution. Part II. Treating ores with the LSSS. In Precious
Metals 1992, Proc. 16th IPMI Intl. Conference, Scottsdale. (Intl. Precious Met.
Inst.: Pensocola, FL, USA). pp 394-398.
Zhang, J., Lu, J., Fan, Y., Wu, J. and Zhu, F. (1996), An experimental study on gold
solubility in amino acid solution and its geological significance. Chinese J.
Geochem., 15 (4): 296-302.
Zhang, S. and Nicol, M. J. (1999), Alkaline oxidation leaching of refractory gold-bearing
arsenopyrite concentrates. Report for the A. J. Parker Centre for Hydrometallurgy.
(Murdoch University: Perth, Western Australia). 65 pp.
Zhdanov, S. I. (1975), Sulfur. In: Encyclopedia of Electrochemistry of the Elements. Vol.
IV-6. (Ed.) Bard, A. J. (Marcel Dekker: New York, USA). pp 273-360.
Zhu, G., Fang, Z. and Chen, J. (1994a), Electrochemical studies on the mechanism of
gold dissolution in thiosulfate solutions. Trans. Nonferrous Met. Soc. China, 4 (1):
50-53.
Zhu, G., Fang, Z. and Chen, J. (1994b), Leaching of gold from sulfide concentrates with
thiosulfate/polysulfide produced by disproportionation of elemental sulfur in
ammoniacal media. In Hydrometallurgy '94, Proc. IMM-SCI Intl. Symp.,
Cambridge. (Chapman & Hall: London, UK). pp 541-546.

References 321
Zhu, X., Li, J., Bodily, D. M. and Wadsworth, M. E. (1993), Transpassive oxidation of
pyrite. J. Electrochem. Soc., 140 (7): 1927-1935.
Zhuchkov, I. A. and Bubeev, P. P. (1990), Mechanism of gold activation during
dissolution in a thiosulfate medium. Izv. Vyssh. Uchebn. Zaved., Tsvetn. Metall.,
(2): 64-68.
Zhuchkov, I. A. and Bubeev, P. P. (1992), Effect of gold contact with sulfide minerals on
its behavior in thiosulfate solvents. Izv. Vyssh. Uchebn. Zaved., Tsvetn. Metall., (3-
4): 91-97.
Zhuchkov, I. A. and Bubeev, P. P. (1994), Current efficiency in electrochemical studies
of gold dissolution kinetics in a thiosulfate medium. Izv. Vyssh. Uchebn. Zaved.,
Tsvetn. Metall., (4-6): 123-129.
Zingaro, R. A. (1994), Arsenic: Inorganic Chemistry. In Encyclopedia of Inorganic
Chemistry. (Ed.) King, R. B. (John Wiley & Sons: Chichester, UK). pp 192.
Zipperian, D., Raghavan, S. and Wilson, J. P. (1988), Gold and silver extraction by
ammoniacal thiosulfate leaching from a rhyolite ore. Hydrometallurgy, 19 (3): 361-
375.
Zou, H., Jia, Z., Zhang, Y. and Lu, P. (1993), Separation of aqueous polythionates by
reversed-phase ion-pair liquid chromatography with suppressor-conductivity
detection. Anal. Chim. Acta, 284 (1): 59-65.
Zuberbuehler, A. D. (1967), Reactivity of coordination compounds. XVII. Autoxidation
of copper(I) complexes with ammonia and imidazole. Helv. Chim. Acta, 50 (2):
466-474.
Zuberbuehler, A. D. (1983), Copper(I), dioxygen and catalysis. In Copper Coordination
Chemistry: Biochemical and Inorganic Prospectives. (Ed.) Zubieta, J. (Adenine
Press: New York, USA). pp 237-258.
Zyryanov, M. N. and Doshlov, O. I. (1995), Evaluation of calcium hypochlorite as
chlorination agent in salt and hydrochlorination of gold. Tsvetn. Met. (Moscow),
(9): 34-37.

Appendix 322
APPENDIX
Appendix A1 Thermodynamic Data Used in this Study
Table A1 Free energies of formation (kcal mol-1) (1 kcal = 4.184 kJ)
Species ∆G°298K Reference Species ∆G°298K Reference S(s) 0.00 a Cu(s) 0.00 a H2S(aq) -6.54 a Cu+ 12.00 a HS- 3.01 a Cu2+ 15.53 a S2- 21.96 a Cu(OH)2 -85.3 a S2
2- 19.75 a HCuO2- -61.42 a
H2SO3(aq) -128.60 a CuO22- -43.50 a
HSO3- -126.10 a Cu3(OH)4
2+ -151.42 b SO2(aq) -71.80 a Cu(OH)4
2- -156.97 b SO3
2- -116.10 a Cu2O(s) -34.98 a SO4
2- -177.34 a CuO(s) -30.40 a S2O3
2- -124.00 e CuS(s) -11.70 d S2O6
2- -231.00 a Cu2S(s) -20.60 d S2O8
2- -262.00 a Cu(S2O3)35- -378.70 e
S3O62- -229.00 a Cu(S2O3)2
3- -252.80 e S4O6
2- -244.30 a Cu(S2O3)- -126.20 e S5O6
2- -228.50 a Cu(S2O3)22- -238.7 e
CuFeS2 -45.55 b Au+ 39.00 a Au(S2O3)2
3- -244.50 e As(s) 0.00 b CN- 39.60 d H3AsO3(aq) -152.88 b SCN- 21.20 d H2AsO3
- -140.28 b Cl- -31.35 a HAsO3
2- -125.30 c Fe3+ -2.53 a AsO3
3- -107.00 c Fe2+ -20.30 a H3AsO4(aq) -183.08 b I3
- -12.31 a H2AsO4- -179.99 b
I2- -12.35 a HAsO4
2- -170.76 b OH- -37.60 a AsO4
3- -154.93 b H2O(l) -56.69 a
a. from Pourbaix (1974); b. from Outokumpu HSC program database (Roine, 1994); c. from Dove and Rimstidt (1985); d. from Aylmore and Muir (2001) and Hiskey and Atluri (1988); e. calculated from either the stability constant of species or the reduction potential E°.
Appendix 323
Appendix A2 Wet Chemical Analysis of Sulfide Minerals and
Oxidized Residues
A2.1 Preparation of a bromine-bromide mixture
The bromine-bromide (Br2-KBr) mixture solution was made up according to
Young (1971) and Vogel (1962) by dissolving 160 grams potassium bromide in a small
quantity of water in a 2-liter beaker, adding 100 ml of bromine under a hood, stirring
vigorously, and making up with water to 1 liter.
A2.2 Procedure for digesting sulfide materials
1) Weigh out about 0.2 grams sample into a 100-ml beaker.
2) Add 10-20 ml Br2-KBr mixture followed by placing a watch glass on the
beaker and allowing the sample to stand for about 10 minutes in a fume
cupboard.
3) Add 10 ml concentrated nitric acid and allow to stand for 15 minutes at room
temperature.
4) Place the beaker on asbestos on a hot plate and heat up to about 50 °C.
5) Digest for 0.5 - 1 hour until the red color of bromine fades.
6) Stop heating and add about 20 ml Milli-Q water to cool the solution.
7) Rinse the watchglass and filter all solutions in the beaker through Whatman
No. 541 filter paper into a 200 or 250 ml volumetric flask.
8) Rinse the filter paper 5-6 times with water or 0.1 M nitric acid.
9) Make up to the mark of the flask for further analysis by AAS or ICP.

Appendix 324
A2.3 Analysis of oxidized residues
1) Weigh out about 1.0 grams sample into a 100 ml beaker.
2) Add 20 ml 3 M HCl solution and shake the beaker gently to dissolve iron
hydroxides, arsenates and other acid soluble materials in the residue.
3) Filter through Whatman No. 541 filter paper into a 500 ml volumetric flask
and wash the paper 5-10 times using distilled water. Transfer all washings into
the flask and make up to the mark of this first flask for further analysis by
AAS or ICP of As, S and Fe.
4) Put the filter paper and its contents into a 100 ml beaker.
5) Add 15 ml Br2-KBr mixture and 10 ml concentrated nitric acid to dissolve the
remaining sulfide minerals according to the procedure in the above Section
A2.2.
6) Filter through Whatman No. 541 filter paper into a 100 or 200 ml volumetric
flask and rinse the filter paper 5-6 times with pure water.
7) Make up to the mark of this second flask for further analysis by AAS or ICP
for As, S and Fe.
8) From the analyses of solutions in the two flasks for As, S and Fe, percentages
of total As, S and Fe in the residue can be calculated. The percentage of
arsenopyrite mineral in the residue can be calculated using Equation A2.1,
assuming that all arsenic is in the form of arsenopyrite.
%FeAsS = mAs / (0.4601×Wsample) (A2.1)
where mAs is the total mass of arsenic in the second flask, g ; Wsample is the
mass of residue weighed, g; 0.4601 is the theoretical percentage of arsenic in
pure arsenopyrite.

Appendix 325
9) As most of the contained sulfide mineral is in the form of arsenopyrite and
pyrite with minor amounts of chalrcolpyrite, it is assumed that all sulfidic
sulfur in the residue is in the form of arsenopyrite and pyrite. Thus the
percentage of pyrite of the oxidized residue can be estimated by using
Equation A2.2.
%FeS2 = (mS - mAs×0.1969/0.4601) / (0.5345×Wsample) (A2.2)
where mS is the mass of total sulfur in the second flask, g ; mAs , Wsample and
0.4601 are as above; 0.1969 and 0.5345 are theoretical percentages of sulfur in
pure arsenopyrite and pyrite respectively.

Appendix 326
Appendix A3 Estimation of the Mass Transfer Coefficient of
Oxygen
For reactions limited by diffusion through the mass transfer boundary layer, the
hydrodynamic flow regime at the reacting surface is of considerable importance in
understanding the reaction kinetics. Mass transfer in an aqueous phase has been analyzed
in detail (Wadsworth and Miller, 1979). However, the theoretical treatment of mass
transfer to particles suspended in a stirred reactor has not been fully developed.
Nevertheless, the minimum mass transfer coefficient, k*, in which the slip velocity
would be equivalent to that for freely falling particles, can be calculated on a semi-
theoretical basis for monosize spheres from the physical properties of the aqueous and
solid phase and the diffusion coefficient of the reactant. Basically, the semi-theoretical
correlation takes the following form for free-falling spherical particles (Wadsworth and
Miller, 1979):
Sh = 2 + 0.6 Re0.5 Sc0.33 (A3)
where
Sh = Sherwood number, k*d/D;
Re = Reynolds number, ud/ν;
Sc = Schmidt number, ν/D;
u = velocity;
D = diffusion coefficient;
ν = kinematic viscosity; and,
d = particle diameter.
Equation A3 can be plotted in terms of the mass transfer coefficient vs. particle size and
the resulting diagram is given in Figure A3 (Wadsworth and Miller, 1979). From this
graph the value of k* for a suspended particle can be estimated. However, the actual
coefficient depends on reactor design and stirrer speed or power input.

Appendix 327
Particle Diameter d, micron
Mas
s Tr
ansf
er C
oeffi
cien
t k
* , cm
/sec
Sh = 2 + 0.6 Re0.5 Sc0.33
particle density (ρs ) , g/cm3
2
468
10
10 50010050510.001
0.01
0.1
1000
Figure A3 Plot of mass transfer coefficient vs. particle diameter for freely falling spheres.
In this study, for arsenopyrite (specific density ρs = 6.0 g cm-3) spherical particles
of +38-45 µm (average 42 µm), the mass transfer coefficient is estimated to be about
0.0106 cm s-1.

Appendix 328
Appendix A4 XRD Patterns
0
500
1000
1500
20 30 40 50 60 70 80
Degrees 2-Theta
Cou
nts
Arsenopyrite
Pyrite
Quartz
Figure A4.1 XRD pattern for a Wiluna flotation concentrate sample. Wavelength of 1.7902Å (Co).
0
500
1000
1500
20 30 40 50 60 70 80
Degrees 2-Theta
Cou
nts
Pyrite
ArsenopyriteQuartz
Figure A4.2 XRD pattern for a Macraes flotation concentrate sample. Wavelength of 1.7902Å (Co).
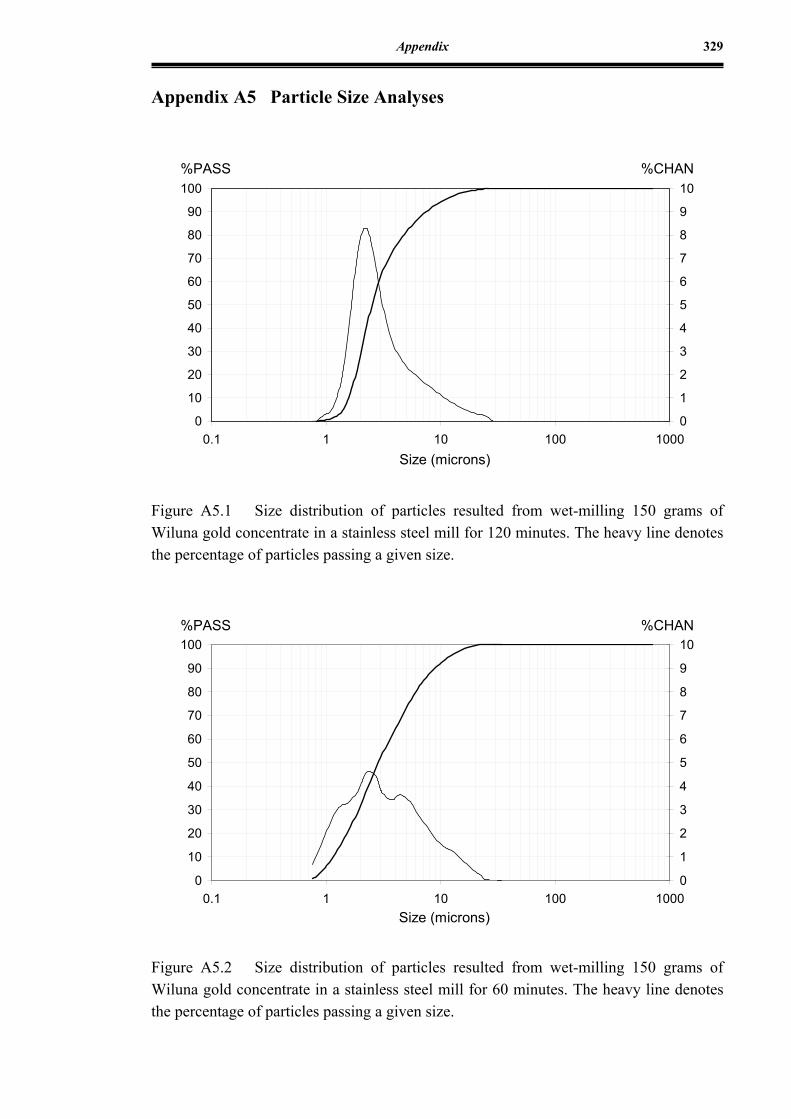
Appendix 329
Appendix A5 Particle Size Analyses
0
10
20
30
40
50
60
70
80
90
100
0.1 1 10 100 1000Size (microns)
%PASS
0
1
2
3
4
5
6
7
8
9
10%CHAN
Figure A5.1 Size distribution of particles resulted from wet-milling 150 grams of Wiluna gold concentrate in a stainless steel mill for 120 minutes. The heavy line denotes the percentage of particles passing a given size.
0
10
20
30
40
50
60
70
80
90
100
0.1 1 10 100 1000Size (microns)
%PASS
0
1
2
3
4
5
6
7
8
9
10%CHAN
Figure A5.2 Size distribution of particles resulted from wet-milling 150 grams of Wiluna gold concentrate in a stainless steel mill for 60 minutes. The heavy line denotes the percentage of particles passing a given size.

Appendix 330
0
10
20
30
40
50
60
70
80
90
100
0.1 1 10 100 1000Size (microns)
%PASS
0
1
2
3
4
5
6
7
8
9
10%CHAN
Figure A5.3 Size distribution of particles resulted from wet-milling 150 grams of Wiluna gold concentrate in a stainless steel mill for 20 minutes. The heavy line denotes the percentage of particles passing a given size.
0
10
20
30
40
50
60
70
80
90
100
0.1 1 10 100 1000Size (microns)
%PASS
0
1
2
3
4
5
6
7
8
9
10%CHAN
Figure A5.4 Size distribution of particles resulted from wet-milling 25 grams of pure arsenopyrite in a stainless steel mill for 60 minutes. The heavy line denotes the percentage of particles passing a given size.

Appendix 331
Appendix A6 Calculation of Cumulative Dissolution Rates for the
Oxidation of Sulfide Minerals and Gold Concentrates
During the alkaline oxidation of sulfide minerals or gold concentrates, slurry
samples (about 17 ml) were taken from the reactor at various times and filtered through
0.45 micron nylon membrane paper. The clear filtrates (about 13 ml) were analyzed by
AAS for Au, Cu and Fe, by ICP for As and S elements, and by HPLC for dissolved
species of sulfur and arsenic. The residues were returned and about 13 ml distilled water
was added each time to the reactor in order to keep the mass of the reacting slurry
approximately constant. At the end of the experiment, the slurry in the reactor was
filtered through Whatman No.541 filter paper by vacuum and washed three times with
distilled water. The final filtrate and washings were collected for further analyses of As,
Au, Cu, Fe and S. The final residue was oven dried at 110 °C and weighed before being
analyzed for Au, As, Fe, S and sulfide minerals. Thus, cumulative dissolution rates at
different reaction times of total Au, As, S, Cu, or Fe were calculated based on the results
of filtrate analyses. An example of the calculation of the cumulative dissolution rate is
shown below.
In the case of a typical experiment on the oxidation of Wiluna gold concentrate,
the experiment was carried out in 600 ml water with addition of 150 g milled Wiluna
sample and 37.5 g NaOH (solid-liquid ratio = 1:4) at 25 °C, 1400 rpm stirring speed and
1 l min-1 flow rate of air. The results of analyses of aqueous samples taken at various
times are given in Table A2. After 48 hours, the slurry was filtered and washed with the
volume of the filtrate being 455 ml and that of the washings being 440 ml. The dried
final residue was weighed as 144.2 grams. The percentages of total As, S and Fe in the
residue are also given in Table A2, and the arsenopyrite and pyrite in the residue are
estimated to be 1.2% and 22% respectively. Thus, the cumulative dissolution rates of Au,

Appendix 332
As, S, Cu and Fe from solution analyses, and the dissolution rates of As, S and Fe from
residue analyses were calculated and are also shown in Table A2.
Table A2 Results of an experiment with Wiluna concentrate
Time (hr)
Au ppm
As g l-1
S g l-1
Cu ppm
Fe g l-1
Au% As% S% Cu% Fe%
1 0 1.2 1.6 0.4 0.001 0 5.8 2.9 0.1 0
3 0 4.0 3.8 0.3 0.001 0 19 6.8 0.08 0
6.5 0.33 7.5 7.5 0.3 0.001 1.4 37 14 0.08 0
12 2.27 12 12 0.98 0.001 9.7 59 22 0.2 0
24 10.3 13.5 20 44.5 0.73 44 68 37 11 1.2
36 14.8 12 22 75.1 1.23 64 62 41 19 2.0
48 16.8 10 22 90.8 3.15 78 61 44 22 5.7 Filtrate
VF 455ml
16.8 10 22 90.8 3.15 - - - - -
Wash VW
440 ml 6.81 5.5 8.5 25.5 1.59 - - - - -
Residue WR
144.2 g -
3.5% As
13% S
- 24.6% Fe
- 59 44 - 5.4
The calculation for the results in Table A2 is described as follows. Since the
volume of the reacting slurry was kept approximately constant, the solution component
of the slurry was assumed to be 0.6 liter during the experiment except when the
experiment ended. The measured volumes of the final filtrate and washings were used for
calculation of the cumulative dissolution rate. As about 13 ml aqueous solution was
taken out each time for analysis, the loss of targeted elements in the slurry for the
calculation of the cumulative dissolution rates should be considered. Thus,
Dissolution rate (at time t) = (0.013 × ∑Ct-1 + 0.6 × Ct) / (W0 × H0)
Dissolution rate (final) = (0.013 × ∑Ct-1 + VF × CF + VW × CW) / (W0 × H0)

Appendix
333
Dissolution rate (by residue) = 1- (WR × HR) / (W0 × H0)
where Ct is the concentration of the targeted element at time t, ppm or g l-1 ; ∑Ct-1 is the
sum of all concentrations of the targeted element before time t; W0, H0 are the initial
mass, g, and head analysis of the Wiluna concentrate, g t-1 or % (by mass); VF, VW are
the volumes of final filtrate and washings respectively, l ; CF, CW are the concentrations
of final filtrate and washings respectively; WR, HR are the mass and the head analysis of
the dried residue. The dissolution rate of arsenic at 24 hours, for example, is calculated
by
%As dissolved (at 24 hours)
=[0.013×(1.2+4.0+7.5+12)+0.6×13.5] / (150×8.29%) = 68%
At 48 hours, the final extent of dissolution is calculated as follows:
%As dissolved (at 48 hours)
=[0.013×(1.2+4.0+7.5+12+13.5+12)+0.455×10+0.44×5.5] / (150×8.29%) = 61%
The final extent of dissolution from analysis of the residue is calculated as
%As dissoved (by residue) = 1- (144.2×3.5%) / (150×8.29%) = 59%
Similarly, the dissolution rates of gold, sulfur, copper and iron can be calculated.
Furthermore, the oxidation rates of arsenopyrite and pyrite can also be calculated to be
about 94% and 40% respectively.


