Ownership structure's effect on dividend policy
Evidence from publicly listed Swedish firms Authors: Björn Lundgren Christofer Eriksson Lantz Supervisor: Catherine Lions
Student
Umeå School of Business and Economics
Spring semester 2016
Degree project, 30 hp

Page intentionally left blank

Abstract
This study examines the effect of ownership structure on dividend policy of 284 firms
listed on the OMX Stockholm Exchange in Sweden from 2010-2015. Specifically, the
purpose of the study is to investigate the relationship between different investor types and
dividend policies of firms, measured as dividend yield and dividend payout ratio. Also,
the study aims to predict dividend behaviours based on ownership structure which may
be useful in the future since ownership structures of listed Swedish firms have been
changing over time, with an increased consolidation of ownership and a sharp increase in
institutional ownership. The sample consists of 1046 observations and was gathered from
Thomson Reuters’ Datastream and Eikon databases.
This is the first study to examine the relationship between ownership structure and
dividend policy in Sweden. The dividend policy is measured using two dependent
variables; dividend payout ratio and dividend yield and a multiple regression has been
used in order to test the hypotheses whether any relationships exist between 17 different
types of ownership structure used as independent variables, four additional control
variables and dividend policy. The findings indicated significant positive relationships
between institutional ownership and dividend yield and dividend payout, with one
exception being private equity which exhibited a negative relationship with dividend
yield. Furthermore, market capitalization, return on assets and price to book value are
positively related to dividend payout while debt/equity ratio showed a negative
relationship with dividend yield. The results contradict those of the most recent research
conducted in Turkey (Al-Najjar & Kilincarsla, 2016) but adds support in the debate to
existing theories of dividends’ relevance to the value of firms developed by Gordon
(1963), Lintner (1962) and Walter (1963). Limitations of the study include the
geographical delimitation to Sweden which creates some constraints to wider
generalization of the results to other geographical settings. Furthermore, the data
collected from Thomson Reuters Eikon had missing values, showed signs of
heteroscedasticity and relevant investor variables such as family ownership were
unavailable.
Keywords: Ownership structure, dividend policy, dividend yield, dividend payout,
Sweden, ownership concentration, institutional ownership.

Page intentionally left blank
Acknowledgements
We would like to express our sincerest gratitude towards our supervisor Catherine Lions
for her tireless effort and extensive help during the whole process. This thesis would not
have been possible without your help.
Umeå, Sweden, May 2016
___________________ ______________________
Björn Lundgren Christofer Eriksson Lantz

Contents
1.1. Problem background .............................................................................................. 1
1.1.1 The case of dividends .............................................................................................. 1 1.1.2 Ownership Structure ................................................................................................ 2
1.1.3 The relationship between ownership structure and dividends ................................. 3
1.3 Research gap ........................................................................................................... 4 1.2 Research question ................................................................................................... 5
1.4 Research purpose .................................................................................................... 5 1.5. Contribution and target audience ........................................................................... 5 1.6. Limitations ............................................................................................................. 6 1.7. Disposition ............................................................................................................. 6
2. Methodology ......................................................................................................... 8
2.1 Choice of topic & preconceptions .......................................................................... 8 2.2 Our perspective ....................................................................................................... 9 2.3. Research philosophy .............................................................................................. 9
2.3.1. Epistemology .......................................................................................................... 9
2.3.2. Ontology ............................................................................................................... 10
2.4. Research approach ............................................................................................... 11 2.5. Research design ................................................................................................... 12
2.6. Research strategy ................................................................................................. 14 2.7. Time Horizon ....................................................................................................... 15 2.8. Research method.................................................................................................. 16
2.9. Literature and data sources .................................................................................. 17 2.10. Ethical, legal and social considerations ............................................................. 18
3. Theoretical framework ....................................................................................... 21
3.1. Dividends ............................................................................................................. 21
3.1.1. Dividend irrelevance theory ................................................................................. 21 3.1.2. Dividend relevance theory .................................................................................... 22
3.1.3. Agency theory ...................................................................................................... 23 3.1.4. Clientele effect ...................................................................................................... 23
3.1.5. Dividend signalling theory ................................................................................... 24 3.1.6. Optimal level of dividends ................................................................................... 25
3.2. Ownership structure ............................................................................................. 26
3.2.1. Ownership structure’s effect on dividends ........................................................... 30 3.2.2. Optimal ownership structure ................................................................................ 32 3.2.3. Determinants of ownership structure .................................................................... 34
4. Empirical Study .................................................................................................. 37
4.1. Data collection ..................................................................................................... 37 4.2. Variables .............................................................................................................. 37
4.2.1. Dependent variables ............................................................................................. 37 4.2.2. Independent variables ........................................................................................... 38 4.2.3. Control variables .................................................................................................. 38
4.3. Hypotheses .......................................................................................................... 39
4.4. Statistical tests applied......................................................................................... 40
4.4.1. Testing for normal distribution and linearity ........................................................ 40
4.4.2 Shapiro-Wilk Test ................................................................................................. 40 4.4.3. Testing for multicollinearity and correlations ...................................................... 40 4.4.4. Testing for heteroscedasticity ............................................................................... 41
4.5. Regression analyses ............................................................................................. 41
4.5.1. Regression model ................................................................................................. 41 4.5.2. Multiple regression analysis ................................................................................. 41 4.5.3. T-test ..................................................................................................................... 42
4.5.4. Type 1 error and Type 2 error .............................................................................. 42 4.5.5. Coefficient of determination ................................................................................. 42 4.5.6. P-value .................................................................................................................. 42
4.6. Transformations ................................................................................................... 42
4.6.1. Zero dividends ...................................................................................................... 43
5. Empirical results ................................................................................................. 44
5.1. Descriptive statistics ............................................................................................ 44 5.2. Testing for correlations & multicollinearity ........................................................ 48 5.3 Testing for normality and linearity ....................................................................... 49
5.4. Testing for heteroscedasticity .............................................................................. 51 5.5. Regression results ................................................................................................ 52 5.6. Hypothesis testing ............................................................................................... 55
6. Analysis and discussion ...................................................................................... 57
7. Conclusion .......................................................................................................... 61
7.1. Contribution and remarks .................................................................................... 62 7.2. Quality criteria for research ................................................................................. 62
7.2.1. Reliability ............................................................................................................. 62 7.2.2. Validity ................................................................................................................. 63
7.2.3. Generalizability .................................................................................................... 63 7.2.4. Ethical and societal aspects .................................................................................. 64 7.3. Suggestions for further research .............................................................................. 65
Reference list: ......................................................................................................... 67 Appendix ................................................................................................................ 73
Appendix 1. Pearson correlation table ............................................................................ 73
List of tables
Table 1. Summary of previous studies ........................................................................... 31
Table 2 Descriptive statistics before data transformation .............................................. 45
Table 3. Descriptive statistics after data transformation ................................................ 47
Table 4. Collinearity statistics ........................................................................................ 49 Table 5. Shapiro-Wilk normality test for Dividend payout vs independent variables ... 49 Table 6. Shapiro-Wilk normality test for Dividend yield vs independent variables ...... 50 Table 7. Breusch/Pagan test for heteroscedasticity for Dividend payout vs independent
variables .......................................................................................................................... 51 Table 8. Breusch/Pagan test for heteroscedasticity for Dividend yield vs independent
variables .......................................................................................................................... 52

Table 9. Results from regression with dependent variable: Dividend yield vs
independent variables ..................................................................................................... 52 Table 10. Results from regression with dependent variable: Dividend payout vs
independent variables ..................................................................................................... 54
Table 11. Summary of significant variables vs dividend yield ...................................... 57 Table 12. Summary of significant variables vs dividend payout ................................... 57
List of figures
Figure 1. Summary of methodology used. ..................................................................... 20 Figure 2. Correlations ..................................................................................................... 48 Figure 3. Q-Q plot of dividend yield .............................................................................. 50 Figure 4. Q-Q plot of dividend payout ........................................................................... 51

Page intentionally left blank

1
1. Introduction In this chapter, a background of the topic is presented. The context of this chapter
includes the problem background with the case of dividends and ownership structure and
the relationship between ownership structure and dividends, the research question, the
research gap such as relevance of this study in Sweden, purpose, contributions & target
audience is reflecting the evaluation of the relationship between ownership structure and
the propensity to pay cash dividends/dividend policy and the limitations related to the
study. This will give an insight into the chosen area and the reasoning behind this
particular field of study.
1.1. Problem background
1.1.1 The case of dividends
When considering the financial market, the question whether firms should pay dividends
to their shareholders sometimes arises and if so, to what extent. In Rozeff’s (1982, p. 249)
model of optimal level of dividends, he argues that the optimal level of dividends is a
trade-off between higher dividends which lowers agency costs but also increases
transaction costs related to external financing.
Miller & Modigliani (1958, 1961) found evidence in their research into dividend
irrelevance theories that, in perfect capital markets, the valuation of a firm is unaffected
by its dividend policy. The reasoning behind their proposition is, they argue, because in
perfect capital markets, investors are indifferent between receiving their returns as
dividends or as capital gains. This is because both forms of returns have no further
implications for the investor. The model includes several assumptions, such as assuming
that the form of returns carry no beneficial neither or disadvantageous implications, by
disregarding taxes and market frictions such as transaction costs. In addition, the model
assumes that investors always act rationally, thus maximizing their wealth, have no
preferences for the way returns are received and have perfect and symmetrical access to
both credit markets as well as information. As a result, one can ignore the possibility of
underlying information transmitted in firms’ dividend policies (Miller & Modigliani,
1961, p. 412).
However, conflicting opinions have been voiced, stating that dividend policy is indeed
relevant to the value of firms. The bird-in-the-hand theory developed by Gordon (1963)
and Lintner (1962) states that investors develop a preference for dividends to counter
market imperfections such as information asymmetry and limited certainty. With the
name derived from the saying “A bird in the hand is worth two in the bush” (unknown
origin), the theory suggests that the market prefers to receive cash dividends over capital
gains due to capital gains, received in the future, are more distant and thus carry more
uncertainty and risk. By receiving earnings as cash dividends today, the uncertainty is
removed and allows for consumption instantly.
Further research has shown and found that the assumptions from Miller & Modigliani are
questioned and do not hold since the evidence that conflicts of interest, agency conflicts
and asymmetric access to credit markets are indeed present and thus present an
obstruction to their dividend irrelevance theory (Michaely & Roberts 2006, p. 35-36).
Moreover, managers tend to have more information than shareholders since certain
information cannot be openly communicated. Instead, managers might use dividends to
signal the expected increase (decrease) in earnings by increasing (decreasing) the level of

2
dividends (Al-Kalini et al, 2012, p. 294). By cautiously changing the level of dividends
and smoothing them over time, the management of firms - publicly traded firms in
particular - try to reduce the volatility of stock price reactions in response to dividend
announcements (Michaely & Roberts, 2006, p. 11).
1.1.2 Ownership Structure
“The directors of such [joint-stock] companies, however, being the managers rather of
other people’s money than of their own, it cannot well be expected, that they should watch
over it with the same anxious vigilance with which the partners in a private copartnery
frequently watch over their own.... Negligence and profusion, therefore, must always
prevail, more or less, in the management of the affairs of such a company.”
As Adam Smith (p. 700) concluded in The Wealth of Nations as early as 1776, the
separation of ownership and management can lead to inefficiencies and conflicts of
interests. Some modern research has disseminated the topics of ownership structure and
agency costs in more depth and found that different ownership structures could be the
significant determining factor when it comes to the level of risk the company is facing.
As exemplified by Jensen & Meckling (1976, p. 10-12), a firm with a single manager that
owns the total number of shares of the firm will behave differently from a firm with an
ownership structure consisting of outsiders. One main difference between the single
owner-manager and the outsiders is that the single owner-manager is likely to maximize
his own utility by seeking other benefits such as purchasing production inputs from
friends, splurging on an extravagant company car and so forth. As the manager sells
shares in the company to outside investors, conflicts of interest arise. Since the non-
monetary utility is mostly beneficial for the single owner-manager, the outsider investors
will regard these actions as pure inefficiency losses - agency costs are thus generated.
Dhillon & Rossetto (2014) found that when a large share of widely dispersed owners
abstain from voting in decisions over risk, medium-sized blockholders may step in and
lessen the effect of the conflict of interest between one large risk-averse shareholder and
the non-voting minor shareholders. This conflict of interest typically arises from a
situation where one major, initial shareholder tends to prefer to pursue less risky growth
opportunities that the firm enjoys in relation to smaller, fractional shareholders. The
reason for this is due to the fact that the initial owner has a large, undiversified risk and
will therefore prefer to pursue less risky growth opportunities while the smaller investors
will be in an easier position to maintain a widely diversified portfolio. Due to the minor
shareholders’ ability to more easily create a portfolio diversification effect, they will be
willing to take on more risk. Meanwhile, as investors holding intermediate amount of
shares and thus an ability to influence the decision with their voting rights – blockholders
- emerge, this conflict of interest is reduced. (Dhillon & Rossetto, 2014, p. 542-543).
There is also evidence that ownership structure has an effect on the capital structure and
firm performance. Chaganti & Damanpour (1991, p. 489) found that among the firms in
their study, those with a large share of family ownership favoured debt financing while a
large share of institutional ownership displayed a positive relationship with return on
equity-ratios. This is supported by Margaritis & Psillaki (2010, p. 631) who found that a
positive relationship between concentration of ownership and higher levels of debt in the
capital structure.

3
There is no clear-cut definition of a family owned firm but generally speaking, it is a firm
which has more than one member of the same family owning a significant share and may
affect the choice of members of the board. We use the following definition which
according to The Family Firms Institute (2013, p. 3) is one of the most classic definitions
developed by scholars in the field:
“Family firms are defined as those in which multiple family members are insiders
(officers or directors) or large owners (5% or more of the firm's equity) at the same time
or over the life of the company as family descendants.” (Miller et al, 2007, p. 841).
1.1.3 The relationship between ownership structure and dividends
As previously mentioned, the ownership structure of a firm is linked with its performance,
capital structure and other decision making and is prone to the creation of conflicts of
interest and agency costs. Dividends can be used to counter these issues, as the firm’s
capital base decreases which forces it to raise capital outside the firm and thus exposes it
to scrutiny by outside investors, as argued by Rozeff (1982, p. 249). However, dividends
can also be a cause of, as well as a display of, different interests of certain shareholders.
Such an example can be demonstrated by a varying preferences in dividend payouts.
(Rozeff, 1982, p. 250) found that firms were more likely to pay higher dividends when
insiders own a relatively smaller share of the equity and/or a larger number of
shareholders own the outside equity. Moh’d et al (1995, p. 382-382) found that these
findings hold both between firms and through time and that dividend policy is a function
of ownership structure, firm size, growth rate, leverage and intrinsic business. Their
findings suggest that firms decide on their dividend policy based on a trade-off between
agency costs and transaction costs.
In a study on the effect of ownership structure on dividend policy in Turkey, Al-Najjar &
Kilincarslan (2016) found that firms with a large proportion of state and foreign
ownership are less likely to pay cash dividends while firms with large proportions of other
ownership variables, such as family ownership, Turkish financial institutions and other
blockholders are insignificant in predicting firms’ probability of paying dividends. The
ownership structures of Turkish firms do however have a higher concentration of family
and foreign ownership while the Turkish state, domestic financial institutions and other
blockholders hold proportionally smaller shares of ownership (Al-Najjar & Kilincarslan,
2016, p. 156). However, the ownership structures of Swedish firms differ from Turkish
firms. Swedish firms have traditionally differed from the typical European firms by often
being controlled by Swedish families using a relatively small capital base. The reason for
this is because of tax policies and laws discouraging private wealth while enabling control
of firms using a relatively small capital base. As a result, with the liberalisation and
internationalisation of capital markets, the Swedish stock market has seen one of the
fastest increases in foreign ownership of Swedish firms (Henrekson & Jakobsson, 2003,
p. 1).
Institutional investors now hold more than 85% of the market capitalisation on the
Stockholm Stock Exchange and about 40% of the ownership of Swedish firms can be
attributed to foreign owners (Lekvall, 2014, p. 248-250). According to Aydogan &
Gürsoy (2002, p. 6), the ownership structures of Turkish firms at the time were
characterised by a high concentration of ownership, typically associated with – but not
limited to - a group of companies owned by one or several families. This is very similar
to that of Swedish firms several decades earlier before the transition noted by Henrekson

4
& Jakobsson began. By 2014, Turkish firms had become an attractive target for foreign
direct and portfolio investors (Gurarda et al, 2014, p. 1). The reason for foreign investors
to invest in Turkey today may be different from investing in Sweden in the early 2000s,
considering the fact that Turkey is an emerging economy with attractive growth
opportunities and Sweden was a developed nation already at the time. Meanwhile, it is
likely that Turkish firms may follow the same development as Swedish firms, which is
the reason why this study is of importance. Should the ownership structure’s effect on
dividend policy among Swedish firms differ from that on Turkish firms, it is possible that
this study could be used to predict the development of dividend policy and corporate
governance in Turkey and other countries with similar attributes.
Sweden is also a developed country and part of the European Union, unlike Turkey which
is a developing country, which distinguishes the countries from each other. Furthermore,
Sweden levies a flat 30% tax rate on both capital gains as well as cash dividends, which
in theory should make investors indifferent to the way the earnings from their investments
are paid. In this respect, the taxation aspect is likely to be negligible but is nevertheless
present to the extent that capital gains involve an element of tax planning in the sense that
investors can choose the time to realise their earnings and thus carry the tax liability over
to subsequent fiscal years, while dividends are taxed for the same fiscal year as they are
received.
As previously mentioned, the Swedish economy is a highly advanced economy. Its stock
market and its firms has gone through the same transition that the Turkish stock market
and firms are currently going through – i.e. one where the typical ownership is in
transformation, from principally family-owned and controlled to an increasingly diluted
ownership from foreign investment as well as domestic institutional investors. Therefore,
it could be used as a model to predict the future of developing economies going through
the same transition.
1.3 Research gap Apart from the study by Al-Najjar & Kilincarslan (2016) in the Turkish setting, previous
research in the field of ownership structure’s effect on dividends has been rather limited
and especially in a Swedish or Nordic setting. While several similar studies have been
conducted in mainly developing countries and different geographical settings, such as
China (Thanatawee, 2014), India (Kumar, 2003), Iran (Eskandar et al, 2011), Italy
(Mancinelli & Ozkan, 2010), Jordan (Warrad et al, 2012), and Pakistan (Ullah et al,
2012). Apart from Italy, all the settings in which previous studies have been conducted
are non-European developing countries. As previously mentioned, Swedish firms
distinguish themselves from other continental European firms by frequently having a
dominating family in ownership position which controls the firm with a relatively small
capital base. This has however been changing over time, moving towards ownership
structures dominated by institutional ownerships. A similar transformation among
developing countries, notably Turkey, can currently be seen. This makes Sweden and its
firms a feasible and interesting target to study, most previous studies have been performed
on developing countries and could possibly act as a precedent for those countries.

5
1.2 Research question As mentioned, the question posed in this study is whether the ownership structure has an
effect on the dividend policy of publicly listed firms in Sweden. The aim of this paper is
to answer the following research question;
Does ownership structure affect the dividend policies of Swedish listed firms?
By answering this question, using a set of control variables and hypotheses, the aim is to
investigate if ownership structure has an effect on dividend policy or whether there are
other factors and variables affecting it. See section 4.1. and 4.2. for the full list of variables
and hypotheses.
1.4 Research purpose The purpose of this study is to investigate whether there is a link between the ownership
structure of listed firms in Sweden and their dividend policies. In the case that such
information could be used to predict dividends among firms over time, it is also possible
that it could be used to predict the future development of dividend behaviour considering
the fact that ownership structures have been changing over time, shifting from a 75%
individual investor ownership structure in the 1950s to a mere 15% of ownership held by
individual investors in 2014 (Lekvall, 2014, p. 248). Since other developing markets are
seeing similar changes in ownership structure among its firms, it is possible that by
analysing and interpreting the ownership structure’s effect on dividend policies, it could
be used to predict the development of such policies in other countries going through
similar transitions, most notably Turkey. Furthermore, previous research on the topic in
different geographical settings have yielded different results and there are several
contradicting schools of theory on the subject. It is therefore clear that more research is
needed on this topic and one aim of this paper is to contribute to existing theories and
expand the knowledge in the field.
1.5. Contribution and target audience The contribution of this study is mainly to evaluate the correlation between ownership
structure and the propensity to pay cash dividends. This information may then possibly
be used to identify firms with a higher risk of being susceptible of conflicts of interest
and agency costs. Similar studies have almost exclusively been conducted in developing
countries. Some of these countries, such as Turkey, are going through the same
transformation of ownership structure which Sweden did decades ago which may make
the results from this study able to predict the development of ownership structures and
dividend policies in such environments. The information could also be utilised by
investors as well as current owners of firms in order to understand and develop their
dividend policies and financing decisions. By doing so, a deeper understanding and
enhanced predictability about firms’ expected dividends may be achieved. By increasing
such an understanding, a more effective dividend signalling may be practiced by firms
based on its ownership structure.
In addition to the more practical contributions just mentioned, this study also aims to
make more theoretical contributions to the field of finance research since almost all
previous research on this topic has been carried out in developed countries outside

6
Europe. There appears to be no consistent relationship between the ownership structure
and dividend policies in the findings of previous studies in the wide range of frameworks
they have been conducted. By exploring this field in Sweden and more generally in an
advanced European economy, the findings of this study may be used for further research
to draw comparisons of the results from other studies on the topic, in different
geographical, economic and political settings. Thus, this paper is targeted primarily at a
Swedish and international audience within the finance research field as well as
management and stakeholders in corporations and limited companies.
1.6. Limitations In order for the research to be as valuable as possible, one has to consider the limitations
of the research in an on-going discussion in order for the research to be as transparent,
valid and reliable as possible. First of all, the limited time horizon of six years (2010-
2015) and the limited area of Sweden creates some restraints to the generalizability of the
results. The time period is set to six years in order to exclude extreme results due to the
previous fluctuations in the economic system related to the financial crisis and the fact
that the ownership structures of Swedish firms have changed over time. However, this
time horizon should be adequate in order to generate enough data to create a reliable
statistical study to investigate whether ownership structure affects dividend policy and in
order to create findings and results which are generalizable and should contribute to
already existing research. Since this study is limited to one country, Sweden, the findings
will be specifically related to only the Swedish market, ownership structures and dividend
policies of Swedish firms. Secondly, another limitation concerns the data sample since it
has some missing values and variables used in other studies within the data for ownership
structure, such as family ownership. However, the database used for collecting the data,
Thomson Reuters Eikon, is preferable since the available data is likely to be accurate and
regularly updated while providing an efficient way to collect the data, which was very
valuable given the limited time frame of this research.
1.7. Disposition This research involves seven chapters and the disposition and the structure behind the
research is outlined below. The purpose of the disposition section is at the reader in order
to see the structure of the paper and give an insight into the specific topic related to the
research question. The structure fits into this study as it is useful in order for the reader to
understand and interpret the research question, firstly the facts and later on the theoretical
accomplishments.
Chapter 1: Introduction
Introduction chapter is useful in order to get a grasp of the purpose of the research and
the specific research area as well as the base of the research. This chapter started with the
problem background in order to reflect upon the context of dividends, ownership structure
and the relationship between these variables. The other topics includes the research
question, research gap, research purpose, contribution and target audience and limitations
of the research.
Chapter 2: Methodology
The Methodology chapter’s purpose is to explain the different methods chosen. This
includes the strategies, approaches, methods and design that is used in this study.
Moreover, the chapter is considering the philosophical views, nature of reality and

7
knowledge in order to be able to guide the research further. The end of the chapter
includes the sources of the research and the ethical, legal and social considerations.
Chapter 3 Theoretical Framework
The theoretical framework is based on the theories behind both dividends and ownership
structure. First, the definition of different types of dividends and the different types of
stocks is discussed. Second, the theories behind dividends is described in order for the
reader to understand the concept of dividends such as the dividend irrelevance theory,
dividend relevance theory, clientele effect, signalling theory and agency theory. Finally,
the chapter ends up with a definition of different types of ownership structure and the
theories behind the definition of equity, ownership structure effect on dividends and the
determinants of ownership structure. As this chapter is very important in research, the
most emphasis has been put on this chapter.
Chapter 4 Empirical study
Empirical study is considering the description how the data is collected and where the
data has been collected, in this case Thomson Reuters Eikon and Datastream. Also, the
hypothesis is presented in order to answer the research question and a presentation of the
different types of statistical tests that have been used. The chapter also includes a
description of the regressions and the model that is used for this study.
Chapter 5 Empirical results The chapter presents descriptive statistics, empirical results, findings and the statistical
tests in order to evaluate the hypothesis statements. Tests for normality, linearity,
heteroscedasticity are conducted in order to test whether the assumptions of the
regressions are fulfilled. These are followed by the regression models which are tested
for statistical significant relationships between the variables.
Chapter 6 Analysis and discussion This chapter includes the analysis and the discussion behind the findings. The analysis
part reflects upon describing the relationship between ownership structure and dividends
specifically for Sweden. The chapter is followed by a discussion where the results are
evaluated and interpretations and possible outcomes of the results.
Chapter 7 Conclusion The last chapter concludes the findings, discusses its contributions, whether the purpose
of the study has been fulfilled and reflects about the quality. In order to guarantee a high
quality throughout the research, a discussion about the reliability, validity and
generalizability has been presented. The chapter ends with suggestions for further
research.

8
2. Methodology The main discussion in this section is to explain philosophical views and give an insight
into the different methods and philosophical approaches relevant to this study. This
includes research design, research method, research strategy and research approach. An
explanation and a summary of the different philosophical views and their
interconnectedness, which is useful in order to explain the usefulness and relevance of
the study when continuing to the theoretical framework chapter, will be presented. A
discussion of the ethical, legal and social considerations that are important when
conducting this type of study concludes the chapter.
2.1 Choice of topic & preconceptions The authors of this paper are currently studying their eighth and final semester of the
International Business Program at Umeå University, specialising in finance. Due to the
authors’ specialisation, extensive interest in finance and genuine interest of the financial
sector, as well as experience from studying finance abroad (Canada and Germany,
respectively), writing a thesis on the subject of finance was a natural choice. Both authors
have experience from academic research gained in previous courses. While the
International Business Program has an international focus, the authors deem themselves
to have a good understanding of the Swedish financial system, developed through
personal interests and experience from stock trading and analysis. However, due to the
authors’ genuine interest and previous studies in the topic, the risk of cognitive biases
arises. There is a risk that the author subconsciously set out with a certain mindset based
on previous knowledge, which is then prone to anchoring, where the author is slow to
change this preconception. While one can impossibly fully prevent oneself from falling
victim for these fallacies, the authors of this paper have been aware of these cognitive
biases from the beginning and consistently kept that in mind in order to remain as
objective as possible.
The main purpose of choosing this topic is the authors’ interest in finance which has been
studied for four years in total within business administration. When looking into the
specific topic related to this study, the increasing importance of dividend policy has been
raised in recent studies. As previously mentioned, Miller & Modigliani’s (1961) theory
of dividend irrelevance assumes perfect markets which does not hold in reality. Instead,
market imperfections do cause dividend policy decisions to become relevant to firms’
management and investors. Due to the fact that preferences in terms of dividends do exist,
firms need to be cautious whenever altering their dividend policy in order not to upset
investors. Due to the asymmetric information available to management and investors,
where management usually has an information advantage, firms apply dividend signaling
as a means for the management to communicate their view of the future outlook of the
firm’s performance. If the asymmetric information is relatively high, the dividend policy
will be sensitive to future expectations of the firm (Dionne & Quederni, 2011 p, 1).
One of the main variables affecting dividend policy is ownership structure and is
interesting to investigate whether the dividend policy is dependent on different owners
such as family, state, institutional, foreign, employee and dispersion. This study is
focusing on these variables since the relative lack of previous research within this field,
especially when it comes to Europe. Additionally, the chosen country is Sweden because
the ownership structures are contradictory to previous research in developing countries
such as Turkey and India because of high taxes and strong legal system in the past. This
has led to an increased distribution of capital and family owned companies (Henrekson
& Jakobsson, 2003, p. 1).

9
The relevance of this topic is also related to the fact that ownership structure can be
different for different countries, especially comparing, for example, Western culture and
Asian cultures. Dividend policy can also differ because of different tax systems,
transactions costs and asymmetric information related to the country at hand. As
discussed above, the main preconception for this study is that the different variables in
the ownership structure will affect the dividend policies for firms in Sweden. This is also
proven in previous studies. But with this said, the dissimilarities between the geographical
settings in which previous studies have been conducted and Sweden in terms of ownership
structure, legal environment, information asymmetry and dividend policy may affect the
result of the study.
2.2 Our perspective The perspective utilized in this study is mainly focusing on external investors and already
existing owners of the companies in the OMX Nasdaq Stockholm Exchange, especially
the ones that are affected by this study. This due to the fact that ownership structure and
dividend policy are dependent on investors and shareholders instead of internal managers.
2.3. Research philosophy The research philosophy refers to the development of knowledge related to the set of
beliefs and assumptions about the reality. These assumptions are divided into two
categories; the assumption of human knowledge (epistemology) and the realities in the
research (ontology) (Saunders, 2016, p, 124).
2.3.1. Epistemology
According to Saunders et al. (2016, p. 127) the concept of epistemology refers to a branch
of philosophical assumptions about knowledge, what constitutes acceptable knowledge,
and the communication aspect of knowledge to other participants. Thus, epistemology
also reflects the origin, nature, limits, methods and justification of the individual
understanding and cognition. In order to look deeper into the concept of epistemology, an
individual develops an imagination about the concept of knowledge and applies this to
get a grasp of the understanding of the world (Barbara K.Hofer & Paul R.Rintrich, p. 4).
The epistemology assumptions consist of two different views; interpretivism and
positivism, which include different views of reality.
The interpretivism approach contains a subjective element and highlights the creation of
meanings from human beings which differentiate them from physical phenomena
(Saunders, 2016, p 140). Matta (2015, p. 546-547), further explains that it is a distinct
detachment between social sciences and natural sciences which is possible since the
inability for previous methods to be applied in future research. Furthermore, the
explanation and the assumption of the interpretivism can be categorized into two different
claims; actions explanations cannot be casual explanations and rationalization entails a
non-causal normative component. The purpose of this view of the reality is the creation
of “new, richer understandings and interpretations of social worlds and contexts”
(Saunders, 2016, p 151). This view is often related to qualitative research because of its
subjective nature.
Researchers who follow the positivism view believe that the philosophical position of the
natural scientist which emphasizes working with observable social reality to create
generalizations (Saunders, 2016, p 135). Walliman (2011, p. 21-22) argue that the reality
10
is independent from human beings and emphasizes the importance to reach and discover
theories based on empirical research. This is summarized into the reasoning that logical
reasoning and mathematical proof are rationally justified rather than focusing on
subjectivity and interpretation. The argumentation discussed above is connected to this
study since it is statistically tested and the data is without any ambiguity. Positivism is
often linked with quantitative, scientific, traditionalist and objective research especially
when the data is predetermined and highly structured which is related to the understanding
of this research.
When considering the approach for this specific study with the discussion above, a
positivist view was taken. This study is not aligned with the interpretivism approach due
to the lack of subjective view of perceived social reality and opinions from individuals.
Also, the purpose is not to evaluate individuals’ point of view or conduct interviews in
order to interpret human perspectives. As a result, collected generalizable and publicly
available empirical data used for objective interpretation was deemed the most suitable
data option. This data is then analyzed quantitatively since the availability of
predetermined data from the Thomson Reuters Eikon and the public accessibility of the
data from the Nasdaq OMX Stockholm index. In addition, the data of the ownership
structures is mandatorily updated and presented in each quarterly and annual reports of
all listed firms in Sweden.
According to (Wilson, 2010, p 10), the concept of positivism emphasizes the importance
that the researcher is independent from their research which means minimum interaction
with the participants in the study. Also, the view of the research should be considered
totally objective. In this study, the information gathered is without any interaction with
the listed firms as well as an objective view from the authors. As the previous studies
from developing countries in Asia follow the same reasoning and interpretation of the
data as this study, there is a legit motivation for the positivist approach. Finally, the
overall data can be seen as hard data which is hard to misinterpret and the risk of it being
altered can be considered negligible. The main drawback of positivism is the lack of
subjectivity when studying social phenomenon in order to evaluate certain behaviors from
humans. Other possible disadvantages are the impossible action of separation from
hypothesis testing and the deficiency of more in-depth understanding since the focus of
this study is to explain generalizability. Since this study focuses on collecting data, one
problem could arise if the data is inaccurate which would affect the results from the
hypothesis testing.
2.3.2. Ontology
The idea of ontology consists of assumptions about the nature of reality and the world.
The concept of ontology refers to the assumptions the researchers deal with when
deciding research objects and phenomena but also what the research is focusing on and
how it is interpreted (Saunders, 2016, p.127). Another abstract view is that it includes
several subdivisions of metaphysics which tackles the existential nature of human beings.
This creates dilemmas in research since the different views of interpreting objects and
phenomena (Jankowicz, 2005 p. 106). This view consists of two different approaches; the
objective approach which argues that social reality is independent and external to social
actors related to their nature. An opposing view, constructionism, involves seeing the
world as a subjective reality (Saunders, 2016, p.128).

11
Researchers with an objectivistic view comprise realism which includes seeing social
entities as physical entities of the natural world. To explain the concept in more depth,
Pearson (2014, p. 94), argues that the “real world” is split into preexisting categories and
exists without any human considerations or interpretations of the world. As a result, the
real world is easy to assess. In addition, in the extreme scenarios, an objectivist believes
that there is only one social reality by all social actors (Saunders, 2016, p.128). Lastly,
the concept of objectivism also explains the relevance of interaction between individuals
to create structure and policies.
The opposite view of objectivism is social constructionism and Saunders (2016, p. 130)
argues that the social reality is built through social interaction with social actors which
indicates that the shared reality creates meanings and realities. Human experience of the
real world is seen throughout interpretations and internal subjectivity (Pearson, 2014, p
94). It is therefore a unique view compared to the other views since it is focusing on social
actors and their importance for the society.
As discussed above and in relation to this study, the objective view is considered and
logical since both the ownership structure from annual reports as well as data collected
from Thomson Reuters Eikon is consistent and aligned throughout all firms. The purpose
is not to answer questions such as “why” “how” which is an essential part of
constructionism, instead focus on the question of “what” in the context of what is going
to occur. Consequently, the aim is to verify and generalize instead of explaining a
phenomenon. Furthermore, this study consists of guidelines and standards for estimating
dividend yield and constructing annual reports. The data and annual reports are public
and individual entities in the firms do not affect the results of the study. But with this said,
involvement of social actors might be inevitable when conducting research since data and
ownership structure related to dividend policy are based on norms in the annual reports.
This study uses hard data which is easily measured and can be analyzed quantitatively,
leaving a negligible risk of misinterpretation and subjective judgment. Since the purpose
is to verify, generalize and define a phenomenon, one possible drawback is that
sometimes this would be incorrect since it might be an impossible task.
2.4. Research approach A research approach reflects the evaluation of theories and the purpose and role of the
theories that the researcher is considering when conducting research. There are two
different types of theory-based views, namely deductive theory and inductive theory
(Bryman & Bell, p. 11).
When describing the deductive theory, the easiest definition is the relationship between
theory and research. The researcher creates hypotheses that must be subjected into critical
view of empirical findings and translate these hypotheses into researchable entities
(Bryman & Bell, p 11). It is also an approach that develops and confirms a theory from
basic context into substantial empirical evidence (Pearson, 2014, p. 69). Marshall (1997,
p 18) illustrates the deduction as a logical circle which goes beyond the theory itself, and
data is collected in order to test the theory. This circle involves four different stages;
theory development → hypotheses formulation → observation → empirical
generalizations. As discussed above and with logical reasoning, deductive approach is
connected with quantitative research in general.

12
In contrast, an opposite movement direction of deduction, induction relies upon a starting
point that a theory evolves from concrete empirical evidence towards more abstract
concepts and theoretical relationships (Pearson, 2014. p 70). As deduction process moves
theory to observations and findings, induction is reversed, first looking into observations
and findings and then evolve into theory (Bryman & Bell, p. 13). This is explained by
William M.K Trochim (2002, p. 42) with a “bottom up” approach with four stages exactly
the same as in deduction but the opposite direction; observation → pattern → tentative
hypothesis → theory. In addition, the main difference between the two theories is that
induction is relatively changeable and exploratory compared to deduction which is
unchangeable and focuses on testing and confirming hypothesis. As the theory moves in
an opposite direction, it is clear that the method used is often related to qualitative
research.
When choosing research approach, these are the two major branches with exception of
another theory, namely abduction, which is a combination between deduction and
induction. In contradiction to the other theories for the research approach, this theory is
not focusing on a starting point of many observations or theoretical assumptions, instead
applying a set of rules and the potential effects that comes from these rules. Furthermore,
the ideas and observations are then framed and examined and later evaluated and
questioned. After this is done, the researcher tries to evaluate multiple frameworks in
order to reach certain set up goals and create updates of the existing data and ideas in the
process (Pearson, 2014, p. 114).
When considering the options for which research approach that this study is focusing on,
it is quite uncomplicated. First of all, the epistemological approach that was chosen for
this study, positivism, follows the same view as deduction. Second of all, deduction is
connected with quantitative studies in comparison to induction which is associated with
qualitative studies. Another difference between deductive and inductive is the view of
theories where data is verified by already existing theories in deductive approach whilst
the purpose of inductive approach is to develop new theories. The main purpose of this
study is not to explore new fields or create understanding and analyze individual
perceptions. Given these premises, the best suited approach for this study is deductive
approach. Additionally, the information available in the area of ownership structure and
dividend yield is quite extensive using the annual reports and Thomson Reuters Eikon.
The purpose of the study is then not to develop new theories, instead focusing on previous
related theories from earlier studies on dividends and ownership structure and utilize the
theories in order to deduce hypotheses. As the data is available and statistical tests are
conducted, the hypotheses are then accepted or rejected. As a consequence of deductive
reasoning, the main disadvantage is the lack of new information and the reasoning is quite
circular and un-informative and a researcher can overestimate their logical reasoning and
intelligence.
2.5. Research design The research design of a study includes a strategy of defining and answering the research
question. Also, the strategy contains objectives from the research question related to the
study, specified sources from the data that is collected, how the data is collected and
analyzed and an evaluation of the ethical issues as well as the limitations related to the
availability of data, time etc. (Saunders, 2016, p. 164-165). Zikmund et al. (2009, p. 66)
simplifies the definition into a well-argued plan that develops and defines methods and
procedures in order to collect and analyze the relevant information. The purpose of the

13
research design is to evaluate the nature of the research which can be either exploratory,
descriptive, explanatory or a combination of these (Saunders, 2016, p. 165).
Exploratory research is conducted in order to clarify unusual situations or discover
potential opportunities within the field of the study. The purpose of exploratory research
is not to find strong evidence in order to decide a particular solution. In this sense,
exploratory research is somewhat endless and without definitive answers (Zikmund et al,
2009, p. 54). When the topic related to the study is unknown or unexplored, the researcher
is using exploratory design in order to develop questions that is useful for future studies.
There are two stages in exploratory research; firstly, the researcher develops an
understanding of the topic in order to create an exploratory design. Secondly, this
exploratory design is executed into a more systematic and extensive study (Pearson, 2014,
p. 38).
The second research design, descriptive design, is valuable in order to describe certain
characteristics which are of interest when conducting research, especially different
situations related to the specific variables connected to the study. This can be related to
this study, for example, ownership structures such as family ownership, state, institutional
and so forth. The main purpose of a descriptive study is that the researcher can create a
context of a phenomena of interest related to individuals, organizations or other
interesting views (Sekaran, 2003, p. 122-123). As mentioned, its characteristics involves
objects, people and organizations which can be connected to business information
(Zikmund et al. 2009 p.16). Therefore, as this study is mainly focusing on business
information one can describe it as some type of descriptive research.
As the name indicates, explanatory research involves relationships between variables, for
example, between dividend yield and family ownership in this study. The concept of
explanatory research often asks questions such as “Why?” and “How?” during the process
of data collection (Saunders, 2016, 176). The main purpose of this type of design is
illustrated by Pearson (2014, p. 38) as explanatory elaborations, extensions and testing
theories in order to develop the theories. It also aims to determine what type of
explanations to choose as well as supporting general explanations or predictions.
Including the discussion above, the most suitable design for this project is to combine the
descriptive design and the explanatory design, namely descripto-explanatory design. As
the study is fairly new, especially in regards to the European setting, and the emphasis on
describing and finding hypotheses and cause and effect between ownership structure and
dividend policy. Also, the cause and effect related to control variables is used in order to
describe the differentials in causality. In addition, the statistical tests will be conducted
using descriptive data focusing on the main variable ownership structure and the
correlation to dividend policy. This is done through a process that is strict regardless of
what type of company that is analyzed. The purpose of the study will be to start with
describing a pattern and later on explaining that particular pattern in contradiction to
exploratory research design which emphasis on explaining perceptions of individuals and
explore new areas in order to create insights into the specific research area. As discussed
previously, the study contains mostly business information which is related to descriptive
research. One drawback of descriptive research is the confidentially issue where studies
can be untruthful given that the researcher is not confident in answering the specific
question related to the research. Another disadvantage can be the ignorance of important
data in order to confirm hypothesis.

14
2.6. Research strategy A research strategy is defined as procedures the researcher is using in order to evaluate
and answer the research question (Saunders, 2016, p. 726). There are several strategies
that are used based on quantitative research design, qualitative research design and mixed
design. The typical strategies for quantitative research design includes experiment and
survey compared to qualitative research design that include ethnography, action research,
grounded theory and narrative inquiry. When considering the strategies that involve all
of the above mentioned designs, archival/documentary research and case study are
typically used (Saunders, 2016, p. 178).
The fundamental basic of experimental research is the origin in natural sciences and the
involvement in quantitative research (Saunders, 2016, p. 178). In the process of an
experimental research, the researcher is dividing two different groups into one that is
manipulated and one that is open-minded. After this, the researcher compares the different
characteristics of the groups in order to see if there is any major difference between them
(Pearson, 2014, p. 47). In addition, the operational process of experimental research
includes measurements of independent and dependent parameters with a starting point of
using numbers and later on measurements of quantities counted in units (Srinagesh, 2006,
p. 29). Based on this, the concept of experimental research is related to the cause effect
relationship and the main purpose is the ability to confirm, predict (hypothesis) and
control certain fields of nature rather than focusing on the specific research question
(Srinagesh, 2006, p. 50).
The other strategy that is connected to quantitative research, survey strategy, often uses
interviewing, administering questionnaires, and observing people and phenomena with
standardized data in order to evaluate different populations. This strategy is related to
deductive research approach and exploratory/descriptive research because of the
questions the researcher is answering such as “what”, “who”, “where”, “how much”,
“how many” etc. In addition, the most beneficial aspect of surveys is to explain and
understand comparable data and generalize populations (Saunders, 2016, p. 181). Sekaran
(2006, p 223) illustrates the survey respondents as a storywriter and the respondents
answers the questions with their own thoughts, feelings, attitudes and expectations in
order to interpret the data.
Looking into the strategies in the category of qualitative research, ethnography strategy,
involves meanings and behavior of humans that is specified into one particular location
(Lecompte et al, 1999, p 1). It is relevant to study the culture and the social world of a
specific group when conducting ethnography research (Saunders, 2016, p. 187).
As the name implies, action research is concerned with action planning in order to identify
and gather relevant data to create solutions, especially when considering process changes
in organizations. When the solution is established, the different organizations implement
the necessary changes and evaluate the consequences related to the specific
implementation. After this, the actions taken are continuously evaluated, defined and
diagnosed on a regular basis in order to solve the particular problems that the organization
is facing (Sekaran, 2006, p. 36).
Another strategy that is widely used in qualitative research is grounded theory, which is
connected to inductive theory due its high correlations with building, formulating and

15
testing theoretical ideas (Pearson, 2014, p.70). As the researcher is focusing on questions
that are analyzed and repeatedly evaluated by himself, the theory is valuable in situations
where hasty and dynamic changes are needed. In this sense, the researcher tries to
discover and derive deeper understanding to a potential explanation about the issue at
hand (Zikmund et al, 2009, p. 69).
A narrative inquiry is a quite new qualitative research strategy and focuses on storytelling
instead of analyzing data. The process involves interviewing a few participants
exclusively in storytelling mode. As the researcher is analyzing complete stories from the
participants, the purpose is to collect and analyze the context of the stories instead of
collecting certain parts of the data and the interview questions. Afterwards the researcher
needs to consider the most important parts of the story to be retained (Saunders, 2016, p.
197-198).
When considering the strategies that can be included in all types of research,
archival/documentary strategy is valuable when there is an interest in findings of
historical data. It is based on the possibility to find certain historical data to evaluate
differences from the present and the past, especially using the internet as a resource as
well as the creation of online archives. The availability of data has expanded through
globalization and advances in technology. Since the increased availability of data sources
from internet during the recent years, the archival/documentary research is now a popular
strategy when conducting research (Saunders, 2016, p. 183-184).
When choosing the case study strategy, the researcher is investing in obtaining an
extensive understanding of a particular phenomenon in real life context in order to
simplify complex concepts. Since the large amount of variables and multiple sources in a
case study strategy, it is quite a challenge to be able to acquire any valuable research
findings. With this in mind, if the case study simplifies the concepts, there is a possibility
to build theories with good quality (Yin, 2009, p. 2-3). This strategy can be conducted in
any type of research but is mostly used in explanatory and exploratory research designs
(Saunders, 2016, p. 185).
After the discussion above, the alternative that is most suitable for this study is the
archival/documentary research. Since the quantitative research strategies involves other
types of data collection such as historical data and quantified data compared to qualitative
research strategies, the archival research is the only logical strategy to choose. The
argumentation for this is the examination and the analyses of corporate financial
statements and the interest in reviewing historical data from the firms in the sample. As a
result, the study is not focusing on experimental research rather raises the question if it is
possible to handle and deal with variables. Some of the excluded strategies includes
answering the question of “why” and “how” which is contradictory to this research. As
the research question and related studies are focusing on time series data related to
dividend yield and ownership structures, the archival/documentary research is relevant
based on the fact that this type of study is based on dividend and ownership trends.
2.7. Time Horizon An important step in research is to choose what type of time frame that is appropriate
depending on the research question. This is a question whether to study a certain
phenomenon as a snapshot in one point in time or a series of snapshots during a longer
16
period of time. There are two possible choices depending on what type of time frame the
research is focusing on; cross sectional or a longitudinal study (Saunders, 2016, p. 200).
A cross-sectional design is very closely related to the survey strategy since the connection
with the usage of questionnaires and structural interviews. If for example a questionnaire
with a quantifiable sample is used in order to collect data on more than one case at a
particular point in time and with two or more variables, a typical cross-sectional design
is relevant to use in order to detect patterns of association. The main characteristics of a
cross-sectional study is the interest in variation of variables, in collection of data
simultaneously, quantified data and patterns of association (Bryman & Bell, 2011, 53-
54). This type of study is often used when there is a time constraint (Saunders, 2016, p.
200).
In contradiction to this, the longitudinal study examines data across time and variables
are measured repeatedly on different occasions (Menard, 2002, p. 2). There are three
different types of longitudinal studies, namely time-series, panel and cohort study. Time-
series studies is when a sample is collected during multiple time points in order to evaluate
whether there is a change or stability of the sample or follow certain conditions during a
specific time period. Panel studies is when a researcher is focusing on observing one
particular sample across different points in time. Lastly, cohort study is comparable to
panel study but with the difference that the selection of the sample is categorized with
similar life experience during a time period (Pearson, 2014, p. 45-46).
There are several arguments using both cross-sectional and longitudinal study in this
study. This study aims to compare the whole time period from 2010-2015 using a database
in order to assess the ownership structures effect on dividend policy for the purpose of
generating a large enough sample. However, no time effect is taken into consideration,
but every observation from each year is treated as an individual observation. With these
considerations, the study aims to convey a cross-sectional.
2.8. Research method The different methodological choices that can be used in a research has previously been
mentioned, but in this section the purpose is to go into more depth the specific definitions
of the methods and what method this study is utilizing. As the mixed method is based on
both quantitative and qualitative methods, the main discussion will be about explaining
quantitative and qualitative method and their connection to this study (Saunders, 2016, p.
165).
In general, quantitative research is associated with positivism and deductive approach but
can sometimes be qualitative, especially when certain attributes of a phenomenon needs
to be differentiated or when quantitative data develops theories (Saunders, 2016, p. 168).
Saunders (2016, p. 168) and Zikmund (2009, p. 138) further explains the quantitative
method as the objective from empirical findings that describes the relationship between
variables. These are then analyzed through statistical tests and graphs as well as numerical
measurements. As a result, there is less room for interpretation and the findings can often
be generalized. Zikmund (2009, p. 135) illustrates the differences between qualitative
method and quantitative method; quantitative is correlated with objective view, numerical
values and large samples whilst qualitative methods is subjective, in-more depth
interviewing and smaller samples.

17
In wider terms, the qualitative method is based on the assessment of experiences from the
sample in greater detail. Some of the methods included when conducting qualitative
research includes in-depth interviews, focus groups, observation, content analysis, model
building, and life experiences. It’s associated and related to subjectivism, naturalistic
approach and interpretivism (Hennink et al. 2011 p. 8-9).
As the data is statistically tested and the study aims to formulate hypotheses, the
quantitative method is logical, also because of the methods for epistemology, ontology
and research approach are connected to quantitative approach. Furthermore, the purpose
of this study is to explain if ownership structure affects dividend policy from 2010 to
2015 in Sweden and to generalize the results in order to create value for further research.
In order to understand the models developed in this study, a lot of descriptive text will be
included.
2.9. Literature and data sources When conducting research, the data used can be obtained from primary or secondary
sources. Researchers who collect primary data are interested in data which has not been
collected before or is not available for other reasons. This includes sources from whom
opinions can vary between different occasions such as individuals, focus groups, panels
with different respondents etc. Secondary data on the other hand is collected from an
outside source rather than the researcher personally. Some typical secondary sources
include organizational records, information collected from government departments,
industry analyses offered by the media, web sites, databases etc. As secondary data
includes sources such as annual reports and databases such as Thomson Reuters Eikon,
which will comprise the majority of the data of this study, the information gathered will
be extracted from secondary data sources (Sekaran, 2003, p. 219-223).
As this study is based on secondary data, a range of sources has been utilized in order to
find relevant information. One of the sources is Umeå University library, in which both
the physical library and the online library sources have been used frequently. Other
sources includes databases such as Google Scholar, EBSCO with Business Source
Premier as the main target, DIVA (Digitala Vetenskapliga Arkivet), Emerald, Science
direct and JSTOR and Thomson Reuters Eikon. In order to find articles and books that
will match the above mentioned criteria recurring search words were: “Ownership
structure”, “Dividend policy”, “Dividends”, “Ownership structure in Sweden” and
“Dividend policy in Sweden”. As this study is a partly upgraded version from the studies
conducted in Asia, some of the search words included the same phrase as the research
question “The effect of ownership structure on dividend policy”. First hand references
has been used in order to reduce the possibility of misinterpretation of the sources.
To look further into detail of the data collection and the sampling from Thomson Reuters
Eikon, it was crucial to select a large sample of companies and also companies with data
about ownership structure and dividend yield. Some of the criteria for the companies were
ownership data such as institutional, dispersion, state, foreign and insider ownership.
Additionally, it was required for the companies to have data for the entire period 2010-
2015 in order to generalize findings. As a result, the sample was collected from firms
listed on the small, mid and large cap of the NASDAQ OMX Stockholm exchange. The
sample collection will be discussed further in chapter four.

18
In order to be able to evaluate the literature and data sources, one has to consider the
source criticism in order for the research to be reliable and unbiased. This has been of
great importance during the whole research to be as consistent with authenticity,
reliability and credibility when evaluating sources related to ownership structure and
dividend policy. If this is not the case, some of the findings or results as well as the context
of the research can be distorted. Since this study is mainly focusing on secondary sources,
the authors has put great emphasis of the understanding and utilization of credible and
authentic sources. In addition, secondary sources is in general easier to ensure quality
than primary sources but in order to reduce the possibility of poor quality a set of rules
have been conducted throughout the research. In regards to the sources’ credibility and
reliability, most of the sources are collected from peer- reviewed articles and research but
also respected academic journals mainly to ensure a high quality throughout the research.
In order to evaluate the literature, the authors have followed the criteria from Saunders
et. al (2016, p. 104-106) including assessment of the relevance of the literature connected
to the research question and objectives of the study, the value of the literature to ensure
good quality of the research and a sufficient amount of literature.
2.10. Ethical, legal and social considerations When conducting academic research, one very important aspect to consider is the
legitimacy of the research. One has to make sure that the findings are truthful and do not
do any harm to anyone involved, the society in general neither or the academic field in
which the researcher is working. Therefore, researchers must make sure to take ethical,
legal and social aspects in consideration and ensure that the research conducted does not
violate them. If sufficient attention is not paid to this aspect, it risks undermining the
quality of the research and any otherwise fruitful findings may be deemed illegitimate.
Ethics is a crucial part of the research methodology since one needs to make sure to define
and follow those ethical standards deemed appropriate before one starts the research.
While at first glance, defining ethics may seem like an easy task since ethics essentially
rule what is right and what is wrong and that common sense should be enough to
determine what ethical behaviour is and what is not. However, common sense is subject
to individual values and can vary widely within even certain social groups, let alone
within different academic fields or geographical and cultural settings (Resnik, 2015). It
may be difficult to make strict definitions of ethics, due to the fact that they vary within
different settings. As mentioned, the collectively acceptable behaviours may vary
significantly within different social and geographical settings and identifying universal
ethical behaviours is therefore difficult and even within limited settings, it may require
significant philosophical reasoning to do so. However, Saunders et al (2016, p. 239)
defines ethics as “the standards of behaviour that guide your conduct in relation to the
rights of those who become the subject of your work, or are affected by it”.
Two main philosophical positions have been identified, which conflict with each other,
namely deontological and teleological. The deontological view aims to follow ethical
standards by following a determined set of rules. According to this view, acting outside
those rules is a breach of ethical standards and thus can never be justified. If those rules
are incomplete or unclear, it is necessary to either re-evaluate them or change them. On
the other hand, the teleological view asserts that an ethical behaviour should not be
determined by any rules, but that each action should be evaluated based on its
consequences. In this case, choosing a research behaviour is a trade-off where one needs
19
to evaluate whether the positive outcomes outweigh the negative consequences of those
actions (Saunders et al, 2016, p. 240).
One major issue when it comes to research is that of affiliation. Academic research is
costly and researchers depend on funding in order to conduct their research. In order to
counter the issues of biased studies and the increased commercialisation of universities,
the Missenden Code was set up. It aims to help universities battle commercial influences
on its research by providing them with guidelines on how to monitor their sources of
funding and sponsorships. It also requires that the source of funding must be
acknowledged in any publication subject to any sponsorship (Saunders et al, 2016, p.
142). In the case of this paper, neither of the authors receives any sponsorships other than
the regular funding provided to all students in the Swedish higher education system. As
a result, there is no financial underwriting by any sources with interest in this subject and
this paper is therefore not subject to the risk of biased research as a result of ties with
outside organisations or companies.
Within ethics, there is also the aspect of respecting individuals’ rights and wellbeing.
Diener & Crandall (1978, p. 17-97) has broken down this into four main areas, namely 1)
whether there is any harm made to the participants, 2) whether there is a lack of informed
consent, 3) whether there is an invasion of privacy and 4) whether deception is involved
(Bryman & Bell, 2011, p. 128). Harm to participants can involve more than just physical
harm – causing participants stress, negatively affect their career prospects and so forth
may is also regarded as inflicting harm. It is also important to make sure to get a clear
consent from the participants and respect their privacy, even if the results cannot be traced
to the respondent personally.
The European Union has implemented laws which aim to protect the privacy of
individuals. The European Union’s implementation of Directive 95/46/EC is one example
of how the protection of individuals’ personal data is increasing in importance and
extends the ethical considerations to a legal framework, thus adding another protective
layer for those individuals subject to research. This directive protects individuals’ data in
terms of data processing, storing and movement (Saunders et al, 2016, 261). However,
considering the fact that the data used in this study is only gathered from secondary
sources as well as the fact that the data gathered is openly accessible to the public the
authors do not consider the risk of violating the protection of personal data and privacy
to be significant.
Last but not least, deceiving participants is obviously an unacceptable research manner.
As this study only uses secondary financial data relatively readily available and no
personal interactions with any participants are involved, the authors deem the risk of
violating this ethical aspect very small and/or negligible as well.
Apart from the privacy and data protection laws, there are other legal boundaries one
needs to respect. One of these, which is highly relevant to this paper, is the aspect of
copyright. When gathering data online, one needs to make sure proper attention is paid to
ensure that no copyright infringements are made and beware of plagiarism (Saunders et
al, 2016, p. 261). The authors of this paper have been careful when gathering data and
information from other sources and all sources have been referenced in order to ensure
that their work has been acknowledged and permission to reproduce copyrighted material
has been sought where necessary.

20
Figure 1. Summary of methodology used.
21
3. Theoretical framework This section is answering the research question and gives a further understanding of this
field of study. This includes the main theories and pillar stones related to dividends and
dividend policies as well as ownership structure. The main theories that is discussed in
this section for dividends is the irrelevance and relevance theory, clientele effect,
signalling theory and the optimal dividend policy. For ownership structure, the relevant
theories is the distribution of equity, optimal ownership structure and the determinants
and factors behind ownership structure.
3.1. Dividends In this section, there will be a presentation of the different types of stocks and the different
types of dividends in order to limit the specific type of dividends that this study is focusing
on. First, common stock refers to a security that symbolizes the ownership of the company
without restrictions or rights of the total number of shares issued by a company.
Accordingly, common stock has the most potential to increase earnings but also the
highest risk since the shares are paid last when the company is close to bankruptcy. The
common stockholders have the control of selecting the board of directors as well as the
voting procedure for companies’ policies (Parameswaran, 2011, p. 97). Second, preferred
stock is referring to the category of ownership that has higher demand on a company’s
assets and earnings than common stock. In general, preferred stocks exclude voting rights
and a dividend is often paid out to other stockholders before dividends is paid to common
stockholders. Also, dividends is often paid at a fixed rate which is similar to debt
securities but with the difference that preferred stocks represents the ownership of the
company and dividends is not a part of the company’s legal debt (Parameswaran, 2011,
p. 119).
If looking into the different types of dividends, a stock dividend involves issuing
additional shares for the company’s shareholders instead of paying out cash. As a result,
the total market value of the company´s equity is maintained at the same level, the only
difference is the increase in the total number of shares outstanding. Thus, the stock price
will decrease since the total value of equity is spread out into a large amount of shares
(Berk et. al, 2012, p.522). A cash dividend is when a company´s cash from earnings and
profits are paid to stockholders (Berk et. al, 2013, p. 533). When the cash dividend is
paid, it must be declared and taxed as income by the shareholder (Berk et. al, 2012, p.522).
3.1.1. Dividend irrelevance theory
The relevance on dividends’ effect on firm value has been debated among scholars ever
since the first research in the field commenced. The theories on dividend policy has
essentially two opposing schools of thought: on one hand, the thought that dividend policy
is irrelevant to the value of the firm and on the other hand, that it is indeed relevant. The
dividend irrelevancy theory’s main advocates are also its founders, Franco Modigliani
and Merton Miller. They first published their views in two papers (1959, 1961).
Miller & Modigliani (1961, p. 412) theorized and modelled that investors’ valuation of a
firm should be unaffected by and irrespective of its dividend policy under the following
assumptions:
1) Perfect capital markets where no single actor is large enough to affect the equilibrium
by trading, there is not difference in taxation between capital gains and dividends, all
investors have equal and costless access to information and there are no transaction costs.

22
2) Rational behaviour where investors always will choose the option that maximises their
wealth and have no preference for earnings distributed as cash dividends neither or capital
gains
3) Perfect certainty where all investors have full assurance of the future investment
program as well as future profits of every corporation. Due to this assumption, there is no
need to distinguish between stocks and bonds as sources of funds.
4) Should firms have paid too much in dividends, they can raise new capital by issuing
new stock costlessly.
3.1.2. Dividend relevance theory
The main opponents of the dividend irrelevance theory argue that the assumptions made
in the dividend irrelevance theory are too unrealistic. According to this line of thought,
there are in reality no circumstances under which assumptions such as a world free of
taxes and transaction costs, perfect information is available to everyone, where all
investors behave rationally and in the same manner and so forth, exists. Therefore, Miller
& Modigliani’s theory of dividend irrelevance has no practical relevance since it is never
going to occur. The main schools of thought were developed by Lintner (1962), Gordon
(1963) and Walter (1963) in response to Miller & Modigliani’s findings.
The bird-in-the-hand theory was developed by Lintner (1962) and Gordon (1963)
independently of each other but both arrived at the same results. According to this theory,
dividends are relevant because some investors prefer dividends over capital gains as
dividends generate definite cash returns today while capital gains are generated over a
longer period of time in the future and can be unpredictable. This theory also takes taxes
into consideration and states that taxes have implications on dividend policy. On one
hand, dividends and capital gains are taxed differently in some countries (this is not the
case in Sweden, however), which may affect dividend policy. On the other hand, capital
gains allows the individual investor to defer or carry over the capital gains tax to another
desired period. This is not possible for dividends, as the dividend policy is controlled by
the company and taxes need to be paid for the period in which dividends are received.
Lintner’s (1962) and Gordon’s (1963) theories assume that
1) All equities and debts are traded in purely competitive markets where no investor is
large enough to singlehandedly affect prices by his/her actions.
2) Investors are only motivated by personal gains. Investors always act rationally and will
always maximise their current wealth.
3) Stock prices are equal to the present value of all future returns. The current value is the
sum of all future dividend payments minus the current price, plus the future sell price
(Lintner, 1962, p. 246).
According to this line of thought, the yield of a stock has an inverted relationship to the
dividend payout ratio relatively higher dividend payouts. The company’s growth
prospects are hurt by high dividend yields since the amount of retained earnings available
for reinvestment decreases. Subsequently, the growth in future capital gains will be hurt
by the higher dividend payout ratio. However, as previously mentioned, investors prefer
dividends over capital gains and thus a trade-off arises in regard to dividend yield.
Walter (1963) refined the dividend relevance theory further by creating a model which
states that dividends are relevant to the value of a firm. In his model, the important factor
is the rate at which the investor can reinvest the dividends paid in relation to the return

23
that the firm can generate on retained earnings. If the investors’ reinvestment rate is higher
than the return rate of the projects in which the firm can reinvest the retained earnings,
the firm should distribute all its earnings as dividends. If the opposite is true, i.e. that the
firm can successfully reinvest the retained earnings at a higher rate than the investors,
then the firm should retain all its earnings for reinvestments internally. If both the
investors and the firm can reinvest the earnings at the same rate, then the firm is
indifferent between retaining earnings and distributing it to investors.
3.1.3. Agency theory
Since the dividend irrelevance theory indicates that the managers and shareholders are
without any conflicts, however, this statement can be questioned since the owners and
management are separate entities. The conflict arises when managers and the shareholders
act in their own interest without consider the other part in the conflict. Therefore, the
relevance of agency costs obtained by shareholders is necessary in order to monitor the
behaviour of the managers and is an implied cost related to the conflict of interest between
shareholders and managers. The decision to pay out dividends can reduce this types of
conflicts and also the agency problem by restricting the available conditional funds to
managers. (Rozeff, 1982, p. 249-258).
In order to examine the agency problem effects on dividend policy, La Porta et. al (2000)
created two agency models of dividends. One consider the possibility that dividend
payout is a result of efficient legal protection, especially for shareholders, which allow
small shareholders to obtain dividend payments from the firms insiders. The second
model suggests that dividends is a replacement of effective legal protection which
increases the reputation of the firm when it comes to treating investors in environments
that are highly unprotected. This is done by using different dividend policies (La Porta et.
al, 2000, p. 27).
La Porta (2000) found that if the legal environment is highly protected for small
shareholders, the firm often pays higher dividends and firms with a high growth tends to
pay lower dividends. (La Porta et. al, (2000), p. 27)
3.1.4. Clientele effect
Similar to the bird-in-the-hand theory, research has concluded that dividends do indeed
influence investors’ decisions when making investment decisions by the fact that some
investors systematically choose dividend policy as a favourable characteristic when
evaluating stocks. Certain investors actively search for stocks with high dividend yields
as a portfolio composition in order to suit their investment style, such as generating stable
cash flows from their investments. This is a particularly common observation among
institutional investors who are trying to achieve a certain pattern of cash flows, as
observed by Hotchkiss & Lawrence (2007, p. 1). For their sample of companies, they
observed a change in characteristics of the institutional investors holding stocks when the
dividend yield was changed, indicating that a dividend preference may exist among
institutional investors since those institutional investors preferring high yield stocks
invest more in a particular stock when the dividend yield is increased, while those
preferring low yield stocks invest less and vice versa. Furthermore, they also found a
significantly greater probability of investors preferring high yield stocks to increase
(decrease) their holdings in a stock after an increase (decrease) in dividend yield
(Hotchkiss & Lawrence, 2007, p.1).
24
3.1.5. Dividend signalling theory
The efficient market hypothesis has developed from Maurice Kendall’s (1953) discovery
that stock prices’ patterns were impossible to predict from day to day. While at first sight
it appeared as his findings suggested irrationality in financial markets, financial
economists later realised that unpredictability of markets suggested the opposite –
efficient markets. The logic behind this reasoning is that if predictable patterns existed,
arbitrage opportunities would arise which would quickly be exploited and thus move
prices to their predicted fundamental level. As any news such information about firms
which affects its future earnings become available, market participants will incorporate
this information and correct the prices almost instantaneously. However, investors can
only incorporate information that they have access to. The efficient market hypothesis is
generally divided into three versions; weak, semi-strong and strong form. The weak form
suggests that all past information such as historical stock prices and trading volumes are
incorporated into the price and thus renders trend analysis, such as technical analysis,
useless. The semi-strong form states that all publicly available information, including
information from economic reports, financial statements, brokerage firm
recommendations and so forth, is incorporated in stock prices. In the semi-strong form,
fundamental analysis and stock picking based on financial news has no use. In the strong
form, all information, including insider information, is incorporated in stock prices. In the
strong form, there is no way to earn abnormal profits from any analysis strategies (Bodie
et al, 2014, p. 349-354).
While there is strong support of the fact that the efficient market hypothesis exists, i.e.
that prices reflect all available information, it is less clear to which extent information is
in fact widely available and thus can be incorporated in the price. Some markets are more
efficient than others, but few researchers argue with the fact that the strong form of
efficient market hypothesis exists. Managers and other insiders of firms clearly have
superior access to information in relation to an outside investor or analyst. This is the
reason why legislation is strict about preventing and monitoring insider trading (Bodie et
al, 2014, p. 354). Since managers and other insiders have superior information, outsiders
monitor managers’ decisions for clues about undisclosed information. Dividends have
been proven to be a strong indicator of firm management’s views of the firm’s future
prospects and thus convey information to investors.
Researchers have realised that the Miller & Modigliani theorem does not hold in reality,
since the assumptions made in the model are too unrealistic. Lintner (1956) presented an
alternative approach to the dividend irrelevance theory where the assumption that all
investors have perfect access to all information was relaxed and thus that managers
possess inside information. He found that firms are reluctant to change dividend policies
unless they are certain that the new level is sustainable over a longer time horizon. Firms
are reluctant to reduce their dividends as this signals that managers perceive the future
prospects to be poor which will have a negative impact on investors’ valuation, i.e. the
share price, of the firm. Reversely, increasing dividends signals that managers expect a
positive shift in longer term earnings. As a result, common practice among firms is to
smooth dividend payouts over time and thus decrease the volatility of dividends, thereby
limiting shocks to the share price caused by dividend announcements. Michaely &
Roberts (2006) studied the reasons behind why firms follow this behaviour and found that
public firms were more prone to smoothing dividends than private firms. They concluded
that the reason behind this was related to the scrutiny of public capital markets and
traditional financial frictions (Michaely & Roberts (2006, p. 38-39). Ross (1977 p. 23)

25
also found that managerial incentive schedules and decisions on financial structure signal
information to investors about the managers’ perceptions of the firm’s future prospects.
The author also found that leverage increases the value of firms, since the market’s
perception of value is increased by leverage.
As opposed to dividend smoothing, the residual dividend theory assumes that firms pay
dividends to shareholders using leftover cash once all profitable investments have been
pursued. Should a shortfall of cash arise, firms simply cut or omit dividends for the period.
This dividend theory is however not commonly practiced except during crisis, due to the
resulting volatility of dividends which is generally not received well by investors.
Dividend smoothing is therefore the most commonly preferred option. Firms build up
cash for future investments in order to ensure that a smooth dividend pattern may be
sustained and should a shortfall of cash arise, they tend to rather raise new cash through
short-term borrowing rather than cutting dividends (Smith, 2011, p. 1).
3.1.6. Optimal level of dividends
There are three classic models that estimates the optimal level of dividends, including
Rozeff (1982), Higgins (1972) and Lintner (1956). Lintner (1956) developed a theoretical
model concerning dividend decisions and dividend policy (Lintner, 1956, p. 97). This
model explains the dividend smoothing where a company’s dividend payout decisions is
divided into two factors; higher values of NPV (net present value) and earnings indicate
higher dividends and a company might wait to increase dividend payouts even if the
earnings increases because of the insurance that the company is maintaining profits
(Lintner, 1956, p. 97-113). Myers (2010) extended the model saying that the dividend
payout decisions is for managers who seek to maximize the resources of the company in
order to acquire economic gain for their own private benefits. This is of course questioned
by outside shareholders who might try to constrain and force these type of actions and
dividends to be as collective as possible. Since managers are risk-averse, their preferences
allows them to behave automatically (Myers, 2010, p. 27-30).
Higgins (1972) created a model of which the dividend-saving decision is aligned with the
Modigliani & Miller (1958, p. 296) valuation theory. Due to the existence of taxes and
transactions costs, shareholders prefer capital gains over dividends given that dividends
is seen as a residual in the decision making process of the company. This view still affects
firm value since the optimal level of dividends is also determined by other factors such
as investment decisions and financing these decisions at the lowest cost possible.
(Higgins, 1972, p. 1527). In contradiction to this theory, the bird-in-the-hand theory
developed by Gordon (1963) and Lintner (1962) states that investors develop a preference
for dividends to counter market imperfections such as information asymmetry and limited
certainty. With the name derived from the saying “A bird in the hand is worth two in the
bush” (unknown origin), the theory suggests that the market prefers to receive cash
dividends over capital gains due to the capital gains, received in the future, are more
distant and thus carry more uncertainty and risk. By receiving earnings as cash dividends
today, the uncertainty is removed and allows for consumption instantly.
Rozeff’s (1982, p. 249) further developed a model of optimal level of dividends where
the suggested optimal level of dividends is a trade-off between higher dividends and lower
agency costs but also the increase of transaction costs related to external financing.

26
3.2. Ownership structure Managerial ownership can be defined as the shares that are hold by managers. Holderness
(2003, p. 75-100) defines the managerial ownership as the amount of the total shares held
by insiders (officers and directors) or block holders.
State ownership consider the level of government involvement in the company such as
central, federal, state, regional or local. These companies are often privatized and the
majority or minority of the shareholders are from the government. The shares are owned
through asset management funds, restructuring corporations, asset management funds and
development lenders. (PwC, 2015)
Institutional ownership is defined as the investors with the main characteristic that they
are legal entities without any physical persons involved in the process. This includes
hedge funds, investment funds and pension funds etc. Another characteristic of
institutional investors are that they operate independently or are included in large
companies or conglomerates. (Celik & Isaksson, 2014, p. 95-96).
Family ownership refers to a public company with at least 5% shares owned by a family
or a founder but can also be defined as a family firm when the first series of people in the
second generation is involved in the business. In addition, the main characteristics is that
it is controlled and managed by many family members and generations (Kraiczy, 2013,
p. 7).
Foreign ownership is a company with 25% shares owned by foreign investors (Wilkinson,
2013, p. 3). It also consider an investor that is from one country to acquire a long-term
ownership in another country including voting shares and rights (Contessi & Weinburger,
2013, p.63).
Dispersed ownership means that the amount of shares is below 5% for all shareholders
and the specific type of shareholders are without voting rights as well as control over the
company. (Leech and Leahy, 1991, p. 1418). As a result, the concentration of ownership
is low when a company has a lot of different shareholders. In dispersed owned companies,
the owners prefer profit management in order for the executives to gain short-term value.
(Goldberg et. al, 2016, p. 39).
Employee ownership includes companies that are fully or majorly owned by the
employers of the company, both indirect and direct since the trust funds established by
the employees.
This includes co-owned companies (employees have a minority stake in the company),
employee share ownership (both large and small shareholdings in a company), worker
co-operatives (is a legal entity which consider splitting shares and voting rights),
employee financial participation (the employees share profits) and trust owned
business(shares are owned by an employee trust or trusts with charitable objectives)
(Postlethwaite et al, 2005, p. 3-4).
The distribution of equity can have several implications on the valuation and control of
the firm. The optimal ownership structure is not necessarily the one that simply
maximises valuation and/or lowers agency costs. Jensen & Meckling (1976) found that a
firm which previously had a pure managerial ownership structure will increasingly
generate agency costs as the degree of equity held by outsider’s increases. When the

27
managers are the single owners, they will maximise their utility not simply by maximising
firm value, but also by creating non-pecuniary value for themselves which may impair
the value of the firm. Such activities may include entering, from the firm’s perspective,
less beneficial contracts with friends than if they had been signed on the open market,
splurging on excessively generous company benefits and so forth (Jensen & Meckling,
1976, p. 10-12). However, once the firm accepts outside equity, conflicts of interest will
arise due to the fact that outsiders reap no benefits from those lavish activities while
bearing the costs of them. As the amount of outside equity increases, the managerial
incentives to increase their personal power and wealth increase since their share of the
cost borne decreases with their relative share of the firm ownership (Jensen & Meckling
1976, p. 58). As a result, the firm needs to make sure that appropriate monitoring activities
are in place to make sure that managers work towards maximising firm value rather than
their personal interests. One popular way to conduct this monitoring is by paying out
dividends. By distributing earnings to shareholders instead of financing its investment
activities using free cash flows, the firm must remain in and raise its financing in capital
markets which provides an effective and cost-efficient monitoring mechanism due to the
exposure towards scrutiny of outside investors and stakeholders (Eastbrook, 1984, p. 657-
658). By distributing earnings as dividends, the amount of resources under managers’
control as well as the power they possess decrease and consequently, as firms raise
financing in capital markets, managers are to a much wider extent forced to behave and
act in the best interest of the firm. This reduces their propensity to take excessive risks
and their freedom to act in their own interests. These findings are reinforced by Eckbo &
Verma (1993) who found a positive correlation between the magnitude of dividends and
the amount of voting power held by institutional shareholders and a negative correlation
between the magnitude of dividends and voting power held by manager-owners among a
large sample of Canadian firms listed on the Toronto Stock Exchange. In their sample,
those firms in which manager-owners had voting control, dividends were almost always
zero. Meanwhile, all firms under corporate/institutional control paid dividends. These
results indicate that the allocation of voting power between of management owners and
institutional owners can be used as a predictor of corporate dividend policies. They also
support the conflict of interest between managerial owners and institutional owners,
where managerial owners prefer free cash flows and institutional investors prefer
dividends (Eckbo & Verma, 1993, p. 20-21).
On the other hand, managerial ownership does not exclusively have negative
implications. Stulz (1988) found that a higher degree of managerial ownership in terms
of voting rights reduces the probability of hostile takeovers being successful. The reason
for managers to do so, according to Stulz, is due to the fact that managers are more
susceptible to be negatively affected by a takeover than shareholders. Due to the fact that
managers are likely to know more about the firm’s future prospects, they are also likely
to know if the firm is undervalued and thus attempt to block any takeover. As a result,
Stulz concluded that the larger the share of managerial ownership in terms of voting rights
within his sample, the higher the premium required for the takeover and the lower the
probability of a successful takeover (Stulz, 1988, p. 24, 50-51).
In order to create an efficient large corporation, Fama (1980, p. 289) explained the
possibility to split security ownership and control into two different divisions since it
reduces the management inventive problems. This theory assume that a company
excludes specified owners and entrepreneurs. The management is separated into two
different divisions, entrepreneurs and risk bearing, which defines the firm with a set of

28
contracts. When there is a high level of competition in the market, the possibility for the
firm to be efficient decreases when it comes to monitoring the performance of the whole
economic organization. Thus, managers of the firm often needs to be able to exploit the
discipline and opportunities available on the market, both externally and internally.
Another theory developed by Morck, Schleifer and Vishny (1988 p. 296) analyzed the
relationship between managerial ownership structure and the market value of firms
measured by the Tobin´s Q, where Q is reflecting a firm’s performance based on the ratio
between the firm’s market value to the renewal cost of the firm’s tangible assets. In this
case, the measurement of Q reflects the real market value of the firm. Morch, Schleifer
and Vishny (1988 p. 293) found that there is a diverse relationship between market value
of the firm and the managerial ownership structure. The theory is based on the fact that if
Q fluctuates and then slightly rises, the amount of board of directors’ owners increase in
a firm. On the other hand, when Q is low, the firm is mainly run by a member of the
founding family. Since Q is calculated with a number between 0 and 100 percent,
approximately all the firms with 25% and higher Q is based on board ownership and all
the Q below is based on family ownership. If for example Q is increasing there is a higher
convergence of interest between managers and shareholders compared to a decreasing Q
that leads to entrenchments of the different management teams in a firm.
Since there is a relationship between managerial ownership and Q, when a firm has a
large amount of intangible assets which causes Q to rise, there is a potential increase in
managerial ownership in order to ensure that the assets are properly managed.
Additionally, the theory also consider the possibility where both higher board ownership
and founding family ownership can affect Q to decline since the positive correlation
between ownership, managerial and firm attributes that facilitate entrenchment (Morch
et.al 1988, p. 311-312).
An additional aspect of the theory is developed by McConnell and Servaes (1990)
investigating the relationship between equity ownership and Tobin’s Q. The authors
found that there is a curvilinear relationship between Q and the fraction of common stock
owned by the companies’ insiders. When for example the curve slopes upwards, the larger
the amount of insider ownership and more outside ownership when the curve is sloping
downwards. There is also a positive correlation between Q and the fraction of shares
owned by institutional investors. As a consequence, the market value of the firm is a
function of the ownership structure related to the distribution of equity (McConnell et. al
1988, p. 595). Moreover, the additional evidence of the theory is that there is no
correlation between Q and certain block stockholders or fraction of equity ownership by
blockholders. As a result, the value of utilizing blockholders as individual entities can be
questioned for corporate managers even if the block holders are not classified in the
theory. (McConnell et. al 1988, p. 610-611).
Another study aiming at describing the relationship between executive compensation
ownership structure and firm performance found that certain form of the firm motivates
managers to increase firm value instead of the level of compensation. When the
percentage of equity held by managers and the percentage of the equity-based
compensation is positively correlated, evidence shows that there is an increased firm
performance. As a result, equity-based compensation is widely used for firms with outside
directors and firms with a large amount of shares held by insiders or outside blockholders
are firms with equity held by managers (Mehran, 1995, p. 163-164). However, the
29
evidence shows that there are no relationship between firm performance and outside
directors’ equity holdings which is contradictory to previous theories. Nevertheless, the
level of compensation affects certain incentives in a firm when considering the corporate
efficiency. (Mehran, 1995, p. 180). One possible explanation of this is that compensation
structure is measured as a collection of many industry groups of outside insiders (Mehran,
1995, p. 179).
As mentioned, there is a clear link between ownership structure and economic
performance and the options of different types of ownership in a company. Thomsen and
Pedersen (1997, p. 20) found a relationship between the effect on ownership structure
with regards to asset returns and a company’s market-to-book value. The evidence
showed that when the ownership structure is mainly from institutional investors, there is
a beneficial effect of ownership structure on market-to-book value while sales growth is
higher for companies with family ownership or other types of ownership. Therefore,
different types of ownership structure prioritize profit versus growth. Also, institutional
ownership often generate higher market-to-book values in comparison to other types of
ownership where the effect on ownership share on market-to-book value gives a negative
premium. When it comes to the effects of ownership on asset returns, the government
ownership is negatively affecting the company’s asset returns. In order to maximize
shareholder value, the ownership structure should include a large amount of institutional
investors and markets with liquid shares (Thomson & Pedersen, 1997, p. 21).
Schliefer and Vishny (1986 and 1997 p. 754) created a model that suggests that companies
with many small owners should use outside competencies in order to monitor the
performance of the management. When corporations are owned by larger owners or
block owners, the monitoring and controlling of the management is more efficient
because they are more capable and skilled which contributes to an increased corporate
performance.
In order to define the distribution of equity it is important to consider the development of
different ownership structure in the past and present. One theory that is developed by
Holderness, Kroszner and Sheehan (1999) consider the evolvement of ownership
structures from particularly the great depression since the availability of data from
publicly firms is mainly from these years and forward. Holderness, Kroszner and Sheehan
(1999, p. 435) explain the inevitable development of managerial ownership with a lower
volatility and increased opportunity to hedge linked to the development of the financial
markets since the early 1900s.
Since the great depression there is an increase in ownership across all ownership industry
categories and the cost and benefit from managerial ownership have changed because the
increased opportunity to mitigate agency problems with other mechanisms rather than
only focus on solving them with managerial ownership (Holderness et. al 1999, p. 437).
There are several steps in order to explain the growth of managerial ownership in publicly
firms. First, the insider ownership decreases with firm age and leverage both in the past
and present but with the difference that the relationship is stronger nowadays. Second,
the lower overall volatility in the financial market has reduced the cost of hedging which
increased the managers’ willingness to put a larger fraction of their financial wealth into
the equity ownership in the firm. Finally, the reduced transaction costs has caused a
change in the internal organization of the firm (Holderness et. al 1999, p. 466).

30
3.2.1. Ownership structure’s effect on dividends
More modern research have assessed the effect that ownership structure has on dividend
payments, similar to this study but in different geographical settings. The main findings
of these studies are presented here. It becomes clear that there is no distinct consensus
among these studies.
Thanatawee (2014) studied ownership structure’s impact on dividends among companies
in China. The study’s findings indicate that ownership by the largest shareholder,
ownership concentration and government ownership increase the probability of dividend
payments while institutional ownership decreases the probability of dividend payments.
Ownership by the largest shareholder, ownership concentration and government
ownership increase the magnitude of dividends while ownership by institutional
ownership and foreign investors decrease the magnitude of dividends (Thanatawee,
2014, p. 197).
Thanatawee (2012) also made a similar study but in the setting of Thailand. The findings
suggest that higher ownership concentration and when the largest shareholder is an
institution increases the probability of dividend payments. The findings also suggest a
positive relationship between the size of the share held by institutional investors and the
magnitude of dividends. Both the likelihood and the magnitude of dividends paid increase
(decrease) with higher institutional (individual) ownership (Thanatawee, 2012, p. 121).
As for the case of Iran, Eskandar et al’s (2011) findings indicate that institutional
ownership, in general, has a negative associated with distributed dividends. However, as
institutional ownership gets concentrated, the relationship gets inverted to a positive one.
They found no statistically significant evidence to suggest that managerial ownership had
any association with distributed dividends (Eskandar et al, 2011, p. 7516).
Mancinelli & Ozkan (2006) studied ownership structure’s impact on dividend policy
among Italian firms. Ownership structure is highly concentrated in Italy, so the authors
measure the degree of concentration in terms of voting rights among large shareholders.
The findings suggest a negative relationship between the magnitude of dividend payments
and the quantity of voting rights of the largest shareholder. They also test whether the rent
extraction hypothesis, a situation where shareholders with large influence may try to
create circumstances where they can expropriate minor shareholders, can be explained by
certain ownership variables. In this aspect, they find that agreements among large
shareholders may act to prevent the monitoring power of large, non-controlling
shareholders (Mancinelli & Ozkan, 2006, p. 265).
Another study conducted in a Jordanian setting by Warrad et al (2012) over the period
2005-2007 found that foreign ownership had a significant positive relationship with
dividends payout policy through Tobin’s Q. The results also suggest a significant
relationship between dividend policy and foreign ownership, firm size and debt ratio
measure by return on assets (Warrad et al, 2012, p. 187).
Ullah et al (2012) studied the same topic in Pakistan for the period 2003-2010. Their
results showed a negative relationship between managerial ownership and dividend
payouts as well as positive relationships between institutional and foreign ownership and
dividend payouts.

31
Kumar’s (2003) conducted a similar study on Indian firms over the period 1994-2000 but
with a slightly different approach, where they simply tested for any relationship between
ownership structure, corporate governance and dividend policy. Among the results of the
author’s study can most importantly be noted that the findings establish a relationship
between ownership structure and dividend policy (Kumar, 2003, p. 1).
Table 1. Summary of previous studies
Author(s) Year Geographical
setting
Tested relationship(s) Results
Al-Najjar &
Kilincarslan
2016 Turkey Ownership structure's
effect on probability of
paying dividends and
amount of dividends
paid
Foreign, state, family
involvement, domestic
financial
institutions and minority
shareholders significantly
negatively affect dividend
payout ratio. Foreign and state
ownership show significant
negative relationship with
propensity to pay dividends.
Thanatawee 2014 China Ownership structure's
effect on probability of
paying dividends and
amount of dividends
paid
Ownership by the largest
shareholder, ownership
concentration and government
ownership positively, and
institutional ownership
negatively, affect firms'
probability of paying
dividends. Ownership by the
largest shareholder, ownership
concentration and government
ownership positively, and
institutions and foreign
investors negatively, affect the
magnitude of dividends paid.
Thanatawee 2012 Thailand Ownership structure's
effect on probability of
paying dividends and
amount of dividends
paid
Ownership concentration,
institutional ownership and
largest shareholdings held by
institutions positively affect
firms' probability of paying
dividends. Ownership
concentration of largest
shareholder and institutional
ownership positively affects
magnitude of dividends paid.
Individual ownership exhibits
negative relationships with
both propensity of paying, as
well as magnitude of,
dividends.
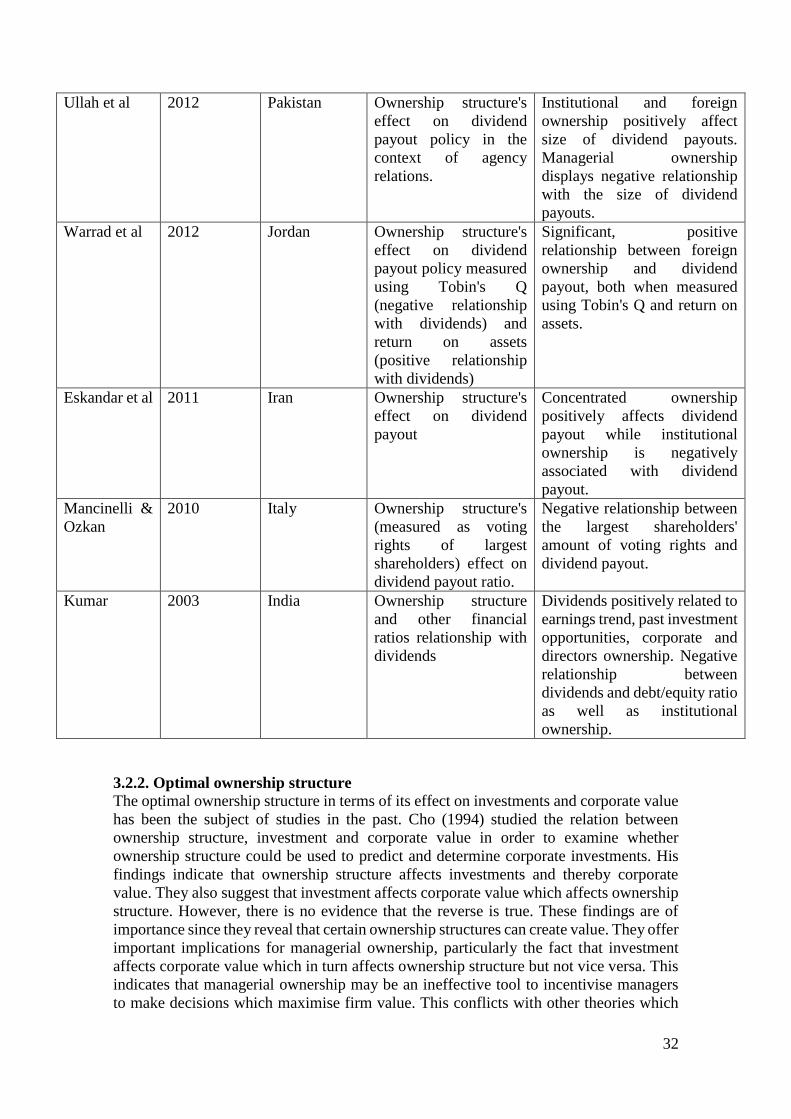
32
Ullah et al 2012 Pakistan Ownership structure's
effect on dividend
payout policy in the
context of agency
relations.
Institutional and foreign
ownership positively affect
size of dividend payouts.
Managerial ownership
displays negative relationship
with the size of dividend
payouts.
Warrad et al 2012 Jordan Ownership structure's
effect on dividend
payout policy measured
using Tobin's Q
(negative relationship
with dividends) and
return on assets
(positive relationship
with dividends)
Significant, positive
relationship between foreign
ownership and dividend
payout, both when measured
using Tobin's Q and return on
assets.
Eskandar et al 2011 Iran Ownership structure's
effect on dividend
payout
Concentrated ownership
positively affects dividend
payout while institutional
ownership is negatively
associated with dividend
payout.
Mancinelli &
Ozkan
2010 Italy Ownership structure's
(measured as voting
rights of largest
shareholders) effect on
dividend payout ratio.
Negative relationship between
the largest shareholders'
amount of voting rights and
dividend payout.
Kumar 2003 India Ownership structure
and other financial
ratios relationship with
dividends
Dividends positively related to
earnings trend, past investment
opportunities, corporate and
directors ownership. Negative
relationship between
dividends and debt/equity ratio
as well as institutional
ownership.
3.2.2. Optimal ownership structure
The optimal ownership structure in terms of its effect on investments and corporate value
has been the subject of studies in the past. Cho (1994) studied the relation between
ownership structure, investment and corporate value in order to examine whether
ownership structure could be used to predict and determine corporate investments. His
findings indicate that ownership structure affects investments and thereby corporate
value. They also suggest that investment affects corporate value which affects ownership
structure. However, there is no evidence that the reverse is true. These findings are of
importance since they reveal that certain ownership structures can create value. They offer
important implications for managerial ownership, particularly the fact that investment
affects corporate value which in turn affects ownership structure but not vice versa. This
indicates that managerial ownership may be an ineffective tool to incentivise managers
to make decisions which maximise firm value. This conflicts with other theories which

33
assumes that stock options and grants to managers increase their propensity to make value
maximising decisions (Cho, 1994, p. 103-104, 120).
In addition to Cho (1994), as previously mentioned, Morck, Schleifer and Vishny (1988)
and McConnell & Servaes (1990) found that firm performance is related to ownership
structure. However, Demsetz & Villalonga’s (2001) study provide conflicting results.
According to the evidence from their study, it is suggested that no particular ownership
structure which may produce higher returns, thus increasing performance, exists.
Meanwhile, Fishman et al (2005) found a negative relationship between managerial
ownership and firm performance. The reason for this, according to the authors, could
possibly be because of the moral hazard which may arise with managerial ownership
(Fishman et al, 2005, p. 35-36). The results of the paper is in line with the management
entrenchment hypothesis – a situation where managers make investments and decisions
which entrench them in their current positions by making it costly or difficult to replace
them. By entrenching themselves, they create a position where they can extract excessive
remuneration or other benefits due to the high cost to the firm of replacing them (Shleifer
& Vishny, 1988, p. 123). A higher degree of management ownership results in less power
of other shareholders to replace managers and owner-managers can influence shareholder
decisions using their voting power. This moral hazard may negatively affect firms’
profitability due to the detrimental effect management’s decisions have on firm
performance when shareholder value-maximisation is not pursued. In accordance with
Cho (1994), Fishman et al (2005, p. 35) suggest that stock and option plans may have
negative effects on firm performance. Furthermore, their results also suggest that
profitability, measured using Tobin’s Q, has a significantly negative relationship on
management’s interests. This may in fact be a result of managers choosing to sell their
stock stake in times of high performance in order to diversify their wealth and/or realise
their gains. Finally, the results indicate that performance cannot significantly be used as
a predictor of ownership structure (Fishman et al, 2005, p. 35).
While ownership structure’s impact on firm performance is not the focus of this paper, it
remains an interesting topic which lacks an academic consensus. It also displays the
significance of ownership structure on aspects of firms’ decisions and performance.
When considering theories related to the optimal ownership structure, there are some
theories that emphasis the relevance of optimal ownership structures and sharing rules.
This is because of the importance of certain incentives of managers and owners as well
as the possibility to have a diversified portfolio in order to balance against agency costs
linked to the powerless incentives of certain firms (Huddart, 1991, p. 1). Huddart (1991,
p. 1, 153-159) created a model in order to explain the optimal ownership structure and
sharing rules. When for example a corporation is focusing on embracing risk aversion
with normally distributed signals and outcomes, the ownership structure appears
endogenously. As large outside shareholders are incentivized to monitor the managers of
the firm and managers often have high work ethic, the firm increases its productivity and
output. If ownership structure changes affects the incentives of managers, the firm value
will increase or decrease depending on what type of ownership structure that is altered.
The main purpose of large shareholders when trading anonymously is to liquidate an
investment instead of using a diversified portfolio, especially when there is a lack of
benefits that could increase the influence in the ownership structure. However, if the

34
trading is public, the large shareholders have the incentives that ownership structure
should maximize the potential welfare of the shareholders.
This model differentiates from other types of studies where ownership structure, share
price and firm value is dependent on takeover artists and the assumptions that the
operations of the firm is improved by different types of technology. Instead, managerial
performance is not depending on the identity of the manager and the managerial
technology. As discussed, incentives arises when large shareholders need oversight on
managers while small shareholders focus on dealing tasks in order to monitor and adjust
managerial compensation for large shareholders. As a consequence, a large blockholder
is beneficial for all shareholders since the oversight of managers is costly for the large
shareholders. As a result, a large fraction of stock can be traded at a lower price per share
in comparison to a single share when there are no benefits for private control (Huddart,
1991, p.154).
Another view of the optimal ownership structure is that some sort of dispersion should be
included in the ownership structure in order to reduce the possibility for other
shareholders than the company’s shareholders to monitor the company. In order to be able
to reach the optimal dispersion of share ownership, the company should go public and
accept costs related to the listing and the cost of submitting the shareholder register to
another party. If for example the controlling shareholders decides to sell the share
privately, the shareholders flinches from the cost of going public but with the possibility
that the large external shareholders might monitor the whole process. Hence, there is a
cost of assuming a liquid market and excessively monitoring. However, the choice of
going public is powerful because of the higher external funding required and that listed
companies have to be transparent and disclose information. Also, the legal environment
is limited because of the bribes that companies can be involved in these type of situations
(Pagano et. al, 1998, p. 187-192).
As discussed above, the optimal ownership structure is depending on if the initial owner
can consider to abandon the possibility to act opportunistically when a stake is sold to an
external investor in order to retrieve investment funds. In order to do so, the initial owner
has to forecast the relevant agency costs and structuralize the stake sizes of the
shareholders to be able to influence the shareholders to pay the adequate cost of
monitoring. The main purpose is to choose an ownership structure that is not maximizing
firm value net of monitoring costs because the possibility to acquire future private
benefits. The initial owner should instead focus on the shares to be dispersed to reach
efficient monitoring. As a result, if the company is unlisted and some of the stakes are
sold to an external shareholder, the controlling shareholder cannot acquire a large amount
of dispersed ownership shares which abandon the opportunity to be flexible when
monitoring the company. Instead, in order to reach the optimal monitoring, the company
should go public since the controlling shareholder can refine the stakes of external
shareholders. But, as mentioned above, the initial owner has to consider costs related to
the trade-off between the costs of entering the public market and excessive monitoring
(Pagano et. al, 1998, p. 215-216).
3.2.3. Determinants of ownership structure
There are certain factors that determine the ownership structure of the firm where some
are more important than others, the impact of these factors also determine the ownership

35
structure, especially when for example a company increases in debt, stakes or when an
investment project is undertaken.
There are three important factors that determine the ownership structure discussed by
Demsetz & Lehn (1985, p. 1156-1162), namely value-maximizing size, control potential
and systematic regulation. Value-maximizing size consider the increase in firms’ size
which increases a firms capital resources leading to higher market value of a given
fraction of ownership. If the price of the fraction increases, there is a reduction in the
ownership concentration. If for example, given a certain degree of control, the firm will
require a smaller share which increases the size and the firm becomes larger. As a result,
this creates ambiguity of ownership resulting in larger firms. This is called the risk-neutral
effect of size on ownership and is positively correlated with risk aversion (Demsetz &
Lehn 1985, p. 1158).
Control pontential consider the possibility to more efficient when monitoring the
performance of the firm in order to create value to the firm (Demsetz & Lehn 1985, p.
1158-1159). Lastly, systematic regulation decreases the different types of options for
owners in order to monitor the firm efficiently which contradicts the control potential
statement. As a consequence, regulations reduces the ownership concentration more than
unstable profits (Demsetz & Lehn 1985, p. 1161).
Another theory in the same context, “law matters” theory suggests that one important
impact on ownership structure is the factor of the level of private benefits of control which
stands out in comparison of other theories related to determination of ownership structure.
For example, when a firm have relatively high private benefits, the firm is probably going
to have a blockholder that controls a stake (Lamba & Stapledon, 2011, p. 25).
Pindado and Torre (2008, p. 868, 881) reflected upon the financial decisions as
determinants of ownership structure. In order to determine the ownership structure, when
a firm increases its debt, the outside owners and managers sell their shares or reduce their
influence in the firm in order to limit the level of risk. This can also be seen if the firm is
controlled by families but with the difference that family owners are more interested in
maintaining the control of the firm instead of being risk averse. In addition, all those types
of ownership often increases the stakes in the firm, especially with higher dividends
because of the dividend payout and the reduction of negative NPV(net present value)
projects, even if the firm is family controlled or not. Finally, if the firm is involved in
investing in certain projects, the outside owners’ increases their holdings in the firm in
comparison to other types of ownership, especially family controlled firms since the
possibility to expropriate rents.
In order to connect the theories to specifically Sweden, Bergström & Rydqvist (1990)
researched the concentration of equity ownership in Sweden, especially concerning
voting rights, since these affect votes and equity of the shareholders when it comes to the
concentration of ownership. This is consistent with the model by Demseth & Lehn (1985,
1155), as the firm size increases when the concentration of ownership decreases, the level
of risk in a firm increases the concentration of ownership in Sweden.
Furthermore, the concentration of ownership is only affected when there are dual classes
of shares, especially the concentration of votes as the concentration of equity is unaffected
by the differentiated voting rights (Bergström & Rydqvist, 1990, p. 237). DeAngelo &
DeAngelo (1985, 33-34) and Partch (1987, p.4) findings is consistent with this statement,
that large blockholders is included when there are dual classes of shares in the firm and

36
that differentiated voting rights is controlled. This implies that the controlling
shareholders prefers a large fraction of equity and that there is a relationship between
ownership of equity and the voting value. The purpose of controlling the firm is motivated
by the ownership of equity and other economic motives instead of the need for power
(Bergström & Rydqvist, 1990, p. 252).
Finally, La Porta et. al (1999, p. 471) studied the ownership structure of some of the
world’s biggest economies in order to find the most appropriate controlling shareholder
of the companies included in his sample. Those countries with high shareholder
protection have a large amount of shareholders and trading shares through IPO(initial
public offering) in the primary market as well as in the OTC market or at least one stock
exchange. These types of companies is often controlled by families or the state instead of
financial institutions. The controlling shareholder is often involved in pyramids and
managerial decisions since the ability to control their surplus of cash flow rights.
37
4. Empirical Study In this section, the data collection process will first be presented, followed by the
definition and description of the variables used and hypotheses tested. The statistical tests
employed will follow and the chapter will end with a review of data processing and
transformations.
4.1. Data collection This research involves data related to the ownership structure and the dividend policy for
all Swedish firms publicly listed on the OMX Stockholm Exchange’s Large, Mid and
Small cap over a six year period, year 2010-2015. This involves a sample of 326 shares
of listed companies. 42 shares are excluded, bringing the total number of companies to
284. The decision to exclude those was made because some firms have several share types
listed on the exchange (such as one class A share, one class B share and one preference
share) which may have affected the reliability of the results, since the same firm would
otherwise have been represented multiple times in the sample. In this case, only the
ordinary share (class B) was included in the sample since the ordinary shares are the most
interesting to investigate due to their higher liquidity, typically being the underlying asset
upon which derivatives are based. The reason for choosing the sample from the main
market and excluding smaller markets, such as First North and Aktietorget, is due to the
smaller markets’ focus on small and growing companies, including many younger
companies with less data history.
The data for ownership structure is presented in the annual reports of the companies
included in the sample. Also, the dividend yield and dividend payout ratio can be
calculated from the financial statements, which is publicly available in Sweden. In order
to collect the data, both Thomson Reuters Eikon and Datastream databases have been
used in order to consolidate and simplify the data collection process. Both dividend-
paying as well as non-dividend paying companies are included in the sample in order to
reduce the possibility of bias in sample selection. In order to see if there are any changes
on the effect of ownership structure on dividend policy, the data from the time period
2010-2015 is collected in order to receive a larger sample.
4.2. Variables
4.2.1. Dependent variables
The aim of this thesis is to investigate whether a link exists between ownership structure
and dividend policy. In order to do so, multiple linear regression will be used to
statistically test for any such relationship. In order to quantify dividend policy, two
different dependent variables are used: dividend yield and dividend payout ratio.
Dividend yield is defined as dividends paid divided by the price per share:
dividends paid
price per share
Since the dividend yield is based on the share price, the authors deem it to be a relevant
variable to include since it may be of more interest to investors rather than managers. By
looking into whether certain ownership structures affect the dividend yield, it could
possible generate a method for investors when developing investment strategies based on
key performance indicators (such as dividend yield) when dividend yield is not available.
38
Dividend payout ratio is defined as the relative amount dividends paid divided by the
amount of cash available to be distributed (earnings), i.e.:
The dividend payout ratio measures the ratio of dividends paid in relation to an internal
performance indicator, thus allowing it to be used for fundamental analysis purposes and
may be used by both managers within the company as well as outside analysts.
These two variables are among the most common ways of measuring dividends. Other
researchers such as Al-Najjar & Kilincarslan (2016), Thanatawee (2012, 2014), Warrad
et al (2012) and Eskandar et al (2011) use dividend payout ratio in their studies when
measuring the effect of ownership structure on dividends. The authors of this study have
also decided to include dividend yield as another dependent variable. Although it is
relatively closely related to dividend payout ratio, dividend yield is commonly used by
analysts when analysing firms as well as by management when deciding on dividend
policy. The decision was therefore made to include both variables in an attempt to capture
both the insiders’ as well as outsiders’ perspective.
4.2.2. Independent variables
In order to measure ownership structure, the relative amount of shares held by each of the
following ownership types are used as independent variables: bank and trust, corporation,
foundation, government agency, hedge fund, holding company, individual investor,
insurance company, investment advisor, investment advisor/hedge fund, mutual fund,
other insider investor, pension fund, private equity, research firm, sovereign wealth fund
and venture capital. These are all the variables which are available from our data source,
Thomson Reuters Eikon and the decision to include all ownership variables was taken.
4.2.3. Control variables
In addition to the ownership structure variables, the following control variables are
included in the regression analysis: debt/equity ratio, market capitalization, price to book
value as well as return on assets. The following definitions are made for each of these
variables:
Debt-to-equity ratio: As debt is a useful tool in order to monitor managers in a firm and
lower agency costs (Jensen & Meckling, 1976, p. 1-78) and (Stultz, 1988, 41-44), and
certain debt contracts reduce dividend payout (Mehrani et. al 2011 p. 7519), the
relationship between debt-to-equity ratio and dividend is expected to be negative. Also,
according to Fama and French (2001, 26-27) and Grullon and Michaely (2002, p. 1669)
the firms with low amount of debt have higher tendencies to pay dividends. It is calculated
as:
long term debt + short term debt
common equity
Market capitalization: In order to measure market capitalization, the calculation includes
the natural logarithm of a firms total assets. It is expected that the relationship between
dividend payout and market capitalization is positive for larger firms since the large
annual dividends per share
earnings per share

39
amount of total assets and is verified by Fama and French (2000, p. 26-27) and also
(Grullon and Michaely 2002, 1649). There are also studies that show negative relationship
between dividend payout and market capitalization such as Gugler and Yurtuglu (2003,
p. 731) and Farinha (2003, p. 1204-1205).
Price-to-book ratio: This ratio is often associated with growth opportunities (Fama and
French 2001, p. 9). According to Batacharya’s (1979, p. 259-270), the relationship
between Price-to-book ratio and dividend payout should be negative. It is calculated as:
share price
book value per share
Return on assets: The purpose of ROA is the evaluation of profitability for firms. As ROA
is connected with higher earnings, the higher the firm will pay dividends, and therefore
the relationship between ROA and dividend payout should be positive. (Al-Najjar &
Kilincarslan, 2016, p. 148) and (Thanatawee, 2014, p. 199). It is calculated as:
net income prior to financing costs
total assets
These control variables have been identified in previous studies to influence dividend
policy (Al-Najjar & Kilincarslan, 2016, p. 148) and (Mehrani et. al 2011 p. 7519), some
of them in (Thanatawee, 2012 p. 123) and (Thanatawee, 2014, p. 199), and are therefore
included due to the fact that they may have an impact on dividend policy and in order to
eliminate any biases in the results.
4.3. Hypotheses In order to establish whether any relationship exists between ownership structure, or more
specifically ownership types, and dividend policy the two following general hypotheses
will be tested statistically:
Hypothesis 1:
H0: There is no relationship between the level of ownership held by each investor type
and dividend yield among Swedish listed firms.
Ha: There is a relationship between the level of ownership held by each investor type and
dividend yield among Swedish listed firms.
Hypothesis 2:
H0: There is no relationship between the level of ownership held by each investor type
and dividend payout among Swedish listed firms.
Ha: There is a relationship between the level of ownership held by each investor type and
dividend payout among Swedish listed firms.
These hypotheses will then be tested with each of the following investor types: bank and
trust, corporation, foundation, government agency, hedge fund, holding company,
individual investor, insurance company, investment advisor, investment advisor/hedge
fund, mutual fund, other insider investor, pension fund, private equity, research firm,
sovereign wealth fund and venture capital.

40
In addition to this, four control variables will be included in the tests against each
dependent variable as well, namely debt/equity ratio, market capitalization, price to book
value and return on assets. We will therefore also test the following two general
hypotheses:
Hypothesis 3:
H0: There is no relationship between each control variable and dividend yield among
Swedish listed firms.
Ha: There is a relationship between each control variable and dividend yield among
Swedish listed firms.
Hypothesis 4:
H0: There is no relationship between each control variable and dividend payout among
Swedish listed firms.
Ha: There is a relationship between each control variable and dividend payout among
Swedish listed firms.
4.4. Statistical tests applied
4.4.1. Testing for normal distribution and linearity
In order to determine which statistical tests to be applied to the data, it is crucial to first
understand the state of the data sample one is working with. The first step is to test
whether the data is normally distributed. This is done using the Shapiro-Wilk Test.
Furthermore, a Normal Q-Q plot is used to determine normality and linearity graphically.
The reason for testing for normality and linearity is because these are important steps
necessary in assessing whether the statistical assumptions are fulfilled and thus whether
the results from the statistical tests are reliable.
4.4.2 Shapiro-Wilk Test
The purpose of the Shapiro-Wilk Test is to test if the sample is normally distributed. This
test is included in this study since it is highly sensitive when it comes to identifying non-
normality (Shapiro et. al, 1968, p. 602, 1366). This has also been highlighted by Razali
& Wah (2011, p. 21) who found the Shapiro-Wilk test to be the most powerful test of
normality in comparison to the other major normality tests, the Kolmogorov-Smirnov,
Lilliefors and Anderson-Darling tests.
4.4.3. Testing for multicollinearity and correlations
In order to get an indication for which variables may be correlated to the dependent
variable, the data is tested for correlations. The purpose of the correlation coefficient R is
to evaluate the association between two variables and can assume a value between 1 and
-1. Covariance coefficient R (Covariance (X,Y)) is calculated as:
Covariance (X,Y)
σXσX
Furthermore, one issue one needs to be cautious of when performing statistical tests is
multicollinearity. Should multicollinearity be present in the sample, this needs to be
adjusted before running a regression test. Also, it can be a complicated problem when
there is a high correlation between many independent variables. Multicollinear variables
are closely related and will thus wrongly indicate a higher relationship between the
41
variables tested in the regression and produce biased results (Kleinbaum et al., 2007, p.
93). A regression analysis is therefore performed on the data sample in order to test for
multicollinearity. As a rule of thumb VIF values close to 10 and larger are reasons for
concern of multicollinearity (O’Brien 2007, p. 673). VIFi is calculated as:
1 1-Ri
2
4.4.4. Testing for heteroscedasticity
In order to test whether the variance, i.e. the error term, is constant across the values of
the independent variables, one needs to test the data sample for heteroscedasticity. This
is important when deciding which type of regressions analysis to employ. Regressions
such as ordinary least squares (OLS) regressions which disregard heteroscedasticity - thus
assuming homoscedasticity - and gives equal weight to each observation will create
skewed results due to the fact that some observations will have more extreme variance
and thus create biased results. A Breusch-Pagan test will therefore be used in order to
control for heteroscedasticity. In case the data displays heteroscedasticity, it is more
suitable to use general least squares (GLS) regressions, since it allows the estimate of the
coefficient to be generalized despite the data bearing signs of heteroscedasticity (Gotu,
1998, p. 254). The data sample will be tested for heteroscedasticity using a Breusch-Pagan
Test. This is a simple test in order to see if there is any heteroscedasticity in a linear
regression model and also whether the estimated variance of the residuals are a
relationship between the dependent variables and the independent variables (Breusch &
Pagan, 1979, p. 1287).
4.5. Regression analyses
4.5.1. Regression model
In order to test ownership structure’s effect on dividend policy, we will run the following
regressions tests. They include all control variables defined in section 4.1.3.
Dividend yield = β0 + β1bank and trust + β2corporation + β3foundation + β4government
agency + β5hedge fund + β6holding company + β7individual investor + β8insurance
company + β9investment advisor + β10investment advisor/hedge fund + β11mutual fund
+ β12other insider investor + β13pension fund + β14private equity + β15research firm +
β16sovereign wealth fund + β17venture capital + β18debt/equity ratio + β19market
capitalization + β20price to book value + β21return on assets + ε
Dividend payout = β0 + β1bank and trust + β2corporation + β3foundation +
β4government agency + β5hedge fund + β6holding company + β7individual investor +
β8insurance company + β9investment advisor + β10investment advisor/hedge fund +
β11mutual fund + β12other insider investor + β13pension fund + β14private equity +
β15research firm + β16sovereign wealth fund + β17venture capital + β18debt/equity ratio
+ β19market capitalization + β20price to book value + β21return on assets + ε
4.5.2. Multiple regression analysis
In order to create a model on the effect of ownership structure on dividend policy, two
multiple regression analysis including ownership structure and both dividend payout and
dividend yield have been tested. This is done in order to estimate a model on how the
different ownership structures affect dividend policy.
42
According to Kleinbum et. al (2007, p. 36-38), the purpose of multiple regression analysis
is the opportunity to mathematically test different variables, especially the relationship
between one independent variable against one dependent variable but can also consider
more variables. When running the multiple regression analysis, one can plot the
observations in order to estimate a regression line based on the least square method which
is a standard approach in regression analysis. The purpose of the least square method is
to minimize the range between the regression line and the observations.
4.5.3. T-test
In order to test whether the independent variables have any relation to the dependent
variable, thus being able to explain a change in the dependent variable. This is done using
hypothesis testing by running a two-sided t-test which tests whether the coefficient (β) is
zero (null) and thus fails to explain any change in the dependent variable. If this turns out
to be the case, the variable can and should be excluded from the model. In order to reject
the null hypothesis, i.e. to assume that the coefficient is different from zero, the observed
t-value should not exceed the critical t-value set by the confidence interval (e.g. 0.05 for
a 95% confidence interval) and degrees of freedom given by k - n where n = number of
observations and k = number of estimated coefficients (Kleinbaum et al., 2007, p. 144).
4.5.4. Type 1 error and Type 2 error
A statistical test is correct when the null hypothesis is not rejected but also when the
alternative hypothesis is not rejected and the null hypothesis is rejected. There are two
types of errors in statistical tests, namely Type 1 error and Type 2 error. Type 1 error
refers to the rejection of the null hypothesis when it is actually not rejected. Type 2 errors
are the opposite, when the null hypothesis is not rejected when it is actually rejected.
(Kleinbaum et al., 1988, p. 30-31).
4.5.5. Coefficient of determination
The coefficient of determination, R2, explains the variance between the independent
variables and the dependent variables. The maximal value of R2 is 1 and values closer to
1 implies higher coefficient of determination (Kleinbaum et al., 1988, p. 86).
4.5.6. P-value
After the regression analysis is done, the p-value is calculated in order to see if there is
any unusual results if the null hypothesis is not rejected (Kleinbaum et al., 2007, p. 28).
The purpose of the p-value calculation is whether the null hypotheses can be rejected or
not. Since the confidence interval is 95% for this study, the p-values below 0,05
(significance 5%) will be accepted.
4.6. Transformations
4.6.1. Natural logarithm
A natural logarithm transformation of the data can enhance the suitability of the data for
statistical testing when the data has is skewed and/or does not fulfil normality or linearity
assumptions. Therefore, a natural logarithm transformation is utilized on the data sample
in order to create a less skewed distribution. This is an important step in order to be able
to see patterns in the data as well as for meeting the assumptions of the model in order to
produce reliable results for interpretations.

43
4.6.2. Zero dividends
Alarge proportion of observations exhibited zero dividend yields and dividend payout
ratios in the data sample which posed a risk of producing skewed or otherwise unreliable
results. This is decided to be done through transformations, as discussed above, but also
by deleting observations with zero dividend yield and payout ratios. From the initial
amount of 1704 observations, a total of 658 observations were deleted by using these
techniques bringing the total amount of observations in the sample to be used for analysis
in the regression model to 1046.
4.6.3. Outliers
Considering the outliers in a regression analysis is valuable in order to reduce the
possibility of compromising the quality of the results from the statistical tests. However,
one has to evaluate each outlier since it is crucial to pick the most appropriate ones to
delete, especially since some observations are interesting for the regression analysis and
dropping observations without further considerations can reduce the generalizability and
validity of the results. Kleinbaum (2007, p. 296-297) defines the outliers as those
observations with the most extreme values but can also be developed by inaccurate data
input. For example, in this study there are some high number of debt/equity which could
cause the linear regression line to be misleading. In order to evaluate the outliers there are
several options to choose from such as Jackknife, Cook’s distance, transformations and
elaborate with different regression models. This study has used both transformations and
the elaboration of the original regression model. However, the authors of this paper have
not elaborated fully on the matter of outliers as this requires statistical knowledge
exceeding that which can be expected at the level of this course.
4.6.4. Implications of transformations
There are some implications when using transformations. First of all, the interpretation
of the statistics and the evaluation whether to use transformations or not requires
understanding about the variables that is examined. If this is not the case, there might be
some additional analysis in order to decrease the possibility for skewed distribution
(Moore et. al, 2011, p. 87). Second of all, utilizing transformations can be time-consuming
and the statistician must be certain that the statistical models are improved with the
transformation and whether the transformation is specifically linked to the statistical tests
or robust. Finally, the central limit theorem states that if the sample is large, there are no
reason to believe that the data should not be normally distributed. Another implication of
transformation is that the hypothesis of the study is altered which can cause
misinterpretation of the data. When analyzing the statistical results, a transformed
statistical model can increase the possibility for insecure analysis more than an un-
transformed statistical model (Field, 2013, p. 184-185).

44
5. Empirical results This chapter will present the results and findings as well as the statistical test in order to
test the hypotheses. As a start, the descriptive statistics will be presented in order to get
an overview of the different variables included in the study. Moreover, in order to see if
there are any existing relationships between variables, there will be a correlation table.
The statistical tests includes Shapiro Wilk test in order to test for normality as well as
transformations such as using the natural logarithm of the variables. Also, the Breusch-
Pagan test is used to test for heteroscedasticity. Lastly, two regressions will end up the
chapter describing the relationship between the dependent and the independent variables.
5.1. Descriptive statistics To begin with, a summary of the descriptive statistics will be presented where the
ownership structures scores will be evaluated and analysed in relation to market
capitalization, debt-to-equity ratio, price-to-book value and return on assets.
The 1046 observations are summarized in the tables below as descriptive statistics of the
sampling frame over the period 2010-2015:

45
Table 2 Descriptive statistics before data transformation
N Minimum Maximum Mean Std. Deviation
Other Insider
Investor
1045 .0000 85.3675 3.398978 9.5512381
Investment
Advisor
1046 .0000 57.2500 12.128254 11.2011009
Pension Fund 1045 .0000 22.1092 3.074396 3.6477494
Investment
Advisor/Hedge
Fund
1045 .0000 36.5817 8.965836 7.9705316
Sovereign
Wealth Fund
1045 .0000 6.4575 .786266 1.2025053
Bank and
Trust
1044 .0000 13.3350 .466771 1.3829233
Individual
Investor
1044 .0000 93.5283 9.390502 16.5194368
Corporation 1044 .0000 98.8200 8.640985 14.6152759
Insurance
Company
1044 .0000 98.8200 2.051409 6.8396090
Hedge Fund 1044 .0000 54.8758 1.062732 5.3640738
Research Firm 1044 .0000 4.3260 .037442 .3297170
Independent
Research Firm
1044 0 0 .00 .000
Private Equity 1044 .0000 62.9136 .771156 4.5735053
Mutual Fund 1044 .0000 .8300 .003923 .0410089
Foundation 1044 .0000 45.1200 .574203 3.2521705
Government
Agency
1044 .0000 49.8290 .263711 2.8510264
Holding
Company
1044 .0000 51.0100 .409871 3.4502279
Venture
Capital
1044 .0000 49.0008 .613552 3.6536706
Hedge Fund
Portfolio
1044 .0000 48.0700 .172634 2.2280769
Debt/equity
ratio
948 -2611.1000 17186.9100 109.209831 621.0763899
Dividend
payout
739 2.0900 99.6000 50.446428 22.8249703
Dividend yield 842 .0900 17.5900 3.387613 1.8274925
Market
capitalization
872 0 535415792 26446864.56 6.160E+07
Price to book
value
902 -73.1800 193.2800 2.840255 10.0850160
Return on
assets
905 -44.5300 82.0700 7.943646 8.2810739
Valid N
(listwise)
568

46
As can be seen in the table, the mean of dividend payout ratio is 50.446428, which implies
that Swedish firms on average distributed about 50 percent of their earnings as dividends
during the time period 2010-2015. In addition, the average dividend yield of the firms in
the sample was 3.39 percent during the period. Regarding the different types of ownership
structures for firms in Sweden, one can see that the most concentrated owners are the
Investment Advisor (12.3 percent), Individual Investor (9.39 percent), Investment
Advisor/Hedge Fund (8.97 percent) and Corporation (8,64 percent). Other shareholders
are relatively small even if some of them are around 3 percent. The state and government
ownership is low, characterizing Sweden’s relatively low state ownership. Furthermore,
the debt-to-equity ratio and the return on assets (ROA) for the firms show, on average,
that firms hold 1.09 percent debt for each percent of equity, suggesting a preference for
leverage in their capital structure and firms generated approximately 7.9 percent return
on their assets during the period 2010-2015. According to Fama and French (2001, p. 9),
high price-to-book values indicate growth opportunities. Since the firms in the sample are
valued on average 2.84 times higher than their book values, this is a strong indicator that
the firms in the sample have growth opportunities to pursue. However, this can also
indicate increasing competitive advantages or less risk but also that the firm is overvalued.
In table 2, descriptive statistics are shown for all the variables post-transformation by the
natural logarithm. The purpose of this table is for the regressions analysis in order for the
data to be less skewed distribution and show more linear relationships between the
dependent and the independent variables.

47
Table 3. Descriptive statistics after data transformation
N Minimum Maximum Mean Std. Deviation
Pension Fund 1046 -5.7038 3.0960 .717566 1.1021236
Investment
Advisor/Hedge
Fund
1046 -6.3969 3.5995 1.601647 1.3464608
Sovereign
Wealth Fund
1046 -7.0901 1.8652 -.115177 1.2859308
Bank and Trust 1046 -6.3969 2.5904 -.563903 1.3152535
Individual
Investor
1046 -7.0901 4.5383 1.012203 1.6758235
Corporation 1046 -4.3820 4.5933 1.132190 1.4714094
Insurance
Company
1046 -5.4806 4.5933 .042955 1.3744622
Hedge Fund 1046 -7.0901 4.0051 -.240987 1.3788173
Government
Agency
1046 -4.0174 3.9086 -.024578 .4804135
Holding
Company
1046 -3.9546 3.9320 .014111 .5089118
Mutual Fund 1046 -3.9120 .0000 -.068140 .4421632
Private Equity 1046 -4.5251 4.1418 .058116 .6735852
Research Firm 1046 -6.9078 1.4646 -.049897 .5008279
Venture Capital 1046 -2.9805 3.8918 .094241 .5281015
Other Insider
Investor
1046 -7.0901 4.4470 .437814 1.1377762
Investment
Advisor
1046 -4.7875 4.0474 1.845208 1.4046513
Debt/equity
ratio
1046 -3.9120 9.7519 3.048846 2.0533416
Dividend payout 1046 .0000 4.6012 2.666078 1.7986703
Dividend yield 1046 -2.4079 2.8673 .864658 .6660247
Market
capitalization
1046 .0000 20.0986 12.686360 6.1077518
Price to book
value
1046 -1.2040 5.2641 .594565 .7649531
Return on assets 1046 -1.1394 4.4076 1.563901 1.0183298
Valid N (listwise) 1046

48
5.2. Testing for correlations & multicollinearity In order to control for correlations between the variables used in the analysis, multiple
relationships between the independent variables are discovered in the dataset. However,
as can be seen in Table 3, all variance inflation factors (VIF) values in the model are in
the range between 1.03 (research firm) ≤ 1.79 (investment advisor/hedge fund).
According to O’Brien (2007, p. 673), as a rule of thumb VIF values close to 10 and larger
are reasons for concern of multicollinearity. However, since none of the values in the data
sample used in this study are near that range, the authors do not deem multicollinearity to
be an issue. Furthermore, according to O’Brien (2007, p. 674), a tolerance level
somewhere between 0.25 and 0.10 or lower is typically a cause for concern. As shown in
table 3 below, neither of the values are near that level, considering the lowest value is
0.56 (investment advisor/hedge fund). Figure 2 shows the correlations between all
variables. A more detailed Pearson correlation table including Pearson correlations as
well as significance values can be found in appendix 1.
Figure 2. Correlations

49
Table 4. Collinearity statistics
Tolerance VIF
(Constant)
Pension Fund 0.65 1.53
Investment Advisor/Hedge Fund 0.56 1.79
Sovereign Wealth Fund 0.77 1.30
Bank and Trust 0.83 1.21
Individual Investor 0.79 1.27
Corporation 0.87 1.15
Insurance Company 0.90 1.11
Hedge Fund 0.86 1.16
Government Agency 0.92 1.09
Holding Company 0.88 1.13
Mutual Fund 0.94 1.06
Private Equity 0.94 1.06
Research Firm 0.97 1.03
Venture Capital 0.96 1.05
Other Insider Investor 0.89 1.12
Investment Advisor 0.59 1.71
Debt/equity ratio 0.87 1.15
Market capitalization 0.62 1.62
Price to book value 0.97 1.04
Return on assets 0.85 1.18
5.3 Testing for normality and linearity The residuals are tested for normality using Shapiro-Wilk’s tests for normality. When
running the Shapiro-Wilk test, the residuals are tested using the null hypothesis that the
data is normally distributed with a p-value of below 0.05 rejects the null hypothesis that
the data is normally distributed. However, one limitation with this test is that it may be
statistically significant despite the data being normally distributed due to the test being
affected by large samples. In cases of large samples, small deviations from normality may
yield significant results (Field, 2013 p. 692). As can be seen in table 4 and table 5, the p-
values of the results from the Shapiro-Wilk tests of normality for both dependent variables
are below 0.05, thus resulting in the rejection of the null hypothesis that the data is
normally distributed. The W-value in the results give an indication of how far off the data
may in fact be. A higher W-value indicates a higher level of normality (Shapiro & Wilk,
1968, p. 836-837). Furthermore, the central limit theorem states that a sample may be
assumed to be normally distributed given a sufficiently large sample (Moore et al, p. 271,
276). This might explain the results in the test.Since the W-value for the dividend payout-
model is 0.98, the authors deem this to be the most reliable variable and to suffer the least
from non-normality. In order to further control for normality, one may look at the
distribution visually using Q-Q plots (see figures 3 and 4).
Table 5. Shapiro-Wilk normality test for Dividend payout vs independent variables
Shapiro-Wilk normality test
W = 0.98
p-value = 0.000

50
Table 6. Shapiro-Wilk normality test for Dividend yield vs independent variables
Shapiro-Wilk normality test
W = 0.92
p-value = 0.000
As seen in the graph of the Q-Q plot for dividend yield (figure 3), one can see that
distribution of the residuals is almost perfectly straight meaning that the data is normally
distributed and meets the assumptions of the model. If looking into the other graph for
dividend payout (figure 4), one can see that the residuals are distributed in an almost
straight line in the right tail and in the middle but not in the left tail meaning that the
distribution of the residuals is fat in the left tail. The reason for this can be that the data is
incorrect from the start but is not considered totally non-normally distributed.
Figure 3. Q-Q plot of dividend yield

51
Figure 4. Q-Q plot of dividend payout
5.4. Testing for heteroscedasticity In order to test the data for heteroscedascity, one has to utilize the Breusch-Pagan test.
These tables below show that the relationship between dividend payout and the
independent variables is fulfilling the assumption of homoscedasticity. This assumption
refers to the residuals variance of errors for the collected sample is similar. The purpose
it to have equal statistical variances (Knaub, 2007, p. 831). As this is not the case for
dividend yield, one can conclude that it might be some missing data since dividend payout
should be equal to dividend yield. The null hypothesis in the Breusch-Pagan test assumes
homoscedasticity, so a P-value below 0.05 rejects this hypothesis. Instead, the alternative
hypothesis is accepted and the data is assumed to be heteroscedastic. As can be seen in
table 6 and 7, the p-value for dividend yield is below 0.05, so the null hypothesis of
homoscedasticity is rejected while the p-value for dividend payout of 0.1788, meaning
that the null hypothesis is not rejected. Therefore, the dividend payout variable is assumed
to be homoscedastic.
Table 7. Breusch/Pagan test for heteroscedasticity for Dividend payout vs independent variables
Breusch-Pagan / Cook-Weisberg test for heteroscedasticity
Ho: Constant variance
Variables: fitted values of Dividend payout
chi2(1) = 1.81
Prob > chi2 = 0.1788
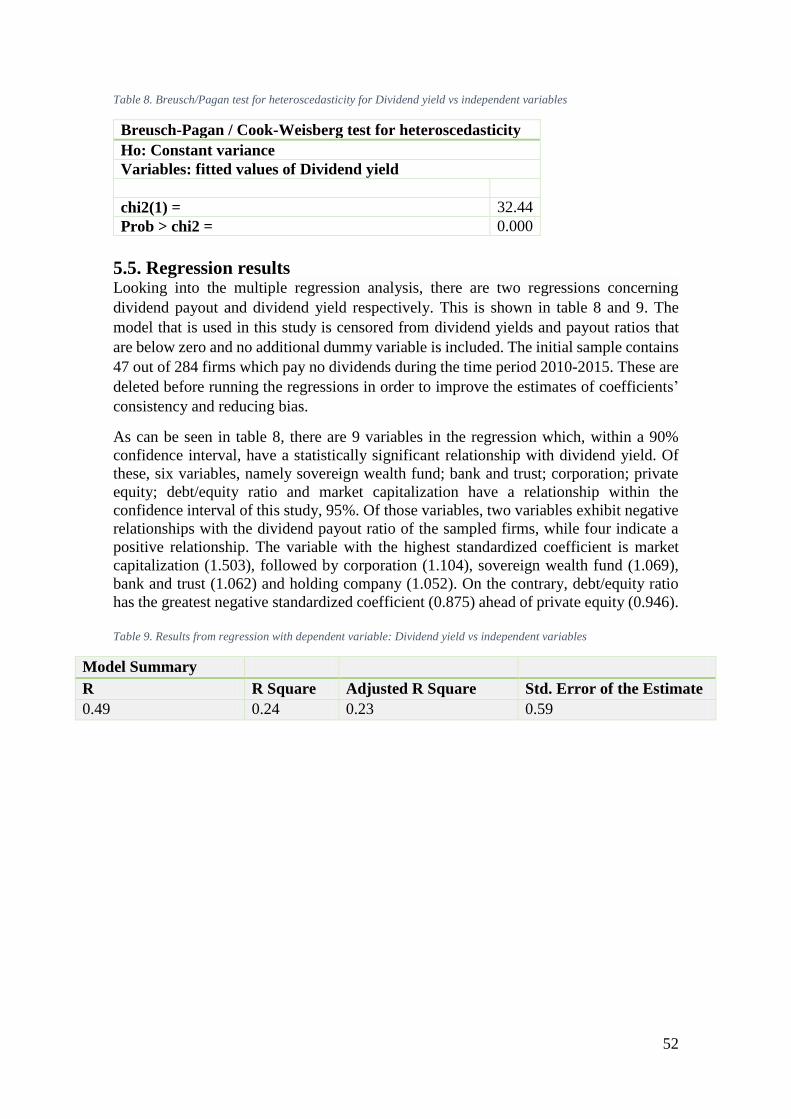
52
Table 8. Breusch/Pagan test for heteroscedasticity for Dividend yield vs independent variables
Breusch-Pagan / Cook-Weisberg test for heteroscedasticity
Ho: Constant variance
Variables: fitted values of Dividend yield
chi2(1) = 32.44
Prob > chi2 = 0.000
5.5. Regression results Looking into the multiple regression analysis, there are two regressions concerning
dividend payout and dividend yield respectively. This is shown in table 8 and 9. The
model that is used in this study is censored from dividend yields and payout ratios that
are below zero and no additional dummy variable is included. The initial sample contains
47 out of 284 firms which pay no dividends during the time period 2010-2015. These are
deleted before running the regressions in order to improve the estimates of coefficients’
consistency and reducing bias.
As can be seen in table 8, there are 9 variables in the regression which, within a 90%
confidence interval, have a statistically significant relationship with dividend yield. Of
these, six variables, namely sovereign wealth fund; bank and trust; corporation; private
equity; debt/equity ratio and market capitalization have a relationship within the
confidence interval of this study, 95%. Of those variables, two variables exhibit negative
relationships with the dividend payout ratio of the sampled firms, while four indicate a
positive relationship. The variable with the highest standardized coefficient is market
capitalization (1.503), followed by corporation (1.104), sovereign wealth fund (1.069),
bank and trust (1.062) and holding company (1.052). On the contrary, debt/equity ratio
has the greatest negative standardized coefficient (0.875) ahead of private equity (0.946).
Table 9. Results from regression with dependent variable: Dividend yield vs independent variables
Model Summary
R R Square Adjusted R Square Std. Error of the Estimate
0.49 0.24 0.23 0.59

53
Coefficients Unstandardized
Coefficients
Standardized
Coefficients
B Std. Error Beta t Sig. Significance
(Constant) 1.400 1.051 1.000 6.743 0.000
Bank and Trust 1.031 1.015 1.062 1.988 0.047 **
Corporation 1.046 1.014 1.104 3.268 0.001 ***
Debt/equity ratio 0.957 1.010 0.875 -
4.574
0.000 ***
Foundation 0.976 1.030 0.976 -
0.831
0.406
Government
Agency
1.021 1.044 1.015 0.488 0.626
Hedge Fund 0.995 1.014 0.989 -
0.376
0.707
Holding Company 1.069 1.040 1.052 1.681 0.093 *
Individual Investor 1.010 1.013 1.024 0.769 0.442
Insurance
Company
1.001 1.014 1.003 0.093 0.926
Investment Advisor 1.017 1.020 1.036 0.841 0.401
Investment
Advisor/Hedge
Fund
1.023 1.021 1.046 1.083 0.279
Market
capitalization
1.045 1.005 1.503 9.884 0.000 ***
Mutual Fund 1.058 1.044 1.038 1.329 0.184
Other Insider
Investor
0.971 1.017 0.951 -
1.767
0.078 *
Pension Fund 1.024 1.021 1.041 1.175 0.240
Price to book value 0.974 1.025 0.971 -
1.066
0.287
Private Equity 0.946 1.028 0.946 -
2.008
0.045 **
Research Firm 0.931 1.039 0.948 -
1.856
0.064 *
Return on assets 1.002 1.021 1.003 0.080 0.936
Sovereign Wealth
Fund
1.035 1.015 1.069 2.296 0.022 **
Venture Capital 1.021 1.036 1.016 0.576 0.565
Dependent
Variable: Dividend
yield
Significance codes: '***' = 0.01 '**' = 0.05 '*' = 0.1

54
The second regression analysis (see table 9) indicates 7 statistically significant
relationships between the dependent variable dividend payout and the independent
variables, all of which are within the 95% confidence interval. All statistically significant
variables indicate positive relationships with dividend payout. The variable with the
largest standardized coefficient, indicating the strongest positive relationship, is market
capitalization (1.393) followed by investment advisor (1.219), bank and trust (1.083),
return on assets and sovereign wealth fund (both 1.077), as well as price to book value
and private equity (both 1.055).
Moreover, comparing the standard error of the estimates of the regressions, the model
based on dividend payout as dependent variable has a higher standard error (≈1.51) than
the model based on dividend yield (≈0.59). However, the dividend payout model has a
higher adjusted R square value (0.29) than the dividend yield model (0.23), implying that
dividend payout ratio is better explained by the variables in the model than dividend yield.
Table 10. Results from regression with dependent variable: Dividend payout vs independent variables
Model Summary
R R Square Adjusted R Square Std. Error of the Estimate
0.56 0.31 0.29 1.51

55
Coefficients Unstandardized
Coefficients
Standardized
Coefficients
B Std. Error Beta t Sig. Significance
(Constant) 1.666 1.137 3.966 0.000
Bank and Trust 1.116 1.040 1.083 2.783 0.005 ***
Corporation 1.040 1.036 1.033 1.114 0.265
Debt/equity ratio 1.019 1.025 1.022 0.768 0.443
Foundation 1.009 1.080 1.003 0.114 0.909
Government Agency 1.138 1.117 1.035 1.165 0.244
Hedge Fund 1.042 1.036 1.033 1.160 0.246
Holding Company 1.025 1.107 1.007 0.246 0.806
Individual Investor 1.046 1.033 1.043 1.411 0.159
Insurance Company 1.030 1.037 1.023 0.812 0.417
Investment Advisor 1.288 1.053 1.219 4.937 0.000 ***
Investment
Advisor/Hedge Fund
1.064 1.054 1.047 1.162 0.245
Market
capitalization
1.103 1.012 1.393 8.422 0.000 ***
Mutual Fund 1.194 1.116 1.044 1.607 0.108
Other Insider
Investor
1.072 1.044 1.045 1.601 0.110
Pension Fund 0.968 1.055 0.980 -0.619 0.536
Price to book value 1.135 1.065 1.055 2.019 0.044 **
Private Equity 1.155 1.074 1.055 2.026 0.043 **
Research Firm 1.117 1.104 1.031 1.121 0.263
Return on assets 1.140 1.055 1.077 2.469 0.014 **
Sovereign Wealth
Fund
1.109 1.040 1.077 2.661 0.008 ***
Venture Capital 1.087 1.096 1.025 0.916 0.360
Dependent Variable:
Dividend payout
Significance codes: '***' = 0.01 '**' = 0.05 '*' = 0.1
5.6. Hypothesis testing Hypothesis 1:
H0: There is no relationship between the level of ownership held by each investor type
and dividend yield among Swedish listed firms.
Ha: There is a relationship between the level of ownership held by each investor type and
dividend yield among Swedish listed firms.
Hypothesis 3:
H0: There is no relationship between each control variable and dividend yield among
Swedish listed firms.
Ha: There is a relationship between each control variable and dividend yield among
Swedish listed firms.

56
As presented in section 5.5, six independent variables exhibit statistically significant
relationships with dividend yield, four positive relationships and two negative
relationships. Thus, we are able to reject the null hypotheses of no relationship with
dividend yield for hypotheses 1 and 3 for the variables bank and trust, corporation, debt
ratio, market capitalization, private equity and sovereign wealth fund. We therefore
accept the alternative hypotheses that those aforementioned independent variables have
statistically significant relationships with dividend yield.
Furthermore, we will also answer the hypotheses covering the relationship between our
independent variables and dividend payout ratio:
Hypothesis 2:
H0: There is no relationship between the level of ownership held by each investor type
and dividend payout among Swedish listed firms.
Ha: There is a relationship between the level of ownership held by each investor type and
dividend payout among Swedish listed firms.
Hypothesis 4:
H0: There is no relationship between each control variable and dividend payout among
Swedish listed firms.
Ha: There is a relationship between each control variable and dividend payout among
Swedish listed firms.
Again, the results from these hypothesis tests are presented in section 5.5. As can be seen,
seven independent variables, four ownership types and three control variables have
significant relationships with the dependent variable dividend payout ratio. All significant
variables exhibit positive relationship, with market capitalization having the greatest
standardized coefficient but investment advisor having the greatest standardized
coefficient among the ownership types.

57
6. Analysis and discussion This chapter will contain reflections on the results from this research, an analysis of the
results and a reconnection to theories in the field of dividend policy and ownership
structure.
Below follows a consolidation (table 10 and 11) of the significant results as well as an
analysis of the results.
Table 11. Summary of significant variables vs dividend yield
Coefficients Unstandardized
Coefficients
Standardized
Coefficients
B Std.
Error
Beta t Sig. Significance
Market capitalization 1.045 1.005 1.503 9.884 0.000 ***
Corporation 1.046 1.014 1.104 3.268 0.001 ***
Sovereign Wealth
Fund
1.035 1.015 1.069 2.296 0.022 **
Bank and Trust 1.031 1.015 1.062 1.988 0.047 **
Private Equity 0.946 1.028 0.946 -
2.008
0.045 **
Debt/equity ratio 0.957 1.010 0.875 -
4.574
0.000 ***
Dependent Variable:
Dividend yield
Significance codes: '***' = 0.01 '**' = 0.05 '*' = 0.1
Table 12. Summary of significant variables vs dividend payout
Unstandardized
Coefficients
Standardized
Coefficients
Coefficients B Std. Error Beta t Sig. Significance
Bank and Trust 1.116 1.040 1.083 2.783 0.005 ***
Investment Advisor 1.288 1.053 1.219 4.937 0.000 ***
Market capitalization 1.103 1.012 1.393 8.422 0.000 ***
Price to book value 1.135 1.065 1.055 2.019 0.044 **
Private Equity 1.155 1.074 1.055 2.026 0.043 **
Return on assets 1.140 1.055 1.077 2.469 0.014 **
Sovereign Wealth Fund 1.109 1.040 1.077 2.661 0.008 ***
Dependent Variable: Dividend
payout
Significance codes: '***' = 0.01 '**' = 0.05 '*' = 0.1
These results in large contradicts the results from Al-Najjar & Kilincarslan (2016) which
found all types of ownership structures among listed firms in Turkey to have negative
relationships with dividend payout as well as dividend yield. The results in this study only
found one significantly negative relationship, between ownership type and dividend yield,

58
namely that of private equity. One possible explanation to this discrepancy in results may
be the theory developed by Walter (1963), as mentioned in the theoretical framework.
According to his theory, the amount of dividends paid is a result of the firm’s growth
prospect. To recap the theory in short, if investors can successfully invest the earnings of
a firm at a higher rate than the firm would be able to reinvest its earnings, it should
distribute them to its shareholders. Considering the fact that Turkey is an emerging market
economy thus growing from a smaller base, it is characterised by higher growth,
providing firms with high yielding investment opportunities. This may pose one
explanation why Turkish firms retain more earnings, translating in less dividend
payments across all ownership types. On the other hand, Sweden is a developed market.
Due to Sweden being a developed economy, it may be harder for Swedish firms to find
high growth opportunities which exceed the rate at which investor can reinvest their
earnings. Another aspect which may cause the difference in results is the fact that
dividends are taxed at a higher rate than capital gains in Turkey (Al-Najjar & Kilincarslan,
2016, p. 157) while they are taxed at the same rate under the Swedish tax regime. The
results from Al-Najjar & Kirincarslan (2016) are in line with the dividend irrelevance
theory proposed by Miller & Modigliani (1961) since there appears to be no clear
predictor of dividends paid among the variables employed in the study. However, the
dividend irrelevance theory cannot be entirely confirmed in Sweden due to the violation
of the assumptions made by Miller & Modigliani such as indifference between capital
gains and dividends in terms of taxation, full information available to all investors (as
proposed in the efficient market hypothesis) and so forth (see section 3.2 for the full list
of assumptions). It is evident that it is difficult to confirm either the dividend relevance
theory as well as the dividend irrelevance theory.
Furthermore, the positive relationship between sovereign wealth funds as well as the
institutional investor types and dividend payout is in line with Ullah et al (2012) who also
found a positive relationship between foreign ownership, institutional investors and
dividends paid among firms in Pakistan.
The results from the regressions indicate strong positive relationships between market
capitalization (size) and dividend payout as well as dividend yield. This confirms the
findings by Fama & French (2000, p. 26-27), Grullon & Michaely (2002, p. 1649),
Adjaoud & Ben-Amar (2010, p. 648) who found positive relationships between dividend
yield and firm size since large firms tend to be more mature, have higher free cash flows
and pay higher dividends. However, it also contradicts the findings of Gugler & Yurtuglu
(2003, p. 731) and Farinha (2003, p. 1204-1205) who found negative relationships
between market capitalization and dividend payout.
Debt/equity ratio’s relationship with dividend yield is the greatest negative relationship
(0.875) of all variables. This negative relationship could be explained by the fact that
highly leveraged firms tend to be less financially liquid and therefore less inclined to pay
dividends. This line of thought is shared by Thanatawee (2012 & 2014). A negative
relation between dividends paid and debt/equity ratio was also found by Kumar (2003, p.
1). The concurrence of these results adds evidence towards the notion that firms with high
debt/equity ratios are likely to be financially strained and therefore less likely to distribute
dividends.
The positive relationship between return on assets and dividend payout may be explained
by the fact that firms with a high level of return on assets are more profitable and therefore

59
have a lower need to retain earnings. These findings are in line with Lintner’s (1956)
model which states that more profitable firms in terms of earnings tend to pay higher
dividends, although successively in order to smooth dividends. However, there may be
other lurking variables in this relationship, since a highly profitable firm may also have
plenty of growth opportunities and therefore want to retain more earnings for investments.
This leads the authors to believe that other variables may in fact be at play in the decision
of dividend payout ratio, such as a combination of profitability (return on assets) and firm
size, where large profitable firms with less profitable investment projects may be more
prone to distribute their earnings while small profitable firms in expansion phases may
want to retain them for investments.
The positive relationship between price-to-book (P/B) value and dividend payout ratio
contradicts the theories developed by some of the most prominent researchers such as
Fama & French (2001, p. 9) and Batacharya (1979, p. 259-270). They argue that a high
P/B value is an indicator of expected future growth, where investors value the company
at a high price relative to its book value due to the incorporation of future growth in profits
in their valuation. Such a company with high growth opportunities should retain their
earnings for reinvestment to pursue those profitable projects and therefore yield a low
dividend payout ratio. Aivazian et al (2001, p. 16) shares this point of view by arguing
that high growth firms with large expected cash flows far in the future are unlikely to
signal this by distributing large current dividends, as proposed by the signaling theory
which argues that firms are reluctant to raise their dividend payout unless they are certain
that the new level is sustainable. P/B values do however have some issues. It is most
applicable for firms in capital-intensive industries. Firms with few tangible assets, which
are not included in the balance sheet, may have high P/B values while in fact being in a
maturing phase, are prone to receive high P/B ratios and yet distribute a high share of
their earnings as dividends due to a lack of growth opportunities.
All significant relationships between ownership type and dividend payout are positive are
in line with the findings of Thanatawee’s (2012) study conducted on Thai firms. The
ownership structures of Thai firms share similarities with those of Swedish firms, with
institutions owning the majority of shares in firms in both countries. Thanatawee finds
that the largest shareholders being institutions has a stronger positive magnitude on
dividend payouts than when the largest shareholders are individuals. While we have no
statistically significant results to confirm neither or reject these findings in terms of
individual investors in the Swedish setting, the results from Thai firms support our
findings that institutional ownership has a positive relationship with the ratio of earnings
distributed as dividends.
However, the fact that private equity displays a negative relationship with dividend yield
while it exhibits a positive relationship with dividend payout ratio is discrepant with the
rest of the results and generally with prior studies. One exception is the study conducted
in Turkey by Al-Najjar & Kirincarslan (2016), which found negative relationships
between both the likelihood and the magnitude of dividend payments and all ownership
types in their study. They state one of the major likely reasons to be the uneven tax
treatments between capital gains and dividends under the Turkish tax regime, where
dividends are taxed higher. This is not the case in Sweden which makes this scenario
inapplicable to the setting of this paper. It is possible that these results are due to statistical
error, considering the fact that its standardized coefficient is close to 1 (0.946). It could
be due to data sample containing many observations with dividend yield values close to
60
0 which is likely since a relatively large share of the sample was removed due to having
dividend yields and payout ratios of 0 to prevent skewness of the results. It is also possible
that this statistical error may have been magnified by the fact that the quality of the data
sample collected is not optimal, showing signs of non-normality and heteroscedasticity.
While non-normality should not pose a considerable issue with such a large sample, it is
possible that heteroscedasticity may have impaired the quality of the statistical tests and
thus should be kept in mind when analysing the results. It is however of course also
possible that ownership by private equity investors does in fact have a detrimental effect
on dividend yield.
The contradictory results of private equity ownership and dividend yield compared to the
other institutional ownership types leads us to believe that dividends are relevant to the
value of the firm. These results appear to support the bird-in-the-hand theory developed
by Lintner (1962) and Gordon (1963) which states that dividends are relevant to the value
of the firm because investors prefer dividends over capital gains since capital gains are
received in the future and therefore carry more uncertainty and risk. They are also in line
with Eckbo & Verma (1993, p. 20-21) who argue that institutional investors prefer
dividends over cash flows, while the opposite is true for managers. The results from this
study largely support this viewpoint, since all institutional ownership types except private
equity have positive relationships with dividend yield and payout.
The contradicting, vast differences between the results of previous studies and the results
of this study reiterates the complexity of ownership structure’s effect on dividend
policies. This may explain why there is still no consensus on issues such as the relevance
of dividends on firms’ value, despite the fact that half a decade has passed since those
theories were first introduced.
61
7. Conclusion This chapter will contain a conclusion of the results from the study followed by
contributions and remarks of the study, discussing and evaluating the research, whether
the purpose has been fulfilled and whether the research gap has been filled. It will be
followed by an evaluation of quality criteria and general quality of the research and
conclude with suggestions for further research.
In order to study the relationship between ownership structure and dividend payments,
measured in dividend yield and dividend payout ratio, two regression analyses were
made, one for each dependent variable (dividend yield and dividend payout ratio) versus
the independent variables (ownership types and control variables). By reducing the initial
sample population consisted from a total of 1704 observations of annual data from 284
listed firms on the OMX Stockholm Exchange’s large, mid and small cap over the 2010-
2015 it is possible that the validity and the generalizability of the results may have been
compromised. However, due to a large amount of observations exhibiting zero dividend
yield and/or dividend payout ratio, the decision was made to remove those in order to
produce more accurate results and to enhance the quality of the statistical tests by
fulfilling the statistical assumptions and to reduce skewness of the data. The sample was
subsequently reduced by 658, bringing the total number of observations to 1046.
Evidence from the regressions reveal corporations to be the ownership type to have the
strongest positive influence on dividend yield, followed by sovereign wealth funds and
banks and trusts. Meanwhile, private equity holdings exhibits a negative relationship with
dividend yield. Furthermore, the results reveal positive relationships between holdings
by, in descending order, investment advisors, banks and trusts, sovereign wealth funds
and private equity versus dividend payout ratio.
The results also indicate market capitalization, return on assets as well as price to book
value to have a positive impact on the dividend payout ratio of the firms in the study. The
results also suggest a strong positive relationship between market capitalization and
dividend yield, while an inverse relationship with debt to equity ratio is proven.
The results from the statistical tests are largely unanimously displaying positive
relationships between all statistically significant ownership types, with the only exception
being private equity ownership. This indicates that institutional shareholders are indeed
more prone to affect firms’ dividend policies positively, which confirms the results
obtained from previous studies by Eckbo & Verma (1993) and Thanatawee (2012).
However, one negative relationship between ownership type (private equity) and
dividend policy (dividend yield) was found.
Overall, the results from this study reveal dividends to be relevant to the value of firms,
thus lending support to the dividend relevance theories developed by Lintner (1962),
Gordon (1963) and Walter (1963). Furthermore, evidence has been found that ownership
structure does affect the dividend policies of firms. However, the majority of the
ownership types show positive relationships with dividend policies, thus indicating that
the dividend irrelevance theory developed by Miller & Modigliani (1961) cannot be
rejected. Clearly, the truth is to be found somewhere in the middle and it becomes
apparent that there are contradictory forces. This explains why there are opposing schools
of thoughts, contradicting each other – theories on dividend as well as ownership structure
are complex and there is no obvious one-size-fits-all approach to developing the optimal

62
level of dividends based on ownership structure for firms in different geographical and
business settings.
7.1. Contribution and remarks There are conflicting theories and opinions in the community of finance researchers on
the topic of dividend policy and ownership structure. Contradicting schools argue on one
hand that dividend policies are irrelevant for the value of firms, while other schools argue
on the other hand that they are relevant. Previous research on the topic conducted in
different geographical settings have yielded different results, but nearly all of them have
been conducted in developing economies. This study is one of the first to be conducted
in the setting of an advanced economy. As has been established in this study, institutional
investors constitute approximately 75% of shareholdings in Sweden which differentiates
the setting from previous studies. The results from the study indicate that institutional
ownership almost unanimously positively affect dividend policies of the firms in the
sample, as opposed to the most recent study on the topic by Al-Najjar & Kilincarslan
(2016) conducted in a Turkish setting, whose study yielded opposite results. This paper
has therefore added knowledge to the field of dividend policy and ownership structure by
adding another piece of the puzzle of dividend policies. The results from this paper can
be used for further studies, partly as a theoretical base when comparing other countries
but also for future studies which may seek to explain the differences between the
relationships of ownership structure and dividend policy in different geographical
settings. They results may also be used as a predictor of dividend policies of firms with a
high concentration of institutional ownership in geographical settings similar to Sweden.
This information could be useful for managers of firms who want to attract a certain kind
of investors by utilizing dividend policy as a means of doing so. Furthermore, this study
has provided support for the theory that dividends are relevant to the value of the firm as
proposed by Gordon (1963), Lintner (1962) and Walter (1963).
7.2. Quality criteria for research In order to ensure a good quality throughout the research which is important when
conducting research, there are three relevant criteria’s that have to be discussed, namely
validity, reliability and generalizability (Bryman & Bell, 2011, p. 41-45, p. 157-165;
Saunders, 2016, p. 202-205).
7.2.1. Reliability
Reliability refers to ensuring consistency in research and that replication of the study will
attain the same findings. If these requirements are met, the research can be considered
reliable. As reliability is mainly a concern in quantitative research studies, ensuring
reliability is crucial to this study (Bryman & Bell, 2011, p. 41; Saunders, 2016, p. 202).
There is also a criteria that is connected to reliability and that is replicability which means
that the research can be copied in further research (Bryman & Bell, p. 41).
The overall reliability of this study can be considered to be high since the authors have
consciously maintained a consistent approach to the research as proposed by the Umeå
School of Business and Economics thesis manual, as well as literature on research
methods, such as Bryman & Bell (2011) and Saunders et al (2016). Furthermore,
inspiration has been gathered from previous research in the same field and the authors
have used sources from peer reviewed academic journal to the largest extent possible.
Since the data used is of a continuous numerical character, no interpretation of the raw
data is necessary, making the data objective and removing the risk of misinterpretations.
63
Objectivity has been an important aspect of the research as well and has been kept in mind
by the authors throughout the whole research as much as possible. While the authors have
tried to keep the paper as structured as possible in order to reduce the risk of
misinterpretations and to remain objective, one has to keep in mind that external
researchers may interpret the research in different ways and this risk is something that
one needs to bear in mind when reading and interpreting other research.
When it comes to replicability, Bryman & Bell (2011, p. 165), explain the importance of
the research to be detailed in order for the research to be replicated in the future. Since
this study is inspired by other studies in the same context and is consistent and aligned
with the variables in the same area, one can conclude that it can be replicated in further
research, especially in other countries than Sweden.
7.2.2. Validity
Validity refers to the extent of whether the measurements are correct and if the research
findings are truthful (Saunders, 2016, p. 202-203). As this study is inspired by other
research in the same area of the effect of ownership structure on dividend policy, prior
knowledge and understanding has been resourcefully utilized in this study to ensure that
the measurements used are valid. In order to validate the models and theories, inspiration
has been gathered from renowned research and been adapted for measuring the ownership
structures effect on dividend policy to the largest extent possible. Furthermore, data
selection has been non-discriminatory and collected from all firms listed on the large, mid
and small cap of the OMX Nordic Stockholm Exchange. However, some limitations
include the reduction in the sample because of missing data and the removal of
observations with zero dividend yield and payout as well as the distribution of the data
population, which did not entirely fulfil all statistical assumptions, such as showing signs
of heteroscedasticity. While the missing values and the removal of observations with zero
dividend values reduced the skewness of the results, it is possible that the missing data
has changed the results. However, the authors deem this justifiable since limiting the
sample to firms with positive dividend yields and payout ratios made the results more
interpretable.
7.2.3. Generalizability
Generalizability is an important aspect of the results generated from a quantitative study
in order to be able to evaluate another similar sample, avoid biases and uncompleted
results (Bryman & Bell, 2011, p. 163-164). While this study has been conducted in a
similar manner to previous studies, its results should be able to be generalized. However,
the findings of similar studies in different geographical settings tend to differ. Therefore,
generalization of this study should be used with caution and confined to geographical and
economical settings similar to Sweden. Meanwhile, the results contribute to the field by
adding another piece to the puzzle of ownership structure’s effect on dividend policy. As
more research is conducted in this field in more geographical settings, it may be possible
to map the relationships between geographical settings and thus increase generalizability.
Since this topic has been debated for decades, further research in this field with increased
generalizability of results would probably help bring clarity in this subject and in the
contradicting schools of dividend research. Since the sample is collected from firms in
the large, mid and small caps of the OMX Nordic Stockholm Exchange, its
generalizability is positively extended. As previous studies are generalized within the
same context, and with the discussion above, this study can be considered relatively

64
generalizable and contribute to enhancing the generalizability of the theories of
ownership structure and dividend policy.
7.2.4. Ethical and societal aspects
In order to be able to finish this study, one has to consider the ethical aspects since it is
important in research. These aspects have been discussed in chapter 2 and has been
followed throughout this research. As the sample is collected from public information
such as large, mid, small cap from OMX Stockholm Exhange and databases such as
Thomson Reuters Eikon and Datastream, there are certain issues related to this. The data
has been interpreted in the original context and the data is considered reliable since annual
reports and OMX Stockholm Exchange are public and information is available for
everyone. This research focuses on to be as objective as possible and the main purpose is
to contribute to further research, investors, shareholders and owners. Since this study is
based on quantitative research and secondary data, there is no room for the lack of
information to respondents or misleading purpose of the interviews as in qualitative
research. However, there are other ethical considerations which need to be kept in mind
when doing all kinds of research, including quantitative research where no personal
interaction with participants is involved. These include aspects such as biases related to
affiliation, copyright infringements and so forth. As mentioned in section 2.12, there are
two main philosophical positions regarding ethics: deontological and teleological. In the
deontological position, a determined set of rules are followed and must not be breached.
In the teleological position, one has to evaluate each action and choose the best option
relevant to the occasion rather than following any predetermined rules. The thesis manual
developed and published by Umeå School of Business and Economics has clear
guidelines on how to act in regards to ethics and these guidelines has been followed. Since
the USBE thesis manual has been followed strictly in terms of issues such as copyright
and referencing as well as other ethical issues, this paper can be considered to have been
following the deontological ethical position.
All statistically significant institutional ownership types displaying positive relationships
with dividend payout ratio, together with the fact that institutional owners comprise
around three quarters of all shareholdings in Sweden. As institutional ownership increases
in firms, the ratio of earnings retained for reinvestment decreases. Meanwhile, the results
from this study indicates that dividend policy is indeed related to the value of firms,
meaning that firms may feel obliged to increasingly pay a larger share of their earnings
as dividends in order to attract investors and to please shareholders. This may lead to
firms increasingly aiming to maximise profits in the short run, which may have a
detrimental effect on business growth in the economy in the long run. Since long term
investments come with a certain degree of uncertainty, short-term focused managers and
executives may be reluctant to accept profitable investment projects due to pressure from
shareholders who prefer short term profits and therefore unwilling to accept a possible
temporary decline in share price following capital outlays in the form of investments.
Instead, they may push the management and executives to neglect investment
opportunities and distribute earnings to shareholders in the form of dividends instead of
retaining them for investments and future growth. Considering the large share of
shareholdings in Sweden held by institutional investors and the fact that they compete on
the basis of generating the highest possible returns, it may turn into a dangerous
downward spiral if institutional investors increasingly start pressing firms for generating
and distributing short-term profits. This strategy may work in the short run and the share
prices of those firms outperform those of firms with long-term strategies but at the same

65
time undermine long-term growth. This is likely to force other institutional investors to
follow the same path and create moral hazards similar to the situation leading up to the
financial crisis of 2007-2008. Furthermore, increasingly concentrated ownership means
that blockholders’ influence over firms’ decisions increases and therefore that
institutional owners with incentives to maximise short-term profits increasingly become
able to affect firms to do so. Even if disperse owners, such as individual investors, may
want to maximise short-term profits and/or dividends, their holding stake is not large
enough for them to significantly affect the decisions of management without other owners
being able to intervene. This exposes one of the risks of a highly concentrated ownership
structure. Furthermore, it exhibits the benefits of having a diverse ownership structure.
For example, a significant insider ownership could possible mitigate these risks since
employees, managers and executives should, as long as incentive systems are correctly
designed, have an interest in managing the company in a long-term perspective.
Another ethical issue is that of taxes. While dividends and capital gains are not taxed
differently under the Swedish tax regime, investors are less likely to attempt to influence
firms’ dividend policies based on taxation. However, evidence from other countries such
as Turkey (Al-Najjar & Kilincarslan, (2016) shows that when capital gains and dividends
are taxed differently, the taxation may become a basis upon which decisions on dividend
policies are made. This may lead to firms not employing the optimal dividend policy in
terms of earnings retention for reinvestment or, reversely, distribution of earnings in order
to counter agency problems.
7.3. Suggestions for further research
The perspective of this research is the effect of ownership structure on dividends,
especially Swedish firms and the specific characteristics of Swedish ownership structure
as well as the perspective of the time period 2010-2015. There are other perspectives that
has to be considered and presented with some suggestions for further research. One
possible variable that can be added, also discussed by Al-Najjar (2016), is to include
board members into the factors of ownership structure to see the difference between
family ownership and family board ownership including directors. This variable could
not be found in the data from Sweden but might be in the future. Therefore, this is a
potential variable for further research in Sweden. Another suggestion is to include the
data from First north and Aktietorget in order to increase the sample in order to be able
to generalize the findings in Sweden even more. This is possible if the data is more
extensive in the future. Moreover, further research can focus on extending the area studied
into a longitudinal study which is based on a longer period of time. Also, it would be
interesting to compare behaviours of Swedish firms and other countries.
As discussed by Pindado & Torre (2008, p. 868, 881), financial decisions are determinants
of ownership structure and financial policies are interrelated with ownership structure,
one possible suggestion for further research is to study the relationship between financial
decisions and ownership structure on dividend policy. An additional aspect of this could
be to reflect upon the corporate governance and ownership structure in relation to
dividend policy. As previously mentioned in chapter 1, the ownership structure has been
changing over time, in general 75 percent to 15 percent ownership of individual investors
which have increased the shareholdings by institutional investors. This is the case in
Sweden where more than 85 per cent of the market capitalization is hold by institutional
investors. Therefore, since previous studies such as Al-Najjar (2016) is in the same
transformation as Sweden to increased institutional ownership, it could be interesting to
66
replicate the same research in other countries with the same type of transformation but
might be other results. Finally, since this is the first country in Europe with the same
research area (with the exception of Italy but that is focusing on other variables), further
research can be done in other countries in Europe, North and South America, Africa etc.
Finally, this study is mainly focusing on dividends rather than other types of distribution
of earnings such as capital gains or share repurchases. One suggestion for further research
is therefore to include ownership structure’s effect on capital gains and/or share
repurchases policies. This is more interesting in other countries since capital gains and
dividends are taxed at the same rate in Sweden.

67
Reference list:
Adjaoud, F., & Ben-Amar, W. (2010). Corporate governance and dividend policy:
Shareholders’ protection or expropriation? Journal of Business Finance and
Accounting, 37 (5-6), 648–667. http://doi.org/10.1111/j.1468-5957.2010.02192.x
Aggarwal, R., & Rao, R. P. (1990). Institutional Ownership and Distribution of Equity
Returns. The Financial Review, 25 (2), 211–229. http://doi.org/10.1111/j.1540-
6288.1990.tb00793.x
Aivazian, V. (2001). Do Firms in Emerging Markets Follow Different Dividend
Policies From Those in the US : Evidence From Firms in Eight Emerging
Countries. Working Paper.
Al-kilani, M., Nr, S. P., Postal, C., Dambovita, J., Griffiths, A., Hardwick, P., …
Birmingham, B. (2012). Dividend signalling in the UK market Stuart Wall.
International Journal of Banking, Accounting and Finance, 4 (4), 294–314.
Al-Najjar, B., & Kilincarslan, E. (2016). The effect of ownership structure on dividend
policy: Evidence from Turkey. Corporate Governance: The International Journal
of Business in Society, In Press. 16 (1) 135-161 http://doi.org/10.1108/CG-09-
2015-0129
Arshad, Z., & Usman, M. (2003). Ownership structure and dividend policy. Journal of
Emerging Market Finance, 5 (1), 15–58.
Bergström, C., & Rydqvist, K. (1990). The Determinants of Corporate Ownership An
Empirical Study on Swedish Data. Journal of Banking & Finance, 14, 237–253.
Berk, J. B., DeMarzo, P., & Harford, J. (2012). Fundamentals of Corporate Finance
Second Edition Boston, MA., United States: Prentice Hall.
Bhattacharya, S. (1979). Imperfect Information, Dividend Policy, and “The Bird in the
Hand” Fallacy. Source: The Bell Journal of Economics, 10 (1), 259–270.
http://doi.org/10.2307/3003330
Black, F. (1976). The new dividend puzzle. Georgetown Law Journal, 2 (2) pp. 5-8
http://doi.org/10.3905/jpm.1976.408558
Bodie, Z., Kane, A., & Marcus, A. J. (2014). Investments. 10th ed. New York City,
New York, United States: McGraw Hill.
Breusch, A. T. S., & Pagan, A. R. (1979). A Simple Test for Heteroscedasticity and
Random Coefficient Variation. Econometrica, 5 (September), 1287–1294.
Celik, S., & Isaksson, M. (2014). Institutional Investors and Ownership Engagement.
OECD Journal: Financial Market Trends, 2013 (2), 93–114.
http://doi.org/10.1057/9781137451743.0008
68
Chaganti, R., & Damanpour, F. (1991). Institutional Ownership, Capital Structure, and
Firm Performance. Strategic Management Journal, 12 (7), 479–491.
Cho, M.-H. (1998). Ownership structure, investment, and the corporate value: An
empirical analysis. Journal of Financial Economics, 47 (1), 103–121.
http://doi.org/10.1016/S0304-405X(97)00039-1
Collis, J & Hussey, R. (2013), Business Research: A practical guide for undergraduate
and postgraduate students. 4th edition. New York, NY, United States: Palgrave
Macmillan.
Contessi, S., & Weinberger, A. (2009). and Country Growth : An Overview. Federal
Reserve Bank of St. Louis Review, 91 (2), 61–78.
Demsetz, H., & Lehn, K. ennet. (1985). The Structure of Corporate Ownership: Causes
and Consequences. Journal of Political Economy, 93 (6), 1155–1177.
http://doi.org/10.1086/261354
Dionne, G., & Ouederni, K. (2011). Corporate risk management and dividend signaling
theory. Finance Research Letters, 8 (4), 188–195.
http://doi.org/10.1016/j.frl.2011.05.002
Easterbrook, F. H. (1984). Two Agency-Cost Explanations of Dividends. The American
Economic Review, 74 (4), 650–659.
Espen Eckbo, B., & Verma, S. (1994). Managerial shareownership, voting power, and
cash dividend policy. Journal of Corporate Finance, 1 (1), 33–62.
http://doi.org/10.1016/0929-1199(94)90009-4
Fama, E. F., & French, K. R. (2001). The Equity Premium. Journal of Financial
Economics, 60 (1), 3–43.
Farinha, J. (2003). Dividend policy, corporate governance and the managerial
entrenchment hypothesis: An empirical analysis. Journal of Business Finance and
Accounting, 30 (9-10), 1173-1209 http://doi.org/10.1111/j.0306-
686X.2003.05624.x
Field, A. (2013), Discovering Statistics using IBM SPSS Statistics, (4th edition), London,
United Kingdom: Sage Publications Ltd.
Gotu, B. (2001). The equality of OLS and GLS estimators in the linear regression model
when the disturbances are spatially correlated. Statistical Papers, 42 (2), 253–263.
http://doi.org/10.1007/s003620100054
Grullon, G., & Michaely, R. (2002). Dividends, Share Repurchases, and the Substitution
Hypothesis. The Journal of Finance, 57 (4).

69
Gugler, K., & Yurtoglu, B. (2003). Corporate governance and dividend pay-out policy
in Germany. European Economic Review, 47 (2), 731–758.
http://doi.org/10.1108/BSS-01-2013-0003
Gursoy, G., & Kursat, A. (2002). Equity Ownership Structure , Risk Taking , and
Performance An Empirical Investigation in Turkish Listed Companies. Emerging
Markets Finance and Trade, 38 (6), 6–25.
Hennink, M & Hutter, I & Bailey, A (2011). Qualitative Research Methods. London,
United Kingdom: SAGE Publications Ltd.
Henrekson, M., & Jakobsson, U. (2003). Two Attacks on the Swedish Corporate Model :
From Wage-Earner Funds to Corporatist Pension Funds. Stockholm School of
Economics.
Higgins, R. C. (1972). The Corporate Dividend-Saving Decision. Journal of Financial
& Quantitative Analysis, 7 (2), 1527–1541. Retrieved from
http://zuezproxy.zulib.de/login?url=http://search.ebscohost.com/login.aspx?direct=
true&AuthType=ip,cookie,uid&db=buh&AN=5722636&lang=de&site=eds-live
Hofer, BK & Rintrich, PR (2002). Personal epistemology: the psychology of beliefs
about knowledge and knowing. New York, NY, United States: L. Erlbaum Associates.
Holderness, C. G., Kroszner, R. S., & Sheehan, D. P. (1999). Were the good old days
that good? Changes in managerial stock ownership since the great depression. The
Journal of Finance, 54 (2), 435–469. http://doi.org/10.1111/0022-1082.00114
Holderness, C. G. (2003). Joint ownership and alienability. International Review of Law
and Economics, 23 (1), 75–100. http://doi.org/10.1016/S0144-8188(03)00015-2
Hotchkiss, E., & Lawrence, S. (2007). Empirical Evidence on the Existence of Dividend
Clienteles. Working Paper, Boston College.
Huddart, S. J. (1991). A theory of optimal ownership structures and sharing rules.
Working paper, University of Bristol.
Jankowicz, D (2005). Business Research Projects. 4th edition. Cleveland, UK: Thomson
Learning.
Janson, N. (2004). Managing financial risk. Australian Journal of Pharmacy, 85 (1011),
440–441. http://doi.org/10.1002/jcaf
Jensen, M. C. (1986). Agency costs of free cash flow, corporate finance, and takeovers.
The American Economic Review, 76 (2), 323–329.
http://doi.org/10.2139/ssrn.99580
Jensen, M. C., & Meckling, W. H. (1976). Theory of the Firm: Managerial Behavior,
Agency Costs and Ownership Structure. Journal of Financial Economics, 3 (4),
305–360. http://doi.org/http://dx.doi.org/10.1016/0304-405X(76)90026-X
70
Kendall, M. G. (1953). The Analysis of Economic Time-Series-Part I: Prices. Journal of
the Royal Statistical Society. Series A (General), 116 (1), 11–34.
D. Kleinbaum. Applied regression analysis and other multivariable methods (1988). 1st
edition. Pacific Grove, CA, United States: Thomson Brooks/Cole.
Kleinbaum, D.G.; Kupper, L.L.; Nizam, A.; Muller, K.E. (2007). Applied Regression
Analysis and Other Multivariable Methods), 4 edition. Pacific Grove, CA, United
States: Duxbury Press.
Knaub, J. (2007). Heteroscedasticity and Homoscedasticity. Encyclopedia of
Measurement and Statistics, (January).
http://doi.org/10.4135/9781412952644.n201
Kraiczy, N. (2013). Innovations in Small and Medium-Sized Family Firms - An
Analysis of Innovation Related Top Management Team Behaviors and Family
Firm-Specific Characterisitcs, 7–17. http://doi.org/10.1007/978-3-658-00063-9
La Porta, R., Lopez-de-Silanes, F., & Shleifer, A. (1999). Corporate Ownership around
the World. The Journal of Finance, 54 (2), 471–517.
La Porta, R., Lopez-de-Silanes, F., Shleifer, A., & Vishny, R. W. (2000). Agency
Problems and Dividend Policies around the World. The Journal of Finance, 55 (1).
Lamba, A., & Stapledon, G. (2001). The Determinants of Corporate Ownership
Structure: Australian Evidence. University of Melbourne Public Law Research
Paper 20
Lambrecht, B. M., & Myers, S. C. (2012). A Lintner Model of Payout and Managerial
Rents. Journal of Finance, 67 (5), 1761–1810. http://doi.org/10.1111/j.1540-
6261.2012.01772.x
Lecompte, MD & Schensul, JJ (1999). Designing and Conducting Ethnographic
Research. Lanham, MD, United States: Rowman & Littlefield Publishers, Inc.
Leech, D., & Leahy, J. (1991). Ownership Structure, Control Type Classifications and
the Performance of Large British Companies. The Economic Journal, 101 (409),
1418–1437.
Lekvall, P. (2014). The Nordic Corporate Governance Model. Stockholm, Sweden:
SNS Förlag.
Lintner, J. (1956). American Economic Association Distribution of Incomes of
Corporations Among Dividends, Retained Earnings, and Taxes. The American
Economic Review, 46 (2), 97–113.
Lintner, J. (1962). Dividends, Earnings, Leverage, Stock Prices and the Supply of
Capital to Corporations. The Review of Economics and Statistics, 44 (3), 243–269.

71
Mancinelli, L., & Ozkan, A. (2006). Ownership Structure and Dividend Policy:
Evidence from Italian Firms. The European Journal of Finance, 12 (3), 265–282.
http://doi.org/10.1080/13518470500249365
Margaritis, D., & Psillaki, M. (2010). Capital structure, equity ownership and firm
performance. Journal of Banking and Finance, 34 (3), 621–632.
http://doi.org/10.1016/j.jbankfin.2009.08.023
Marshall, P. (1997). Research Methods : How to Design and Conduct a Successful
Project. Begbroke, Oxfordshire, United Kingdom: How To Books, Ltd.
Matta, C. (2015). Interpretivism and Causal Explanations: A Case from Educational
Research. Philosophy of the Social Sciences, 45 (6), 543–567.
http://doi.org/10.1177/0048393115595961
McConnell, J. J., & Servaes, H. (1990). Additional evidence on equity ownership and
corporate value. Journal of Financial Economics, 27, 595–612.
Mehrani, S., Moradi, M., & Eskandar, H. (2011). Ownership structure and dividend
policy: Evidence from Iran. African Journal of Business Management, 5 (17),
7516–7525. http://doi.org/10.5897/AJBM11.468
Menard, S. (2002). Longitudinal Research. 1st edition. Thousand oaks, USA: SAGE
Publications.
Michaely, R., & Roberts, M. R. (2006). Dividend Smoothing, Agency Costs, and
Information Asymmetry: Lessons from the Dividend Policies of Private Firms.
Working paper. Retrieved from http://www.bravo-mag.com/25-nigerian-ceos-in-
fraud-scandal/
Miller, D., Le Breton-Miller, I., Lester, R. H., & Cannella, A. A. (2007). Are family
firms really superior performers? Journal of Corporate Finance, 13 (5), 829–858.
http://doi.org/10.1016/j.jcorpfin.2007.03.004
Modigliani, F., & Miller, M. H. (1958). The Cost of Capital, Corporation Finance and
the Theory of Investment. American Economic Review, 48 (3), 261–297.
http://doi.org/10.4013/base.20082.07
Moh’d, M., Perry, L., & Rimbey, J. (1995). An investigation of the dynamic
relationship between agency theory and dividend policy. The Financial Review.
http://doi.org/10.1111/j.1540-6288.1995.tb00837.x
Miller, M., & Modigliani, F. (1961). Dividend Policy, Growth, and the Valuation of
Shares. The Journal of Business, 34 (4), 411–433.
Neuman, W. L. (2003). Social Research Methods: Qualitative and Quantitative
Approaches. Relevance of social research (Vol. 8). http://doi.org/10.2307/3211488

72
O’Brien, R. M. (2007). A caution regarding rules of thumb for variance inflation
factors. Quality and Quantity, 41 (5), 673–690. http://doi.org/10.1007/s11135-006-
9018-6
Ozsoz, E., Gurarda, S., & Abidin, A. (2014). Ownership Structure and Corporate
Governance in the Case of Turkey.
Pagano, M., & Roell, A. (1998). The Choice of Stock Ownership Structure: Agency
Costs, Monitoring, and the Decision to go Public. The Quarterly Journal of
Economics, 113 (1), 187–225.
Parameswaran, S (2011). Fundamentals of Financial Instruments: An Introduction to
Stocks, Bonds, Foreign Exchange, and Derivatives. Singapore: John Wiley & Sons
(Asia) Pte. Ltd.
Pindado, J., & de la Torre, C. (2008). Financial decisions as determinants of ownership
structure: evidence from Spanish family controlled firms. Managerial Finance, 34
(12), 868–885. http://doi.org/10.1108/03074350810915824
Postlethwaite, R. & Michie, J. & Burns, P. & Nuttall, G. (2005) Shared Company How
employee ownership works. Jol the voice of employee owner business
http://www.jol.org.uk/ [Retrieved 2016-05-03]
Razali, N. M., & Wah, Y. B. (2011). Power comparisons of Shapiro-Wilk,
Kolmogorov-Smirnov, Lilliefors and Anderson-Darling Tests. Journal of
Statistical Modeling and Analytics, 2 (1), 21–33.
Resnik, D. B. (2015/12/01). What is Ethics in Research & Why is it Important?.
National Institute of Environmental Health Sciences.
http://www.niehs.nih.gov/research/resources/bioethics/whatis/. [retrieved 2016-04-
16].
Ross, S. A. (1977). The Determination of Financial Structure: The Incentive-Signalling
Approach. The Bell Journal of Economics, 8 (1), 23–40.
Roy, A. (2015). Dividend policy, ownership structure and corporate governance: An
empirical analysis of Indian firms. Indian Journal of Corporate Governance, 8 (1),
1–33. http://doi.org/10.1177/0974686215574422
Rozeff, M. S. (1982). Growth, beta and agency costs as determinants of divided payout
ratios. The Journal of Financial Research, 5 (3), 249–259.
Saunders, M., Lewis, P., & Thornhill, A. (2016). Research Methods For Business
Students (7th ed.). Harlow, Essex, United Kingdom: Pearson education.
http://doi.org/10.1017/CBO9781107415324.004
Sekaran, U. (2003). Research methods for business a skill building approach (4th ed.).
New York City, New York: John Wiley & Sons Inc.

73
Shapiro, S. S., & Wilk, M. B. (1965). An Analysis of Variance Test for Normality
(Complete Samples). Biometrika, 52 (3/4), 591–611.
http://doi.org/10.1093/biomet/52.3-4.591
Shleifer, A., & Vishny, R. W. (1997). A survey of corporate governance. The Journal of
Finance, 52 (2), 737–783. http://doi.org/10.1111/j.1540-6261.1997.tb04820.x
Shleifer, A., & Vishny, R. W. (1986). Large shareholders and corporate control. The
Journal of Political Economy, 94 (3), 461–488.
Shleifer, A., Vishny, R. W., & Morck, R. (1988). Management ownership and market
valuation. Journal of Financial Economics, 20, 293–315.
Shleifer, A., & Vishny, R. W. (1989). Management Entrenchment The Case of
Manager-Specific Investments. Journal of Financial Economics, 25, 123–139.
http://doi.org/10.1017/CBO9781107415324.004
Smith, A. (1776). An Inquiry into the Nature and Causes of the Wealth of Nations. 5th
edition. London, United Kingdom: Methuen & Co., Ltd.
Smith, D. M. (2011). Residual Dividend Policy. Dividends and Dividend Policy.
Albany, New York, United States.
Srinagesh, K (2006). The principles of Experimental Research. 1st edition. Burlington,
USA: Butterworth-Heinemann.
Stulz, R. (1988). Managerial control of voting rights. Financing policies and the market
for corporate control. Journal of Financial Economics, 20, 25–54.
http://doi.org/10.1016/0304-405X(88)90039-6
Sturesson, J & McIntyre, S & Jones, NC (2015). State-Owned Enterprises Catalysts for
public value creation. PwC 1-47.
Thanatawee, Y. (2012). Ownership Structure and Dividend Policy: Evidence from
Thailand. International Journal of Economics and Finance, 5(1), 121–132.
http://doi.org/10.5539/ijef.v5n1p121
Thomsen, S., & Pedersen, T. (2000). Ownership Structure and Economic Performance
in the Largest European Companies. Strategic Management Journal, 705
(January), 689–705.
Trochim, W. M. (2002). Research Methods Knowledge Base (4th ed.). Ithaca, New
York, United States: William M.K. Trochim.
Ullah, H., Fida, A., & Khan, S. (2012). The impact of ownership structure on dividend
policy evidence from emerging markets KSE-100 index Pakistan. International
Journal of Business and Social Science, 3(9), 298–307.
Walliman,, N (2011). Research Methods: The basics. Oxford, UK: Routledge.

74
Walter, J. (1963). Dividend policy: its influence on the value of the enterprise. Journal
of Finance, 18 (2), 280–291. http://doi.org/10.2307/2977909
Warrad, L., Abed, S., Khriasat, O., & Al-Sheikh, I. (2012). The Effect of Ownership
Structure on Dividend Payout Policy: Evidence from Jordanian Context.
International Journal of Economics and Finance, 4 (2), 187–195.
http://doi.org/10.5539/ijef.v4n2p187
Wilk, A. M. B., & Shapiro, S. S. (1968). The Joint Assessment of Normality of Several
Independent Samples. Technometrics, 10 (4), 825–839.
Wilkinson, B. (2013). New Zealand’S Global Links Foreign Ownership and the Status
of New Zealand's Net International Investment. Wellington, New Zealand: The
New Zealand Initiative.
Wilson, J (2010). Essentials of business research. 2nd edition. Thousand Oaks, USA:
SAGE Publications Ltd.
Yin, R. K. (2009). Case study research : design and methods. Applied social research
methods series ; (4th ed., Vol. 5.). Thousand Oaks, California, United States:
SAGE publications.
Zikmund, W. G., Babin, B. J., Carr, J. C., & Griffin, M. (2010). Business Research
Methods (8th ed.). Mason, Ohio: Cengage Learning.

73
Appendix
Appendix 1. Pearson correlation table
LnPension Fund
LnInvestment
Advisor/Hedge
Fund
LnSovereign
Wealth Fund
LnBank and
Trust
LnIndividual
Investor LnCorporation
LnInsurance
Company LnHedge Fund
LnGovernment
Agency
LnHolding
Company LnMutual Fund LnPrivate Equity
LnResearch
Firm
LnVenture
Capital
LnOther Insider
Investor
LnInvestment
Advisor LnDebt ratio
LnDividend
payout LnDividend yield
LnMarket
capitalization
LnPrice to book
value
LnReturn on
assets
Pearson Correlation 1 .432**
.343**
-.294**
-.241** -.020 -.073
*-.122
** -.006 .020 -.123** -.047 -.062
* .005 -.017 .440**
.127**
.160**
.119**
.294** .026 .054
Sig. (2-tailed) .000 .000 .000 .000 .514 .018 .000 .838 .522 .000 .127 .044 .874 .580 .000 .000 .000 .000 .000 .406 .079
N 1046 1046 1046 1046 1046 1046 1046 1046 1046 1046 1046 1046 1046 1046 1046 1046 1046 1046 1046 1046 1046 1046
Pearson Correlation .432** 1 .227
**-.242
**-.123
** -.033 -.003 -.129** .015 .011 -.104
**.085
**-.074
* .003 .069*
.580**
.118**
.249**
.188**
.454** .030 .146
**
Sig. (2-tailed) .000 .000 .000 .000 .293 .930 .000 .633 .719 .001 .006 .017 .917 .026 .000 .000 .000 .000 .000 .330 .000
N 1046 1046 1046 1046 1046 1046 1046 1046 1046 1046 1046 1046 1046 1046 1046 1046 1046 1046 1046 1046 1046 1046
Pearson Correlation .343**
.227** 1 -.204
**-.218
**-.161
**-.159
**-.189
** -.054 -.117**
-.078*
-.101**
-.069* -.051 -.024 .204
**.160
**.105
**.115
**.200
** -.034 -.031
Sig. (2-tailed) .000 .000 .000 .000 .000 .000 .000 .082 .000 .012 .001 .026 .097 .446 .000 .000 .001 .000 .000 .266 .319
N 1046 1046 1046 1046 1046 1046 1046 1046 1046 1046 1046 1046 1046 1046 1046 1046 1046 1046 1046 1046 1046 1046
Pearson Correlation -.294**
-.242**
-.204** 1 .177
**.074
*.077
*.098
** -.035 .033 .000 .018 .062*
.110**
-.159**
-.186**
-.103**
-.075* -.030 -.206
** .014 -.081**
Sig. (2-tailed) .000 .000 .000 .000 .017 .013 .001 .262 .284 .999 .552 .045 .000 .000 .000 .001 .015 .328 .000 .663 .009
N 1046 1046 1046 1046 1046 1046 1046 1046 1046 1046 1046 1046 1046 1046 1046 1046 1046 1046 1046 1046 1046 1046
Pearson Correlation -.241**
-.123**
-.218**
.177** 1 .236
**.139
**.079
* -.044 -.050 .085** -.046 .017 -.008 -.015 -.144
**-.198
** .047 -.027 .025 .030 .165**
Sig. (2-tailed) .000 .000 .000 .000 .000 .000 .011 .157 .108 .006 .134 .590 .784 .628 .000 .000 .128 .386 .417 .337 .000
N 1046 1046 1046 1046 1046 1046 1046 1046 1046 1046 1046 1046 1046 1046 1046 1046 1046 1046 1046 1046 1046 1046
Pearson Correlation -.020 -.033 -.161**
.074*
.236** 1 .170
**.114
** .035 .013 .047 .001 .055 -.003 -.106** .005 -.007 .109
** .048 .078* .023 .008
Sig. (2-tailed) .514 .293 .000 .017 .000 .000 .000 .261 .675 .127 .972 .075 .933 .001 .878 .827 .000 .118 .012 .454 .792
N 1046 1046 1046 1046 1046 1046 1046 1046 1046 1046 1046 1046 1046 1046 1046 1046 1046 1046 1046 1046 1046 1046
Pearson Correlation -.073* -.003 -.159
**.077
*.139
**.170
** 1 .210** .027 .027 .061
* .056 .019 -.003 .026 -.004 -.036 .012 .001 -.019 .065* -.057
Sig. (2-tailed) .018 .930 .000 .013 .000 .000 .000 .382 .382 .049 .069 .546 .920 .408 .897 .249 .702 .964 .548 .035 .064
N 1046 1046 1046 1046 1046 1046 1046 1046 1046 1046 1046 1046 1046 1046 1046 1046 1046 1046 1046 1046 1046 1046
Pearson Correlation -.122**
-.129**
-.189**
.098**
.079*
.114**
.210** 1 -.024 .106
**.116
**-.077
* .050 -.040 .003 -.062*
-.189** -.002 -.092
**-.127
** .048 -.012
Sig. (2-tailed) .000 .000 .000 .001 .011 .000 .000 .444 .001 .000 .013 .108 .195 .919 .044 .000 .958 .003 .000 .123 .707
N 1046 1046 1046 1046 1046 1046 1046 1046 1046 1046 1046 1046 1046 1046 1046 1046 1046 1046 1046 1046 1046 1046
Pearson Correlation -.006 .015 -.054 -.035 -.044 .035 .027 -.024 1 .241** .056 .003 .065
* -.031 .009 .023 .045 .067* .032 -.027 -.032 -.050
Sig. (2-tailed) .838 .633 .082 .262 .157 .261 .382 .444 .000 .071 .917 .035 .313 .760 .450 .150 .029 .305 .382 .300 .109
N 1046 1046 1046 1046 1046 1046 1046 1046 1046 1046 1046 1046 1046 1046 1046 1046 1046 1046 1046 1046 1046 1046
Pearson Correlation .020 .011 -.117** .033 -.050 .013 .027 .106
**.241
** 1 .049 .011 .076*
.124** -.051 -.001 .054 .017 .063
* .016 .016 -.004
Sig. (2-tailed) .522 .719 .000 .284 .108 .675 .382 .001 .000 .112 .726 .014 .000 .097 .982 .082 .575 .041 .612 .614 .908
N 1046 1046 1046 1046 1046 1046 1046 1046 1046 1046 1046 1046 1046 1046 1046 1046 1046 1046 1046 1046 1046 1046
Pearson Correlation -.123**
-.104**
-.078* .000 .085
** .047 .061*
.116** .056 .049 1 .025 .091
** .031 .054 -.096** -.029 -.015 -.052 -.100
** -.051 -.044
Sig. (2-tailed) .000 .001 .012 .999 .006 .127 .049 .000 .071 .112 .421 .003 .322 .081 .002 .344 .618 .094 .001 .100 .159
N 1046 1046 1046 1046 1046 1046 1046 1046 1046 1046 1046 1046 1046 1046 1046 1046 1046 1046 1046 1046 1046 1046
Pearson Correlation -.047 .085**
-.101** .018 -.046 .001 .056 -.077
* .003 .011 .025 1 .012 .007 -.075* -.016 .031 .043 -.045 .021 -.051 -.016
Sig. (2-tailed) .127 .006 .001 .552 .134 .972 .069 .013 .917 .726 .421 .698 .823 .015 .596 .321 .161 .149 .499 .096 .610
N 1046 1046 1046 1046 1046 1046 1046 1046 1046 1046 1046 1046 1046 1046 1046 1046 1046 1046 1046 1046 1046 1046
Pearson Correlation -.062*
-.074*
-.069*
.062* .017 .055 .019 .050 .065
*.076
*.091
** .012 1 .019 -.012 -.017 -.018 -.001 -.065*
-.081** -.019 .021
Sig. (2-tailed) .044 .017 .026 .045 .590 .075 .546 .108 .035 .014 .003 .698 .540 .686 .585 .562 .985 .037 .009 .542 .500
N 1046 1046 1046 1046 1046 1046 1046 1046 1046 1046 1046 1046 1046 1046 1046 1046 1046 1046 1046 1046 1046 1046
Pearson Correlation .005 .003 -.051 .110** -.008 -.003 -.003 -.040 -.031 .124
** .031 .007 .019 1 -.037 .008 .042 .026 .038 -.019 -.053 -.022
Sig. (2-tailed) .874 .917 .097 .000 .784 .933 .920 .195 .313 .000 .322 .823 .540 .228 .805 .178 .408 .221 .538 .087 .469
N 1046 1046 1046 1046 1046 1046 1046 1046 1046 1046 1046 1046 1046 1046 1046 1046 1046 1046 1046 1046 1046 1046
Pearson Correlation -.017 .069* -.024 -.159
** -.015 -.106** .026 .003 .009 -.051 .054 -.075
* -.012 -.037 1 .071* -.036 .086
** -.009 .186** .001 .119
**
Sig. (2-tailed) .580 .026 .446 .000 .628 .001 .408 .919 .760 .097 .081 .015 .686 .228 .021 .245 .006 .771 .000 .978 .000
N 1046 1046 1046 1046 1046 1046 1046 1046 1046 1046 1046 1046 1046 1046 1046 1046 1046 1046 1046 1046 1046 1046
Pearson Correlation .440**
.580**
.204**
-.186**
-.144** .005 -.004 -.062
* .023 -.001 -.096** -.016 -.017 .008 .071
* 1 .088**
.303**
.205**
.418** -.023 .116
**
Sig. (2-tailed) .000 .000 .000 .000 .000 .878 .897 .044 .450 .982 .002 .596 .585 .805 .021 .004 .000 .000 .000 .461 .000
N 1046 1046 1046 1046 1046 1046 1046 1046 1046 1046 1046 1046 1046 1046 1046 1046 1046 1046 1046 1046 1046 1046
Pearson Correlation .127**
.118**
.160**
-.103**
-.198** -.007 -.036 -.189
** .045 .054 -.029 .031 -.018 .042 -.036 .088** 1 .060 -.035 .210
** -.014 -.066*
Sig. (2-tailed) .000 .000 .000 .001 .000 .827 .249 .000 .150 .082 .344 .321 .562 .178 .245 .004 .050 .256 .000 .661 .033
N 1046 1046 1046 1046 1046 1046 1046 1046 1046 1046 1046 1046 1046 1046 1046 1046 1046 1046 1046 1046 1046 1046
Pearson Correlation .160**
.249**
.105**
-.075* .047 .109
** .012 -.002 .067* .017 -.015 .043 -.001 .026 .086
**.303
** .060 1 .124**
.318** .011 .085
**
Sig. (2-tailed) .000 .000 .001 .015 .128 .000 .702 .958 .029 .575 .618 .161 .985 .408 .006 .000 .050 .000 .000 .717 .006
N 1046 1046 1046 1046 1046 1046 1046 1046 1046 1046 1046 1046 1046 1046 1046 1046 1046 1046 1046 1046 1046 1046
Pearson Correlation .119**
.188**
.115** -.030 -.027 .048 .001 -.092
** .032 .063* -.052 -.045 -.065
* .038 -.009 .205** -.035 .124
** 1 .265**
-.065* -.003
Sig. (2-tailed) .000 .000 .000 .328 .386 .118 .964 .003 .305 .041 .094 .149 .037 .221 .771 .000 .256 .000 .000 .036 .930
N 1046 1046 1046 1046 1046 1046 1046 1046 1046 1046 1046 1046 1046 1046 1046 1046 1046 1046 1046 1046 1046 1046
Pearson Correlation .294**
.454**
.200**
-.206** .025 .078
* -.019 -.127** -.027 .016 -.100
** .021 -.081** -.019 .186
**.418
**.210
**.318
**.265
** 1 -.044 .292**
Sig. (2-tailed) .000 .000 .000 .000 .417 .012 .548 .000 .382 .612 .001 .499 .009 .538 .000 .000 .000 .000 .000 .159 .000
N 1046 1046 1046 1046 1046 1046 1046 1046 1046 1046 1046 1046 1046 1046 1046 1046 1046 1046 1046 1046 1046 1046
Pearson Correlation .026 .030 -.034 .014 .030 .023 .065* .048 -.032 .016 -.051 -.051 -.019 -.053 .001 -.023 -.014 .011 -.065
* -.044 1 .073*
Sig. (2-tailed) .406 .330 .266 .663 .337 .454 .035 .123 .300 .614 .100 .096 .542 .087 .978 .461 .661 .717 .036 .159 .018
N 1046 1046 1046 1046 1046 1046 1046 1046 1046 1046 1046 1046 1046 1046 1046 1046 1046 1046 1046 1046 1046 1046
Pearson Correlation .054 .146** -.031 -.081
**.165
** .008 -.057 -.012 -.050 -.004 -.044 -.016 .021 -.022 .119**
.116**
-.066*
.085** -.003 .292
**.073
* 1
Sig. (2-tailed) .079 .000 .319 .009 .000 .792 .064 .707 .109 .908 .159 .610 .500 .469 .000 .000 .033 .006 .930 .000 .018
N 1046 1046 1046 1046 1046 1046 1046 1046 1046 1046 1046 1046 1046 1046 1046 1046 1046 1046 1046 1046 1046 1046
**. Correlation is significant at the 0.01 level (2-tailed).
*. Correlation is significant at the 0.05 level (2-tailed).
LnDebt ratio
LnDividend payout
LnDividend yield
LnMarket capitalization
LnPrice to book value
LnReturn on assets
LnMutual Fund
LnPrivate Equity
LnResearch Firm
LnVenture Capital
LnOther Insider Investor
LnInvestment Advisor
LnIndividual Investor
LnCorporation
LnInsurance Company
LnHedge Fund
LnGovernment Agency
LnHolding Company
LnPension Fund
LnInvestment
Advisor/Hedge Fund
LnSovereign Wealth Fund
LnBank and Trust

Umeå School of Business and Economics
Umeå University
SE-901 87 Umeå, Sweden
www.usbe.umu.se


