
OVERVIEW
ONTARIO MUNICIPALBENCHMARKING INITIATIVE
(OMBI)

Overview
What is OMBI? Vision, Mission and Values Services Provided Partners Organizational Structure and Service Areas
Why Measure?
What are the Challenges?
What are the Benefits?
Accomplishments
What’s Next for OMBI
OMBI Products

OMBI will be a leader in advancingmunicipal service delivery.
OMBI, as a collaborative of Canadian municipalities, will contribute to the public trust and confidence in municipal
government with its progressive benchmarking framework and forums for the exchange of ideas.
Exponential ThinkingCommitment
Respectful & SupportiveIntegrity
Vision, Mission & Values
4
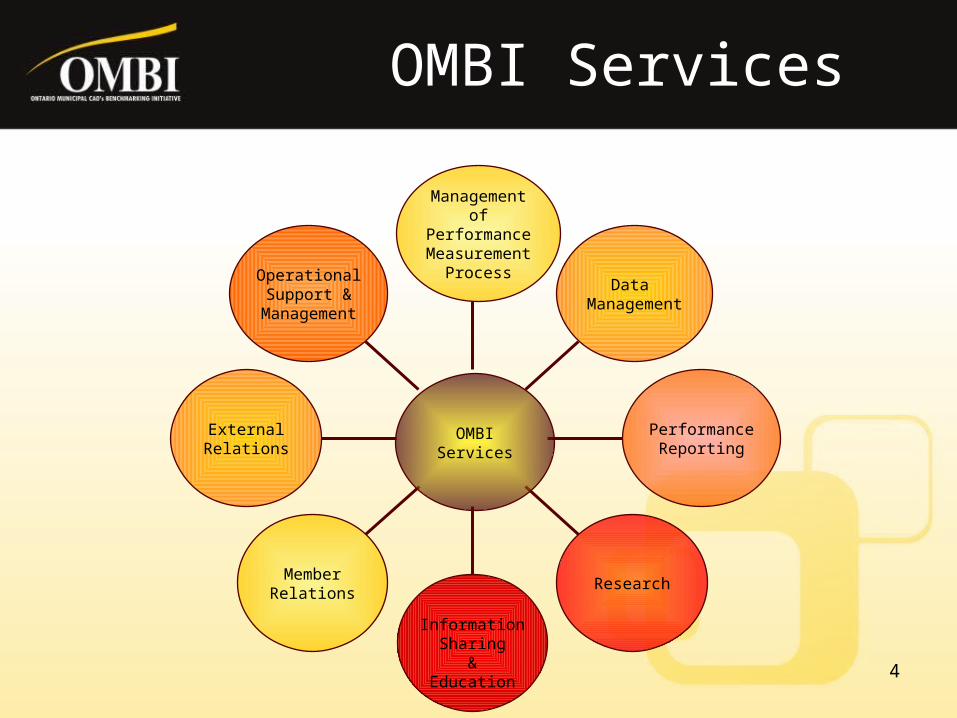
OMBI Services
Operational Support &
Management
ExternalRelations
MemberRelations
Information Sharing
&Education
Research
PerformanceReporting
Data Management
Management of
Performance Measurement
Process
OMBIServices

Durham Region Halton Region City of Hamilton City of London District of Muskoka Niagara Region City of Ottawa City of Sudbury City of Thunder Bay City of Toronto Region of Waterloo City of Windsor York Region
Associate Partners City of Barrie City of Calgary City of Winnipeg
OMBI Partners
6
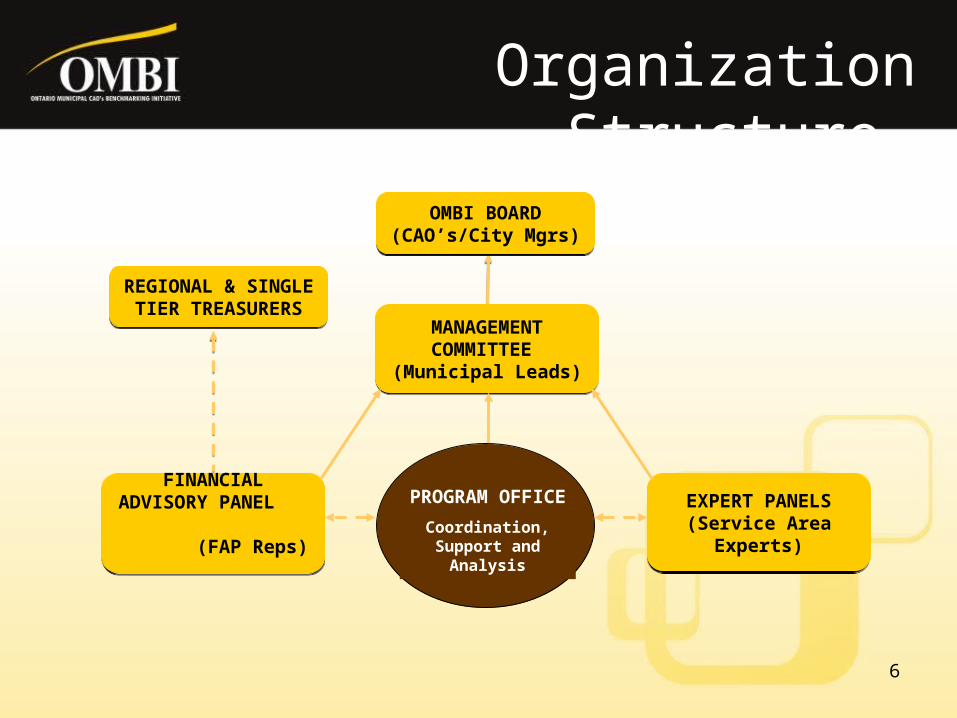
Organization Structure
OMBI BOARD(CAO’s/City Mgrs)
OMBI BOARD(CAO’s/City Mgrs)
REGIONAL & SINGLE TIER TREASURERS
REGIONAL & SINGLE TIER TREASURERS
FINANCIAL ADVISORY PANEL
(FAP Reps)
FINANCIAL ADVISORY PANEL
(FAP Reps)
MANAGEMENT COMMITTEE
(Municipal Leads)
MANAGEMENT COMMITTEE
(Municipal Leads)
EXPERT PANELS (Service Area Experts)
EXPERT PANELS (Service Area Experts)
PROGRAM OFFICE
Coordination, Support and Analysis

7
Service Areas
Direct Services Building By-law Child Care Culture EMS Fire Hostels Libraries Licensing Long Term Care Parking Parks POA (Court Services) Planning
Direct Services Police Public Health Roads Social Assistance Social Housing Sports & Recreation Transit Waste Management Wastewater Water
Support Services Accounts Payable Clerks Customer Service
(new) Facilities Fleet General Revenue Human Resources Information Services Investment Legal Services Payroll Purchasing Taxation
37 Municipa
l Services

Why Measure Sound business practice and expectation in today’s environment Overall acceptance by Government Creates a culture of continuous improvement Measurement is the ‘jump-off’ point leading to discussions about
underlying practices or policies in achieving certain results Citizen expectations for more effective and efficient programs and
services On-going fiscal challenges to do more with less Need to align service requirements with budget priorities Demonstrates transparency , accountability and value for money
You can’t manage what you don’t know.
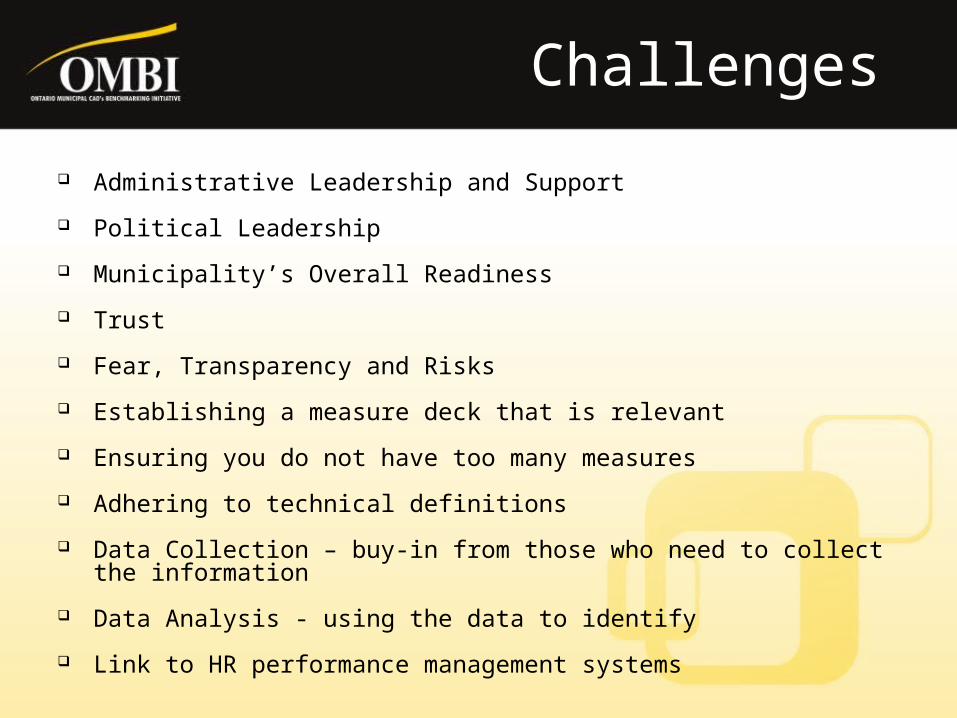
Administrative Leadership and Support
Political Leadership
Municipality’s Overall Readiness
Trust
Fear, Transparency and Risks
Establishing a measure deck that is relevant
Ensuring you do not have too many measures
Adhering to technical definitions
Data Collection – buy-in from those who need to collect the information
Data Analysis - using the data to identify Link to HR performance management systems
Challenges

Benefits of Measurement
Improved accountability through the process of collecting, and analyzing, Improved C for L&I through the discussion that happens with the expert panels in understanding the underlying practices that attribute to better results
Acc
ou
nta
bili
ty
Organization/Capacity for Learning and Improvement

OMBI - Benefits
Collaboration among 16 municipalities - working together for a common purpose Learn from and exchange information with each other Network with peers Pooling of knowledge (think-tank)
Provides credible municipal data that measures and compares how efficiently and effectively services are delivered
Established methodology, benchmarking framework and protocols for collecting and reporting information
Supports a performance culture in partner municipalities
OMBI provides not only year over year internal comparisons but also comparisons with other municipalities

Seven-Step Benchmarking Methodology
6. Develop emulation strategiesWhat are the implications for the Municipality?
1. Select Programs for BenchmarkingWhat questions do I want to answer?
2. Develop performance measures.Define what to measure and how?
5. Assess/Recommend best/better practicesWhat policies/practices drive performance?
4. Establish the `Zone of PerformanceWhat constitutes a superior performance?
3. Collect and analyze the dataDo the peer-reviewed results make sense?
7. Evaluate benchmarkingprocessWhat would we do differently next time?

How municipalities use their resources, often expressed as a cost per unit of service or the volume of output per staff member.
The effect programs and services have on our communities.
The number, type or level of service delivered to residents in municipalities.
Measure the quality of service and degree of customer satisfaction with the service received, relative to service standards and customer needs and expectations.
Community Impact
Measures
Efficiency Measures
Customer Service
Measures
Service Level
Measures
Benchmarking Framework

OMBI - Benefits
Expert panel meetings provide a forum for the exchange of ideas and posing of business questions facing the program
External peer review to complement each municipality’s examination of their own internal performance
Strengthens municipalities accountability and improves the level of transparency in how services are provided and reported
Enables Councils and Staff to make informed decisions and/or set policy based on service quality, quantity and cost

OMBI Accomplishments
EMS influenced upgrades to data collection processes by lobbying the Ministry which has improved data quality
Accounts Payable data was used as the ‘jump-off’ point for the Region of Peel who reviewed their internal processes resulting in cost-savings
OMBI in partnership with the Ministry of Municipal Affairs & Housing and the Ministry of Finance, developed the Municipal Guide to Accounting for Tangible Capital Assets (TCA) which is used extensively in province-wide training workshops
16
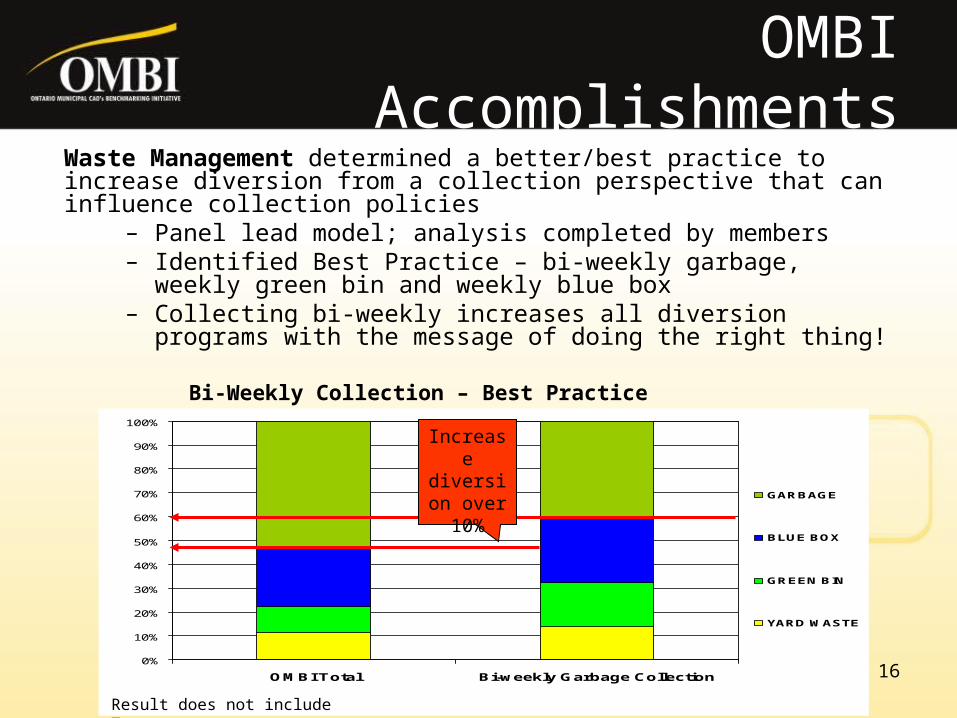
Waste Management determined a better/best practice to increase diversion from a collection perspective that can influence collection policies
– Panel lead model; analysis completed by members– Identified Best Practice – bi-weekly garbage, weekly green
bin and weekly blue box– Collecting bi-weekly increases all diversion programs with
the message of doing the right thing!
0%
10%
20%
30%
40%
50%
60%
70%
80%
90%
100%
OMBI Total Bi-weekly Garbage Collection
GARBAGE
BLUE BOX
GREEN BIN
YARD WASTE
Bi-Weekly Collection – Best Practice
Increase diversion over 10%
Result does not include Toronto
OMBI Accomplishments
OMBI Accomplishments
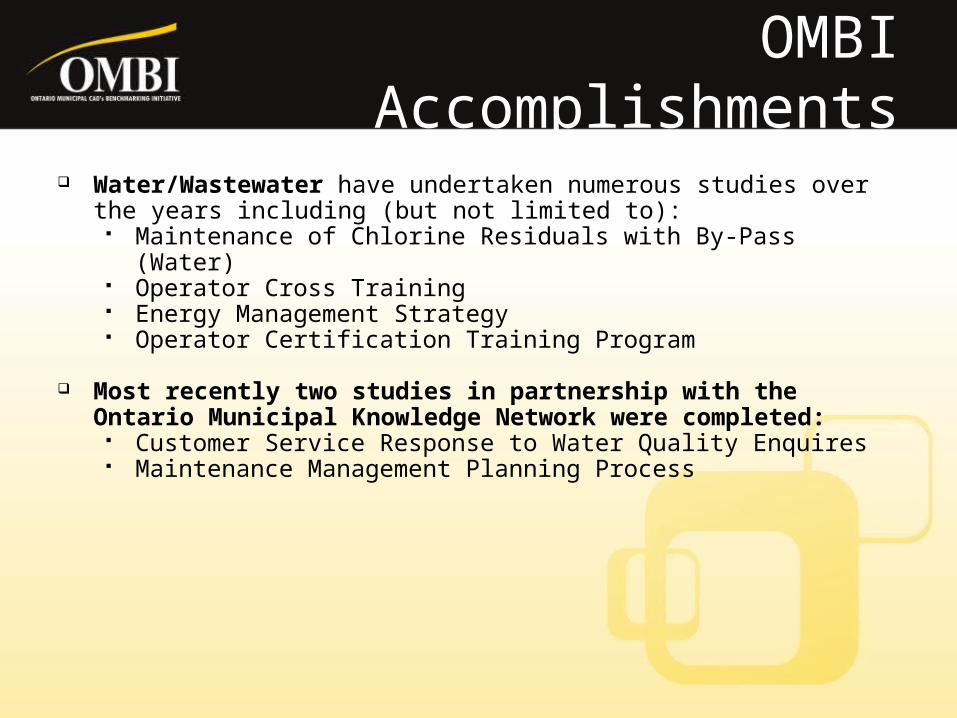
Water/Wastewater have undertaken numerous studies over the years including (but not limited to):
Maintenance of Chlorine Residuals with By-Pass (Water) Operator Cross Training Energy Management Strategy Operator Certification Training Program
Most recently two studies in partnership with the Ontario Municipal Knowledge Network were completed:
Customer Service Response to Water Quality Enquires Maintenance Management Planning Process

18
Human Resource recently completed a review of On-boarding Practices municipality lead model (York) with participation from OMBI partners On-boarding Study Benchmarking Report is in circulation Study results to be presented at future RCAO mtg
Outcome - Potential Better/Best Practices identified were: Fixed start date for new hires Workflow technology Advance preparation for payroll prior to hire Advance preparation for pension/benefits prior to hire Group enrolment of pension and benefits Measures for success of on-the-job training programs
Next Steps Review current OMBI data set of measures Focus on new measures related to human capital and the health of the
organization, i.e. turnover, new hire turnover, WSIB lost time/lost hours, grievances resolved and sick time
OMBI Accomplishments

What’s Next Switch focus from measuring inputs to measuring outcomes
Community impact measures Customer service measures
2011 Projects Partnership with ICCS – Development of a Common
Measurement Tool for Municipalities (Customer Satisfaction) Service Area Measures Review / Program Mapping Exercise
Interactive Web Site share results provide an understanding of the factors that influence results house practices and strategies
OMBIProducts

Data Warehouse ‘Award-winning’ data warehouse Stores all data and provides ability to run various reports, tables and graphs Houses documents such as best practices, policies and templates that are shared
amongst all partners Supports theory of using what we have – don’t need to re-invent the wheel

Percentage of Solid Waste Diverted - Residential (MPMP)
0%
10%
20%
30%
40%
50%
60%
2006 40.3% 43.0% 41.9% 40.7% 40.1% 44.0% 45.1% 35.1% 45.2% 35.0% 24.5% 42.4% 43.1% 36.3% 40.8% 40.8%
2007 33.7% 48.0% 40.3% 42.4% 40.0% 45.5% 43.3% 33.9% 49.6% 35.7% 26.6% 42.5% 44.6% 36.1% 53.0% 42.4%
2008 35.5% 49.0% 55.5% 45.1% 41.2% 51.0% 42.5% 33.7% 50.2% 38.0% 27.5% 44.0% 47.0% 51.6% 44.6%
BRT DUR HAL HAM LON MUSK NIAG OTT PEEL SUD TBAY TOR WAT WIND YORK MED
2008 Median Line
Performance Reporting Executive Report
Includes ALL program areas Targeted audience - CAO/City
Managers Graphs 3 years of data for CAO
Priority measures and value-added measures determined by expert panels
Includes Performance Zone (P-Zone) graphs, where feasible
Lists all measures; type of measure; reportability
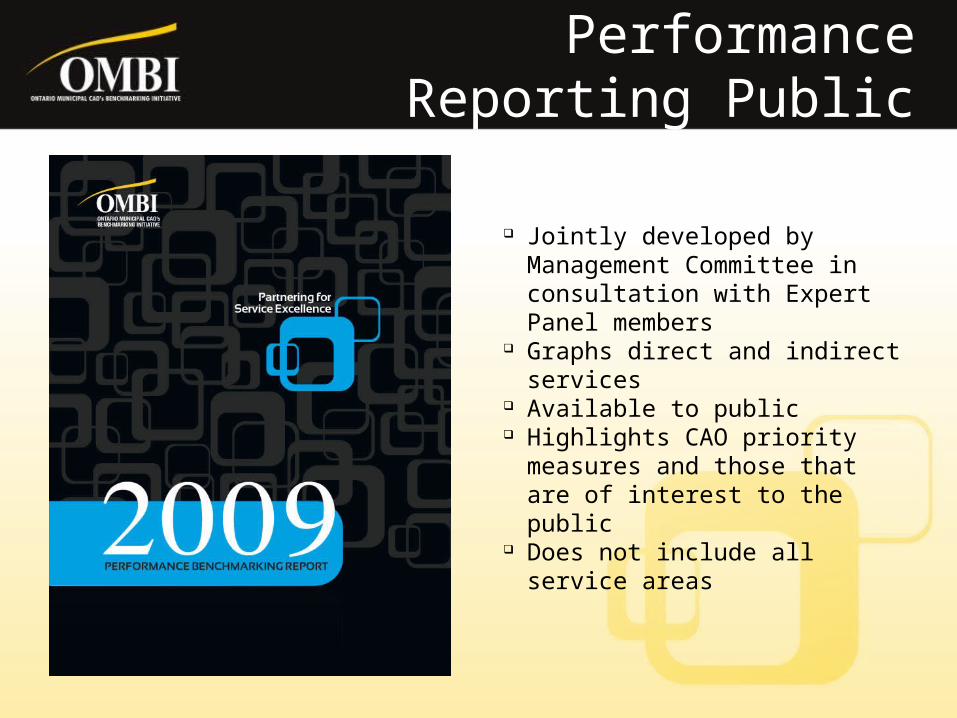
Jointly developed by Management Committee in consultation with Expert Panel members
Graphs direct and indirect services
Available to public Highlights CAO priority
measures and those that are of interest to the public
Does not include all service areas
Performance Reporting Public Report
Additional Information
Program Manager Connie Wheeler
905-540-5779
OMBI CAO Liaison Bruce Macgregor
CAO, York Region


