Download - OVERCOMING CONTEMPORARY OBSTACLES IN DRUG …
University of Rhode Island University of Rhode Island
DigitalCommons@URI DigitalCommons@URI
Open Access Dissertations
2019
OVERCOMING CONTEMPORARY OBSTACLES IN DRUG DELIVERY OVERCOMING CONTEMPORARY OBSTACLES IN DRUG DELIVERY
VIA ACETALATED DEXTRAN PARTICLE FORMULATIONS VIA ACETALATED DEXTRAN PARTICLE FORMULATIONS
Nishan K. Shah University of Rhode Island, [email protected]
Follow this and additional works at: https://digitalcommons.uri.edu/oa_diss
Recommended Citation Recommended Citation Shah, Nishan K., "OVERCOMING CONTEMPORARY OBSTACLES IN DRUG DELIVERY VIA ACETALATED DEXTRAN PARTICLE FORMULATIONS" (2019). Open Access Dissertations. Paper 834. https://digitalcommons.uri.edu/oa_diss/834
This Dissertation is brought to you for free and open access by DigitalCommons@URI. It has been accepted for inclusion in Open Access Dissertations by an authorized administrator of DigitalCommons@URI. For more information, please contact [email protected].
OVERCOMING CONTEMPORARY OBSTACLES IN DRUG DELIVERY VIA
ACETALATED DEXTRAN PARTICLE FORMULATIONS
BY
NISHAN KALPESH SHAH
A DISSERTATION SUBMITTED IN PARTIAL FULFILLMENT OF THE
REQUIREMENTS FOR THE DEGREE OF
DOCTOR OF PHILOSOPHY
IN
PHARMACEUTICAL SCIENCES
UNIVERSITY OF RHODE ISLAND
2019
DOCTOR OF PHILOSOPHY DISSERTATION
OF
NISHAN KALPESH SHAH
APPROVED:
Dissertation Committee:
Major Professor Samantha A. Meenach
Jie Shen
Michael Greenfield
Nasser H. Zawia
DEAN OF THE GRADUATE SCHOOL
UNIVERSITY OF RHODE ISLAND
2019
ABSTRACT
Particle-based delivery systems have been investigated for their potential to
increase the efficacy of patient diagnoses and treatments. In many cases, these systems
increase the bioavailability and/or decrease the toxicity of clinically relevant drugs.
These developments have led to improvements in patient compliance, morbidity,
mortality, and quality of life. To date, particle-based delivery systems have been
evaluated in hundreds of clinical trials around the world. Unlike conventional delivery
systems, particle-based delivery systems offer increased surface area, colloidal
stability, and system tunability, all of which can be tailored to target the disease state
of interest and specific patient population.
Although there are examples of successful particle-based drug products, there are
numerous obstacles that consistently shunt the ability for these systems to be
translated from benchside to bedside. Two consistent obstacles are drug toxicity and
scale-up manufacturing. Drug toxicity is largely caused by inefficient targeting,
inopportune routes of administration (i.e. oral delivery for a pulmonary disease), and
unfavorable release mechanisms. Scale-up manufacturing is a continual industrial
interest, given that particle-based drug products are increasing in popularity, however
scale-up procedures are still in development and face their own challenges. A potential
method to overcome the obstacles faced in drug delivery is the development of new
polymers, either by synthesis of novel entities or derivatization of current ones. To
ensure biocompatibility, the latter is a common practice. Biopolymers such as
chitosan, hyaluronic acid, poly(lactic-co-glycolic acid) (PLGA), and naturally
occurring polysaccharides undergo modifications to achieve desirable characteristics
for drug delivery. Acetalated dextran (Ac-Dex) is a synthetic biopolymer derived from
dextran, a naturally produced hydrophilic polysaccharide. Following a one-step
reaction, the hydroxyl moieties of dextran are converted to acetal groups, transitioning
the biopolymer from hydrophilic to lipophilic solubility. Hydroxyl moieties still
present on the backbone can provide a handle for ligand attachment to actively target
specific sites of the body. Additionally, controlling the reaction time and altering the
molecular weight of the dextran backbone can alter the degradation kinetics, providing
flexibility to achieve desirable release kinetics for a therapeutic of interest. Overall,
Ac-Dex demonstrates cost-effective and efficient synthesis, easy tunability for
targeting, and flexibility in controlling release kinetics, all of which propitiate its
promise as a drug carrier.
The purpose of this dissertation was to utilize the advantages of Ac-Dex to
investigate its potential as a drug carrier to overcome challenges that exist in the field
of drug delivery. Manuscript 1 focuses on decreasing drug toxicity using active
targeting. Here, Ac-Dex nanoparticles (NP) were synthesized and coated with
phosphatidylserine to instigate macrophage uptake for the potential to treat diseases
that use these cells as reservoirs, such as tuberculosis and HIV. Manuscript 2 focuses
on the synthesis of Ac-Dex microparticles (MP), followed by an exploration of their
ability to modulate the release of water-soluble cargo. Ac-Dex MP were synthesized
via spray drying and were loaded with a water-soluble dye. Following the synthesis,
MP were evaluated for their characteristics and drug release behaviors in multiple pH
environments. Manuscript 3 uses Ac-Dex as an economical model drug carrier and
focused on studying the effects of tangential flow filtration (TFF) parameters (factors)
on the characteristics of NP (responses) to explore its promise as a scale-up
purification technique. The final manuscript focuses on the physical characterization
and development of nanocomposite microparticle system for localized delivery of the
small molecule Eact, a potential therapeutic for pulmonary arterial hypertension.
Previously published reports show that Ac-Dex demonstrates significant promise
as a versatile, cost-and time-effective, and promising drug carrier for a range of
applications and disease states. The manuscripts in this dissertation all explore
uncharted territories of Ac-Dex’s potential, further demonstrating its versatility and
promise to overcome current drug delivery obstacles.
ACKNOWLEDGMENTS
From the bottom of my heart, I would like to thank my loving parents, Jeanette
and Kalpesh Shah. The sacrifices that you both have made to provide for both
Karishma and I is unmatched. Your continual love and support, even on the worst
days, have helped me grow to become the man I am today. I love you both dearly.
To my sister Karishma, my brother-in-law Bobby, my nephew Aditya, and my
niece Priyanka, thank you for the love and the laughs we have shared. I cannot
imagine what my life would be like without you all. Karishma, you are my best friend
and I am the luckiest brother. Bobby, you are the big brother I have always wanted
and needed. Aditya and Priyanka, Uncle Nishan loves you both very much. You are
both a continual inspiration to me and are a constant reminder of why I do what I do.
Thank you Dr. Meenach, for your guidance, support, and insight for both my
graduate studies and my everyday life. I am so grateful for you allowing me to join
your group halfway through my first year of school. Since then, I have learned how to
become an independent thinker, scientist, and person. Thank you to my other
committee members, Drs. Shen, Greenfield, and Roxbury for not only your
contributions to my dissertation, but also to my growth as a scientist.
Thank you to my lab mates Sweta, Zimeng, Jakaria, Ryan, Elisa, and Andrew for
your support, and your help with lab work and life obstacles. To my friends Adam,
Chrissy, Riley, Meg, Ben, Shelby, Gina, Ken, Nick, Meiwen, Millea, and everyone
else, thank you for being my friends and providing me with the support system I
needed to get through the obstacles of my research and my life. You all have taught
me that, just like life itself, graduate school is a team sport, and you cannot do it alone.
vii
As a graduate student, I was blessed with the opportunity of being a teaching
assistant for 4 years, for both PharmD and BSPS students. To all the students that I
interacted with and taught, thank you all for teaching me things about myself, and for
making me a better and more confident teacher. I am blessed to have not only learned
all your names and personalities, but also to have gotten a chance to see you all grow
into scientists, scholars, and clinical professionals. I know that wherever you all go,
you will do great things in your careers. A special thank you to Drs. Allababidi, Lu,
Chen, and Morisseau for giving me the opportunity to teach alongside them.
Finally, I would like to thank my martial arts instructor, David Ahrens. I joined
your school 18 years ago as a shy 9-year-old hiding behind the leg of his mom before
his first class. Since then, with your guidance, support, love, and mentorship, you were
able to help mold me into what I am today as a teacher, martial artist, scientist, critical
thinker, and person. No matter where I will go, I know that I will always be part of the
East Coast Karate family, and I will always have a home there. I will forever be
grateful for what you and everyone else at East Coast Karate have done for me.
viii
PREFACE
This dissertation has been written in manuscript style format. Chapter 1 is an
introduction to the dissertation. Chapter 2 entitled “Particle technology and routes of
administration: parenteral and pulmonary delivery” is an in-depth introduction to both
parenteral and pulmonary administration routes for particle technology, both of which
are partially adopted from Chapter 6 of the book “Nanoparticles for Biomedical
Applications.” Chapter 3 entitled “Enhancement of Macrophage Uptake via
Phosphatidylserine-Coated Acetalated Dextran Nanoparticles” was accepted to Journal
of Drug Delivery Science and Technology in January 2019. Chapter 4, entitled
“Sustained Release of Water-Soluble Therapeutics via Dry Powder Aerosol Acetalated
Dextran Microparticles” was submitted to Drug Development and Industrial Pharmacy
in April 2019. Chapter 5, entitled “Comparison of Nanoparticle Purification Process
via Centrifugation and Tangential Flow Filtration: A Case Study of Acetalated
Dextran Nanoparticles” was submitted to Particuology in April 2019. Chapter 6
entitled “Physical Characterization and Formulation Development of Eact for the
Treatment of Pulmonary Arterial Hypertension” shows preliminary data pertaining to
the project. Chapter 7 includes conclusions and future work related to this dissertation.
ix
TABLE OF CONTENTS
ABSTRACT ................................................................................................................. iii
ACKNOWLEDGMENTS .......................................................................................... vi
PREFACE .................................................................................................................. viii
TABLE OF CONTENTS ............................................................................................ ix
CHAPTER 1 INTRODUCTION ................................................................................ 1
1.1 Motivation ................................................................................................................ 1
1.2 Significance of This Work ....................................................................................... 7
1.3 Objectives of the Research ....................................................................................... 8
1.4 Organization of Dissertation .................................................................................. 10
CHAPTER 2 PARTICLE TECHNOLOGY AND ROUTES OF
ADMINISTRATION: PARENTERAL AND PULMONARY DELIVERY .. 12
2.1 Particle Technology ............................................................................................... 13
2.2 Parenteral Delivery................................................................................................. 15
2.2.1 Intravenous Delivery.................................................................................... 16
2.2.3 Intraperitoneal Delivery ............................................................................... 20
2.2.4 Intramuscular Delivery ................................................................................ 22
2.2.5 Subcutaneous Delivery ................................................................................ 24
2.3 Pulmonary Delivery ............................................................................................... 26
2.3.1 Delivery Devices.......................................................................................... 27
2.3.2 Particle Fate ................................................................................................. 28
2.3.3 Advantages and Applications ...................................................................... 30
2.3.4 Challenges .................................................................................................... 31
2.3.5 Future Opportunities .................................................................................... 32
CHAPTER 3 ENHANCEMENT OF MACROPHAGE UPTAKE VIA
PHOSPHATIDYLSERINE-COATED ACETALATED DEXTRAN
NANOPARTICLES ................................................................................................... 34
3.1 Abstract .................................................................................................................. 35
3.2 Keywords ............................................................................................................... 36
3.3 Abbreviations ......................................................................................................... 36
3.4 Introduction ............................................................................................................ 37
3.5 Materials and Methods ........................................................................................... 39
3.5.1 Materials ...................................................................................................... 39
3.5.2 Synthesis and Characterization of Acetalated Dextran ................................ 40
3.5.3 Synthesis of PVA-Coated Nanoparticles ..................................................... 40
3.5.4 Synthesis of DPPS and DPPC-Coated Ac-Dex NP ..................................... 41
3.5.5 Nanoparticle Size and Surface Charge Characterization ............................. 41
x
3.5.6 Evaluation of CUR NP Encapsulation Efficiency and Drug Loading ......... 42
3.5.7 Electron Microscopy Imaging Analysis of Nanoparticles ........................... 42
3.5.8 Differential Scanning Calorimetry (DSC) Analysis of Nanoparticles......... 43
3.5.9 PVA Coating Quantification ........................................................................ 43
3.5.10 Phospholipid Content Quantification......................................................... 44
3.5.11 In Vitro Drug Release from CUR NP ........................................................ 44
3.5.12 Cell Culture ................................................................................................ 45
3.5.13 In Vitro Cytotoxicity Analysis of NP ........................................................ 45
3.5.14 Nitrite Analysis .......................................................................................... 46
3.5.15 In Vitro Cellular Uptake Via Spectroscopy and Confocal Microscopy .... 46
3.5.16 Statistical Analysis ..................................................................................... 47
3.6 Results .................................................................................................................... 47
3.6.1 Characterization of Ac-Dex Polymer and Nanoparticles ............................ 47
3.6.2 Morphological Analysis of NP Via Electron Microscopy ........................... 49
3.6.3 Coating Quantification ................................................................................. 50
3.6.4 Differential Scanning Calorimetry (DSC) Thermal Analysis...................... 50
3.6.5 In Vitro Drug Release from NP ................................................................... 53
3.6.6 In Vitro Cytotoxicity Assay ......................................................................... 54
3.6.7 Nitrite Analysis ............................................................................................ 55
3.6.8 In Vitro Cellular Uptake .............................................................................. 56
3.7 Discussion .............................................................................................................. 58
3.7.1 Nanoparticle Design and Analysis ............................................................... 58
3.7.2 Coating Quantification ................................................................................. 60
3.7.3 Thermal Analysis of Nanoparticle Formulations......................................... 60
3.7.4 Curcumin Release from Nanoparticles ........................................................ 62
3.7.5 Cytotoxic Analysis and Macrophage Uptake of Nanoparticles ................... 62
3.8 Conclusions ........................................................................................................ 65
CHAPTER 4 SUSTAINED RELEASE OF WATER-SOLUBLE
THERAPEUTICS VIA DRY POWDER AEROSOL ACETALATED
DEXTRAN MICROPARTICLES ...................................................................... 67
4.1 Abstract .................................................................................................................. 68
4.4 Introduction ............................................................................................................ 69
4.5 Materials and Methods ........................................................................................... 71
4.5.1 Materials ........................................................................................................ 71
4.5.2 Synthesis and characterization of acetalated dextran .................................... 72
4.5.3 Microparticle synthesis via spray drying ...................................................... 72
4.5.4 Morphology, size, and tapped density analysis ............................................. 74
xi
4.5.5 In vitro aerosol performance ......................................................................... 75
4.5.6 Crystallinity and phase transition analysis .................................................... 76
4.5.7 Analysis of water content via Karl Fischer titration ..................................... 77
4.5.8 Encapsulation efficiency and drug loading analysis ..................................... 77
4.5.9 Drug release and release kinetic analysis ...................................................... 77
4.5.10 Cell Culture ................................................................................................. 78
4.5.11 Cellular uptake ............................................................................................ 79
4.5.12 In vitro cytotoxicity assay ........................................................................... 79
4.5.13 In vitro transepithelial electrical resistance of lung epithelial cells exposed
to MP ...................................................................................................................... 80
4.5.14 Statistical analysis ....................................................................................... 81
4.6 Results .................................................................................................................... 81
4.6.1 Confirmation of acetalated dextran (Ac-Dex) synthesis and microparticle
morphology ............................................................................................................ 81
4.6.2 Size analysis and in vitro aerosol performance ............................................. 82
4.6.3 Solid state analysis ........................................................................................ 85
4.6.4 Drug loading, in vitro drug release, and release kinetic analysis .................. 87
4.7 Discussion .............................................................................................................. 93
4.8 Conclusions ............................................................................................................ 97
CHAPTER 5 COMPARISON OF NANOPARTICLE PURIFICATION
PROCESS VIA CENTRIFUGATION AND TANGENTIAL FLOW
FILTRATION: A CASE STUDY ON ACETALATED DEXTRA
NANOPARTICLES ............................................................................................. 99
5.1 Abstract ................................................................................................................ 100
5.2 Keywords ............................................................................................................. 100
5.3 Abbreviations ....................................................................................................... 101
5.4 Introduction .......................................................................................................... 101
5.5 Experimental Methods ......................................................................................... 103
5.5.1 Materials .................................................................................................... 103
5.5.2 Design of experiment study ....................................................................... 104
5.5.3 Comparison of the purification processes .................................................. 107
5.5.4 Statistical analysis ...................................................................................... 109
5.6 Results .................................................................................................................. 109
5.6.1 Design of experiment results for PTX-loaded Ac-Dex NP (PTX-NP) ...... 109
5.6.2 Comparison of purification processes........................................................ 113
5.7 Discussion ............................................................................................................ 117
5.8 Conclusions .......................................................................................................... 121
CHAPTER 6 PHYSICAL CHARACTERIZATION AND FORMULATION
DEVELOPMENT OF Eact FOR THE TREATMENT OF PULMONARY
ARTERIAL HYPERTENSION ........................................................................ 122
6.1 Abstract ................................................................................................................ 123
xii
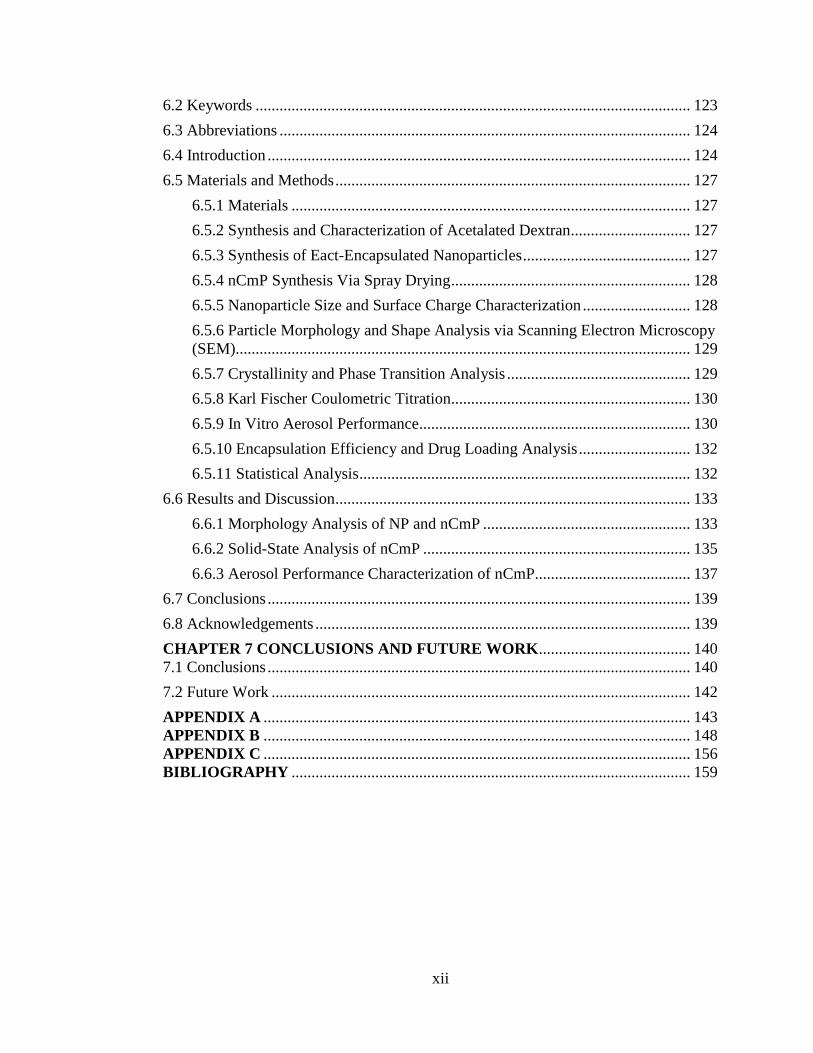
6.2 Keywords ............................................................................................................. 123
6.3 Abbreviations ....................................................................................................... 124
6.4 Introduction .......................................................................................................... 124
6.5 Materials and Methods ......................................................................................... 127
6.5.1 Materials .................................................................................................... 127
6.5.2 Synthesis and Characterization of Acetalated Dextran .............................. 127
6.5.3 Synthesis of Eact-Encapsulated Nanoparticles .......................................... 127
6.5.4 nCmP Synthesis Via Spray Drying ............................................................ 128
6.5.5 Nanoparticle Size and Surface Charge Characterization ........................... 128
6.5.6 Particle Morphology and Shape Analysis via Scanning Electron Microscopy
(SEM).................................................................................................................. 129
6.5.7 Crystallinity and Phase Transition Analysis .............................................. 129
6.5.8 Karl Fischer Coulometric Titration............................................................ 130
6.5.9 In Vitro Aerosol Performance.................................................................... 130
6.5.10 Encapsulation Efficiency and Drug Loading Analysis ............................ 132
6.5.11 Statistical Analysis ................................................................................... 132
6.6 Results and Discussion ......................................................................................... 133
6.6.1 Morphology Analysis of NP and nCmP .................................................... 133
6.6.2 Solid-State Analysis of nCmP ................................................................... 135
6.6.3 Aerosol Performance Characterization of nCmP....................................... 137
6.7 Conclusions .......................................................................................................... 139
6.8 Acknowledgements .............................................................................................. 139
CHAPTER 7 CONCLUSIONS AND FUTURE WORK ...................................... 140
7.1 Conclusions .......................................................................................................... 140
7.2 Future Work ......................................................................................................... 142
APPENDIX A ........................................................................................................... 143
APPENDIX B ........................................................................................................... 148
APPENDIX C ........................................................................................................... 156
BIBLIOGRAPHY .................................................................................................... 159
xiii
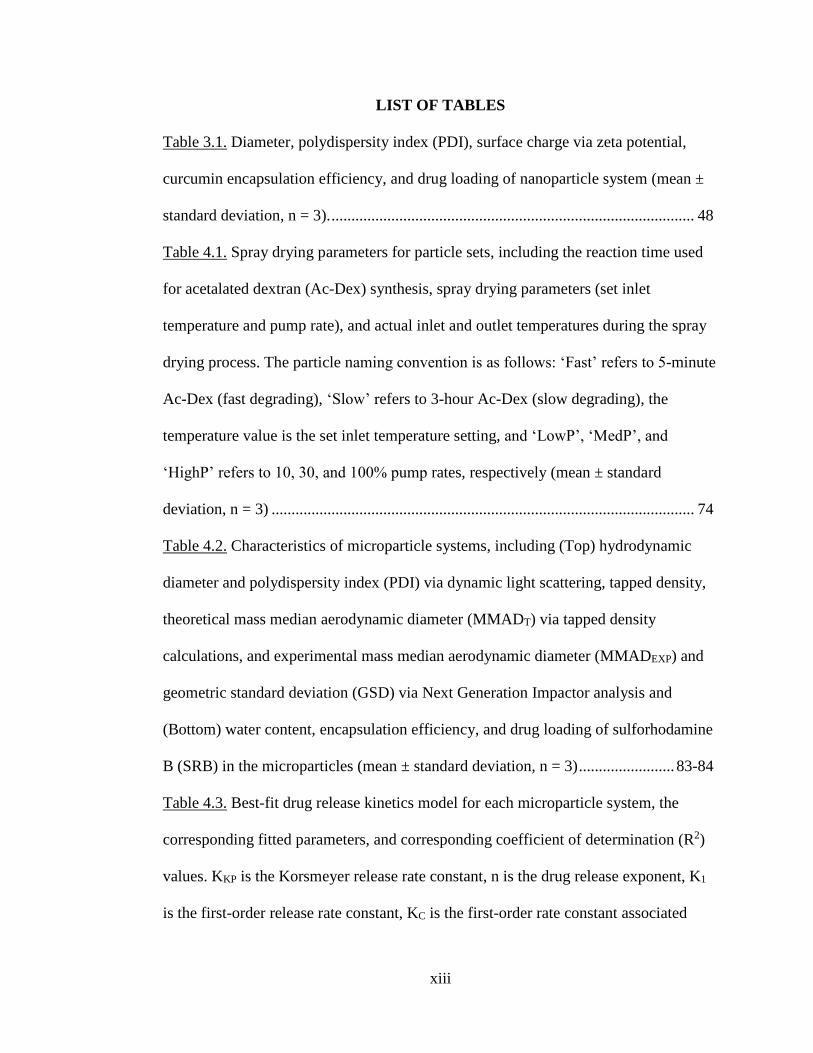
LIST OF TABLES
Table 3.1. Diameter, polydispersity index (PDI), surface charge via zeta potential,
curcumin encapsulation efficiency, and drug loading of nanoparticle system (mean ±
standard deviation, n = 3). ........................................................................................... 48
Table 4.1. Spray drying parameters for particle sets, including the reaction time used
for acetalated dextran (Ac-Dex) synthesis, spray drying parameters (set inlet
temperature and pump rate), and actual inlet and outlet temperatures during the spray
drying process. The particle naming convention is as follows: ‘Fast’ refers to 5-minute
Ac-Dex (fast degrading), ‘Slow’ refers to 3-hour Ac-Dex (slow degrading), the
temperature value is the set inlet temperature setting, and ‘LowP’, ‘MedP’, and
‘HighP’ refers to 10, 30, and 100% pump rates, respectively (mean ± standard
deviation, n = 3) .......................................................................................................... 74
Table 4.2. Characteristics of microparticle systems, including (Top) hydrodynamic
diameter and polydispersity index (PDI) via dynamic light scattering, tapped density,
theoretical mass median aerodynamic diameter (MMADT) via tapped density
calculations, and experimental mass median aerodynamic diameter (MMADEXP) and
geometric standard deviation (GSD) via Next Generation Impactor analysis and
(Bottom) water content, encapsulation efficiency, and drug loading of sulforhodamine
B (SRB) in the microparticles (mean ± standard deviation, n = 3) ........................ 83-84
Table 4.3. Best-fit drug release kinetics model for each microparticle system, the
corresponding fitted parameters, and corresponding coefficient of determination (R2)
values. KKP is the Korsmeyer release rate constant, n is the drug release exponent, K1
is the first-order release rate constant, KC is the first-order rate constant associated
xiv
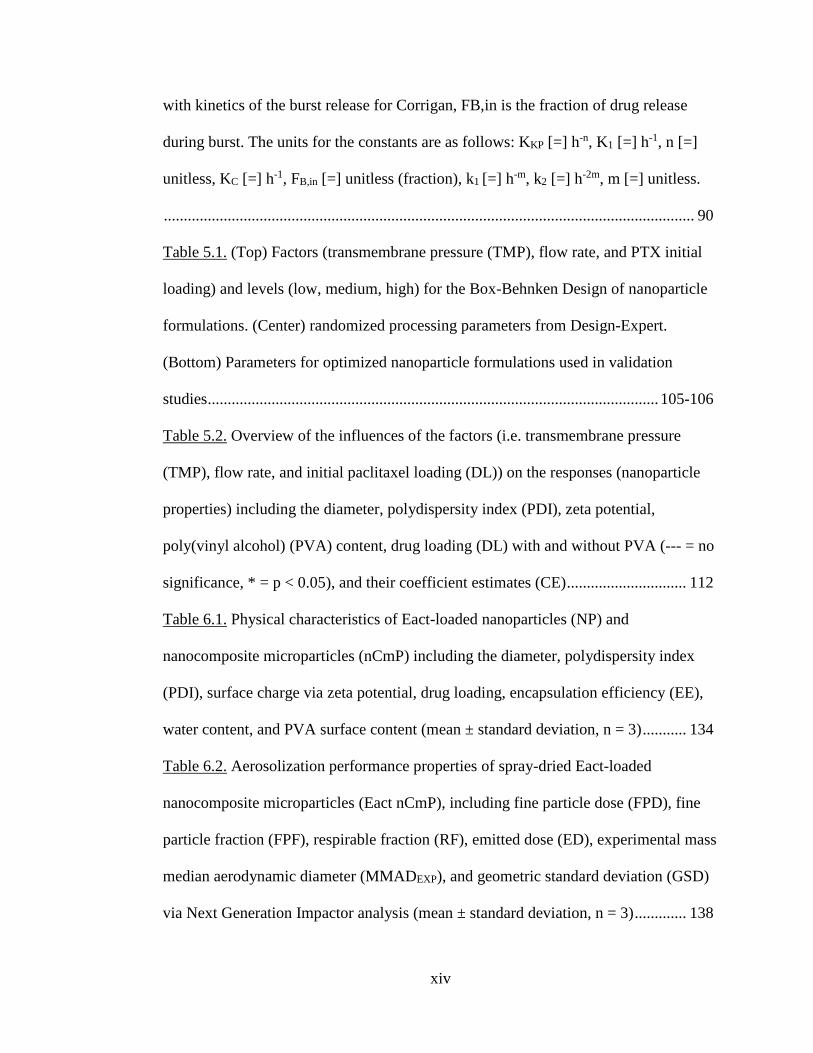
with kinetics of the burst release for Corrigan, FB,in is the fraction of drug release
during burst. The units for the constants are as follows: KKP [=] h-n, K1 [=] h-1, n [=]
unitless, KC [=] h-1, FB,in [=] unitless (fraction), k1 [=] h-m, k2 [=] h-2m, m [=] unitless.
..................................................................................................................................... 90
Table 5.1. (Top) Factors (transmembrane pressure (TMP), flow rate, and PTX initial
loading) and levels (low, medium, high) for the Box-Behnken Design of nanoparticle
formulations. (Center) randomized processing parameters from Design-Expert.
(Bottom) Parameters for optimized nanoparticle formulations used in validation
studies ................................................................................................................. 105-106
Table 5.2. Overview of the influences of the factors (i.e. transmembrane pressure
(TMP), flow rate, and initial paclitaxel loading (DL)) on the responses (nanoparticle
properties) including the diameter, polydispersity index (PDI), zeta potential,
poly(vinyl alcohol) (PVA) content, drug loading (DL) with and without PVA (--- = no
significance, * = p < 0.05), and their coefficient estimates (CE) .............................. 112
Table 6.1. Physical characteristics of Eact-loaded nanoparticles (NP) and
nanocomposite microparticles (nCmP) including the diameter, polydispersity index
(PDI), surface charge via zeta potential, drug loading, encapsulation efficiency (EE),
water content, and PVA surface content (mean ± standard deviation, n = 3) ........... 134
Table 6.2. Aerosolization performance properties of spray-dried Eact-loaded
nanocomposite microparticles (Eact nCmP), including fine particle dose (FPD), fine
particle fraction (FPF), respirable fraction (RF), emitted dose (ED), experimental mass
median aerodynamic diameter (MMADEXP), and geometric standard deviation (GSD)
via Next Generation Impactor analysis (mean ± standard deviation, n = 3) ............. 138
xv
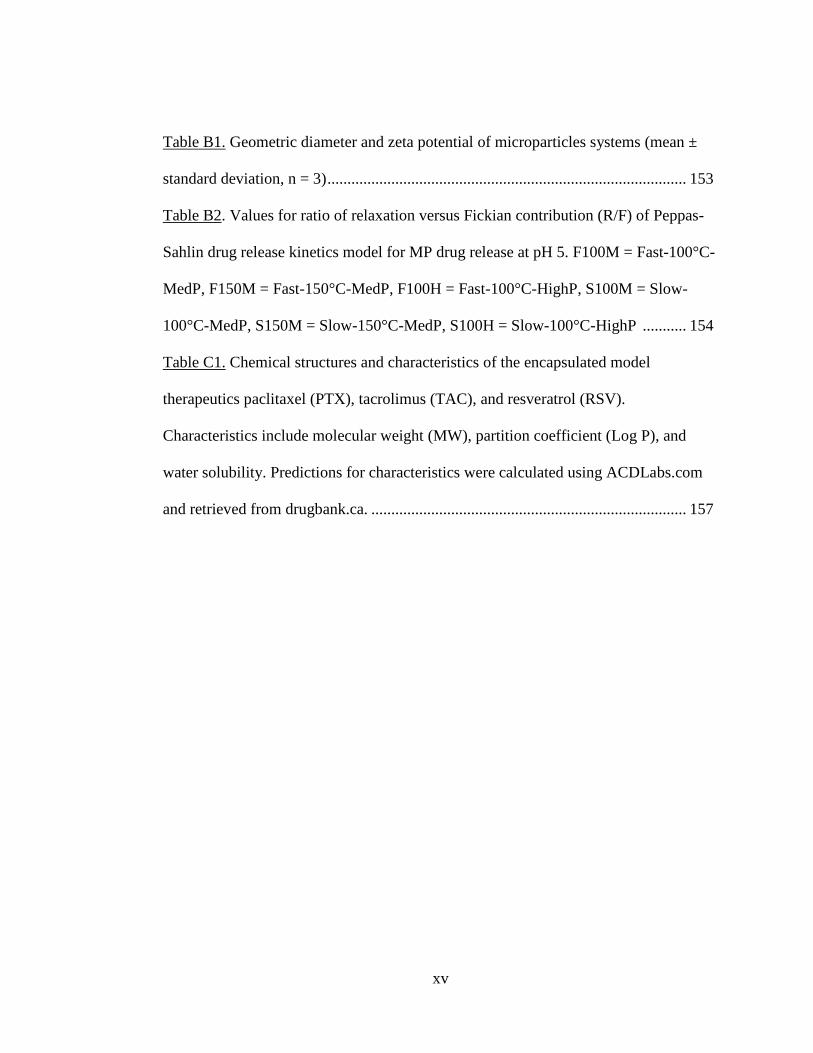
Table B1. Geometric diameter and zeta potential of microparticles systems (mean ±
standard deviation, n = 3) .......................................................................................... 153
Table B2. Values for ratio of relaxation versus Fickian contribution (R/F) of Peppas-
Sahlin drug release kinetics model for MP drug release at pH 5. F100M = Fast-100°C-
MedP, F150M = Fast-150°C-MedP, F100H = Fast-100°C-HighP, S100M = Slow-
100°C-MedP, S150M = Slow-150°C-MedP, S100H = Slow-100°C-HighP ........... 154
Table C1. Chemical structures and characteristics of the encapsulated model
therapeutics paclitaxel (PTX), tacrolimus (TAC), and resveratrol (RSV).
Characteristics include molecular weight (MW), partition coefficient (Log P), and
water solubility. Predictions for characteristics were calculated using ACDLabs.com
and retrieved from drugbank.ca. ............................................................................... 157
xvi
LIST OF FIGURES
Figure 1.1 Schematic representation of (a) dead end filtration (i.e. centrifugation) and
(b) tangential flow filtration for separation of particulates ........................................... 3
Figure 1.2 Reaction Schematic of Acetalated Dextran ................................................. 5
Figure 1.3 Drug delivery technologies manufactured using Ac-Dex ........................... 6
Figure 2.1 (A) Routes and delivery locations for parenteral delivery of therapeutics or
nanocarriers, including intramuscular, subcutaneous, intravenous, and intradermal
delivery methods. (B) Cellular and non-cellular pulmonary barriers for nanocarriers
including those present in the central lung/upper airways (bronchial) and
peripheral/lower airways (alveoli) .............................................................................. 16
Figure 3.1 Representative SEM (left) and TEM (middle, right) micrographs of PVA-
and DPPS-coated, CUR-loaded nanoparticles (PVA-CUR NP and PVA-DPPS NP,
respectively) ................................................................................................................ 49
Figure 3.2 Quantification of the amount of poly(vinyl alcohol) (PVA) and total
phospholipid in PVA-CUR, DPPC-CUR, and DPPS-CUR nanoparticles (NP) (* p <
0.05, **p < 0.01,***p < 0.001 in comparison to PVA-CUR NP) .............................. 50
Figure 3.3 Differential scanning calorimetry (DSC) thermograms of (A) formulated
nanoparticles and (B) the raw components that make up the nanoparticle systems in
their dry state, and (C) formulated nanoparticles in their wet state ............................ 52
Figure 3.4 Cumulative release of curcumin (CUR) from nanoparticle systems at pH 7
and pH 5 (*p < 0.05, **p < 0.01, ***p < 0.001, ns = non-significant) ....................... 54
Figure 3.5 Cytotoxicity analysis (relative viability) of nanoparticle systems on RAW
264.7 macrophages after 48 hours of exposure compared to control (*p < 0.05) ...... 55
xvii
Figure 3.6 Nitric oxide (NO) production from RAW 264.7 macrophages incubated for
48 hours with varying concentrations of nanoparticle formulations or LPS. No
statistical significance was observed between the groups and control group (no
treatment) and all were statistically lower than the LPS sample (p < 0.0001) ........... 56
Figure 3.7 (Left) Fluorescence spectroscopy analysis of nanoparticle uptake into cells
and (Right) representative confocal images of nanoparticle uptake by RAW 264.7
macrophages and A549 cells (scale bar = 10 μm) ...................................................... 57
Figure 4.1 Schematic of microparticle preparation including mixing of aqueous
solution containing sulforhodamine (SRB) and water and organic solution containing
acetalated dextran (Ac-Dex) and isopropyl alcohol (IPA) to form a water/organic
(W/O) solution prior to spray drying and microparticle formation............................. 73
Figure 4.2 Representative scanning electron microscopy micrographs of spray-dried
sulforhodamine B (SRB)-loaded microparticles. Images were taken at 10,000x. Scale
bar = 2µm .................................................................................................................... 82
Figure 4.3 (Top) Aerosol dispersion analysis of fast and slow degrading particles in
stages 1-7 of a Next Generation Impactor, expressed as percent particle deposition per
stage (mean ± standard deviation, n = 3). For Q = 60 L/min, cutoffs for each stage of
the NGI are: 8.06 µm (stage 1), 4.46 µm (stage 2), 2.82 µm (stage 3), 1.66 µm (stage
4), 0.94 µm (stage 5), 0.55 µm (stage 6) and 0.34 µm (stage 7). (Bottom)
Aerosolization performance properties of spray-dried particle systems, including fine
particle fraction (FPF), respirable fraction (RF), and emitted dose (ED) (mean ±
standard deviation, n = 3) ............................................................................................ 84
Figure 4.4 (A) Representative differential scanning calorimetry thermograms of raw
xviii
materials used during the spray drying of particles and of sulforhodamine B (SRB)-
loaded microparticles. (B) Representative x-ray diffractograms of raw materials used
during the spray drying of particles and of sulforhodamine B (SRB)-loaded
microparticles. (C) Polarized light microscopy images of microparticle systems and
raw materials. Crystals in microparticle systems are indicated by arrows, if applicable.
Scale bar = 0.1 mm ..................................................................................................... 86
Figure 4.5 Normalized percent weight release profiles of sulforhodamine-B (SRB)
microparticles at pH 5 and pH 7 as a function of time (mean ± standard deviation, n =
3). The insert for pH 7, fast degrading particles represents the zoomed in release for
mannitol microparticles ............................................................................................... 89
Figure 4.6 Results from experiments where cells were exposed to sulforhodamine B
(SRB)-loaded microparticles (MP), including (A) Transepithelial electrical resistance
(TEER) data for H441 cells exposed to microparticle systems from day -9 to day 5,
where day 0 was the particle exposure day. The particle naming convention
corresponds to the following: F100M = Fast-100°C-MedP, S100M = Slow-100°C-
MedP, F150M = Fast-150°C-MedP, S150M = Slow-150°C-MedP, F100H = Fast-
100°C-HighP, and S100H = Slow-100°C-HighP; (B) Viability of A549 cells exposed
to SRB MP (* p < 0.05, **p < 0.01, mean ± standard deviation, n = 3); and (C) SRB
MP uptake by A549, Calu-3, and H441 cell lines (* p < 0.05, **p < 0.01, ***p <
0.001, mean ± standard deviation, n = 3) .................................................................... 92
Figure 5.1 Schematic overview of the nanoparticle (NP) purification processes of
centrifugation and tangential flow filtration (TFF). For centrifugation, deionized (DI)
water was added to the NP suspension, following by centrifugation (Washing,
xix
Supernatant 1), this step was repeated (Washing, Supernatant 2), and the NP were
resuspended in 0.1% poly(vinyl alcohol) (PVA). For TFF, the NP suspension
underwent an initial filtration (Diafiltration, Step 1), then a concentration step
occurred following addition of 0.05% PVA to get 15 mL of concentration NP
(Concentration, Step 2), and finally the TFF membrane was cleaned to collect residual
residue (Membrane Cleaning, Step 3). ..................................................................... 108
Figure 5.2 Characteristics of paclitaxel loaded nanoparticles (PTX NP) (NP) purified
using TFF including Diameter and polydispersity index (PDI); Zeta potential;
Poly(vinyl alcohol) (PVA) content; Actual PTX loading (with and without PVA)
Mean ± standard deviation, n = 3 .............................................................................. 111
Figure 5.3 Data showing the effect of tangential flow filtration (TFF) process
parameters on nanoparticle (NP) characteristics. (Top Left) The effect of TFF flow
rate on nanoparticle polydispersion index (PDI). (Top Center) The effect of Initial
PTX loading on nanoparticles zeta potential. (Top Right) The effect of initial PTX
loading on actual PTX loading (with and without poly(vinyl alcohol), PVA). (Bottom)
Contour plots showing the effect of TFF flow rate and transmembrane pressure (TMP)
on NP diameter at different initial paclitaxel (PTX) loadings. Regions where
nanoparticles exhibited diameters of 150 nm or less on contour maps are indicated by
arrows. ....................................................................................................................... 113
Figure 5.4 Characteristics of paclitaxel (PTX), tacrolimus (TAC), and resveratrol
(RSV)-loaded nanoparticles (NP) before purification and after tangential flow
filtration (TFF) and centrifugation purification processes. *p < 0.05, **p < 0.01, ***p
< 0.001, and ****p < 0.0001. Mean ± standard deviation, n = 3. ........................... 115
xx
Figure 5.5 Representative scanning electron micrographs of paclitaxel nanoparticle
formulations purified via (Left) centrifugation and (Right) tangential flow filtration
(TFF). Particles are shown with (Top) poly(vinyl alcohol) (PVA) present and
(Bottom) in the absence of PVA. Scale bar = 500 nm .............................................. 116
Figure 5.6 Drug loading and poly(vinyl alcohol) (PVA) content of paclitaxel,
tacrolimus, and resveratrol-loaded nanoparticle (PTX-NP, TAC-NP, and RSV-NP,
respectively) suspensions taken during the centrifugation and tangential flow filtration
purification processes. *p < 0.05, **p < 0.01, ***p < 0.001, and ****p < 0.0001.
Mean ± standard deviation, n = 3. ............................................................................. 117
Figure 6.1 SEM micrographs of raw Eact, parent Eact nanoparticles (NP), Eact
nanocomposite microparticles (nCmP), and NP re-dispersed from nCmP ............... 134
Figure 6.2 (A) Representative x-ray diffractograms, (B) representative differential
scanning calorimetry thermograms and (C) polarized light microscopy images of raw
materials (3-hour Ac-Dex and Eact) and Eact-loaded nCmP. Scale bar = 0.1 mm .. 136
Figure 6.3 Aerosol dispersion analysis of Eact-loaded nanocomposite microparticles in
stages 1-7 of a Next Generation Impactor, expressed as percent particle deposition per
stage (mean ± standard deviation, n = 3). For Q = 60 L/min, cutoffs for each stage of
the NGI are: 8.06 µm (stage 1), 4.46 µm (stage 2), 2.82 µm (stage 3), 1.66 µm (stage
4), 0.94 µm (stage 5), 0.55 µm (stage 6) and 0.34 µm (stage 7) ............................... 138
Figure A1. Chemical Structures of DPPS (A), Ac-Dex (B), and Curcumin (C) ..... 144
Figure A2. NMR Spectra of Ac-Dex with normalization integrations relating to
associated peaks of methanol, acetone, and carbon ring of dextran ......................... 145
xxi
Figure A3. Wet state DSC of the nanoparticle systems ............................................ 146
Figure A4. Diameter (left) and zeta potential (right) of Blank-PVA nanoparticle (A),
Blank-DPPS nanoparticle (B), CUR-PVA nanoparticle (C), and CUR-DPPS
nanoparticle (D) systems ........................................................................................... 147
Figure B1. Total particle mass (mg) of aerosolization performance properties of
particles, including fine particle fraction (FPF), respirable fraction (RF), and emitted
dose (ED) (mean ± standard deviation, n = 3) .......................................................... 155
1
CHAPTER 1
INTRODUCTION
1.1 Motivation
Following the introduction of particle-based delivery systems, the field of drug
delivery has significantly improved the pharmacological and pharmacokinetic
outcomes of therapeutics by decreasing drug toxicity and increasing bioavailability (1,
2). Drug formulations that involve particle-based technology provide multiple
advantages over conventional dosage forms (2, 3). By using particle-based delivery
systems, drug formulations experience a decrease in overall size (several to 100’s of
microns to single microns or nanometer diameters), allowing for an increase in
surface-area-to-volume ratio, providing an increase in dispersion, absorption, and
overall bioavailability (4, 5). Utilizing particle size and composition, particle-based
delivery systems can passively target tissues using endogenous uptake phenomena (6).
For example, passive targeting has been shown to decrease drug toxicity, particularly
for cancer, through the use of enhanced permeability and retention (EPR) effect (7–
11). An example of this occurrence is the mechanistic enhanced uptake of Doxil®,
liposomal doxorubicin, into cancerous tissue (12, 13).
Although drug toxicity and bioavailability are major obstacles that need to be
overcome using particle-based delivery systems, the former is still a concern. Major
causes of drug toxicity relate to unwanted drug deposition, unfavorable release
kinetics/mechanisms, and less ideal routes of administration (i.e. oral delivery for
pulmonary disease states) (2, 14, 15). As a result, there has been a rise in the
2
development of novel strategies to increase the quality of drug delivery systems to
enhance the effectiveness of disease treatment while decreasing the likelihood of drug
toxicity (2). Strategies to improve particle-based technologies in this regard include i)
surface targeting mechanisms (peptides, small molecules, antibodies, etc.) (16–18)
(drug targeting); ii) external stimulation (radio frequency, ultrasound, ultraviolet light,
etc.), environmental stimulation (oxidation, pH, enzymatic processes, etc.) and the
development and utilization of novel polymers (19) (controlling release kinetics); and
iii) developing new strategies for delivery (routes of administration).
Another concern is related to production of particle technologies, particularly
nano-sized technologies. With the exceptional growth and promise of particle
technology, scale-up synthesis of these systems has been a manufacturing interest (20–
22). However, an often overseen yet vital aspect related to manufacturing is product
purification. Prior to packaging and usage, drug products must be purified, to ensure
the highest quality of the product (23). However, the purification of continuously
manufactured and scaled-up batches of particle technologies has reached an impasse
(24). Currently, the most often used purification method for particle technologies is
centrifugation. Although this method is widely used and is highly regarded as an
effective way to purify particle-based systems, there are major concerns with respect
to scalability (23). Additionally, certain effects, such as the gravitational forces used in
centrifuges, can have major impacts on the outcomes of NP characteristics (24). One
potential solution is the usage of tangential flow filtration (TFF), which has quickly
gained praise as a new method of scale-up purification for a variety of particle-based
technologies (25–34). Unlike centrifugation, TFF utilizes fluid dynamics to decrease
3
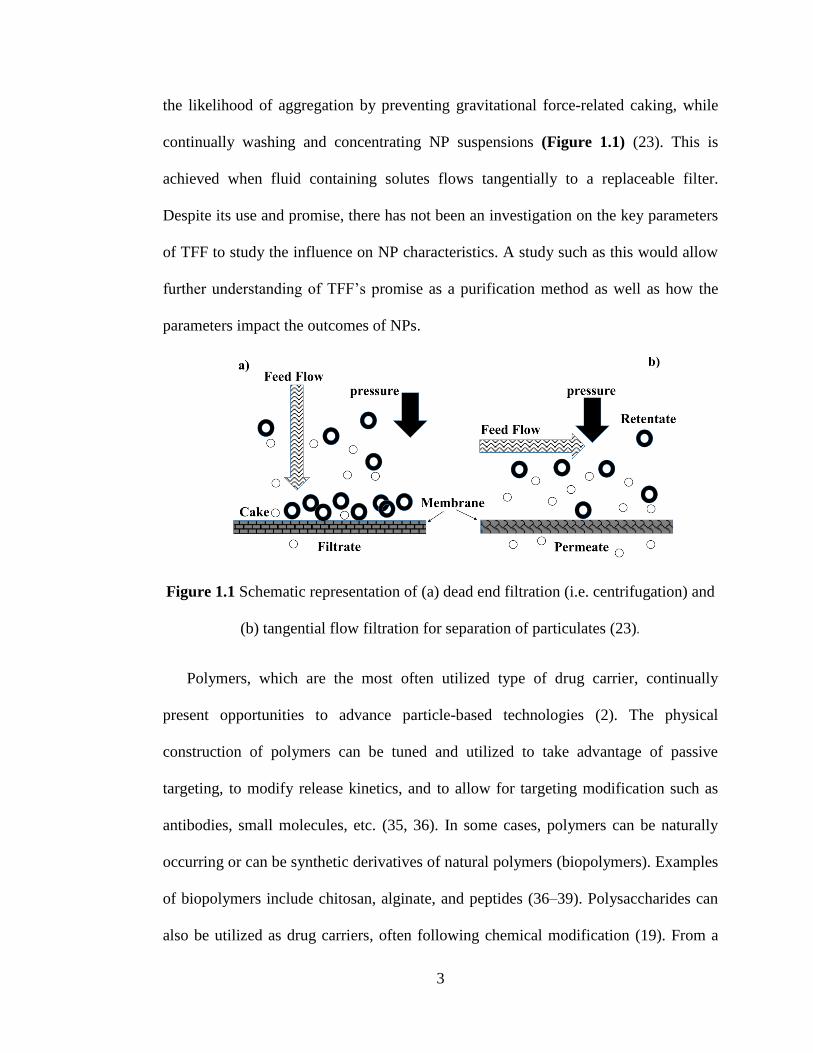
the likelihood of aggregation by preventing gravitational force-related caking, while
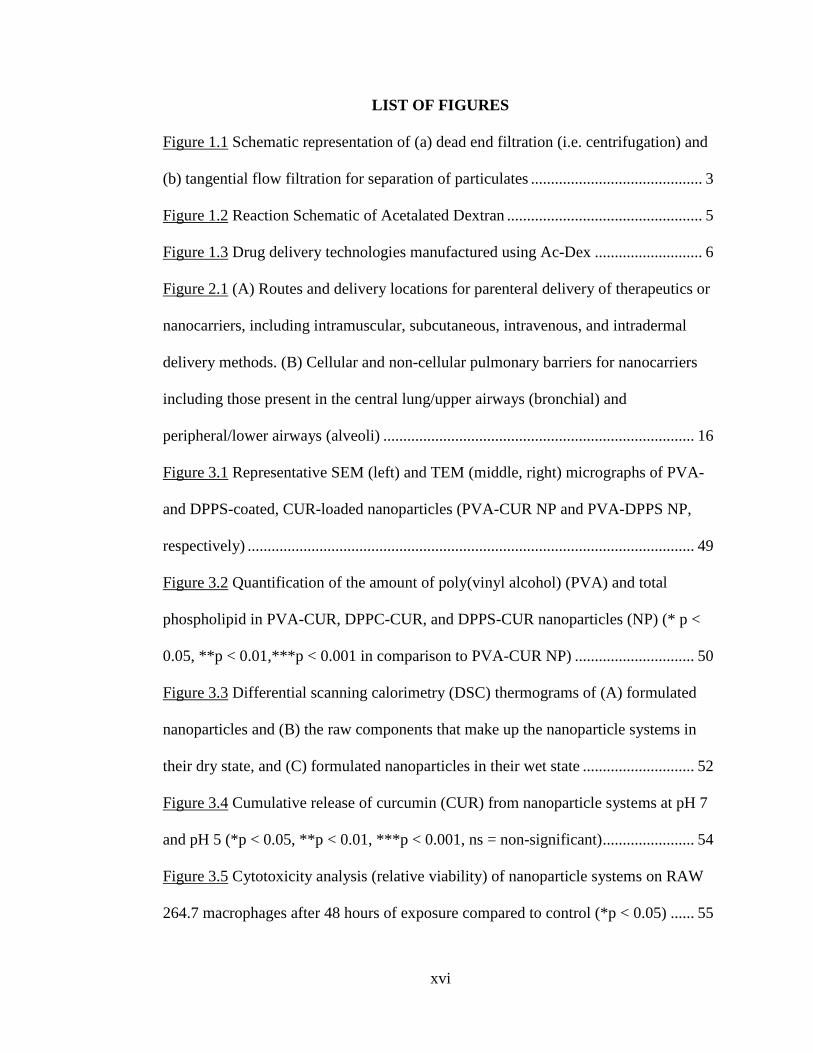
continually washing and concentrating NP suspensions (Figure 1.1) (23). This is
achieved when fluid containing solutes flows tangentially to a replaceable filter.
Despite its use and promise, there has not been an investigation on the key parameters
of TFF to study the influence on NP characteristics. A study such as this would allow
further understanding of TFF’s promise as a purification method as well as how the
parameters impact the outcomes of NPs.
Figure 1.1 Schematic representation of (a) dead end filtration (i.e. centrifugation) and
(b) tangential flow filtration for separation of particulates (23).
Polymers, which are the most often utilized type of drug carrier, continually
present opportunities to advance particle-based technologies (2). The physical
construction of polymers can be tuned and utilized to take advantage of passive
targeting, to modify release kinetics, and to allow for targeting modification such as
antibodies, small molecules, etc. (35, 36). In some cases, polymers can be naturally
occurring or can be synthetic derivatives of natural polymers (biopolymers). Examples
of biopolymers include chitosan, alginate, and peptides (36–39). Polysaccharides can
also be utilized as drug carriers, often following chemical modification (19). From a
4
product standpoint, the use of polymers allows for the stable and robust production of
drug carriers that can be tailored for both the patient population and the intended
disease state.
Acetalated dextran (Ac-Dex) is a synthetic derivative of dextran that was first
synthesized a decade ago for drug delivery applications (40). Dextran, a water-soluble
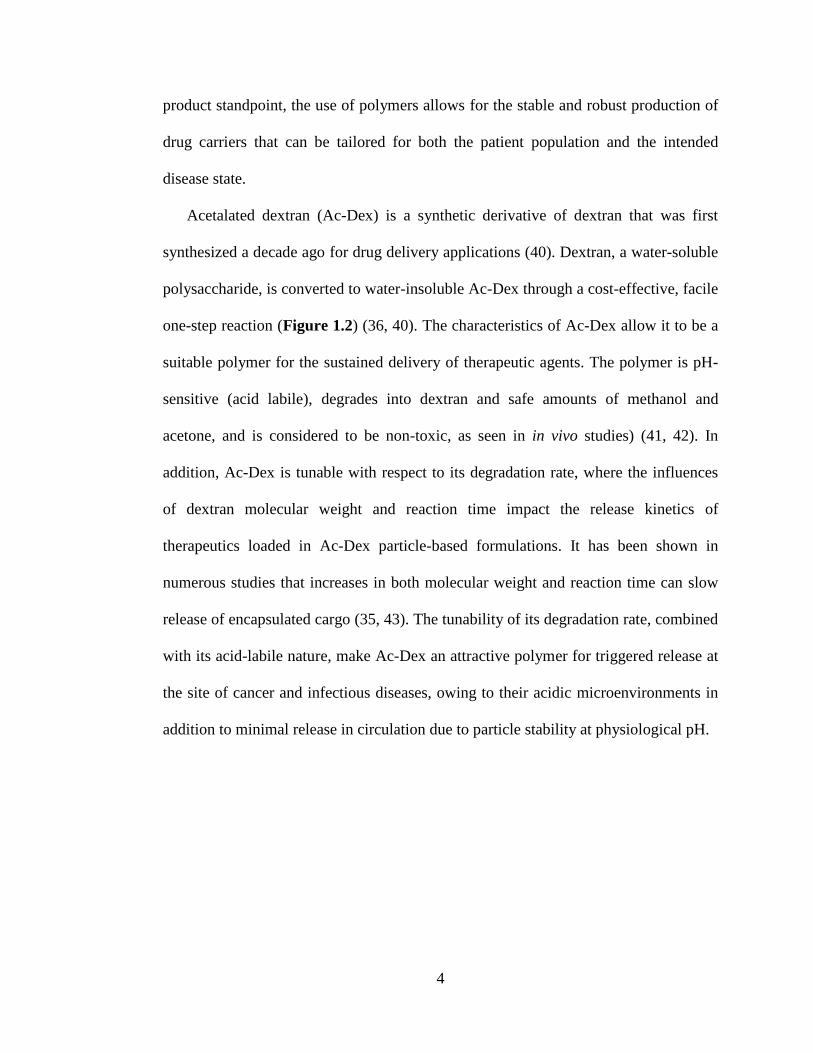
polysaccharide, is converted to water-insoluble Ac-Dex through a cost-effective, facile
one-step reaction (Figure 1.2) (36, 40). The characteristics of Ac-Dex allow it to be a
suitable polymer for the sustained delivery of therapeutic agents. The polymer is pH-
sensitive (acid labile), degrades into dextran and safe amounts of methanol and
acetone, and is considered to be non-toxic, as seen in in vivo studies) (41, 42). In
addition, Ac-Dex is tunable with respect to its degradation rate, where the influences
of dextran molecular weight and reaction time impact the release kinetics of
therapeutics loaded in Ac-Dex particle-based formulations. It has been shown in
numerous studies that increases in both molecular weight and reaction time can slow
release of encapsulated cargo (35, 43). The tunability of its degradation rate, combined
with its acid-labile nature, make Ac-Dex an attractive polymer for triggered release at
the site of cancer and infectious diseases, owing to their acidic microenvironments in
addition to minimal release in circulation due to particle stability at physiological pH.
5
Figure 1.2. Reaction schematic of acetalated dextran.
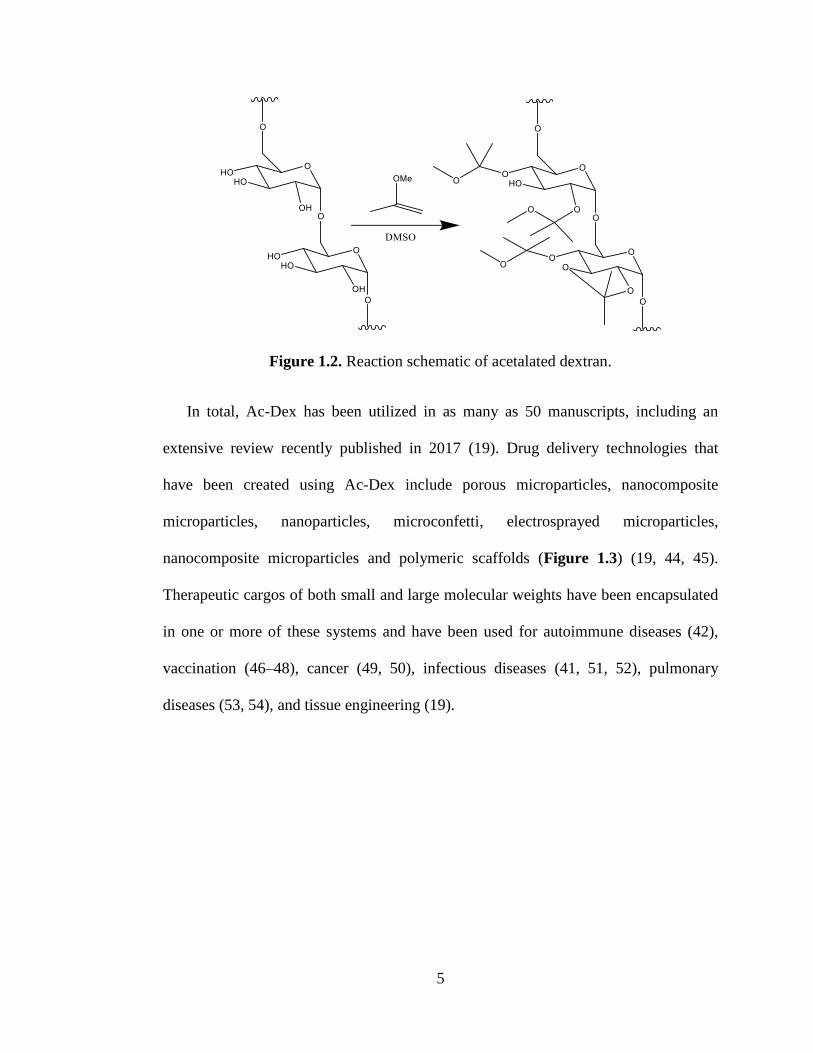
In total, Ac-Dex has been utilized in as many as 50 manuscripts, including an
extensive review recently published in 2017 (19). Drug delivery technologies that
have been created using Ac-Dex include porous microparticles, nanocomposite
microparticles, nanoparticles, microconfetti, electrosprayed microparticles,
nanocomposite microparticles and polymeric scaffolds (Figure 1.3) (19, 44, 45).
Therapeutic cargos of both small and large molecular weights have been encapsulated
in one or more of these systems and have been used for autoimmune diseases (42),
vaccination (46–48), cancer (49, 50), infectious diseases (41, 51, 52), pulmonary
diseases (53, 54), and tissue engineering (19).
6
Figure 1.3 Drug delivery technologies manufactured using Ac-Dex. Adopted from
(19).
Although Ac-Dex has shown promise as a versatile and cost-effective biopolymer,
there are still knowledge gaps that require exploration. In this dissertation, research
has been devoted to assessing the unexplored territories of Ac-Dex as a drug carrier to
combat current drug delivery obstacles. In Manuscript 1, Ac-Dex nanoparticles (NP)
were coated in phosphatidylserine (DPPS) to mimic apoptotic cells for active
macrophage targeting. Following the synthesis and characterization of the DPPS-
coated NP, phospholipid coverage was confirmed using TEM and the Stewart’s assay.
Finally, for biological confirmation, DPPS-coated NP were compared to DPPC/G-
coated NP and PVA-coated NP via their in vitro uptake into macrophages. In
Manuscript 2, multiple types of Ac-Dex microparticles (MP) synthesized via spray
drying were evaluated for their aerosol performance and were assessed for the release
kinetic behavior of a water-soluble dye. Manuscript 3 evaluates a broader obstacle in
particle technology. Using a design of experiment (DoE) approach, the effects of key
parameters of tangential flow filtration (TFF) on the characteristics of Ac-Dex NP
7
were studied to understand the promise of TFF as a scale-up purification technique.
The final manuscript evaluated the physical characteristics of Eact, followed by the
development of Ac-Dex nanocomposite microparticles (nCmPs), to achieve deep lung
deposition for the treatment of pulmonary arterial hypertension (PAH). In total, these
manuscripts were designed and carried out with the intention of continuing the
research devoted to Ac-Dex delivery formulations to provide further evidence that it is
an efficient, versatile biopolymer for a variety of drug delivery applications.
1.2 Significance of This Work
The manuscripts in this dissertation are centered around the continued exploration
of the biodegradable polymer Ac-Dex and its versatility as a drug carrier to overcome
obstacles in drug delivery. The significance of this research is listed below.
1. Ac-Dex nanoparticle systems can be tailored to actively target specific sites
for diseases that would otherwise difficult to treat.
2. Ac-Dex microparticle systems can be modified via facile tunability to
modulate the drug release kinetics of payloads that are difficult to control.
3. Ac-Dex nanoparticle systems can be purified using scale-up technology,
allowing for large-scale production and more favorable nanoparticle
characteristics, which can lead to increases in manufacturing efficiency.
8
1.3 Objectives of the Research
The overall objective of this dissertation was to develop and characterize Ac-Dex
particle-based technologies for drug delivery applications in order to explore and
identify specific challenges that Ac-Dex can overcome, as well as explore boarder
challenges for drug delivery to continue to show the versatility and promise of the
biopolymer. In this regard, each manuscript has its own specific objectives:
1. “Enhancement of Macrophage Uptake via Phosphatidylserine-Coated
Acetalated Dextran Nanoparticles”:
a. Prepare Ac-Dex nanoparticles (NP) loaded with a curcumin (CUR) for
ease of quantification.
b. Successfully coat Ac-Dex NP with phosphatidylserine (PS) and
characterize the systems for their size, homogeneity, surface charge,
and presence of coatings.
c. Evaluate the drug release profiles of CUR-loaded PS NP at neutral and
acidic pH.
d. Evaluate the in vitro phagocytotic uptake of Ac-Dex PS NP into RAW
264.7 murine macrophages.
2. “Sustained Release of Water-Soluble Therapeutics via Dry Powder Aerosol
Acetalated Dextran Microparticles”
9
a. Synthesize Ac-Dex microparticle (MP) systems encapsulating
sulforhodamine B via various spray-drying conditions and two types of
Ac-Dex (fast and slow degrading).
b. Evaluate the physical and aerosol characteristics of the MP
formulations.
c. Examine the drug release profiles, and model the release kinetics of MP
systems at neutral and acidic pH.
d. Examine biological interactions in vitro via cytotoxicity, uptake, and
transepithelial electrical resistance studies.
3. “Comparison of Nanoparticle Purification Process via Centrifugation and
Tangential Flow Filtration: A Case Study of Acetalated Dextran
Nanoparticles”
a. Utilize Design of Experiment to study key parameters of nanoparticles
(NP) with respect to tangential flow filtration (TFF) purification.
b. Compare properties of TFF-purified NP to centrifugation-purified NP.
c. Evaluate the variability in NP characteristics following purification by
TFF when varying small molecules are encapsulated in NP systems.
4. “Physical Characterization and Formulation Development of Eact for the
Treatment of Pulmonary Arterial Hypertension”
a. Physical characterization of Eact.
b. Synthesis and characterization of Eact-loaded nanoparticles.
10
c. Synthesis of Eact nCmP via spray drying, and evaluation of physical
characteristics and aerosol performance of nCmP formulations.
1.4 Organization of Dissertation
The remainder of this dissertation will be organized as follows:
Chapter 2 provides a background on particle-based technology, as well as
parenteral delivery and pulmonary routes of administration. The latter two sections
(routes of administration) are partially adopted from Chapter 6 of the book
“Nanoparticles for Biomedical Applications” (55), which is currently under review for
publication.
Chapter 3 describes the work related to the manuscript, “Enhancement of
Macrophage Uptake via Phosphatidylserine-Coated Acetalated Dextran
Nanoparticles” (52), which involves the design and development of phospholipid-
coated Ac-Dex nanoparticles capable of actively targeting and being uptake by
macrophages.
Chapter 4 describes the work related to the manuscript, “Sustained Release of
Water-Soluble Therapeutics via Dry Powder Aerosol Acetalated Dextran
Microparticles,” which involves the synthesis of Ac-Dex microparticles via spray
drying, and the observation of their drug release behaviors and aerosol performance.
Chapter 5 describes the work related to the manuscript, “Comparison of
Nanoparticle Purification Process via Centrifugation and Tangential Flow Filtration: A
Case Study of Acetalated Dextran Nanoparticles,” which involves the use of Design of

11
Experiments to identify and study the effects of key tangential flow filtration
parameters (factors) on Ac-Dex nanoparticle characteristics (responses).
Chapter 6 presents data related to the “Physical Characterization and Formulation
Development of Eact for the Treatment of Pulmonary Arterial Hypertension,” which
involves the design and characterization of nanocomposite microparticles
encapsulating Eact, a small molecule currently under investigation for its therapeutic
potential for treating pulmonary arterial hypertension.
Chapter 7 concludes the dissertation and addresses future problems and future
directions of Ac-Dex-based drug delivery formulations.
12
CHAPTER 2
PARTICLE TECHNOLOGY AND ROUTES OF ADMINISTRATION:
PARENTERAL AND PULMONARY DELIVERY
Partially adopted from Chapter 6 of “Nanoparticles for Biomedical Applications:
Fundamental Concepts, Body Interactions, and Clinical Potential.” Editors: Eun Ji
Chung, Lorraine Leon, Carlos Rinaldi; Elsevier Science & Technology; Amsterdam,
The Netherlands; In publication March 2019.
Nishan K. Shah1, Elisa A. Torrico2, Zimeng Wang3, Samantha A. Meenach1,2,*
1Department of Biomedical and Pharmaceutical Sciences, College of Pharmacy,
University of Rhode Island, Kingston, RI 02881 USA
2Department of Chemical Engineering, College of Engineering, University of Rhode
Island, Kingston, RI 02881 USA
3Phosphorex Inc., Hopkinton, MA 01748
13
2.1 Particle Technology
The use of particle-based technologies have significantly advanced the fields
of electronics, food, industrial development, and medicine (56). Within the medical
field, particle technologies have made enormous strides as diagnostic and therapeutic
agents, and therapeutic delivery systems. Through particle engineering, particle-based
technologies exhibiting specific size, shape, surface charge, and physicochemical
characteristics can be developed for a variety of disease states or imaging techniques
(57).
Microparticles (MP) are used for depot injections, as inhalable powders, and as
therapeutic agents. Depot injections such as Risperdal Consta® and Invega Trinza®
have shown great success in treating patients with mental health disorders, including
schizophrenia and bipolar disorder (58, 59). Additionally, formulations for depot
injections have been approved for treating diseases such as cancer and alcohol
dependence (59). Dry powder aerosols are a type of MP intended for pulmonary
administration to treat numerous diseases. TOBI® Podhaler™ is an example of a dry
powder aerosol formulation that is used for the treatment of cystic fibrosis-related
infections (60). Through the usage of PulmoSphere™ technology, dry powder
aerosols take the form of spherical, porous MP, allowing for effective delivery (61).
MP have also shown success as therapeutic agents. One example is Sebacia
Microparticles® for the treatment of acne, which was approved for clinical use in 2018
(62). Following topical administration of a suspension, gold-coated silica MP are
heated with a laser, which induces thermal injury to the targeted sites without
inducing a major inflammatory response (63). Another example is Yttirum-90
14
microspheres, which have been explored as a possible alternative approach for cancer
treatment (64).
Nanoparticles (NP) range from 1 nm to under 1 micron. These systems are
often used as drug delivery systems, therapeutics, and diagnostic tools. As of 2016, a
total of 13 products including liposomal (Doxil®), nanocrystal (Rapamune®),
polymeric (Copaxone®), albumin-bound nanoparticle (Abraxane®), and inorganic
(Feraheme®) formulations have been approved for use by the FDA as NP-based
systems for therapeutic purposes (1, 65, 66). From 2013 to 2016 the number of clinical
trials involving nanotechnology has increased 3-fold and it is anticipated that this
trend will continue, with an overall increase in FDA approvals (1). Thus far, all FDA
approved nano-based technologies have been “simple” (NP core plus a coating) and
have been based on usage of biological processes and endogenous phenomena for
particle uptake and deposition. However, since nanotechnology continues to build
from previous successes and failures, it is likely that more complex formulations
(external stimuli, active targeting via ligands and antibodies, etc.) will soon be in
clinical trials (1).
Although particle technology has existed for a substantial amount of time,
there is still a tremendous amount of funding and research devoted to designing and
developing technologies for the treatment and diagnosis of numerous disease states
(65). Included in their design are ideologies of the specific routes of administration
that may be used for delivery (57). In general, particle-based technologies have been
explored in almost every administration route, with parenteral routes being the most
common (1). However, the pulmonary route is gaining more interest due the ability to
15
localize delivery, increase compliance, and increase treatment efficacy, while
decreasing both drug metabolism and systemic side effects. The following sections
below, partially adopted from the book “Nanoparticles for Biomedical Applications”
describe both parenteral and pulmonary routes of administration for particle-based
technologies that pertain to this dissertation.
2.2 Parenteral Delivery
Parenteral delivery is the administration of a therapeutic that goes through
biological tissues directly to blood vessels, organs, or tissues (67, 68). This type of
delivery offers advantages including high bioavailability, and in some cases,
exceptional therapeutic absorption (68, 69). This method can be utilized for patients
who cannot take oral formulations due to limitations (e.g. sickness, obstruction, loss of
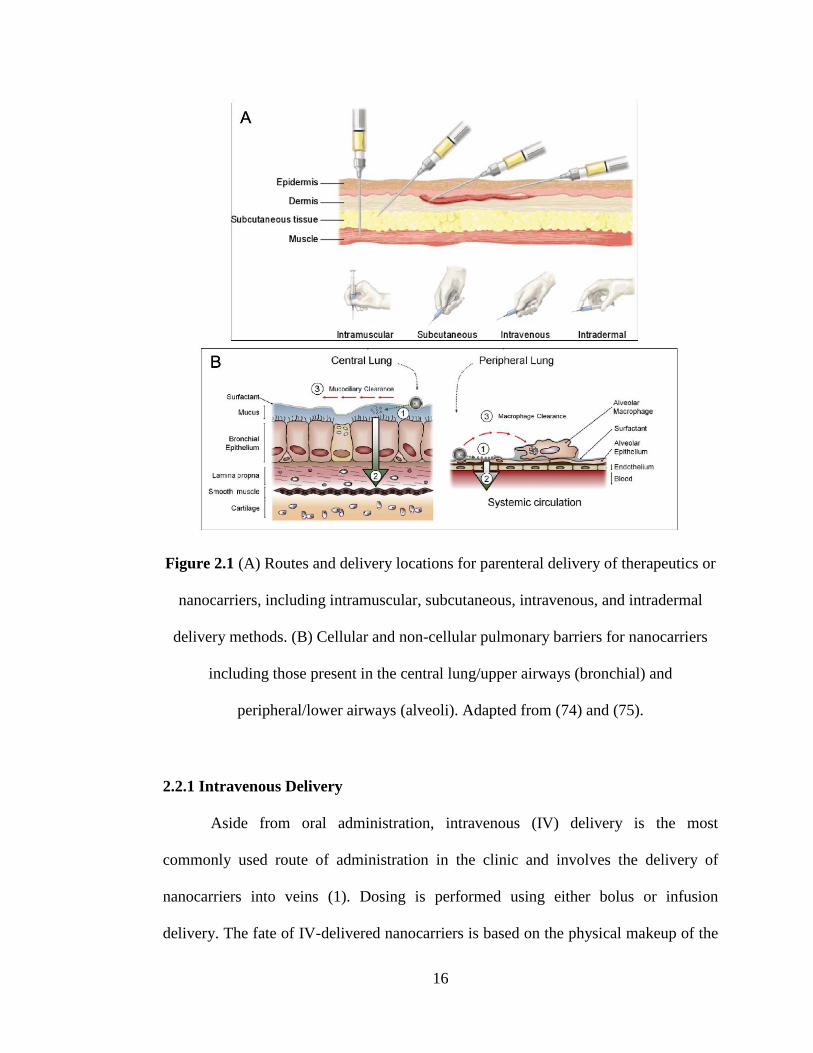
consciousness, etc.). These routes of administration are often favorable for patients
experiencing disease states that require immediate therapy, and for drug monitoring by
medical personnel (68, 70–73). The types of parenteral delivery routes that will be
discussed in this chapter include intravenous, intramuscular, intraperitoneal, and
subcutaneous routes (Figure 2.1A).
16
Figure 2.1 (A) Routes and delivery locations for parenteral delivery of therapeutics or
nanocarriers, including intramuscular, subcutaneous, intravenous, and intradermal
delivery methods. (B) Cellular and non-cellular pulmonary barriers for nanocarriers
including those present in the central lung/upper airways (bronchial) and
peripheral/lower airways (alveoli). Adapted from (74) and (75).
2.2.1 Intravenous Delivery
Aside from oral administration, intravenous (IV) delivery is the most
commonly used route of administration in the clinic and involves the delivery of
nanocarriers into veins (1). Dosing is performed using either bolus or infusion
delivery. The fate of IV-delivered nanocarriers is based on the physical makeup of the
17
product (active ingredient and excipients). Alterations to the product and its
characteristics will determine overall outcomes. Products administered by IV
administration are subject to numerous biological challenges that stem from their
physical characteristics including size, charge, shape, and surface modifications (57,
76). Within the body, nanocarriers are subject to protein adsorption, rapid elimination
by the reticuloendothelial system (RES), unwanted tissue deposition, and restricted
access by biological barriers (68, 77, 78). Size plays a key role in the biological
elimination of nanocarriers, where carriers < 10 nm are small enough to be filtered and
cleared by renal clearance, whereas carriers > 200 nm are susceptible to the RES,
leading to a decrease in therapy (78). Charge also plays a key role in the interactions
of nanocarriers with circulating proteins and phagocytotic cells (79, 80). Highly
negative carriers are susceptible to macrophage uptake, whereas positively-charged
products are likely to aggregate with circulation proteins and cellular membranes and
are often toxic. Therefore, neutrally-charged formulations are usually overall
favorable, unless a specific biological action utilizing charge is desired (i.e.
macrophage uptake) (57, 79, 80). Surface modifications will also have a significant
impact on the biological end-point of nanocarriers (57, 81, 82). Numerous studies have
shown unfavorable pharmacokinetic (PK) profiles and unwanted deposition based on
the lack of targeting or other forms of modification (77, 78, 83). Although there is
evidence to support nanocarrier shape plays a role in biological interactions, research
is still ongoing (84).
The major advantage of IV administration is based on the direct delivery of
products into circulation (70), which allows for increased bioavailability. In
18
comparison to IV delivery, orally-administered carriers are exposed to enzymes that
cause degradation of drugs, acidic pH, and mucus. IV administration of products
avoids complications related to degradation, allowing for more effective delivery of
sensitive carriers (69, 70). In addition, IV delivery is advantageous for carriers that
require careful drug monitoring (68, 77, 85).
2.2.1.1 Applications
Finding ways to predict biological outcomes of nanocarriers in vitro has been a
subject of interest for many years. For example, one study investigated the interactions
of nanocarriers and blood components and showed a simple yet detailed method to
measure the influence of protein adsorption, coagulation, complement activation, and
hemolysis on nanocarrier characteristics (76). Another study utilized centrifugation as
a method to examine cellular membrane binding and disruption in the characteristics
of nanocarriers (86). The development of in vitro experiments such as these can
provide time and cost-efficient ways to predict outcomes of nanocarriers in vivo. In
addition, research on the impact of surface modification of nanocarriers has been a
subject of interest in order to increase the targetability of nanocarriers, to increase
pharmacokinetic profiles and decrease side effects. The most successful modification
to date is antibody (Ab) conjugation, and clinical trials exploring Ab-functionalized
nanocarriers are underway (77).
Both polymeric and liposomal nanocarriers used for chemotherapy have had
some success in the clinic and are primarily administered via IV, and the majority of
FDA-approved liposomal formulations are administered via IV (87). Improvement of
19
PK profiles compared to drug suspensions and a decrease in toxicity have been major
advantages of chemotherapeutic nanocarriers (68). Furthermore, the enhanced
permeability and retention (EPR) effect is another benefit of IV administration. The
proposed mechanism is based on “leaky” blood vessels present in and around tumors,
which allow for nanosized material to more readily reach the tumor tissue and exert
their therapeutic action (71, 77, 85, 88). To facilitate EPR, nanocarriers are often
coated with a hydrophilic, neutral polymer that can allow the nanocarrier avoiding
protein aggregation on the surface of the carrier, reducing clearance in the RES (1, 8,
85). Poly(ethylene glycol) (PEG) is the most widely used hydrophilic polymer for
nanoparticle coatings (78, 83) and PEG coatings are used in several FDA-approved
nanomedicine formulations (e.g. Doxil®) (8, 87). Another FDA-approved cancer
nanocarrier formulation is Abraxane®, a third-generation paclitaxel (PTX) delivery
formulation that consists of PTX bound to human serum albumin, the most common
circulation protein (71, 87). Abraxane® has shown significant improvements in
administration time (decrease from 3 hours to 30 minutes), as well as improvements in
critical PK characteristics in comparison to Taxol®, the commonly used PTX
formulation (71).
2.2.1.2 Obstacles and Applications
IV administration is one of the most-widely used administration routes and the
main administration route for anti-cancer therapeutics (71, 77, 88). Despite widespread
studies investigating colloidal science and biological interactions (76, 86, 89), more
studies are needed to further identify and counter potential hazards of IV-delivered
20
nanocarriers. Other obstacles to consider are more technical. Scale-up synthesis and
high-throughput screening methods need to be designed to combat the issue of supply
and time-cost investment. An example of this includes product shortage such as the
current Doxil® shortage, which needs to be avoided (77). Based on the major
obstacles, there are plenty of opportunities for the design of high-throughput screening
methods, scale up manufacturing, and predictive tools.
2.2.3 Intraperitoneal Delivery
Intraperitoneal (IP) delivery involves the delivery of therapeutics to the
peritoneum cavity to increase local concentrations (90). The major use of IP delivery
has been for the treatment of peritoneal cancers. The fate of nanocarriers administered
via the IP route is highly dependent on the localization of the malignant tissue and the
deposition of the administered product in relation to vital organs (91). IP
administration generally during or post-surgery (92) and deposition of nanocarriers are
initially localized at the administration site, while deviation from the site is affected by
the physical characteristics and surface modifications of the formulation, and the
dynamics of the site itself including fluid dynamics, gravity, presence of mucus, etc.
(93).
In addition to avoiding the stomach, intestines, and first-pass metabolism, the
major advantage of IP delivery is the superior level of treatment over IV
administration, likely due to the close proximity of therapeutics to malignant tissue
(92). IP delivery has been used in the clinic for over 50 years and has demonstrated
that it is very efficient in destroying cancerous tissue post-surgery (94). Also, IP
21
administration results in reduced levels of systemic exposure (91, 94, 95). Although IP
administration of nanocarriers offer several advantages, challenges are inevitable.
Major challenges are the side effects associated with IP delivery, including pain,
discomfort, and systemic toxicity (96). While side effects such as pain and discomfort
are likely unavoidable, systemic toxicity needs to be addressed by designing
nanocarriers that can remain localized. Also, traditional chemotherapeutics are subject
to short residence times and require frequent or continuous administration, which can
increase side effects and the likelihood of toxicity (94, 96, 97).
2.2.3.1 Applications, Obstacles, and Opportunities
To address some of challenges pertaining to IP administration, the
development of formulations to improve the localization of IP therapeutics is a
promising approach. One such method is the development of adhesive formulations
that can adhere to the peritoneum, such as chitosan-coated nanocarriers (97). Another
method would be the inclusion of nanocarriers in biological mimics, such as hydrogels
(94, 96). Nanocarriers with targeting ligands, that includes antibodies and peptides, are
also being explored (90, 98, 99) and formulations that exhibit controlled release have
also shown promise as novel approaches (94). Another approach that can be used to
complement currently-used clinical treatments include nanocarrier-driven
hyperthermic intraperitoneal chemotherapy (HIPEC), and pressurized intraperitoneal
aerosol chemotherapy (PIPAC). Traditional HIPEC involves the administration of pre-
heated chemotherapeutic solution to a site of interest (92). In doing so, the increased
temperature allows for increased drug penetration and therapeutic efficacy (90, 93,
22
99). Clinically, HIPEC has shown to increase the survival rate when used in
conjunction with surgery (100). PIPAC, a newer treatment option, utilizes the
nebulization of therapeutic solutions (both raw drug and formulations) using CO2 (93,
99, 101). To assist in both HIPEC and PIPAC, nanocarriers can be used to control
solution and tissue heating, and increase drug deposition via passive and active
targeting (93, 99, 101, 102). As of 2017, nanoparticle formulations developed for the
treatment of IP-related cancers are in clinical trials (93). A phase I study of IP-
administered formulated paclitaxel (Nanotox®) showed higher and prolonged drug
levels within the peritoneum, resulting in minimal toxicity and systemic drug exposure
following six doses of Nanotax® administered for six cycles (95). A form of HIPEC
that utilizes nanocarriers through the use of external heating of inorganic materials to
enhance delivery and penetration is currently being studied as well (99, 103). In
addition, bio-adhesive systems such as hydrogels and nanocarriers have also shown
promise to increase the residence time of therapeutics and decrease nanoparticle
clearance from the peritoneum (94, 96, 97).
2.2.4 Intramuscular Delivery
Intramuscular (IM) administration involves the delivery of a therapeutic within
a muscle and is the most common route used for the delivery of vaccines (104). In
addition, IM delivery is often explored as a route for depot products such as hydrogels
and microspheres (105, 106). The deposition of IM-administered products is heavily
dependent on the overall immune response at the delivery site. With respect to the use
of IM delivery for vaccines, immune responses are preferred (107, 108). However, an
23
immune response following administration of formulations that result in the extended
release of small molecules is undesirable. Inflammation can result in the recruitment
of various white blood cells, which can pose a threat to small molecule formulations,
as they would be recognized as foreign objects and would be engulfed (109).
Like most parenteral delivery systems, invasiveness, pain, and stress are major
drawbacks for IM delivery. Additionally, IM administration can be associated with
severe pain, immune responses (rashes, erythema, inflammation, etc.), and in severe
cases, tissue necrosis (110). In most cases, acute edema (swelling) at the site of
injection occurs. Due to the interest in long-acting injectables with IM being the
preferred route, attention needs to be paid to ensure that prolonged and stable release
is achieved for the desired time (106, 110). Generally, the major challenge with IM
delivery lies in water-soluble therapeutics, which can result in challenges in
dissolution, degradation, and uptake of both the therapeutic and the formulation (109).
IM injection of microspheres and hydrogels is a viable alternative to the oral delivery
of certain therapeutics, thereby increasing the overall PK and dynamic profiles of the
therapeutics, while decreasing the likelihood of systemic side effects (67, 111).
Additionally, IM-administered depot injections can allow for the modulation of dosing
regimens by decreasing the dosing frequency.
2.2.4.1 Applications, Obstacles, and Opportunities
Although there are drawbacks concerning patient compliance and biological
responses with IM delivery, vaccine and biological therapeutic research is heavily
dependent on this type of delivery (108, 109). As a result, a significant portion of IM
24
delivery-related research is devoted to improving the sustained release and biological
responses of newly developed vaccines and other biological therapeutics (107, 112).
This interest is mainly due to the advantageous changes in PK and dynamic profiles of
nanocarrier formulations, as well as the significant decrease in dosing frequency (67,
106, 111). Another novel use of nanocarriers in IM delivery is the development of
adjuvants, which are entities that work to increase antigen uptake and promote
dendritic cells to initiate an immune response (113). Aside from vaccine products,
there are very few products using IM for the delivery of small molecules.
Microspheres are the main form of technology used for sustained drug release for
these applications (106, 111). Currently, there are no FDA-approved nanoscale IM
formulations and the future of IM delivery is dependent on extending the time between
doses of both small and large molecule therapeutics.
2.2.5 Subcutaneous Delivery
Subcutaneous (SC) administration involves the delivery of therapeutics into the
interstitial area underlying the epidermis via injection. The interstitial area under the
skin is primarily comprised of negatively-charged glycosaminoglycan and collagen
fibers, which provides a relatively slow and steady absorption rate of molecules,
owing to reduced blood flow (114). Conventional SC formulations include aqueous
solutions, oily solutions, suspensions, and simple emulsions of therapeutics. In order
to modify the release profile of compounds, they can be encapsulated into particle or
implant-based formulations. Particle-based delivery systems can also be applied for
lymph-targeting delivery (115).
25
The fate of nanocarriers delivered through the SC route depends on the particle
properties and the injection location (116). Particle size is the key factor in
determining the final absorption route. Particles < 10 nm tend to be absorbed via the
capillaries draining from the injection site, where they then go into systemic
circulation. Particles 10-100 nm in diameter move through the interstitium and are
taken up directly into the lymphatic system. Particles > 100 nm show low capability of
diffusion through the water channel within the interstitium (also around 100 nm). As a
result, the larger particles mostly retain at the injection site and form a depot. During
particle diffusion through interstitium, charge and hydrophilicity play important roles
as they influence the interaction between particles and interstitial compounds.
Furthermore, the driving force of particle transport into lymph is fluid flow from the
interstitium to the lymphatics, which varies in different locations. Correspondingly,
the variation of injection site also affects the lymphatic transport by changing the fluid
flow and pressure surrounding the formulation (116–119).
2.2.5.1 Applications and Advantages
SC administration of therapeutics is widely applied to obtain higher
bioavailability, to modify the release profile to allow for longer systemic exposure, or
to serve as an alternative dosing route when oral delivery is not applicable (115).
Various nanocarrier-based SC formulations have been developed to deliver
therapeutics such anti-cancer drugs (118), antibiotics (106), HIV drugs (120), peptide
hormones (121), anticoagulants (122), protein drugs (123), mRNA (124), and
immunosuppressive anti-rheumatic drugs (125). Such nanocarrier-based formulations
26
have been developed for the treatment of pancreatic, non-small cell lung, breast,
ovarian cancers (118), gastrointestinal clostridium difficile-associated diseases (106),
tuberculosis (126), lymphatic filariasis (116), venous thrombosis (122), inflammatory
diseases (123), rheumatoid arthritis (125), and the prevention of HIV-1 vaginal
transmission (1). The function of these particular nanocarriers can be divided into
three aspects, including 1) the formation of depots at the injection site in order to
provide sustained release of therapeutics (106, 118, 120–122, 125, 126), 2) the
application of particles 70-110 nm in diameter for lymphatic system targeting (116,
125), or 3) systemic delivery of nanocarriers via the SC route (124).
Compared to other parenteral routes such as IV and IM administration, SC
administration is typically convenient to patients. First, it is often less painful and less
time consuming, which improves patient compliance. Furthermore, it is easy to do and
suitable for self-administration, which reduces the total cost of treatment (119, 127). In
addition, nanocarrier formulations delivered via the SC route provide protection for
the therapeutic and result in prolonged release, thereby reducing dosing frequency,
improved safety and efficiency, and targeted delivery of therapeutics (116).
2.3 Pulmonary Delivery
In recent years, pulmonary delivery has been a growing interest owing to its
advantages over other delivery systems to treat local diseases in the lungs and
respiratory tract such as asthma, infectious diseases, cancer, and chronic obstructive
pulmonary diseases (COPD) (128). Local administration to the lungs provides high
concentration of a drug at the site of action, lowering the overall dose required,
27
thereby reducing systemic side effects (129, 130). Due to the high surface area in the
lungs (75-140 m2 in total), systemic delivery can be attained via the alveoli, where the
drug can be absorbed into the bloodstream (131–133). Absorption by the alveoli
allows for a rapid onset of action and avoidance of first-pass metabolism (134, 135).
2.3.1 Delivery Devices
The three major types of inhalers used for pulmonary delivery are metered
dose inhalers (MDIs), nebulizers, and dry powder inhalers (DPIs) (136, 137). The
mechanisms of delivery and the formulation requirements differ by the type of inhaler
used. MDIs are pressurized vessels that rely on the driving force of the propellant to
atomize droplets containing drug(s) and excipients, where the drugs are either
solutions or particulate suspensions (136, 138). Nebulizers deliver liquid drug
formulations in a steady stream of droplets of 1-5 µm, and can deliver larger doses
compared to other inhalers, but may also require longer dosage times (139).
Nebulizers produce ultra-fine droplets with high polydispersity, which can make them
unsuitable for the delivery of larger particles (bigger than the droplet size) (131). Dry
powder inhalers (DPIs) are breath-activated devices that deliver therapeutics in the
form of a dry powder directly to the airways. During administration, a capsule
containing a set dose of drug is punctured and the drug is aerosolized (140).
Therapeutics delivered using DPIs tend to agglomerate due to hygroscopic phenomena
and electrostatic interactions, which reduce aerosolization performance (131). DPIs
can be preferred over other devices owing to the promise of physical stability of the
28
formulation in solid form, ease to use and transportation, and application to variety of
active ingredients and dose weights (141, 142).
2.3.2 Particle Fate
Particle deposition in the lungs is governed by the aerodynamic diameter of the
particles and occurs by one of three mechanisms: inertial impaction, sedimentation, or
diffusion. Additionally, inhalable particles can be categorized into different sizes,
including coarse (≥ 5 μm), fine (0.5–5 μm), or ultrafine (≤ 0.5 μm) (133). Coarse
carriers collide with the upper airways (trachea and large bronchi) and deposit by
impaction, fine particles can reach the lower lung airways by sedimentation, and
ultrafine particles can deposit throughout the respiratory tract, reaching the alveoli by
diffusion (132, 133). Particles within the fine and ultrafine categories fall in the 1 – 5
μm range of values for deposition by sedimentation (45).
2.3.2.1 Microparticles
Inhalable microparticles (MP) can be categorized as coarse or fine particles.
While MP are exceptionally larger than nanoparticles (NP), properly engineered MP
are able to reach deeper regions of the lungs (45, 143). In most cases, particles in the
micron range deposit via impaction or sedimentation (133). While spherical particles
are the most recognized systems, porous and corrugate particles have shown
exceptional results and promise for pulmonary administration (144). Although porous
MP are inherently large in geometric size (coarse size range), the aerodynamic
diameters are low, while the internal pores allow for low mass density and high
29
surface area (144, 145). The characteristics allow for the avoidance of macrophage
uptake, while achieving favorable aerodynamic and drug release performances (49).
Corrugated morphology allows for deeper lung delivery in comparison to spherical
morphology particles. This is likely linked to the inherent decreases in particle
cohesion and smaller aerodynamic diameter, as a result of the corrugations (145, 146).
2.3.2.2 Nanoparticles
Nanoparticles (NP) fall within the range of fine or ultrafine inhalable particles.
Through utilization of their size, NP are able to deposit in the lower areas of the lungs,
via Brownian diffusion, and are able to reach the alveoli (133). Additionally, NP offer
an increase in surface area to volume ratio, which enhances the solubility and
dissolution rate of poorly water-soluble drugs. Deposition into the alveoli as well as
the increased dissolution rate promotes increased absorption, allowing for increases in
overall bioavailability (130, 137, 147). However, it should be noted that these
particles, due to their size and density, are likely to be exhaled (133). To bypass this
challenge, Nebulizers, MDI, and DPI can be used to generate aerosols (131, 133, 139,
141, 142). Another method to overcome this challenge is through the design of
nanocomposite microparticle (nCmP) systems. By forming aggregates of NP, nCmP
are able to utilize the advantages presented with corrugated MP structures (44). As NP
aggregate, they form a MP-like structure, increasing the inherent size of the system.
Upon initial inhalation, nCmP are able to stay in their MP-like structure. Once nCmP
reach fluid in the lungs, they dissociate to NP and deposit further into the lungs (54).
30
2.3.3 Advantages and Applications
Oral and IV administration are the two most common methods of therapeutic
delivery (1). However, due to systemic exposure, therapeutics that demonstrate a small
therapeutic window and/or are potent are likely to be associated with side effects
and/or toxicity. Administration of particle-based delivery systems via inhalation can
limit systemic exposure, thereby decreasing overall side effects (130). Pulmonary
administration allows for localized delivery of therapeutics. For example, diseases
such as tuberculosis and lung cancer are treated with potent drugs via extended dosing
regimens, often via IV administration (148–150). Localized administration can
decrease such regimens while altering the administration route, thereby increasing
overall patient compliance (148). Complimenting this is the potential for increased
treatment efficacy, as localized delivery can promote increased drug exposure to sites
of interest. The other major advantage of pulmonary administration is the potential for
increased bioavailability via increased absorption and bypassing of first-pass
metabolism (44, 130, 147). The combination of a thin epithelial monolayer, high
vascularization, and high surface area of the alveoli can allow administered
therapeutics to diffuse into the bloodstream, promoting high absorption rates and rapid
onsets of action (133). Additionally, the lungs have minimal enzymatic activity,
limiting the amount of drug metabolism that occurs (130).
The advantages provided by pulmonary administration promote improved
treatment options for diseases such as cystic fibrosis, lung cancer, pulmonary
hypertension, and other disease states that can have severe impacts on both the
pulmonary system, and the patient (129, 151, 152). Additionally, due to the limited
31
enzymatic activity in the lungs, delivery of macromolecules via inhalation is another
major research interest (130). Bypassing IV administration via pulmonary
administration for macromolecule agents (vaccines, peptides, etc.) can greatly increase
patient compliance of such entities (145). An example of a successful pulmonary drug
delivery system is TOBI® Podhaler™, a dry powder dosage form of tobramycin
developed for the treatment of Pseudomonas aeruginosa infections in cystic fibrosis
patients (60, 153).
2.3.4 Challenges
Like other particle-based delivery systems, interactions with biological entities
in the lungs can be an issue. Interactions among mucus, bronchial epithelium tissue,
and alveolar macrophages all present significant challenges for pulmonary
administered systems (129). Mucus presents a major challenge due to its viscoelastic
properties and physical structure (154–156). Mucociliary clearance generally occurs in
the upper airways of the lungs, where foreign material is lodged and entrapped in the
mucus (154–156). Clearance then occurs when cilia transport this mixture to
coordinate a coughing or swallowing response (157). Bronchial epithelium tissues,
like other epithelial tissues, are inherently lipophilic with tight junctions (limiting
passive paracellular transport), and contain both uptake and efflux transporters (158,
159). Although uptake transporters can promote drug absorption, efflux transporters
will demote it. Alveolar macrophages in the lower airways are capable of
phagocytosing foreign materials, including particle-based delivery systems that are
approximately a few micron or less in diameter (160). A diagram of potential
32
biological barriers can be seen in Figure 2.1B. To avoid these major barriers, particle-
based delivery systems need to be carefully designed and tailored to bypassing
specific challenges.
2.3.5 Future Opportunities
Present challenges and the growth of biological therapeutics have both created
continual opportunities for pulmonary administration of particle-based delivery
systems. It is important to note that fundamental characteristics including particle size,
morphology, and surface charge can also provide options to bypass challenges faced in
pulmonary delivery (133, 145, 161, 162). The importance of size is highlighted in
sections 2.3.2.1 and 2.3.2.2. Surface morphology plays a significant role in the
deposition of particles, particularly for MPs, and is highlighted in section 2.3.2.1. In
terms of surface charge, neutrally charged systems show the highest promise for
pulmonary administration (54, 163). While cationic surfaces can increase cell toxicity,
and negative surfaces can increase alveolar macrophage uptake, functionally neutral
surfaces have shown exception promise in avoiding macrophage uptake, as well as
increased mucus diffusion (163–166).
A major research interest for pulmonary delivery systems is the particle
engineering of systems that can readily diffuse through mucus for the treatment of
multiple disease states (167–170). Bypassing of the mucus to increase the treatment of
bacterial diseases, especially those associated with cystic fibrosis stands as an
exceptionally interesting research topic currently (155, 171, 172). Another research
interest is the understanding of transport phenomena across epithelial tissue. Although
33
a newer point of interest, results from numerous studies show that particle systems,
particularly NP, utilize a multitude of diffusion methods to cross epithelial tissue,
warranting more research to be devoted to understanding these phenomena and
possible explanations (6).
34
CHAPTER 3
ENHANCEMENT OF MACROPHAGE UPTAKE VIA PHOSPHATIDYLSERINE-
COATED ACETALATED DEXTRAN NANOPARTICLES
Published in Journal of Drug Delivery Science and Technology
Volume 50, pages 57-65, 2019
Nishan K. Shah1, Sweta K. Gupta2, Zimeng Wang2, Samantha A. Meenach1,2,*
1University of Rhode Island, College of Pharmacy, Department of Biomedical and
Pharmaceutical Sciences, Kingston, RI 02881
2University of Rhode Island, College of Engineering, Department of Chemical
Engineering, Kingston, RI 02881
35
3.1 Abstract
Although vital to the body’s immune system, macrophages can also act as
reservoirs for pathogens from infectious diseases such as tuberculosis and the human
immunodeficiency virus. Limitations in the treatment of such diseases include the
challenge of targeting therapeutics directly to the macrophages and the large systemic
dosages often needed for treatment. The objective of the present study is to develop a
nanoparticle (NP)-based drug delivery system that can more effectively deliver
therapeutic agents into macrophages. Acetalated dextran (Ac-Dex) NP loaded with the
lipophilic model compound curcumin (CUR) were synthesized and coated in 1,2-
dipalmitoyl-sn-glycero-3-phospho-L-serine (DPPS), a phospholipid that induces
phagocytosis in macrophages. DPPS-CUR NP were found to release 67.8% of
encapsulated CUR within 24 hours at pH 5.35 and exhibited minimal CUR release
(6.3%) at pH 7.4. DPPS-CUR NP were uptaken by murine macrophages significantly
more than NP without DPPS coating and NP exposure to these macrophages resulted
in minimal toxicity to the cells and minimal nitric oxide production. These results
suggest that the combination of the DPPS coating and pH-sensitive polymer Ac-Dex
can provide a NP delivery system capable of enhanced uptake by macrophages and
potential systemic stability to more effectively deliver drugs of interest. As a result,
the described DPPS-CUR NP can serve as a viable delivery system for the treatment
of macrophage-associated diseases.
36
3.2 Keywords
Acetalated dextran; 1,2-dipalmitoyl-sn-glycero-3-phospho-L-serine (DPPS);
macrophage-associated diseases; targeted cellular uptake; nanoparticles; drug delivery
3.3 Abbreviations
2-methoxypropene (2-MOP), acetalated dextran (Ac-Dex), curcumin (CUR), cyclic-
to-acyclic ration (CAC), dichloromethane (DCM), dimethyl sulfoxide (DMSO),
deionized (DI) water, 1,2-dipalmitoyl-sn-glycero-3-phosphocholine (DPPC), 1,2-
dipalmitoyl-sn-glycero-3-phospho(1’-rac’glycerol) (DPPG), 1,2-dipalmitoyl-sn-
glycero-3-phospho-L-serine (DPPS), differential scanning calorimetry (DSC),
encapsulation efficiency (EE), human immunodeficiency virus (HIV),
lipopolysaccharide (LPS), nitric oxide (NO), nanoparticles (NP), phosphate buffered
saline (PBS), phosphatidylserine (PS), poly(vinyl alcohol) (PVA), poly(lactic-co-
glycolic acid) (PLGA), p-toluenesulfonate (PPTS), scanning electron microscopy
(SEM), tuberculosis (TB), transmission electron microscopy (TEM), triethylamine
(TEA)
37
3.4 Introduction
Macrophages are vital in the removal of cellular debris and foreign bodies to
maintain homeostasis in the human body (82, 173), can colonize in the liver, lungs,
spleen, lymph nodes, marrow, or brain, and are critical to the innate immune system
(173). An example of the importance of macrophages is in the removal of apoptotic
cells via stimulation of various signals and markers that are overexpressed by
presenting cells to initiate identification and engulfment (174). Although macrophages
are involved in the protection and maintenance of the human body, there are scenarios
in which these cells can result in more harm than good. Macrophages have the
potential to act as reservoirs for infectious pathogens, including those related to two of
the most prevalent infectious diseases, tuberculosis (TB) (82, 173) and the human
immunodeficiency virus (HIV) (82, 173). The commonality amongst these diseases
lies in the extensive treatment times and dosing regimens necessary to treat TB and
HIV, often resulting in negative side effects. As a result, treatment by way of
enhanced delivery to macrophages is of growing interest (10, 43, 180–186, 82, 173–
179).
Recent progress in the development of macrophage targeting systems have
been based around receptor-ligand interactions (187). One common approach is
surface functionalization of systems with mannose residues to target CD206 (mannose
receptor), a carbohydrate-recognition domain that is largely expressed on alveolar
macrophages (188, 189). In other cases, tumor associated macrophages can also be
targeted using peptide-based ligands such as rabies virus glycoprotein (RVG), and can
be used as carriers for systems encapsulating anti-cancer therapies (190, 191). Other
38
ligands such as 4-SO4-GalNAc can be used to target other receptors on the surface of
phagocytic macrophages to increase targeted uptake (192).
Phosphatidylserine (PS) is an anionic phospholipid that is produced and
stationed on the inner membrane of healthy cells (174, 181, 193, 194). Once apoptosis
is induced, PS transitions from the inner leaflet to the outer leaflet of the cell
membrane (178). Apoptotic cells produce a signal via PS exposure to stimulate the
attraction of macrophages for engulfment of the presenting cells (phagocytosis) via
receptor-ligand interactions or identification of PS binding proteins produced by
phagocytes (82, 174, 194, 195). Although it is essential for the phagocytosis signal,
there is some debate as to whether sole exposure of PS is sufficient to induce the
uptake of apoptotic cells by macrophages in vitro (174, 194, 195). However, particle-
based drug delivery systems that utilize PS (specifically, 1,2-dipalmitoyl-sn-glycero-3-
phospho-L-serine, DPPS) as the particle coating have resulted in enhanced
macrophage uptake through the sole presence of PS (174), likely due to the amount of
PS presented. Multiple studies centered around treatment of inflammation (183, 196),
HIV-1 (82, 173, 180, 182), cancer (184, 185, 197), atherosclerosis (198), and MRI
imaging (10, 82, 175) have used DPPS coatings to increase the uptake of particle-
based delivery systems by macrophages or have used PS as a binding target.
Acetalated dextran (Ac-Dex) is a biodegradable, biocompatible polymer
comprised of the FDA-approved excipient dextran and hydrophobic acetal groups that
allow for emulsion-based NP synthesis (19, 45, 53). Unlike commonly used drug
carriers such as poly(lactic-co-glycolic acid) (PLGA), the degradation kinetics of Ac-
Dex can be easily tuned by altering the ratio of cyclic to acyclic acetal groups by
39
modifying the Ac-Dex synthesis reaction time (36, 40). The acid-sensitivity of Ac-Dex
has made it a viable carrier option in applications for cancer (36, 40, 49),
inflammatory-related conditions (42), vaccines (36, 40), and antibiotic delivery (54).
There is a significant difference in degradation and drug release kinetics for Ac-Dex
nanoparticle (NP) systems at a pH of 5 (faster release) versus at a pH of 7.4 (slower
release) (36, 40, 42, 43, 45, 49, 53, 54). Due to this difference, Ac-Dex NP systems
will exhibit slower release and stability during systemic circulation (at pH 7.4) until
they are delivered to a site in the body with a lower pH, such as in macrophages,
where therapeutics will be readily released.
The current study involves the design of a novel therapeutic particle-based
drug delivery system consisting of a phosphatidylserine (PS)-coated, polymeric (Ac-
Dex), drug-loaded NP designed to enhance uptake into macrophages. The novelty of
this formulation lies in the inherent ability of PS to enhance the uptake of the NP into
macrophages, while the Ac-Dex core promotes burst release of the cargo directly in
the macrophages owing to its acid sensitivity. Curcumin (CUR), a natural product
isolated from Curcuma longa, was chosen as the model small molecule due to its
fluorescent properties, low water solubility, and potential clinical applications (43, 45,
203, 177, 181, 183, 185, 199–202).
3.5 Materials and Methods
3.5.1 Materials
Unless stated otherwise, materials were purchased from Sigma Aldrich (St.
Louis, MO). 1,2-dipalmitoyl-sn-glycero-3-phosphocholine (DPPC), 1,2-dipalmitoyl-
40
sn-glycero-3-phospho(1’-rac’glycerol) (DPPG), and 1,2-dipalmitoyl-sn-glycero-3-
phospho-L-serine (sodium salt, DPPS) were purchased from Avanti Lipids (Alabaster,
AL).
3.5.2 Synthesis and Characterization of Acetalated Dextran
Acetalated dextran (Ac-Dex) was synthesized using a previously described
method (45, 53). 1 g of lyophilized dextran (9,000-11,000 MW) was dissolved in 10
mL of anhydrous DMSO with 25 mg of p-toluenesulfonate (PPTS) under nitrogen gas.
The reaction was carried out for 5 minutes using 5 mL of 2-methoxypropene (2-MOP)
and was quenched with 1 mL of triethylamine (TEA). The polymer was then
precipitated in basic water (pH 9), filtered, lyophilized, and stored at -20C. The
cyclic-to-acyclic (CAC) ratio of Ac-Dex and acetal coverage were verified using 1H
NMR (Bruker 300 MHz, NMR, MA) as described previously (45, 53, 54).
3.5.3 Synthesis of PVA-Coated Nanoparticles
PVA-coated, CUR-loaded Ac-Dex NP (PVA-CUR NP) were synthesized
using a single emulsion/solvent evaporation method (53). 50 mg of Ac-Dex and 1 mg
of CUR were dissolved in 1 mL of DCM. This organic solution was added to 6 mL of
3% PVA (in 1x PBS) and the resulting mixture was emulsified using a probe sonicator
attached to an ultrasonic processer at 120 W and 20 kHz (Q500, Qsonica, Newtown,
CT) for 1 minute with 1 second on/off pulses. The emulsion was added to 40 mL of
0.3% PVA and was spun for 4 hours to allow for organic solvent evaporation and
particle hardening (45). The spinning solution was centrifuged at 3124 x g for 60
41
minutes and particles were redispersed in a 0.1% PVA solution and frozen overnight,
followed by lyophilization. PVA-coated NP without CUR (PVA-Blank NP) were
formulated similarly to PVA-CUR NP by omitting CUR from the organic solutions.
NP samples were stored at -20C.
3.5.4 Synthesis of DPPS and DPPC-Coated Ac-Dex NP
PVA-coated NP were coated with DPPS via a film hydration method often
used to make liposomal delivery systems (180, 182, 183, 196, 204, 205). DPPS was
dissolved in 4 mL of chloroform and methanol (9:1 v/v) (185). The solution was
subjected to rotary evaporation using a Heidolph 2 rotary evaporator (Schwabach,
Germany) to create a thin film in a 25 mL round-bottom flask. The film was dried
under vacuum for 1 hour to remove excess solvent, during which the NP were washed
with deionized (DI) water to remove excess PVA. The dried film containing the NP
was then rehydrated with 4 mL of DI water and this solution was sonicated for 30
minutes, followed by freezing and lyophilization. After lyophilization, the resulting
NP were stored at -20C. The ratio of lipid to NP during the process was 1:5 (w/w).
NP coated with DPPC and a small amount of DPPG NP were synthesized using the
same method with a 5:1 (w/w) DPPC:DPPG ratio and these NP are referred to as
DPPC-NP.
3.5.5 Nanoparticle Size and Surface Charge Characterization
Hydrodynamic diameter and surface charge of the NP were evaluated via
dynamic light scattering (DLS) and zeta potential analysis, respectively, using a
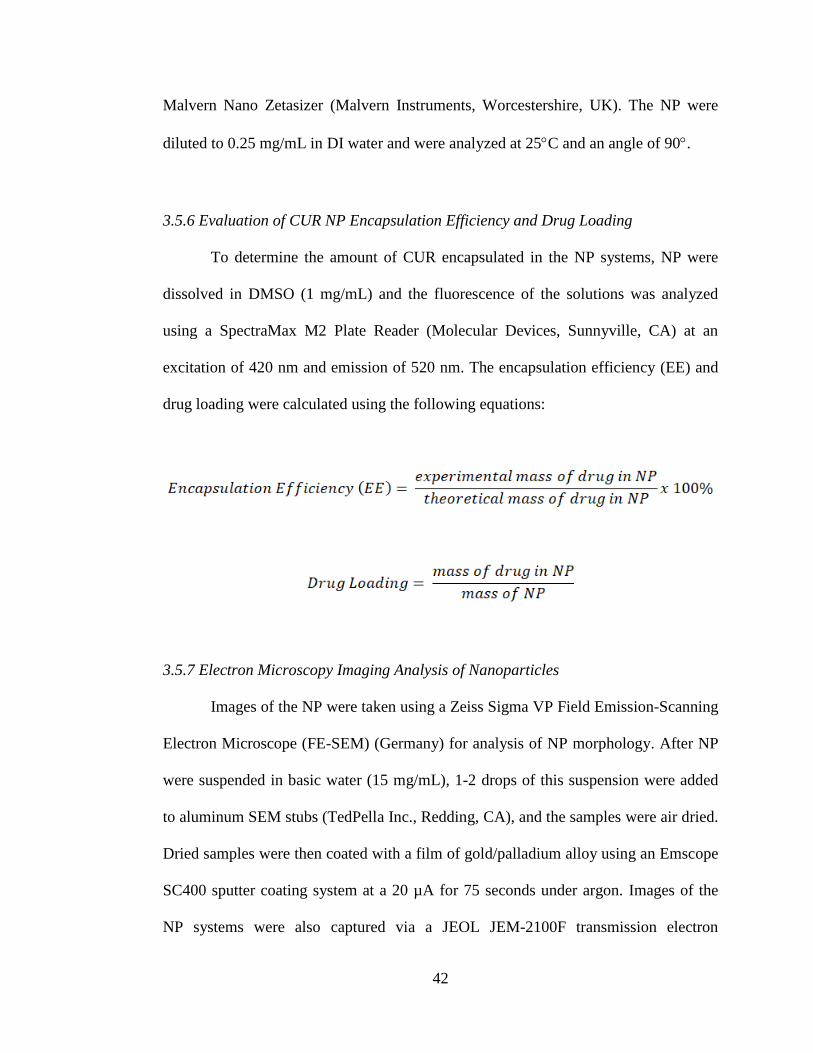
42
Malvern Nano Zetasizer (Malvern Instruments, Worcestershire, UK). The NP were
diluted to 0.25 mg/mL in DI water and were analyzed at 25C and an angle of 90.
3.5.6 Evaluation of CUR NP Encapsulation Efficiency and Drug Loading
To determine the amount of CUR encapsulated in the NP systems, NP were
dissolved in DMSO (1 mg/mL) and the fluorescence of the solutions was analyzed
using a SpectraMax M2 Plate Reader (Molecular Devices, Sunnyville, CA) at an
excitation of 420 nm and emission of 520 nm. The encapsulation efficiency (EE) and
drug loading were calculated using the following equations:
3.5.7 Electron Microscopy Imaging Analysis of Nanoparticles
Images of the NP were taken using a Zeiss Sigma VP Field Emission-Scanning
Electron Microscope (FE-SEM) (Germany) for analysis of NP morphology. After NP
were suspended in basic water (15 mg/mL), 1-2 drops of this suspension were added
to aluminum SEM stubs (TedPella Inc., Redding, CA), and the samples were air dried.
Dried samples were then coated with a film of gold/palladium alloy using an Emscope
SC400 sputter coating system at a 20 µA for 75 seconds under argon. Images of the
NP systems were also captured via a JEOL JEM-2100F transmission electron
43
microscope (TEM, Peabody, MA) for observation of the NP core and outer layers. 1
µL of 15 mg/mL NP suspension in water were placed on 200 square mesh copper
grids (Election Microscopy Sciences, Hatfield, PA) and air dried prior to imaging.
3.5.8 Differential Scanning Calorimetry (DSC) Analysis of Nanoparticles
Thermal phase transitions of the NP systems were analyzed using differential
scanning calorimetry (DSC) via a TA Q10 DSC system (TA Instruments, New Castle,
DE) connected to an RSC-90 cooling accessory. For dry-state DSC, samples were
lyophilized 24 hours prior to analysis. 1-3 mg of NP were analyzed at 10C/min from
0 to 300C. For wet state analysis, NP were dispersed in DI water (0.1 mM DPPS) and
15 µL of the NP suspension was added to aluminum pans to be analyzed at 2C/min
and from 5 to 65C. DSC analysis of the raw materials was also performed.
3.5.9 PVA Coating Quantification
Quantification of the amount of PVA on the surface of NP was completed
using a previously described method (206). NP samples were dispersed in DI water (1
mg/mL). 400 µL of sample solution, 300 µL of iodine solution (1.25 % iodine and
2.5% potassium iodide), and 1.5 mL of 4% boric acid solution were mixed together for
20 minutes at room temperature and 100 rpm. Absorbance of the samples was
measured at a wavelength of 630 nm.
44
3.5.10 Phospholipid Content Quantification
Phospholipid quantification was carried out using Stewart’s method (207).
Briefly, 2.7 g ferric chloride hexahydrate and 3 g ammonium thiocyanate were
dissolved in 100 mL of distilled water. NP samples were dissolved in chloroform (1
mg/mL) and were mixed with the ammonium ferrothiocyanate solution via vortexing
for 5 minutes at a 2:1 (v/v) ratio. After mixing, the solution was allowed to separate,
and the phospholipid content in the chloroform portion was measured via UV-vis
spectroscopy at 488 nm (DPPC/G) and 452 nm (DPPS).
3.5.11 In Vitro Drug Release from CUR NP
Release of CUR from the NP was carried out using a previously established
centrifugation technique (45). 1 mg/mL NP samples were dispersed in PBS (pH 7.4)
or sodium acetate buffer (pH 5.35) supplemented using 0.2% Tween® 80 to enhance
CUR solubility. The suspensions were incubated at 37C and 100 rpm and at
predetermined time points the suspensions were removed and centrifuged at 23,102 x
g for 15 minutes. 200 µL of the supernatant was collected and frozen at -20C and 200
µL of fresh medium was added to the particle solution prior to re-dispersion and re-
incubation. Release samples were mixed with DMSO (1:1 by volume) prior to
fluorescence spectroscopy analysis at an excitation of 420 nm and emission of 520 nm
(45).

45
3.5.12 Cell Culture
Murine macrophage cells (RAW 264.7) and A549 human adenocarcinoma
cells obtained from American Type Culture Collection (ATCC, Manassas, VA) were
used for cell culture studies. The cells were maintained at 37°C and 5% CO2 in
Dulbecco’s modified Eagle’s medium (DMEM) supplemented with 10% (v/v) fetal
bovine serum, 100 U/ml penicillin, 100 μg/ml streptomycin, Fungizone® (0.5 µg
amphotericin B, 0.41 µg/mL sodium deoxycholate), and 1 mM sodium pyruvate.
3.5.13 In Vitro Cytotoxicity Analysis of NP
The cytotoxic effect of the formulated NP on RAW 264.7 macrophages was
determined using a resazurin assay. Cells were seeded in 96-well plate at 5,000
cells/well and incubated overnight at 37 °C and were then exposed to varying
concentrations of PVA-CUR and DPPS-CUR NP (0.001 to 0.2 mg/ml). Untreated
cells were used as negative controls. After 48 hours, resazurin solution (60 μM) was
added to the cells and incubated for 3 hours. The fluorescence intensity of resorufin
produced by viable cells was detected at 544 nm (excitation) and 590 nm (emission)
using BioTek Cytation 3 plate reader. The relative viability of each sample was
calculated by:
46
3.5.14 Nitrite Analysis
A Griess assay was performed to determine nitric oxide (NO) production by
macrophages. Following 48-hour incubation with varying concentrations of NP (CUR-
loaded and blank), 96-well plates containing the samples were centrifuged and 50 μL
of the resulting supernatant was removed from each well. Griess reagents were added
per manufacturer’s instructions and the absorbance was measured at 550 nm. LPS
(500 ng/mL), was used to promote NO production as a control.
3.5.15 In Vitro Cellular Uptake Via Spectroscopy and Confocal Microscopy
Cellular uptake of CUR-loaded NP by RAW 264.7 and A549 cells was
observed using a Cytation 3 image reader (BioTek, Winooski, VT). Cells (7,500
cells/well) were seeded in a 96-well plate and incubated overnight at 37 °C. Cells were
then incubated with 0.1 mg/ml of NP solutions and equal concentration of CUR for 1
and 3 hours. After incubation, the media was removed, and the cells were washed
three times with 200 mM glycine to remove any unbound NP that were not taken up
by the cells. For quantification of cellular uptake, the fluorescence of the CUR within
the cells was analyzed via fluorescence spectroscopy at 420 nm (excitation) and 520
nm (emission).
RAW 264.7 and A549 cells were seeded into 35 mm glass-bottom petri dishes
at a concentration of 500,000 cells per dish and allowed to grow overnight. DPPS-
CUR NP, DPPC-CUR NP, or PVA-CUR NP were suspended and bath sonicated in
cell culture medium at 0.1 mg/mL and were then incubated with cells for 1 or 3 hours.
Cells were washed 3x in PBS and incubated in fresh media containing CellMask Deep
47
Red (Invitrogen) at 1 L/mL media for 10 minutes. Cells were then fixed with 4%
paraformaldehyde for 10 minutes and rinsed 3x with PBS. Fresh PBS was added and
cells were immediately imaged using a Nikon Eclipse Ti2 inverted confocal
fluorescent microscope.
3.5.16 Statistical Analysis
All measurements were performed in at least triplicate. Statistical differences
for in vitro cellular studies was determined using one-way or two-way ANOVA with
Tukey’s multiple comparisons test (GraphPad Prism version 7). For cumulative drug
release, Student’s t-Test was used to determine statistical differences. A p-value of <
0.05 or lower was considered as statistically significant. Values are presented as mean
standard deviation.
3.6 Results
3.6.1 Characterization of Ac-Dex Polymer and Nanoparticles
Analysis of the acetal coverage and cyclic-to-acyclic (CAC) ratio of Ac-Dex
following its synthesis was confirmed via NMR. The acetal coverage of Ac-Dex was
73%, whereas the CAC ratio was 45%. PVA-coated NP were synthesized using the
emulsion method to create NP with an Ac-Dex polymer core and PVA coating both
with and without curcumin loading (PVA-CUR NP and PVA-Blank NP, respectively).
As seen in Table 3.1, PVA-coated NP were 260-275 nm in diameter, exhibited
polydispersity index (PDI) values of 0.04, and had nearly neutral surface charges (less
than -3 mV), as seen from the zeta potential values.
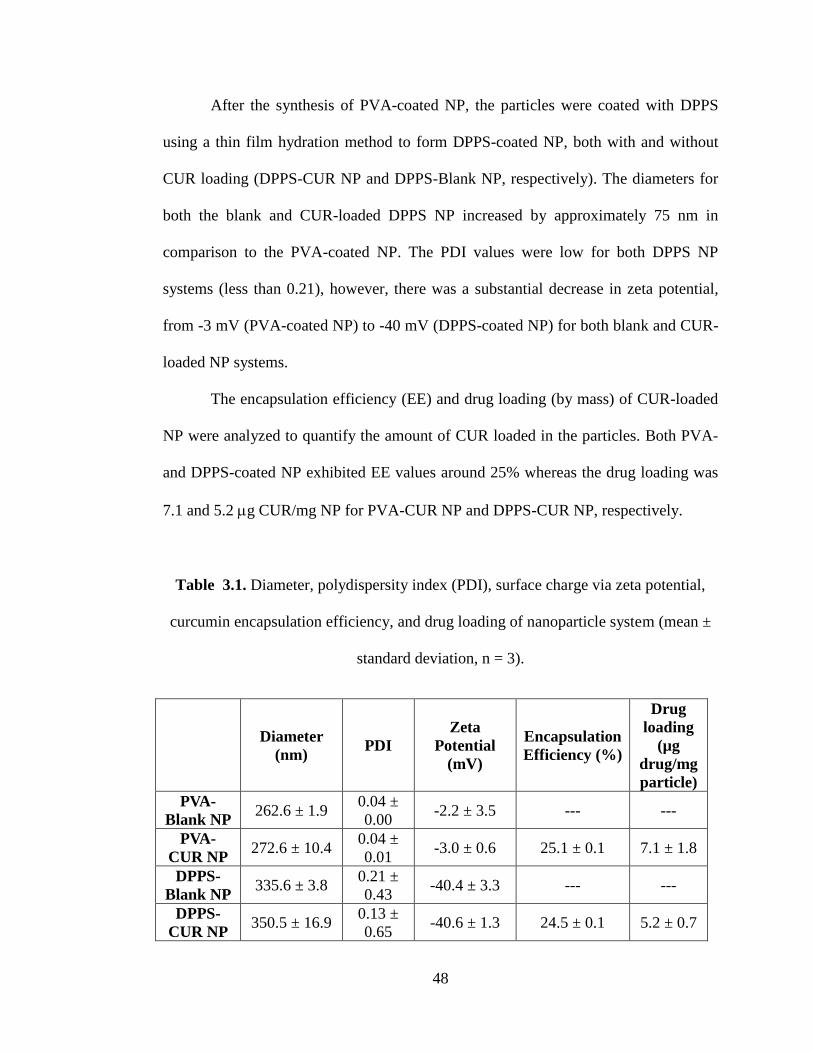
48
After the synthesis of PVA-coated NP, the particles were coated with DPPS
using a thin film hydration method to form DPPS-coated NP, both with and without
CUR loading (DPPS-CUR NP and DPPS-Blank NP, respectively). The diameters for
both the blank and CUR-loaded DPPS NP increased by approximately 75 nm in
comparison to the PVA-coated NP. The PDI values were low for both DPPS NP
systems (less than 0.21), however, there was a substantial decrease in zeta potential,
from -3 mV (PVA-coated NP) to -40 mV (DPPS-coated NP) for both blank and CUR-
loaded NP systems.
The encapsulation efficiency (EE) and drug loading (by mass) of CUR-loaded
NP were analyzed to quantify the amount of CUR loaded in the particles. Both PVA-
and DPPS-coated NP exhibited EE values around 25% whereas the drug loading was
7.1 and 5.2 g CUR/mg NP for PVA-CUR NP and DPPS-CUR NP, respectively.
Table 3.1. Diameter, polydispersity index (PDI), surface charge via zeta potential,
curcumin encapsulation efficiency, and drug loading of nanoparticle system (mean ±
standard deviation, n = 3).
Diameter
(nm) PDI
Zeta
Potential
(mV)
Encapsulation
Efficiency (%)
Drug
loading
(µg
drug/mg
particle)
PVA-
Blank NP 262.6 ± 1.9
0.04 ±
0.00 -2.2 ± 3.5 --- ---
PVA-
CUR NP 272.6 ± 10.4
0.04 ±
0.01 -3.0 ± 0.6 25.1 ± 0.1 7.1 ± 1.8
DPPS-
Blank NP 335.6 ± 3.8
0.21 ±
0.43 -40.4 ± 3.3 --- ---
DPPS-
CUR NP 350.5 ± 16.9
0.13 ±
0.65 -40.6 ± 1.3 24.5 ± 0.1 5.2 ± 0.7
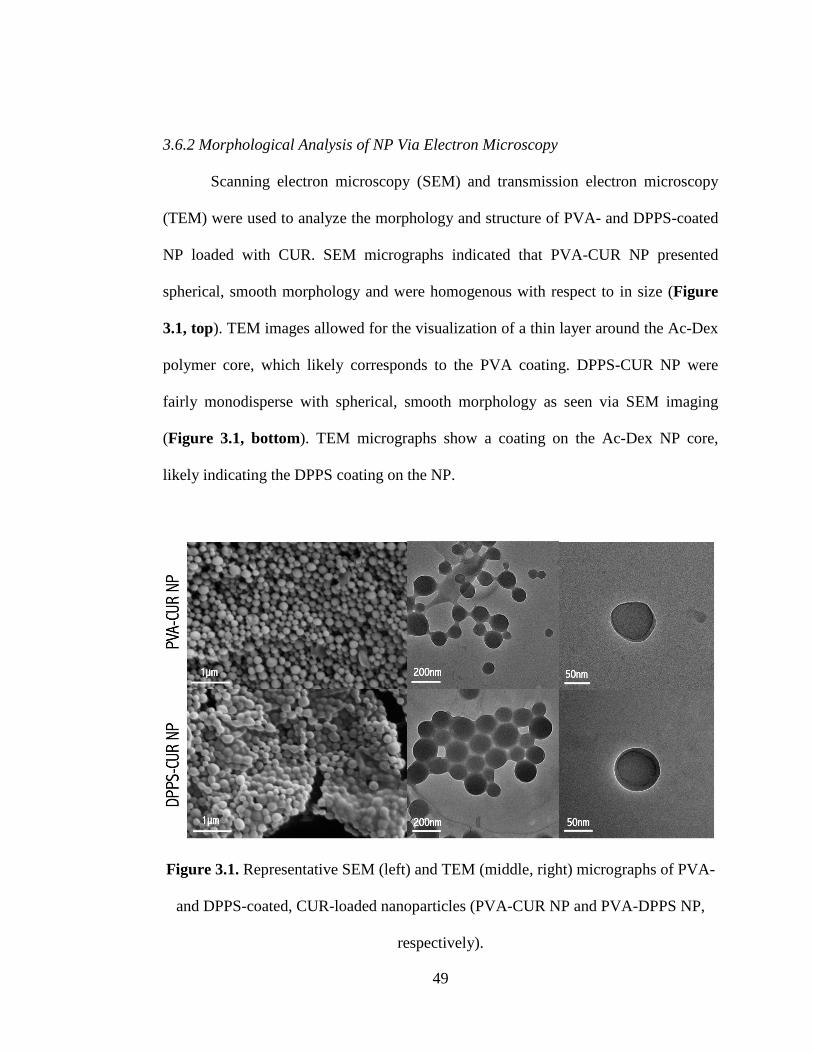
49
3.6.2 Morphological Analysis of NP Via Electron Microscopy
Scanning electron microscopy (SEM) and transmission electron microscopy
(TEM) were used to analyze the morphology and structure of PVA- and DPPS-coated
NP loaded with CUR. SEM micrographs indicated that PVA-CUR NP presented
spherical, smooth morphology and were homogenous with respect to in size (Figure
3.1, top). TEM images allowed for the visualization of a thin layer around the Ac-Dex
polymer core, which likely corresponds to the PVA coating. DPPS-CUR NP were
fairly monodisperse with spherical, smooth morphology as seen via SEM imaging
(Figure 3.1, bottom). TEM micrographs show a coating on the Ac-Dex NP core,
likely indicating the DPPS coating on the NP.
Figure 3.1. Representative SEM (left) and TEM (middle, right) micrographs of PVA-
and DPPS-coated, CUR-loaded nanoparticles (PVA-CUR NP and PVA-DPPS NP,
respectively).
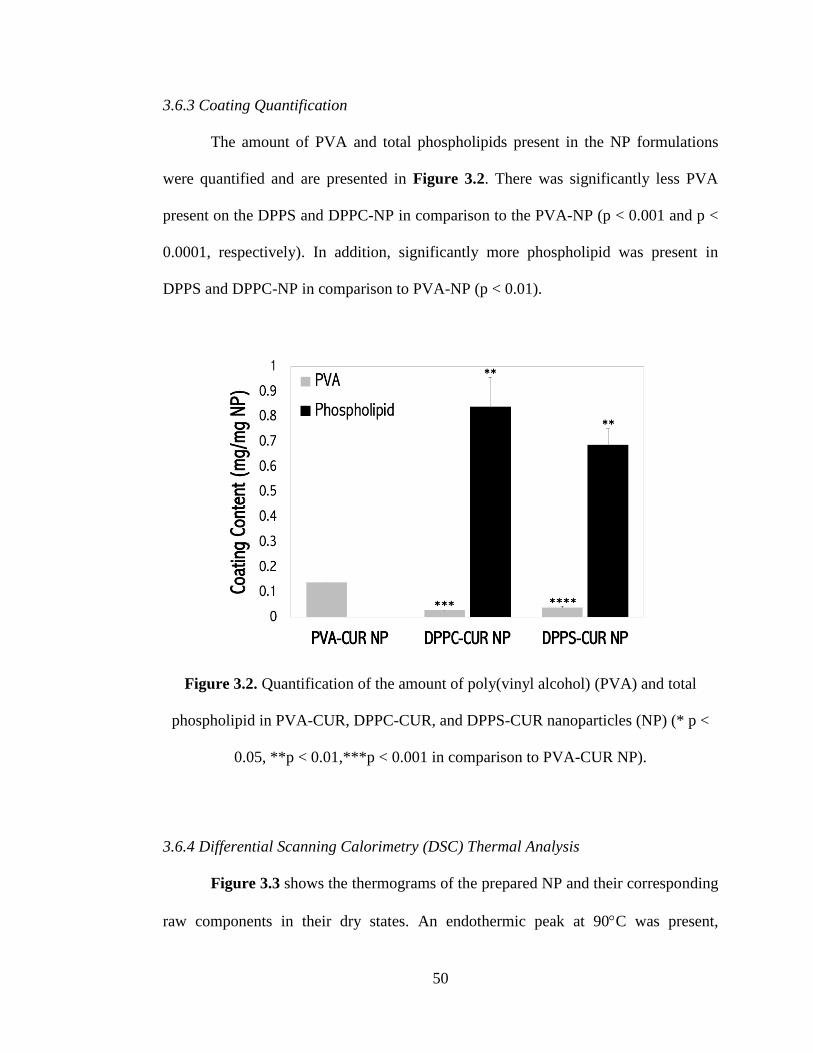
50
3.6.3 Coating Quantification
The amount of PVA and total phospholipids present in the NP formulations
were quantified and are presented in Figure 3.2. There was significantly less PVA
present on the DPPS and DPPC-NP in comparison to the PVA-NP (p < 0.001 and p <
0.0001, respectively). In addition, significantly more phospholipid was present in
DPPS and DPPC-NP in comparison to PVA-NP (p < 0.01).
Figure 3.2. Quantification of the amount of poly(vinyl alcohol) (PVA) and total
phospholipid in PVA-CUR, DPPC-CUR, and DPPS-CUR nanoparticles (NP) (* p <
0.05, **p < 0.01,***p < 0.001 in comparison to PVA-CUR NP).
3.6.4 Differential Scanning Calorimetry (DSC) Thermal Analysis
Figure 3.3 shows the thermograms of the prepared NP and their corresponding
raw components in their dry states. An endothermic peak at 90C was present,
51
indicating a bilayer phase transition for the DPPS-coated NP, which is slightly lower
than the endothermic phase transition temperature of raw DPPS at 99C. An
endothermic peak was present at 187C for raw PVA, whereas a broadened
endothermic peak was present at 195C for PVA-coated NP. Both raw CUR and Ac-
Dex exhibited endothermic peaks at 177C, signifying their melting points (45, 53,
54). These prominent endothermic peaks were not present in the formulated NP. The
shift from 177C to a broad peak at 195C for PVA-coated NP could be due to the
interaction between Ac-Dex and PVA. DPPS-coated NP exhibited a broad
endothermic peak at 165C, potentially due to the removal of the PVA and the
interaction between the Ac-Dex and DPPS. For wet-state DSC analysis of the
formulated NP, there were no measurable peaks present for the temperature range
used; curvature corresponded to the evaporation of water.
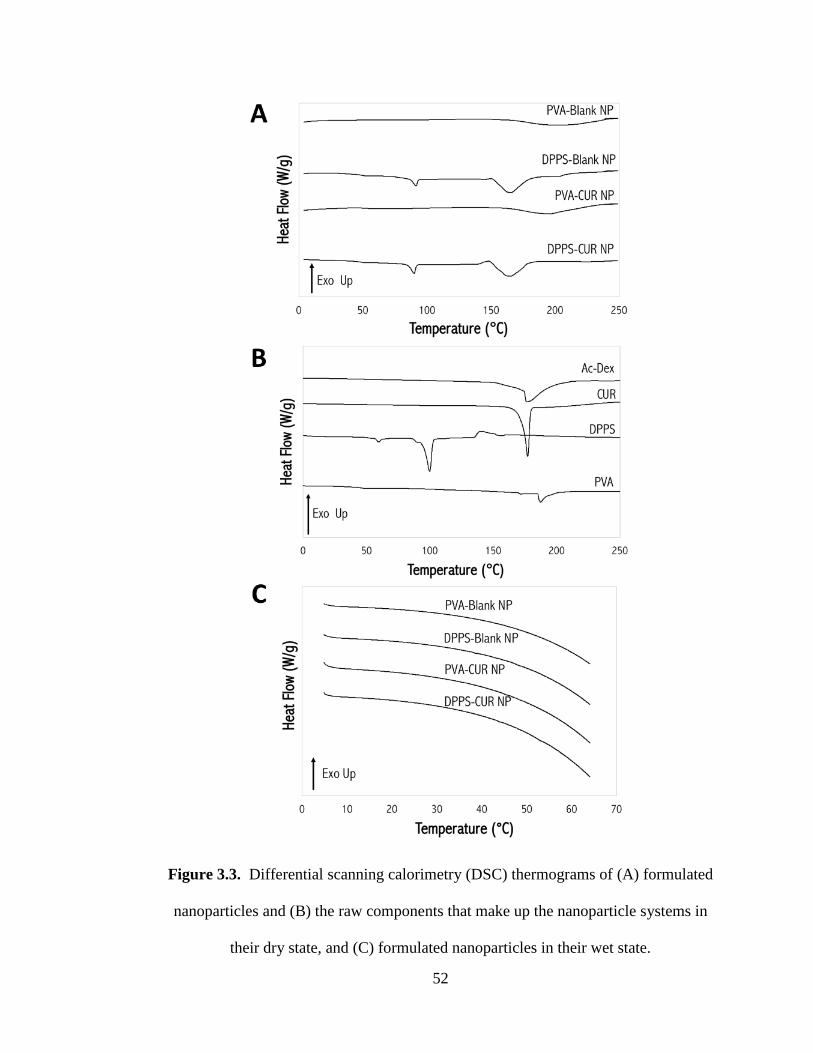
52
Figure 3.3. Differential scanning calorimetry (DSC) thermograms of (A) formulated
nanoparticles and (B) the raw components that make up the nanoparticle systems in
their dry state, and (C) formulated nanoparticles in their wet state.
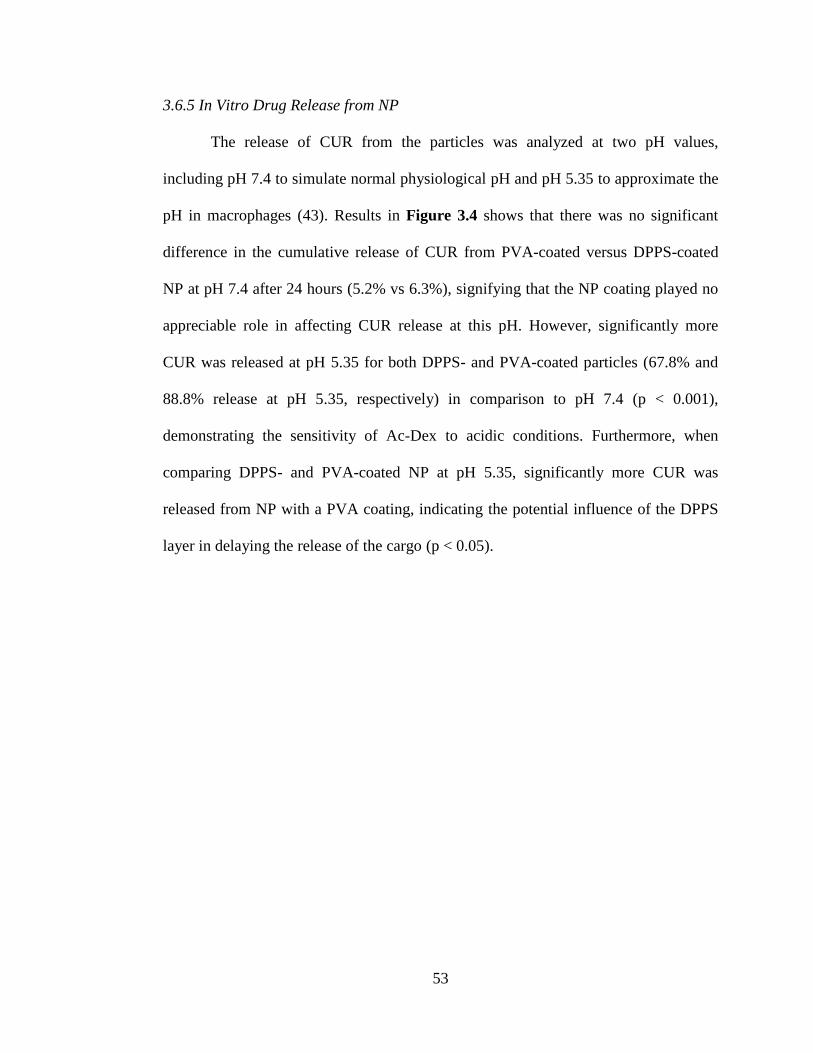
53
3.6.5 In Vitro Drug Release from NP
The release of CUR from the particles was analyzed at two pH values,
including pH 7.4 to simulate normal physiological pH and pH 5.35 to approximate the
pH in macrophages (43). Results in Figure 3.4 shows that there was no significant
difference in the cumulative release of CUR from PVA-coated versus DPPS-coated
NP at pH 7.4 after 24 hours (5.2% vs 6.3%), signifying that the NP coating played no
appreciable role in affecting CUR release at this pH. However, significantly more
CUR was released at pH 5.35 for both DPPS- and PVA-coated particles (67.8% and
88.8% release at pH 5.35, respectively) in comparison to pH 7.4 (p < 0.001),
demonstrating the sensitivity of Ac-Dex to acidic conditions. Furthermore, when
comparing DPPS- and PVA-coated NP at pH 5.35, significantly more CUR was
released from NP with a PVA coating, indicating the potential influence of the DPPS
layer in delaying the release of the cargo (p < 0.05).
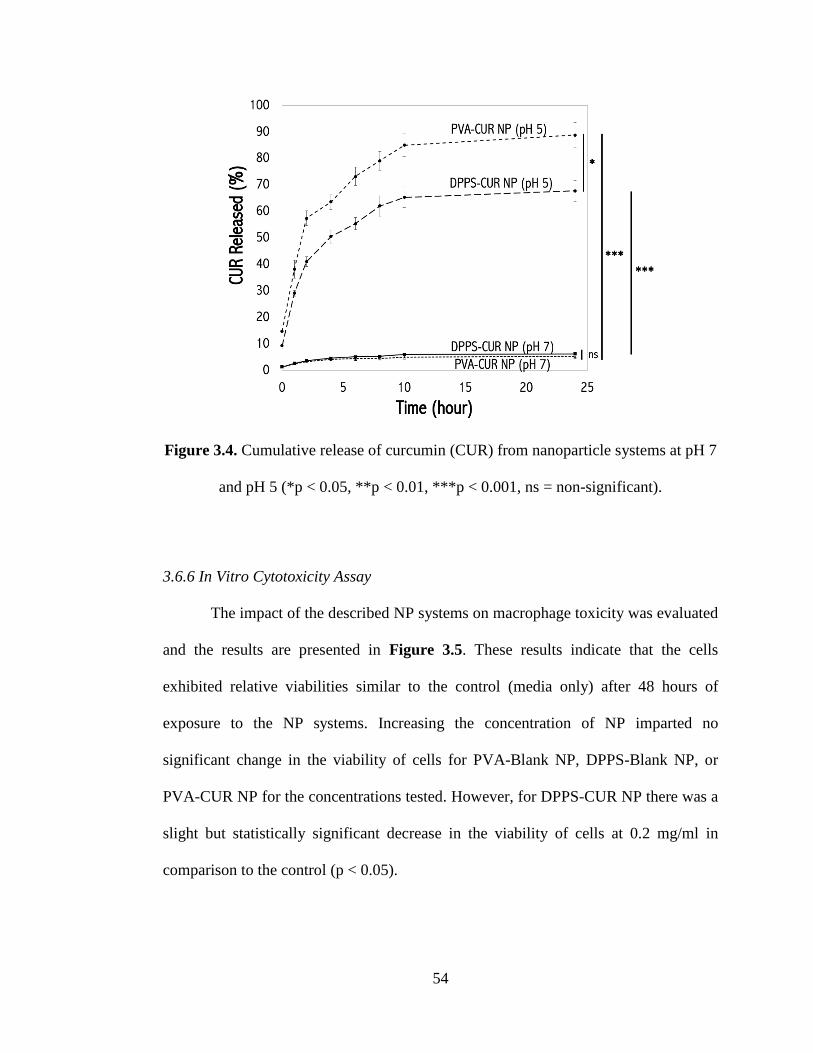
54
Figure 3.4. Cumulative release of curcumin (CUR) from nanoparticle systems at pH 7
and pH 5 (*p < 0.05, **p < 0.01, ***p < 0.001, ns = non-significant).
3.6.6 In Vitro Cytotoxicity Assay
The impact of the described NP systems on macrophage toxicity was evaluated
and the results are presented in Figure 3.5. These results indicate that the cells
exhibited relative viabilities similar to the control (media only) after 48 hours of
exposure to the NP systems. Increasing the concentration of NP imparted no
significant change in the viability of cells for PVA-Blank NP, DPPS-Blank NP, or
PVA-CUR NP for the concentrations tested. However, for DPPS-CUR NP there was a
slight but statistically significant decrease in the viability of cells at 0.2 mg/ml in
comparison to the control (p < 0.05).
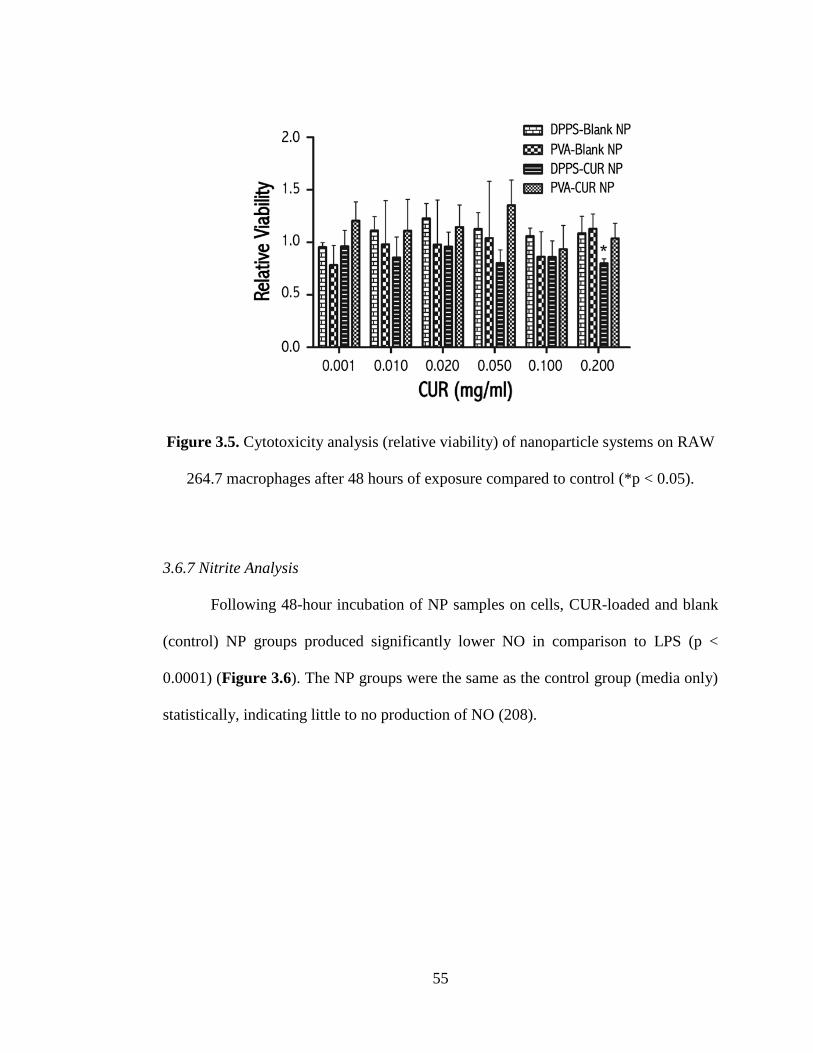
55
Figure 3.5. Cytotoxicity analysis (relative viability) of nanoparticle systems on RAW
264.7 macrophages after 48 hours of exposure compared to control (*p < 0.05).
3.6.7 Nitrite Analysis
Following 48-hour incubation of NP samples on cells, CUR-loaded and blank
(control) NP groups produced significantly lower NO in comparison to LPS (p <
0.0001) (Figure 3.6). The NP groups were the same as the control group (media only)
statistically, indicating little to no production of NO (208).
56
Figure 3.6. Nitric oxide (NO) production from RAW 264.7 macrophages incubated
for 48 hours with varying concentrations of nanoparticle formulations or LPS. No
statistical significance was observed between the groups and control group (no
treatment) and all were statistically lower than the LPS sample (p < 0.0001).
3.6.8 In Vitro Cellular Uptake
The cellular uptake of CUR-loaded NP was evaluated in RAW 264.7
macrophages and A549 adenocarcinoma cells for up to 3 hours as shown in Figure
3.7. Exploiting the fluorescent properties of CUR, the presence of CUR-loaded NP
within cells can easily be detected via fluorescence imaging and spectroscopy. After 1
hour of exposure, significantly more DPPS-coated NP were uptaken by macrophages
and A549 cells in comparison to PVA-coated NP, DPPC-coated NP, and raw CUR (p
< 0.0001). For both cell types and all formulations, uptake was not statistically
different between 1 and 3-hour exposures. In addition, significantly more NP were
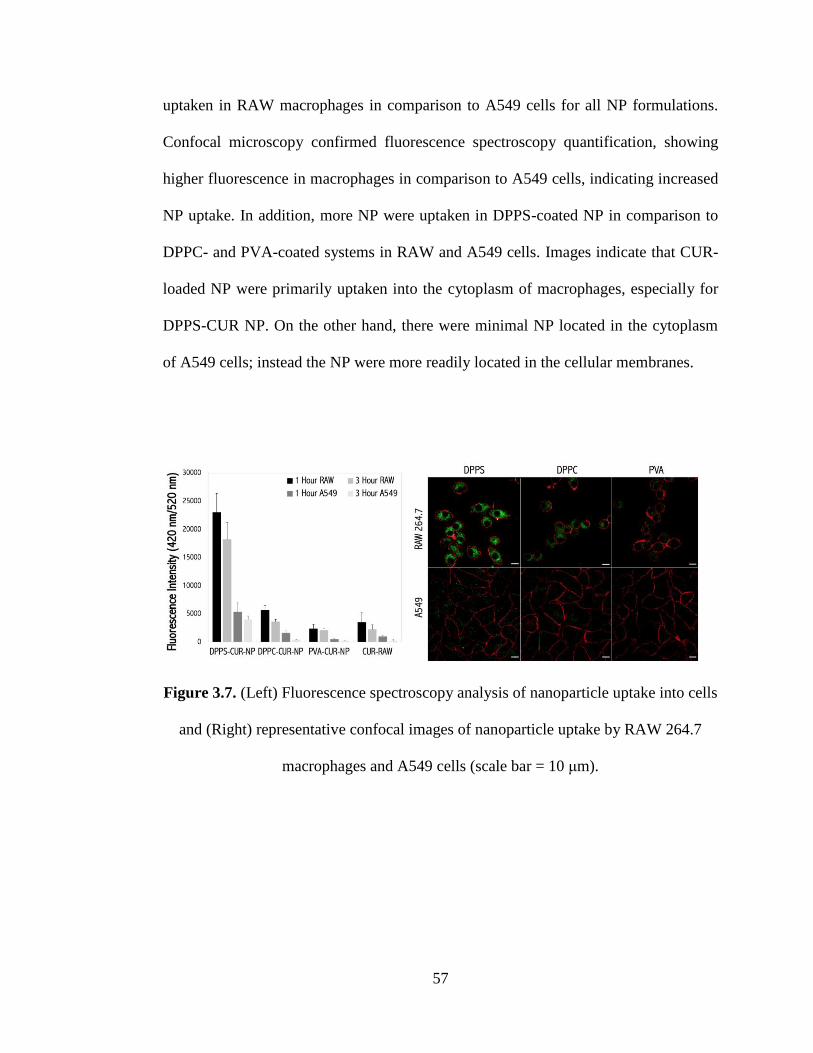
57
uptaken in RAW macrophages in comparison to A549 cells for all NP formulations.
Confocal microscopy confirmed fluorescence spectroscopy quantification, showing
higher fluorescence in macrophages in comparison to A549 cells, indicating increased
NP uptake. In addition, more NP were uptaken in DPPS-coated NP in comparison to
DPPC- and PVA-coated systems in RAW and A549 cells. Images indicate that CUR-
loaded NP were primarily uptaken into the cytoplasm of macrophages, especially for
DPPS-CUR NP. On the other hand, there were minimal NP located in the cytoplasm
of A549 cells; instead the NP were more readily located in the cellular membranes.
Figure 3.7. (Left) Fluorescence spectroscopy analysis of nanoparticle uptake into cells
and (Right) representative confocal images of nanoparticle uptake by RAW 264.7
macrophages and A549 cells (scale bar = 10 μm).
58
3.7 Discussion
3.7.1 Nanoparticle Design and Analysis
The use of Ac-Dex as a biodegradable NP core for drug delivery can allow for
a system with tunable and/or triggered degradation (19). For the described NP
systems, the acetal coverage of Ac-Dex was similar to previous studies (45, 53, 54),
whereas the CAC ratio was slightly lower. The resulting Ac-Dex was favorable for the
given application as the adequate acetal coverage imparts hydrophobicity to Ac-Dex,
allowing for NP formulation and the lower CAC ratio will allow for faster drug release
at acidic pH (45, 49, 53, 54).
The increase in diameter and PDI from PVA-coated NP to DPPS-coated NP is
likely due to the presence of the DPPS coating around the Ac-Dex core. It has been
shown that an increase in NP diameter can lead to an increase in the uptake of NP into
macrophages, where particles 200 nm in diameter or greater are often subjected to a
greater amount of macrophage uptake (57, 84, 209). For this study, larger NP were
desired and successfully formed (up to 350 nm for DPPS-coated NP), which was
advantageous since increased macrophage uptake was an objective (43). While DPPS-
coated NP exhibited higher PDI values then PVA-coated NP, these values were still
low, indicating that all of the formulated NP systems were homogenous with respect
to size.
The surface charge of the NP, as indicated by zeta potential, decreased
significantly (from -3 to -40 mV) upon coating with DPPS. The negative surface
charge on the DPPS-loaded NP is indicative of the polar head of DPPS being exposed
to the outer environment, similar to how apoptotic cells present DPPS to the outer
59
leaflet of cells prior to engulfment by macrophages (182, 197). The highly negatively
surface charge is significantly lower than the -25 mV threshold of being functionally
negative, indicating that the NP are less likely to aggregate due to electrostatic
repulsion (79, 80). It should be noted that DPPC-coated NP were also lower than the -
25 mV threshold, indicating a functionally negative charge. In addition, there were no
differences in size, PDI value, or zeta potential upon the loading of CUR on the NP
core, indicating that the loading of the model drug had no significant effect on the
particle systems with respect to these characteristics.
CUR was encapsulated in the NP for two purposes: 1) to provide a model
small molecule that is easy to encapsulate owing to its hydrophobicity and 2) the
inherent fluorescence of CUR within the NP allows for easy fluorescence imaging and
detection. The encapsulation efficiency (EE) of CUR in the NP was lower than
previously reported values, which have ranged from 50-88% (183, 185, 203).
However, since CUR was used as a model small molecule, the EE values were
satisfactory for this study. Upon coating the NP with DPPS, CUR loading decreased
slightly but the encapsulation efficiency stayed the same, indicating that the DPPS
coating did not significantly affect CUR loading.
The SEM and TEM micrographs indicate that the particles are spherical in
shape and monodisperse, which correlates to the PDI values for the systems. The
DPPS-CUR NP seem to have slightly more coating on the NP surfaces, which could
be due to the increased presence of DPPS.
60
3.7.2 Coating Quantification
DPPS was selected to coat the nanoparticles owing to its ability to stimulate an
“eat-me” signal on apoptotic cells (10, 82, 174, 175, 180). For cell studies, DPPC-NP
were produced as a control lipid system. Initially, the NP systems were coated with
PVA because it is one of the most widely used polymers in the pharmaceutical
industry (206) and has been extensively used as a NP coating agent due to the steric
effects PVA coating imparts on NP, inhibiting aggregation. During the synthesis of
phospholipid-coated NP, a significant portion of the PVA was washed away prior to
phospholipid coating, since there is significantly less PVA present on phospholipid-
coated NP in comparison to PVA NP (Figure 3.2). It is also likely that the
phospholipid coating shielded the remaining PVA upon adsorption to the NP surface,
as indicated by the low mass presence of PVA on phospholipid-coated NP the high
mass presence of total phospholipid on the NP, and the changes in surface charge
(Figure 3.2).
3.7.3 Thermal Analysis of Nanoparticle Formulations
Dry-state DSC thermograms indicated the presence of DPPS in the DPPS-
coated NP via the bilayer phase transition peak that occurred at 90C for the NP,
which is slightly lower than the raw DPPS endothermic peak present at 99C. This
transition signifies the presence of bilayer formation of the phospholipid around the
Ac-Dex polymer core in its dry state. The decrease in the transition temperature is
likely due to the interaction of the multiple components in the formulation. As the
transition temperatures of the NP formulations were just below or well above 100C,
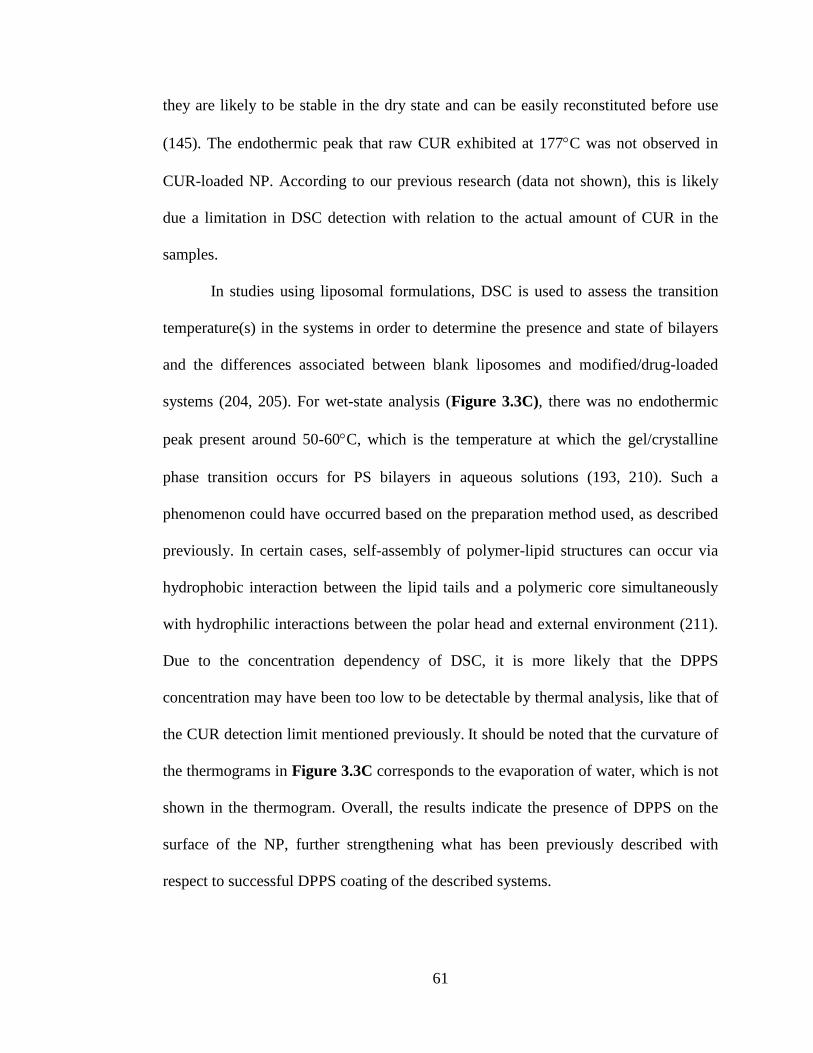
61
they are likely to be stable in the dry state and can be easily reconstituted before use
(145). The endothermic peak that raw CUR exhibited at 177C was not observed in
CUR-loaded NP. According to our previous research (data not shown), this is likely
due a limitation in DSC detection with relation to the actual amount of CUR in the
samples.
In studies using liposomal formulations, DSC is used to assess the transition
temperature(s) in the systems in order to determine the presence and state of bilayers
and the differences associated between blank liposomes and modified/drug-loaded
systems (204, 205). For wet-state analysis (Figure 3.3C), there was no endothermic
peak present around 50-60C, which is the temperature at which the gel/crystalline
phase transition occurs for PS bilayers in aqueous solutions (193, 210). Such a
phenomenon could have occurred based on the preparation method used, as described
previously. In certain cases, self-assembly of polymer-lipid structures can occur via
hydrophobic interaction between the lipid tails and a polymeric core simultaneously
with hydrophilic interactions between the polar head and external environment (211).
Due to the concentration dependency of DSC, it is more likely that the DPPS
concentration may have been too low to be detectable by thermal analysis, like that of
the CUR detection limit mentioned previously. It should be noted that the curvature of
the thermograms in Figure 3.3C corresponds to the evaporation of water, which is not
shown in the thermogram. Overall, the results indicate the presence of DPPS on the
surface of the NP, further strengthening what has been previously described with
respect to successful DPPS coating of the described systems.
62
3.7.4 Curcumin Release from Nanoparticles
The release from CUR from PVA- and DPPS-coated NP was evaluated to
demonstrate the ability of the system to provide sustained release of a therapeutic
agent and to show the acid-sensitive nature of Ac-Dex. Ac-Dex is known to degrade
more quickly in acidic environments (19). In a previous study, Ac-Dex particles
released 60% of their camptothecin payload after 7 days (49) and 15% of rapamycin
after 10 days (43) at pH of 7.4. Comparatively, at pH values of 5 or lower, Ac-Dex
particles released 100% of their content in as little as 24 hours (36, 43, 45). For this
study, at pH 5.35, 9.3% of CUR was initially released from DPPS-CUR NP and
29.2% was released after 1 hour, followed by a sustained release of cargo of 67.8%
after 24 hours, when equilibrium is reached. At pH 7.4, both NP systems exhibited
minimal CUR release, demonstrating the stability of Ac-Dex in neutral pH. However,
both systems exhibited triggered release at pH 5.35, exhibiting a significantly higher
total release in comparison to their pH 7.4 counterparts (p < 0.001). Overall, these data
indicate a more stable NP formulation at pH 7.4 and the potential for triggered release
at pH 5.35, corresponding to stability in circulation and burst release in macrophages,
respectively.
3.7.5 Cytotoxic Analysis and Macrophage Uptake of Nanoparticles
To assess the in vitro cytotoxicity of the NP formulations on RAW 264.7
macrophages, the cells were exposed to the systems for 48 hours. It was observed that
the NP systems were not toxic to the cells, however, a slight, but significant, decrease
in viability of RAW 264.7 cells for DPPS-CUR NP at 0.2 mg/ml was observed
63
(Figure 3.5). This decrease in viability was minimal and could easily be overcome by
using lower concentrations of the particles in future studies. Overall, these results
indicate the safety of the described NP for a time period longer than necessary for NP
uptake into macrophages, indicating that they are safe to use in the intended fashion.
Nanomaterials may provoke immune and inflammation responses following
interactions with multiple biological entities (57). To assess inflammatory and immune
response stimulation, NO production was measured using a Griess assay, where LPS
was used as a positive control to stimulate NO production in RAW macrophages. It
was observed that NP at varying concentrations stimulated significantly less NO
production in comparison to LPS and resulted in NO concentrations comparable to
that of the control (media only). Results indicated that blank NP caused NO
production at concentrations similar to that of the CUR-loaded NP. These data indicate
both blank and CUR-loaded formulations produced minimal NO and that CUR did not
play an active role in the inhibition of NO production.
Since the purpose of this study was to formulate acid-sensitive NP capable of
enhanced macrophage uptake, the ability of DPPS-coated NP to be uptaken by
macrophages was evaluated, with A549 cells acting as control tissue. PVA and DPPC-
coated NP were used as other coatings for comparison to DPPS. Several
environmental and physicochemical factors are known to influence the cellular uptake
of NP into macrophages. The preferential uptake of DPPS-CUR NP by macrophages
in comparison to PVA-CUR NP and DPPC-CUR NP is likely due to the DPPS coating
on the Ac-Dex polymeric core. Confocal microscopy in tandem with fluorescence
quantification of CUR-loaded NP within the cells confirm the uptake of DPPS-CUR-
64
NP and localization to the cytoplasm of macrophages. The presence of DPPS on the
cellular surface is known to cause an “eat-me” signal in cells that are transitioning
toward an apoptotic state, causing macrophages to identify and phagocytose the dying
cells (82, 173–175, 183). Therefore, in terms of recognition, the DPPS coating on the
Ac-Dex NP was identified by the macrophages, which produced the necessary
phagocytotic action, resulting in cellular uptake of the particles (10, 82, 182, 183, 194,
196). In most cases, apoptosis is initiated by the presence DPPS and other signaling
pathways such as receptor-ligand interactions or identification of PS binding proteins
produced by phagocytes. However, there is a debate as to whether DPPS recognition
by itself is sufficient for the uptake of apoptotic cells by phagocytotic cells (174, 194).
In the case of nanoparticles, is has been shown that a DPPS coating alone is sufficient
for uptake, as seen in this current study and otherwise (10, 180, 183).
Another consideration for cellular uptake of the described particles is in terms
of their physicochemical characteristics. Stimulation of phagocytosis of nanoparticle-
based delivery systems via macrophages is also dependent on the size and shape of the
particles. Since the DPPS-CUR NP were greater than 300 nm in diameter, it is likely
that these NP were phagocytosed not only because of the DPPS layer, but also because
of their size (43, 84, 212). It is well known that surface charge can play a role in
biological interactions. Interestingly, surface charge did not play a role in the uptake of
the NP, as shown by the similar charges of DPPC and DPPS-coated NP that produced
significantly different uptake quantities (79, 80, 84). This phenomenon could also
explain the minimal phagocytosis of the PVA-coated NP and confirm the effect of
DPPS on the uptake of the NP. Overall, the results indicate the successful uptake of
65
DPPS-coated NP into macrophages, indicating that these systems could be used for the
treatment of a multitude of diseases involving infected cells.
3.8 Conclusions
Macrophages can harbor infectious agents that lead to potentially fatal diseases
such as TB and HIV. Due to this, treatment of these diseases is challenging and
therefore, the goal of this study was to design a delivery system that would enhance
the uptake of nanoparticles into macrophages, allowing for targeted delivery, a
decrease of systemic side effects, and decreased treatment times. Results showed that
both PVA-coated and DPPS-coated NP were monodisperse and that there was a
significant increase in size upon DPPS coating. The surface charge of the DPPS NP
was -40 mV, indicating that DPPS was present on the surface of the NP. This was
further confirmed via PVA quantification, which indicated minimal amounts of PVA
on the DPPS NP. DSC results confirmed the presence of a DPPS bilayer on the NP
surface and the likely stability of the NP during synthesis and storage conditions.
CUR-loaded NP successfully encapsulated CUR and this agent was more quickly
released in acidic conditions in comparison to neutral pH owing to the acid sensitivity
of Ac-Dex. In addition, CUR-loaded NP exhibited sustained release of CUR. PVA-
coated NP were not readily phagocytosed by macrophages, whereas DPPS-coated NP
were phagocytosed within 1 hour of exposure, showing the physiological relevance of
the DPPS coating for the enhanced delivery to macrophages. These data show that the
particles can potentially deliver therapeutic agents throughout the body with fewer
concerns of systemic drug exposure, and when exposed to macrophages, the particles
66
are capable of being phagocytosed relatively quickly. Therefore, the combination of
Ac-Dex and DPPS can be a viable option for targeted delivery for macrophage-
associated diseases.
67
CHAPTER 4
SUSTAINED RELEASE OF WATER-SOLUBLE THERAPEUTICS VIA DRY
POWDER AEROSOL ACETALATED DEXTRAN MICROPARTICLES
Submitted for publication in Drug Development and Industrial Pharmacy in April
2019.
Nishan K. Shah1, Sweta K. Gupta2, Zimeng Wang2, Andrew Le Campion2, Samantha
A. Meenach1,2,*
1University of Rhode Island, College of Pharmacy, Department of Biomedical and
Pharmaceutical Sciences, Kingston, RI 02881
2University of Rhode Island, College of Engineering, Department of Chemical
Engineering, Kingston, RI 02881
68
4.1 Abstract
Objective: The objective of this study was to design and characterize aerosol
microparticles capable of providing sustained release of the model water-soluble
compound sulforhodamine B (SRB) in addition to achieving aerosol dispersion.
Significance: Modulating the release of water-soluble compounds remains an ongoing
challenge in pulmonary drug delivery
Methods: SRB was mixed with water to form an aqueous solution, while acetalated
dextran (Ac-Dex) was mixed with isopropyl alcohol to form an organic solution.
These two solutions were mixed together, resulting in the precipitation of SRB, and
the solution was spray dried to produce dry powder microparticles (MP). MP were
characterized for their morphology, size, release kinetics at different pH, aerosol
dispersion, and cellular interactions.
Results: Ac-Dex MP exhibited corrugated morphology with diameters around 1 m
and experimental mass median aerodynamic diameters from 2.06 to 2.86 m. With
respect to aerosol dispersion, the MP deposited in all stages of a Next Generation
Impactor, with > 90% fine particle fraction. MP exhibited encapsulation efficiencies >
129% with SRB loading values up to 16.7 g SRB/mg MP. Release kinetics
demonstrated sustained release of SRB at pH 7 and faster release at pH 5. In vitro
experiments showed minimal cytotoxicity, successful uptake of MP in epithelial cells,
and no disruption to the integrity of epithelial monolayers up MP exposure.
Conclusions: Overall, the Ac-Dex MP systems demonstrated the ability to provide
sustained the release of a water-soluble therapeutics in addition to aerosol delivery of
the particles to the lungs.
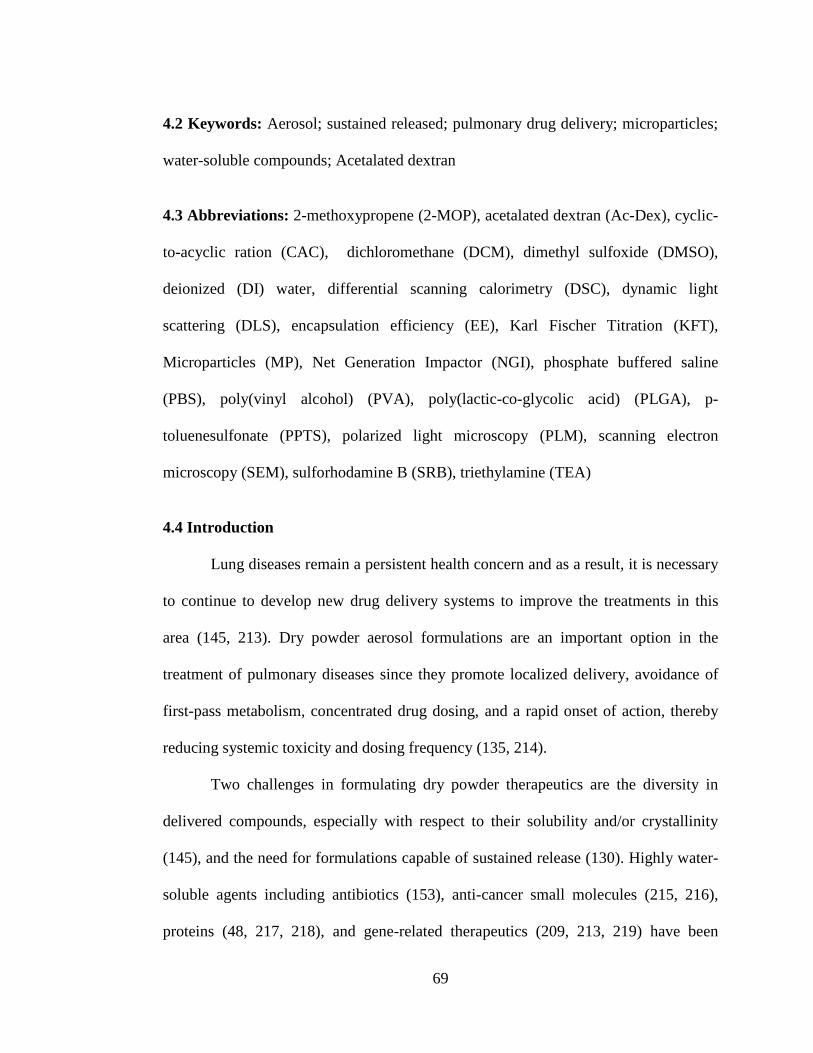
69
4.2 Keywords: Aerosol; sustained released; pulmonary drug delivery; microparticles;
water-soluble compounds; Acetalated dextran
4.3 Abbreviations: 2-methoxypropene (2-MOP), acetalated dextran (Ac-Dex), cyclic-
to-acyclic ration (CAC), dichloromethane (DCM), dimethyl sulfoxide (DMSO),
deionized (DI) water, differential scanning calorimetry (DSC), dynamic light
scattering (DLS), encapsulation efficiency (EE), Karl Fischer Titration (KFT),
Microparticles (MP), Net Generation Impactor (NGI), phosphate buffered saline
(PBS), poly(vinyl alcohol) (PVA), poly(lactic-co-glycolic acid) (PLGA), p-
toluenesulfonate (PPTS), polarized light microscopy (PLM), scanning electron
microscopy (SEM), sulforhodamine B (SRB), triethylamine (TEA)
4.4 Introduction
Lung diseases remain a persistent health concern and as a result, it is necessary
to continue to develop new drug delivery systems to improve the treatments in this
area (145, 213). Dry powder aerosol formulations are an important option in the
treatment of pulmonary diseases since they promote localized delivery, avoidance of
first-pass metabolism, concentrated drug dosing, and a rapid onset of action, thereby
reducing systemic toxicity and dosing frequency (135, 214).
Two challenges in formulating dry powder therapeutics are the diversity in
delivered compounds, especially with respect to their solubility and/or crystallinity
(145), and the need for formulations capable of sustained release (130). Highly water-
soluble agents including antibiotics (153), anti-cancer small molecules (215, 216),
proteins (48, 217, 218), and gene-related therapeutics (209, 213, 219) have been
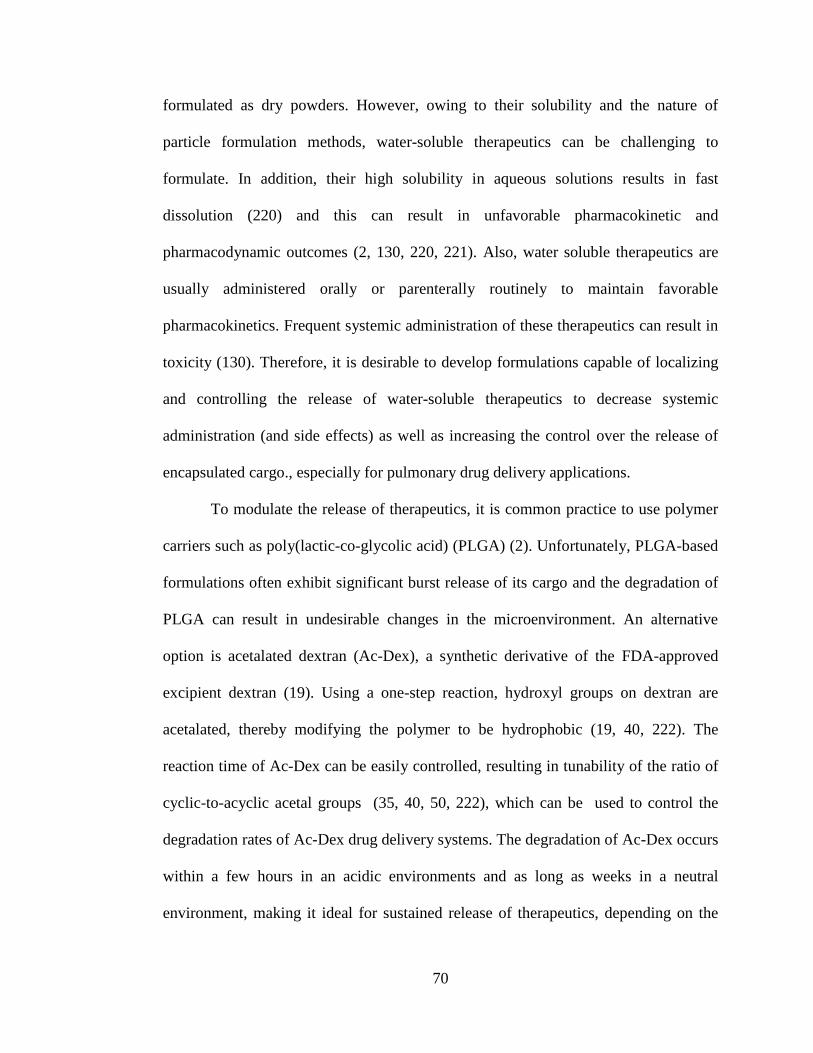
70
formulated as dry powders. However, owing to their solubility and the nature of
particle formulation methods, water-soluble therapeutics can be challenging to
formulate. In addition, their high solubility in aqueous solutions results in fast
dissolution (220) and this can result in unfavorable pharmacokinetic and
pharmacodynamic outcomes (2, 130, 220, 221). Also, water soluble therapeutics are
usually administered orally or parenterally routinely to maintain favorable
pharmacokinetics. Frequent systemic administration of these therapeutics can result in
toxicity (130). Therefore, it is desirable to develop formulations capable of localizing
and controlling the release of water-soluble therapeutics to decrease systemic
administration (and side effects) as well as increasing the control over the release of
encapsulated cargo., especially for pulmonary drug delivery applications.
To modulate the release of therapeutics, it is common practice to use polymer
carriers such as poly(lactic-co-glycolic acid) (PLGA) (2). Unfortunately, PLGA-based
formulations often exhibit significant burst release of its cargo and the degradation of
PLGA can result in undesirable changes in the microenvironment. An alternative
option is acetalated dextran (Ac-Dex), a synthetic derivative of the FDA-approved
excipient dextran (19). Using a one-step reaction, hydroxyl groups on dextran are
acetalated, thereby modifying the polymer to be hydrophobic (19, 40, 222). The
reaction time of Ac-Dex can be easily controlled, resulting in tunability of the ratio of
cyclic-to-acyclic acetal groups (35, 40, 50, 222), which can be used to control the
degradation rates of Ac-Dex drug delivery systems. The degradation of Ac-Dex occurs
within a few hours in an acidic environments and as long as weeks in a neutral
environment, making it ideal for sustained release of therapeutics, depending on the
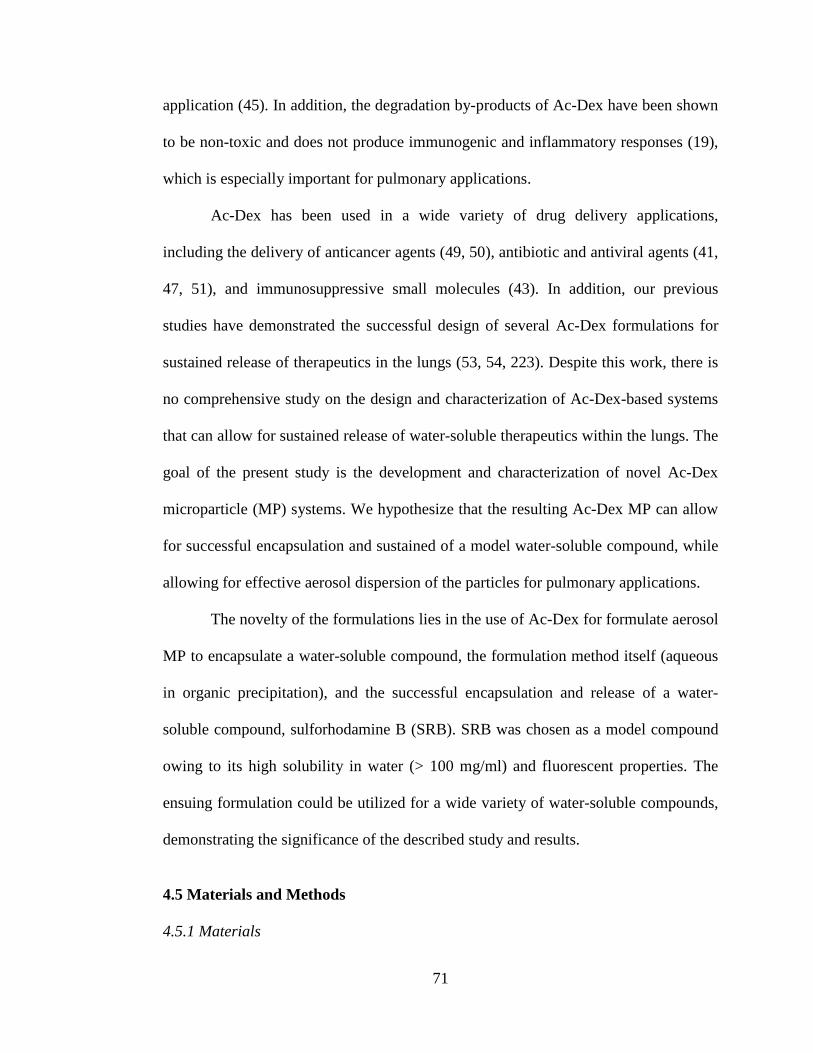
71
application (45). In addition, the degradation by-products of Ac-Dex have been shown
to be non-toxic and does not produce immunogenic and inflammatory responses (19),
which is especially important for pulmonary applications.
Ac-Dex has been used in a wide variety of drug delivery applications,
including the delivery of anticancer agents (49, 50), antibiotic and antiviral agents (41,
47, 51), and immunosuppressive small molecules (43). In addition, our previous
studies have demonstrated the successful design of several Ac-Dex formulations for
sustained release of therapeutics in the lungs (53, 54, 223). Despite this work, there is
no comprehensive study on the design and characterization of Ac-Dex-based systems
that can allow for sustained release of water-soluble therapeutics within the lungs. The
goal of the present study is the development and characterization of novel Ac-Dex
microparticle (MP) systems. We hypothesize that the resulting Ac-Dex MP can allow
for successful encapsulation and sustained of a model water-soluble compound, while
allowing for effective aerosol dispersion of the particles for pulmonary applications.
The novelty of the formulations lies in the use of Ac-Dex for formulate aerosol
MP to encapsulate a water-soluble compound, the formulation method itself (aqueous
in organic precipitation), and the successful encapsulation and release of a water-
soluble compound, sulforhodamine B (SRB). SRB was chosen as a model compound
owing to its high solubility in water (> 100 mg/ml) and fluorescent properties. The
ensuing formulation could be utilized for a wide variety of water-soluble compounds,
demonstrating the significance of the described study and results.
4.5 Materials and Methods
4.5.1 Materials
72
Detailed information on the materials can be found in Supplemental
Information.
4.5.2 Synthesis and characterization of acetalated dextran
Ac-Dex was synthesized using previously described methods with minor
modifications (45). 1 g of lyophilized dextran and 25-30 mg of PPTS were dissolved
in 10 mL of DMSO under nitrogen gas. The reaction was carried out for 5 minutes or
3 hours by adding 5 mL or 6.5 mL of 2-MOP, respectively. The reaction was
quenched with 1 mL of TEA. The polymer was precipitated in basic water (pH 9),
vacuum filtered, frozen overnight, and lyophilized. Corresponding to their degradation
rates, products of 5-minute and 3-hour reaction times are designated as Fast-Ac-Dex
and Slow-Ac-Dex, respectively. The cyclic-to-acyclic (CAC) ratio of Ac-Dex and
acetal coverage were verified using 1H NMR (Bruker 300 MHz, NMR, MA) as
previously described (45).
4.5.3 Microparticle synthesis via spray drying
MP systems were prepared via spray drying using a Büchi B-290 spray dryer
(Büchi Labortechnik, AG, Switzerland) in closed mode (organic solution; Ac-Dex MP
systems) or open mode (aqueous solution; mannitol system) as seen in Figure 4.1. It
should be noted that pure SRB was not spray dried in this study. Instead, SRB
encapsulated in mannitol was used as the control due to their combined water
solubility. For Ac-Dex MP, 1 mL of 4 mg/mL SRB solution in deionized (DI) water
was slowly injected into a spinning solution of 400 mg Ac-Dex in 20 mL of
isopropanol to create a water-organic (W/O) solution prior to spray drying, resulting in
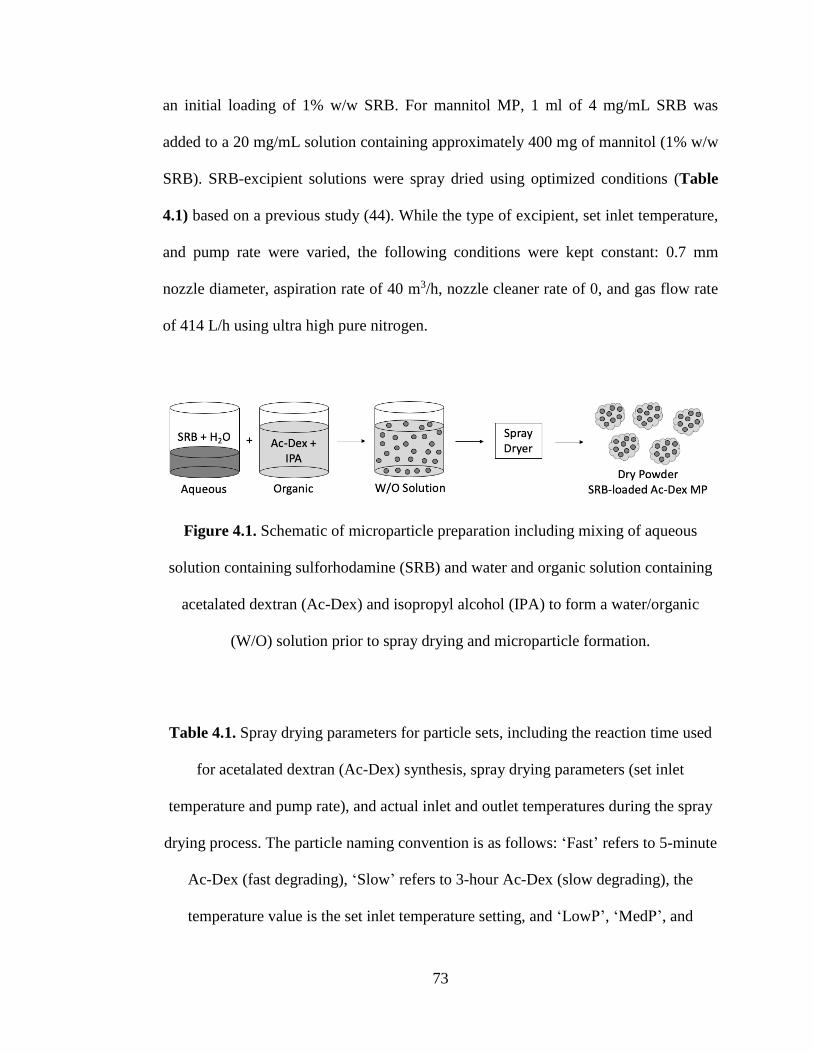
73
an initial loading of 1% w/w SRB. For mannitol MP, 1 ml of 4 mg/mL SRB was
added to a 20 mg/mL solution containing approximately 400 mg of mannitol (1% w/w
SRB). SRB-excipient solutions were spray dried using optimized conditions (Table
4.1) based on a previous study (44). While the type of excipient, set inlet temperature,
and pump rate were varied, the following conditions were kept constant: 0.7 mm
nozzle diameter, aspiration rate of 40 m3/h, nozzle cleaner rate of 0, and gas flow rate
of 414 L/h using ultra high pure nitrogen.
Figure 4.1. Schematic of microparticle preparation including mixing of aqueous
solution containing sulforhodamine (SRB) and water and organic solution containing
acetalated dextran (Ac-Dex) and isopropyl alcohol (IPA) to form a water/organic
(W/O) solution prior to spray drying and microparticle formation.
Table 4.1. Spray drying parameters for particle sets, including the reaction time used
for acetalated dextran (Ac-Dex) synthesis, spray drying parameters (set inlet
temperature and pump rate), and actual inlet and outlet temperatures during the spray
drying process. The particle naming convention is as follows: ‘Fast’ refers to 5-minute
Ac-Dex (fast degrading), ‘Slow’ refers to 3-hour Ac-Dex (slow degrading), the
temperature value is the set inlet temperature setting, and ‘LowP’, ‘MedP’, and
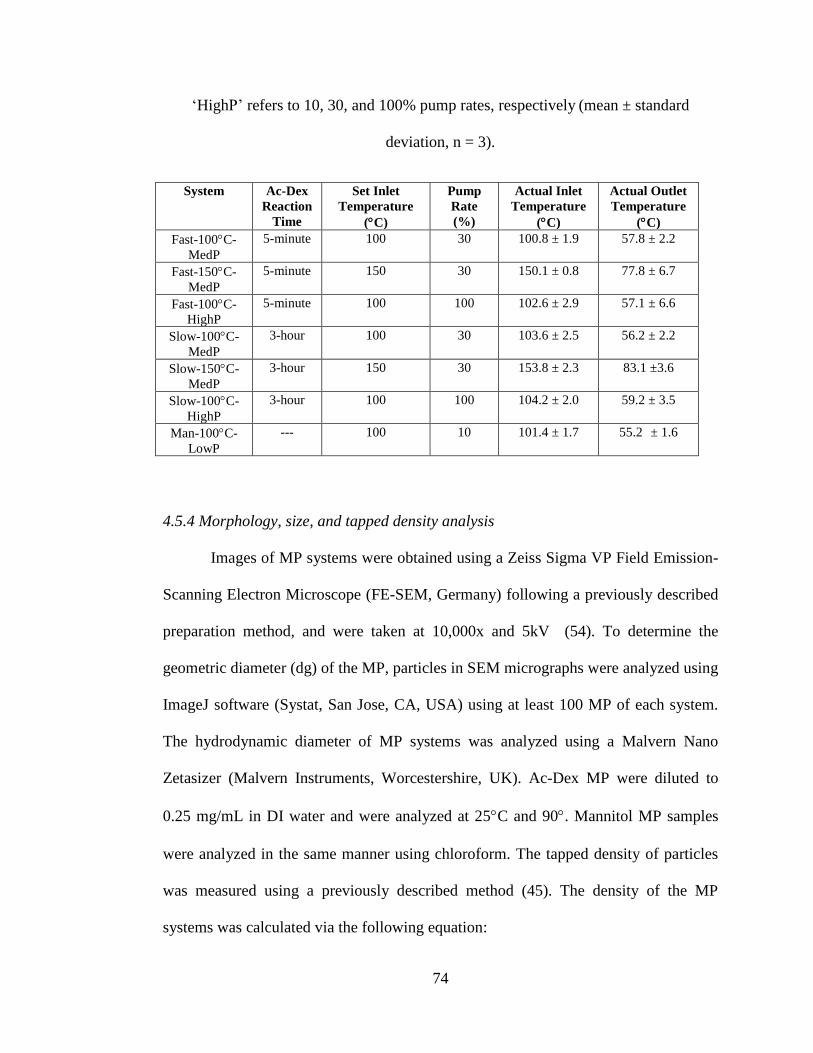
74
‘HighP’ refers to 10, 30, and 100% pump rates, respectively (mean ± standard
deviation, n = 3).
System Ac-Dex
Reaction
Time
Set Inlet
Temperature
(C)
Pump
Rate
(%)
Actual Inlet
Temperature
(C)
Actual Outlet
Temperature
(C)
Fast-100C-
MedP
5-minute 100 30 100.8 ± 1.9 57.8 ± 2.2
Fast-150C-
MedP
5-minute 150 30 150.1 ± 0.8 77.8 ± 6.7
Fast-100C-
HighP
5-minute 100 100 102.6 ± 2.9 57.1 ± 6.6
Slow-100C-
MedP
3-hour 100 30 103.6 ± 2.5 56.2 ± 2.2
Slow-150C-
MedP
3-hour 150 30 153.8 ± 2.3 83.1 ±3.6
Slow-100C-
HighP
3-hour 100 100 104.2 ± 2.0 59.2 ± 3.5
Man-100C-
LowP
--- 100 10 101.4 ± 1.7 55.2 ± 1.6
4.5.4 Morphology, size, and tapped density analysis
Images of MP systems were obtained using a Zeiss Sigma VP Field Emission-
Scanning Electron Microscope (FE-SEM, Germany) following a previously described
preparation method, and were taken at 10,000x and 5kV (54). To determine the
geometric diameter (dg) of the MP, particles in SEM micrographs were analyzed using
ImageJ software (Systat, San Jose, CA, USA) using at least 100 MP of each system.
The hydrodynamic diameter of MP systems was analyzed using a Malvern Nano
Zetasizer (Malvern Instruments, Worcestershire, UK). Ac-Dex MP were diluted to
0.25 mg/mL in DI water and were analyzed at 25C and 90. Mannitol MP samples
were analyzed in the same manner using chloroform. The tapped density of particles
was measured using a previously described method (45). The density of the MP
systems was calculated via the following equation:
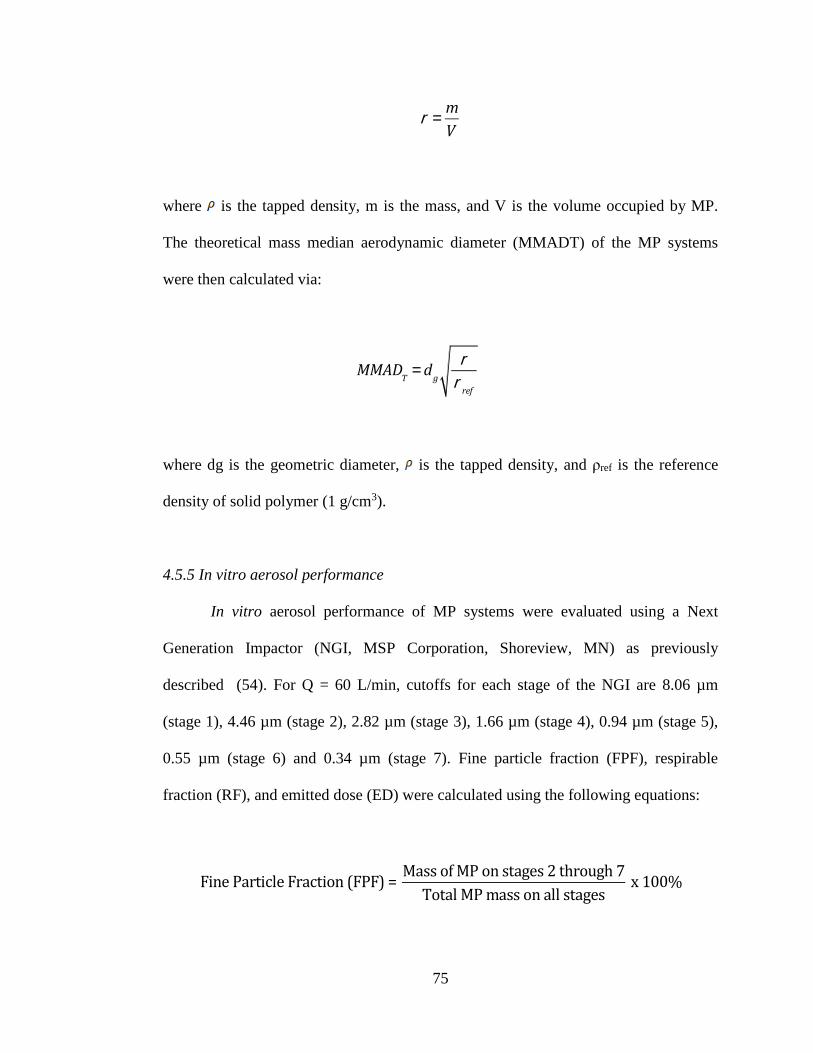
75
r =
m
V
where is the tapped density, m is the mass, and V is the volume occupied by MP.
The theoretical mass median aerodynamic diameter (MMADT) of the MP systems
were then calculated via:
MMADT
= dg
r
rref
where dg is the geometric diameter, is the tapped density, and ρref is the reference
density of solid polymer (1 g/cm3).
4.5.5 In vitro aerosol performance
In vitro aerosol performance of MP systems were evaluated using a Next
Generation Impactor (NGI, MSP Corporation, Shoreview, MN) as previously
described (54). For Q = 60 L/min, cutoffs for each stage of the NGI are 8.06 µm
(stage 1), 4.46 µm (stage 2), 2.82 µm (stage 3), 1.66 µm (stage 4), 0.94 µm (stage 5),
0.55 µm (stage 6) and 0.34 µm (stage 7). Fine particle fraction (FPF), respirable
fraction (RF), and emitted dose (ED) were calculated using the following equations:
FineParticleFraction(FPF)=MassofMPonstages2through7
TotalMPmassonallstagesx100%
76
RespirableFraction(RF)=MassofMPonstages2through7
InitialMPmassloadedintocapsulesx100%
EmittedDose(ED)=
InitialMPmassincapsules-FinalMPmassincapsules
InitialMPmassincapsulesx100%
The experimental mass median aerodynamic diameter (MMADE) and geometric
standard deviation (GSD) for the MP systems were determined using a Mathematica®
program written by Dr. Warren Finlay (224).
4.5.6 Crystallinity and phase transition analysis
Thermal phase transitions of MP systems and raw materials were analyzed via
differential scanning calorimetry (DSC) using a TA Q10 DSC system (TA
Instruments, New Castle, DE) connected to an RSC-90 cooling accessory. 3-5 mg of
sample were hermetically sealed in aluminum pans and were placed into the DSC
furnace. Samples were heated from 0-200°C at a rate of 10°/min (45). The crystallinity
of MP systems and raw materials were examined by X-ray diffraction (XRD) using a
Rigaku Multiflex X-ray diffractometer (The Woodlands, TX) as described previously
with a scan range of 5-60° in 2Θ with a width of 0.1 and scan rate of 1°/min. (45).
Images of MP systems and raw materials were observed for birefringence via
polarized light microscopy (PLM) using an AmScope polarized microscope (Irvine,
CA) (225). Samples were mounted onto microscope slides, smeared with mineral oil
for dispersion, and imaged at 10x magnification at room temperature.
77
4.5.7 Analysis of water content via Karl Fischer titration
Water content of the MP systems was quantified via Karl Fischer (KF) titration
using a 737 KF coulometer (Metrohm, Riverview, FL, USA). 3 mg of powder was
dissolved in methanol and the resulting solution was injected into the KF cell filled
with Hydranal® and the amount of water was analyzed. Pure solvent was also injected
as a background sample.
4.5.8 Encapsulation efficiency and drug loading analysis
To determine the amount of SRB encapsulated in the MP systems, MP were
dissolved in methanol or deionized water (1 mg/mL) and quantified via fluorescence
spectroscopy using a Cytation 3 plate reader (BioTek, Winooski, VT, USA) at
565/586 nm (ex/em) (226). The encapsulation efficiency (EE) and drug loading (DL)
of MP were calculated using the following equations:
EE=
Actualmassof SRBinMP
Theoreticalmassof SRBinMPx100%
DL=
Massof SRBinMP
Mass inMP
4.5.9 Drug release and release kinetic analysis
Release of SRB from MP was carried out using a centrifugation technique. 10
mg/mL samples were created by dispersing MP in phosphate buffered solution (PBS,
78
pH 7.4) or sodium acetate buffer (pH 5.35). The suspensions were incubated at 37C
and 100 rpm and centrifuged at 23,102 x g for 5 minutes at predetermined time points.
400 µL of the supernatant was collected and frozen at -20C and 400 µL of fresh
buffer was added to the particle solution prior to re-dispersion. Supernatant samples
were supplemented with equal parts methanol or water to solubilize any remaining
excipient. Analysis was carried out via fluorescence spectroscopy and normalized
SRB release was calculated as follows:
NormalizedSRBRelease=MassReleasedatt=time
TotalMassReleasedx100%
Drug release kinetics of SRB released from the MP were evaluated using six
different models, including: zero-order, first-order, Higuchi, Korsmeyer-Peppas (a.k.a.
the power law), Peppas-Sahlin, and Corrigan. The model parameters and coefficient of
determination (R2) for each model were determined using least squares regression. For
zero-order, first-order, Higuchi, and Korsmeyer-Peppas models, the equations were
linearized, and the slope, intercept, and R2 values were determined using the ‘linest’
function in Microsoft Excel prior to calculation of the model parameters. For Peppas-
Sahlin and Corrigan, the model parameters and R2 values were determined using the
‘fminsearch’ function in MATLAB. A detailed description of the release models and
parameters can be found in Supplemental Information.
4.5.10 Cell Culture
79
A549, H441, and Calu-3 cells were obtained from ATCC (Manassas, Va,
USA). A549 cells were maintained at 37°C and 5% CO2 in Dulbecco’s modified
Eagle’s medium (DMEM) supplemented with 10% (v/v) fetal bovine serum, 100 U/ml
penicillin, 100 μg/ml streptomycin, Fungizone® (0.5 µg amphotericin B, 0.41 µg/mL
sodium deoxycholate), and 1 mM sodium pyruvate. H441 and Calu-3 cells were
maintained in RPMI and MEM media, respectively, with the same additives as
DMEM.
4.5.11 Cellular uptake
To observe inherent cellular uptake of MP systems, A549, H441, and Calu-3
cells were incubated with MP and observed using a Cytation 3 image reader (BioTek,
Winooski, VT, USA). Cells (5,000 cells/well) were seeded in a 24-well plate and
incubated overnight at 37 °C. Cells were incubated with MP containing 10 μM SRB
for 3 hours. After incubation, media was removed, and the cells were washed twice
with 1x PBS to remove any unbound MP. To visualize cellular uptake, images were
captured using fluorescence imaging. For quantification of cellular uptake, the
presence of the SRB within the cells was analyzed via fluorescence spectroscopy at
565/586 nm (ex/em).
4.5.12 In vitro cytotoxicity assay
The cytotoxic effect of the formulated MP on A549 cells was determined.
Cells were seeded in 96-well plate at 5,000 cells/well and incubated overnight. The
following day, cells were exposed to varying concentrations of SRB (0.01 to 10 μM)
80
from formulated MP and cytotoxicity was assessed. 60 μM resazurin was added to the
cells and incubated for 3 hours. The fluorescence intensity of resorufin produced by
viable cells was detected at 544 nm (excitation) and 590 nm (emission). The relative
viability of each sample was calculated by:
RelativeViability=SampleFluorescenceIntensity
ControlFluorescenceIntensityx100%
4.5.13 In vitro transepithelial electrical resistance of lung epithelial cells exposed to
MP
H441 cells were used for transepithelial electrical resistant (TEER) analysis
following microparticle exposure. Cells were seeded at 1 x 10⁵ cells/ml in well plates
with 12 mm Transwells® having 0.4 µm pore size (Corning Incorporated, Corning,
NY, USA) with 1.5 mL of media on the basolateral side and 0.5 mL of media on the
apical side. On day 3, the cells were transitioned to air-interface conditions (AIC) with
0.5 mL of media on the basolateral side and no media on the apical side. Prior to
TEER measurements, 0.5 ml of media was added to the apical side of the Transwell
and the resistance was measured using an EVOM voltohmmeter with an STX2
electrode (World Precision Instruments, INC., Sarasota, FL, USA). Once the
resistance stabilized to 100 Ω cm2, indicating a confluent monolayer, the cells were
exposed to 1 mg of the microparticles. Resistance measurements were taken for five
days after exposure and the TEER of cells exposed to particles was compared to the
control cells to calculate the percent TEER response as follows:
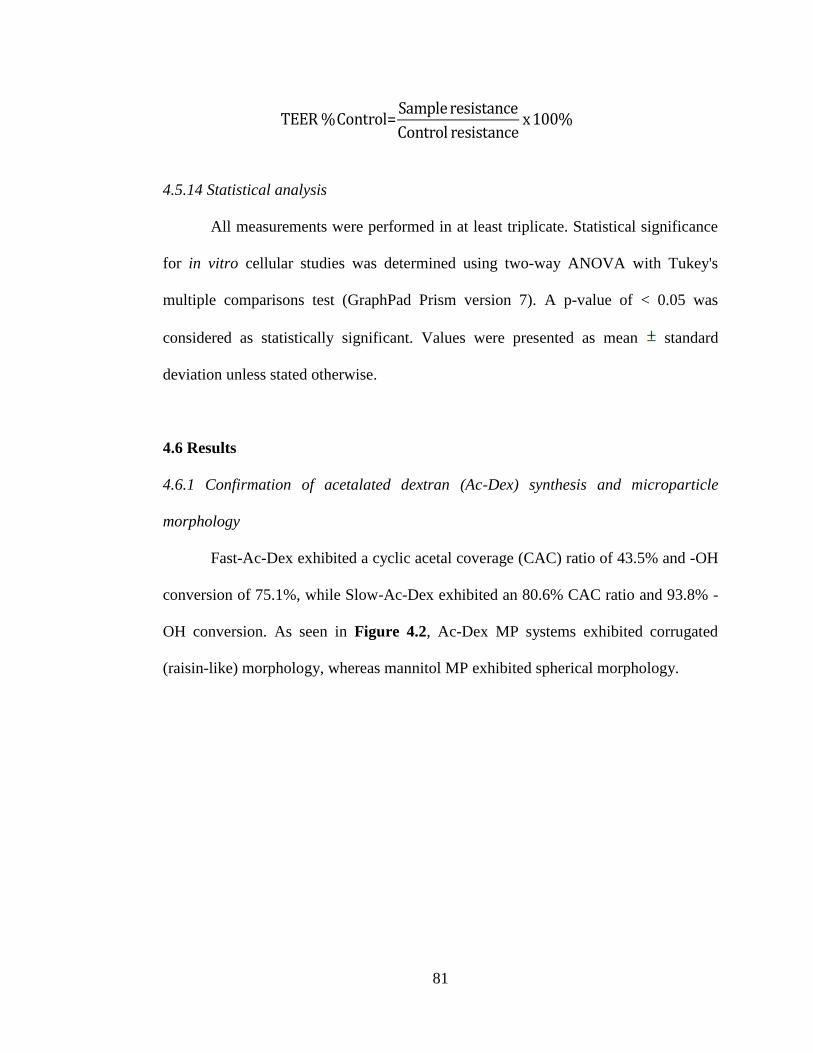
81
TEER%Control=
Sampleresistance
Control resistancex100%
4.5.14 Statistical analysis
All measurements were performed in at least triplicate. Statistical significance
for in vitro cellular studies was determined using two-way ANOVA with Tukey's
multiple comparisons test (GraphPad Prism version 7). A p-value of < 0.05 was
considered as statistically significant. Values were presented as mean standard
deviation unless stated otherwise.
4.6 Results
4.6.1 Confirmation of acetalated dextran (Ac-Dex) synthesis and microparticle
morphology
Fast-Ac-Dex exhibited a cyclic acetal coverage (CAC) ratio of 43.5% and -OH
conversion of 75.1%, while Slow-Ac-Dex exhibited an 80.6% CAC ratio and 93.8% -
OH conversion. As seen in Figure 4.2, Ac-Dex MP systems exhibited corrugated
(raisin-like) morphology, whereas mannitol MP exhibited spherical morphology.
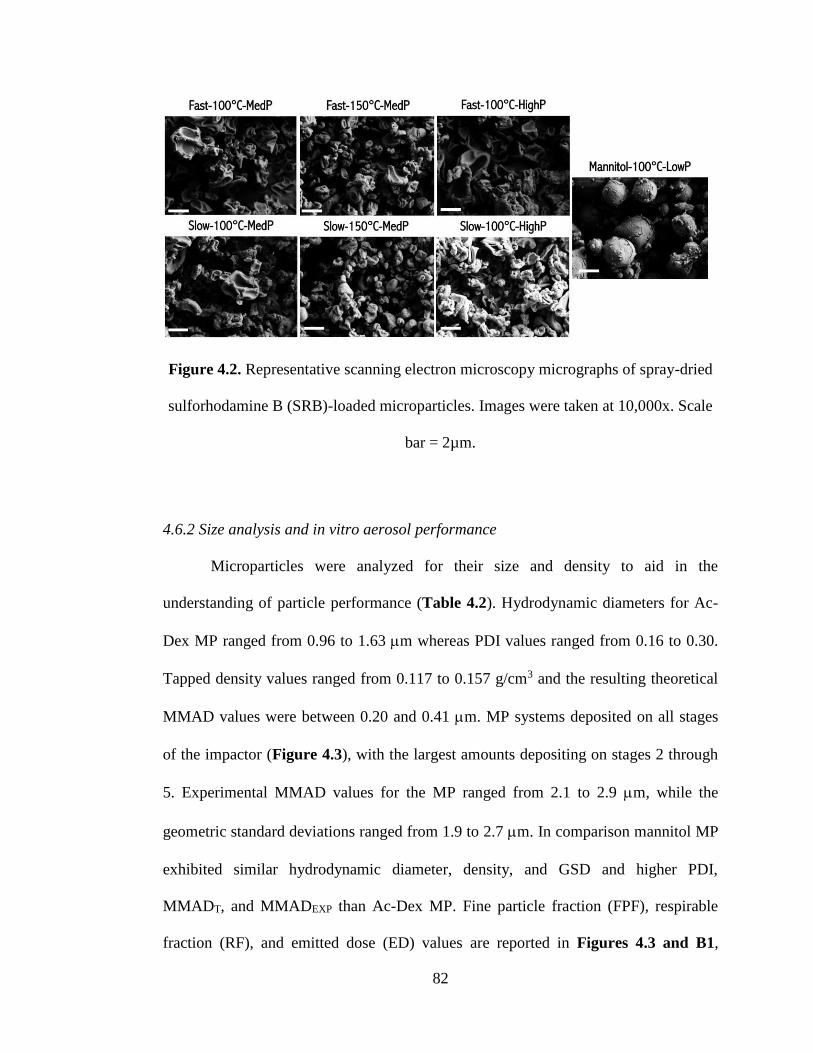
82
Figure 4.2. Representative scanning electron microscopy micrographs of spray-dried
sulforhodamine B (SRB)-loaded microparticles. Images were taken at 10,000x. Scale
bar = 2µm.
4.6.2 Size analysis and in vitro aerosol performance
Microparticles were analyzed for their size and density to aid in the
understanding of particle performance (Table 4.2). Hydrodynamic diameters for Ac-
Dex MP ranged from 0.96 to 1.63 m whereas PDI values ranged from 0.16 to 0.30.
Tapped density values ranged from 0.117 to 0.157 g/cm3 and the resulting theoretical
MMAD values were between 0.20 and 0.41 m. MP systems deposited on all stages
of the impactor (Figure 4.3), with the largest amounts depositing on stages 2 through
5. Experimental MMAD values for the MP ranged from 2.1 to 2.9 m, while the
geometric standard deviations ranged from 1.9 to 2.7 m. In comparison mannitol MP
exhibited similar hydrodynamic diameter, density, and GSD and higher PDI,
MMADT, and MMADEXP than Ac-Dex MP. Fine particle fraction (FPF), respirable
fraction (RF), and emitted dose (ED) values are reported in Figures 4.3 and B1,
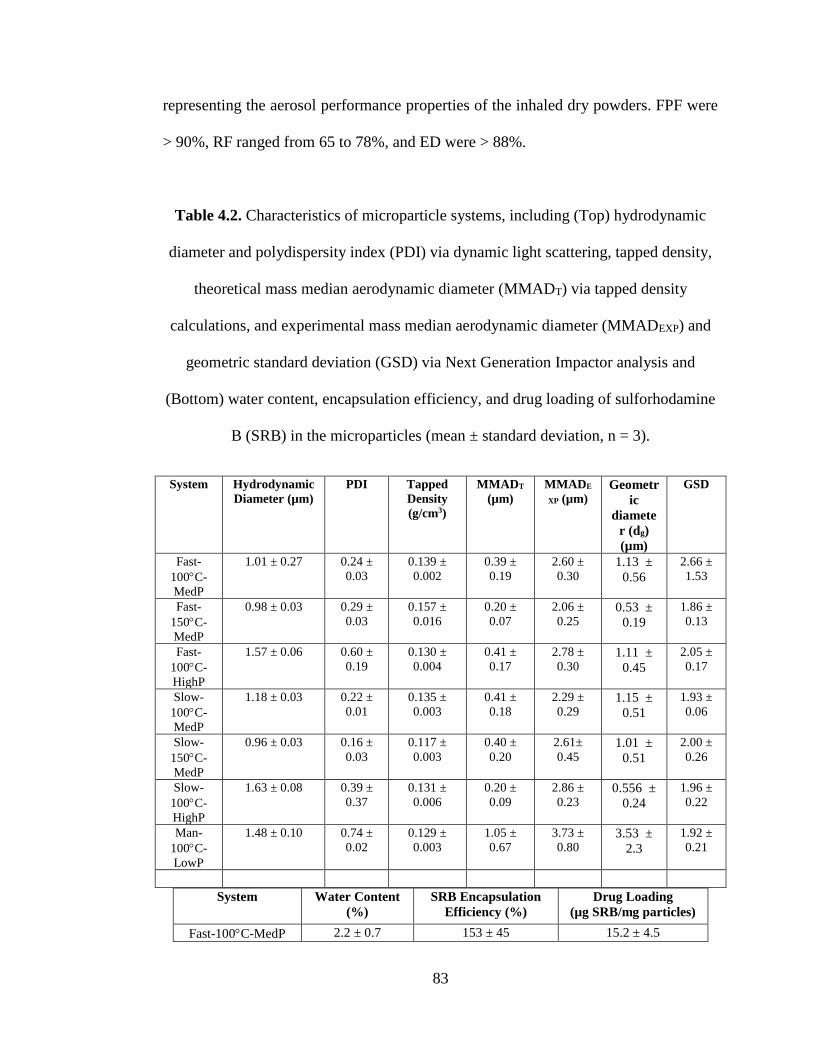
83
representing the aerosol performance properties of the inhaled dry powders. FPF were
> 90%, RF ranged from 65 to 78%, and ED were > 88%.
Table 4.2. Characteristics of microparticle systems, including (Top) hydrodynamic
diameter and polydispersity index (PDI) via dynamic light scattering, tapped density,
theoretical mass median aerodynamic diameter (MMADT) via tapped density
calculations, and experimental mass median aerodynamic diameter (MMADEXP) and
geometric standard deviation (GSD) via Next Generation Impactor analysis and
(Bottom) water content, encapsulation efficiency, and drug loading of sulforhodamine
B (SRB) in the microparticles (mean ± standard deviation, n = 3).
System Hydrodynamic
Diameter (µm)
PDI Tapped
Density
(g/cm3)
MMADT
(µm)
MMADE
XP (µm) Geometr
ic
diamete
r (dg)
(µm)
GSD
Fast-
100C-
MedP
1.01 ± 0.27 0.24 ±
0.03
0.139 ±
0.002
0.39 ±
0.19
2.60 ±
0.30 1.13 ±
0.56
2.66 ±
1.53
Fast-
150C-
MedP
0.98 ± 0.03 0.29 ±
0.03
0.157 ±
0.016
0.20 ±
0.07
2.06 ±
0.25 0.53 ±
0.19
1.86 ±
0.13
Fast-
100C-
HighP
1.57 ± 0.06 0.60 ±
0.19
0.130 ±
0.004
0.41 ±
0.17
2.78 ±
0.30 1.11 ±
0.45
2.05 ±
0.17
Slow-
100C-
MedP
1.18 ± 0.03 0.22 ±
0.01
0.135 ±
0.003
0.41 ±
0.18
2.29 ±
0.29 1.15 ±
0.51
1.93 ±
0.06
Slow-
150C-
MedP
0.96 ± 0.03 0.16 ±
0.03
0.117 ±
0.003
0.40 ±
0.20
2.61±
0.45 1.01 ±
0.51
2.00 ±
0.26
Slow-
100C-
HighP
1.63 ± 0.08 0.39 ±
0.37
0.131 ±
0.006
0.20 ±
0.09
2.86 ±
0.23 0.556 ±
0.24
1.96 ±
0.22
Man-
100C-
LowP
1.48 ± 0.10 0.74 ±
0.02
0.129 ±
0.003
1.05 ±
0.67
3.73 ±
0.80 3.53 ±
2.3
1.92 ±
0.21
System Water Content
(%)
SRB Encapsulation
Efficiency (%)
Drug Loading
(µg SRB/mg particles)
Fast-100C-MedP 2.2 ± 0.7 153 ± 45 15.2 ± 4.5
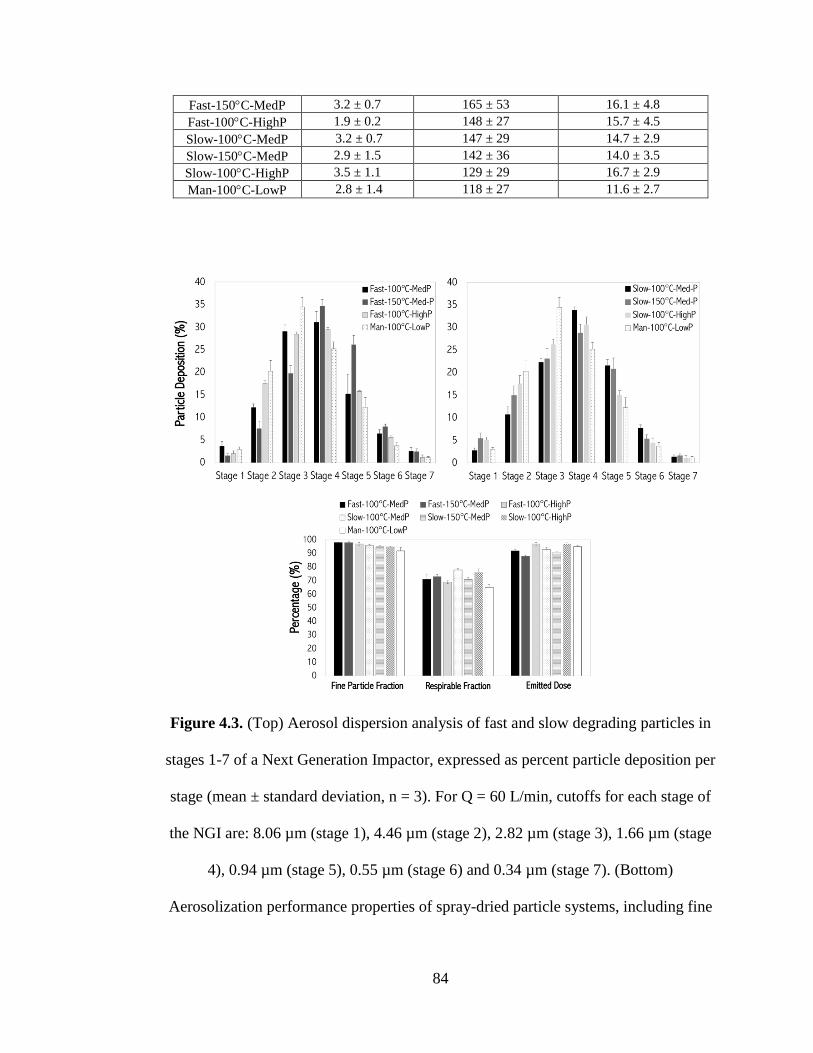
84
Fast-150C-MedP 3.2 ± 0.7 165 ± 53 16.1 ± 4.8
Fast-100C-HighP 1.9 ± 0.2 148 ± 27 15.7 ± 4.5
Slow-100C-MedP 3.2 ± 0.7 147 ± 29 14.7 ± 2.9
Slow-150C-MedP 2.9 ± 1.5 142 ± 36 14.0 ± 3.5
Slow-100C-HighP 3.5 ± 1.1 129 ± 29 16.7 ± 2.9
Man-100C-LowP 2.8 ± 1.4 118 ± 27 11.6 ± 2.7
Figure 4.3. (Top) Aerosol dispersion analysis of fast and slow degrading particles in
stages 1-7 of a Next Generation Impactor, expressed as percent particle deposition per
stage (mean ± standard deviation, n = 3). For Q = 60 L/min, cutoffs for each stage of
the NGI are: 8.06 µm (stage 1), 4.46 µm (stage 2), 2.82 µm (stage 3), 1.66 µm (stage
4), 0.94 µm (stage 5), 0.55 µm (stage 6) and 0.34 µm (stage 7). (Bottom)
Aerosolization performance properties of spray-dried particle systems, including fine
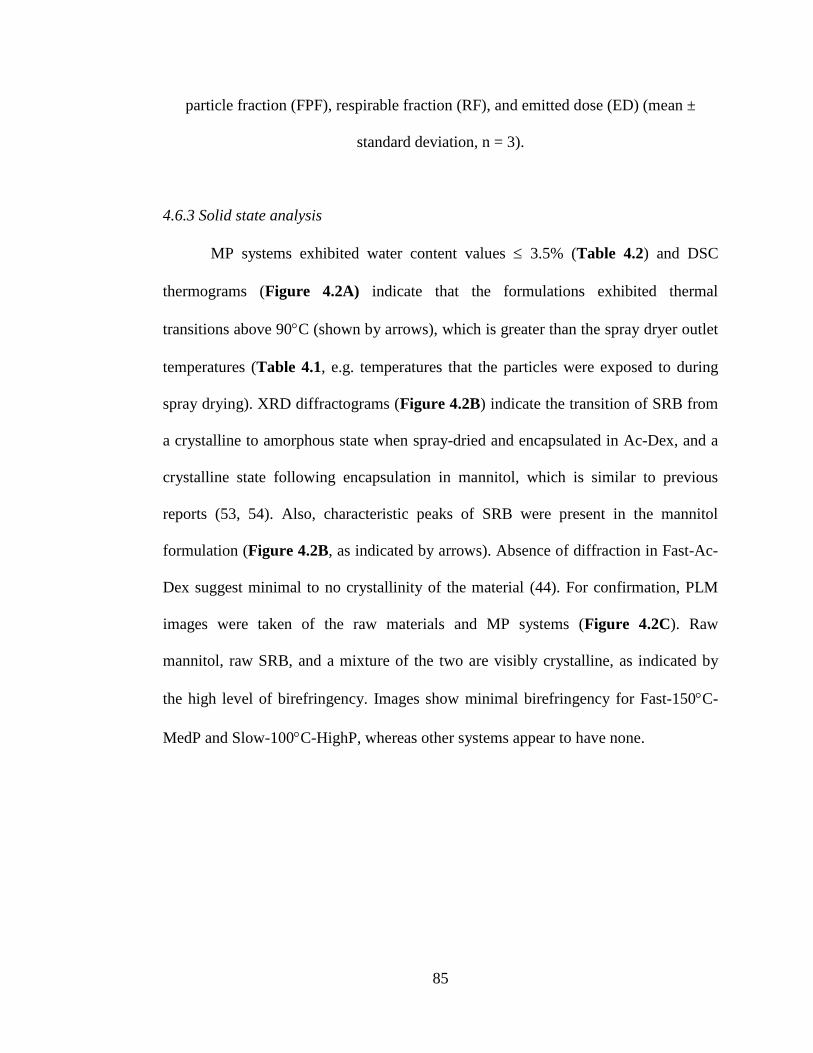
85
particle fraction (FPF), respirable fraction (RF), and emitted dose (ED) (mean ±
standard deviation, n = 3).
4.6.3 Solid state analysis
MP systems exhibited water content values 3.5% (Table 4.2) and DSC
thermograms (Figure 4.2A) indicate that the formulations exhibited thermal
transitions above 90C (shown by arrows), which is greater than the spray dryer outlet
temperatures (Table 4.1, e.g. temperatures that the particles were exposed to during
spray drying). XRD diffractograms (Figure 4.2B) indicate the transition of SRB from
a crystalline to amorphous state when spray-dried and encapsulated in Ac-Dex, and a
crystalline state following encapsulation in mannitol, which is similar to previous
reports (53, 54). Also, characteristic peaks of SRB were present in the mannitol
formulation (Figure 4.2B, as indicated by arrows). Absence of diffraction in Fast-Ac-
Dex suggest minimal to no crystallinity of the material (44). For confirmation, PLM
images were taken of the raw materials and MP systems (Figure 4.2C). Raw
mannitol, raw SRB, and a mixture of the two are visibly crystalline, as indicated by
the high level of birefringency. Images show minimal birefringency for Fast-150C-
MedP and Slow-100C-HighP, whereas other systems appear to have none.
86
Figure 4.4. (A) Representative differential scanning calorimetry thermograms of raw
materials used during the spray drying of particles and of sulforhodamine B (SRB)-
loaded microparticles. (B) Representative x-ray diffractograms of raw materials used
during the spray drying of particles and of sulforhodamine B (SRB)-loaded
microparticles. (C) Polarized light microscopy images of microparticle systems and
raw materials. Crystals in microparticle systems are indicated by arrows, if applicable.
Scale bar = 0.1 mm.
87
4.6.4 Drug loading, in vitro drug release, and release kinetic analysis
All particles exhibited SRB encapsulation efficiency (EE) values greater than
100% (Table 4.2), whereas SRB drug loading (DL) ranged from 11.6 to 16.1 µg of
SRB to mg of MP. The exceptionally high EE is mainly based on the loss of polymer
during synthesis; smaller particles are captured by the filter rather than the collection
vial and cyclone. This polymer loss results in an inherent increase in EE. Although
drug loading values were exceptionally low, for the purposes of the study, they were
determined to be acceptable.
The in vitro drug release of SRB from all MP systems in phosphate buffer (pH
7.4) and sodium acetate buffer (pH 5.35) at physiological temperature was performed
to simulate release in circulation and acidic states of the body, respectively (Figure
4.5). Results show that both types of Ac-Dex MP systems released 100% of SRB
between 4 and 6 hours in acidic pH, which is characteristic of the acid-sensitive nature
of Ac-Dex (19, 36). Although all Fast-Ac-Dex MP systems except for Fast-100C-
MedP reach equilibrium at 36 hours, at physiological pH, Fast-Ac-Dex MP released
100% of SRB at 96 hours. In comparison, Slow-Ac-Dex MP released 100% of SRB at
108 hours. Mannitol MP released 100% of SRB in 4 hours at both pH values (while
reaching equilibrium in the first 2 hours), corresponding to its high solubility in
aqueous environments and lack of pH sensitivity.
To investigate the theoretical outcome of the release of SRB from the designed
systems and their subsequent release mechanism(s), the release profiles were fitted to
several models, including zero-order, first-order, Higuchi, Korsmeyer-Peppas, Peppas-
Sahlin, and Corrigan. Table 4.3 shows the results of the best-fit models at each pH,

88
their associated constants, and their R2 values (all of which were 0.90). At pH 5.35,
Ac-Dex MP exhibited both Corrigan and Peppas-Sahlin-type release kinetics. The
fraction of drug release (FB,in) show that the majority of the drug cargo was released
and the KC values varied from system-to-system (227). Drug release kinetics at pH 7.4
for Fast-Ac-Dex and mannitol MP were best fit to the Korsmeyer-Peppas model,
which relates the amount of drug released to the time elapsed (228). The n variable in
the model determines the type of diffusion from the formulation. Results show that
particle systems exhibiting Korsmeyer-Peppas release kinetics have n < 0.43,
indicating that the release from the MP followed Fickian diffusion (229). Slow-Ac-
Dex MP exhibited first-order release kinetics at pH 7.4 and the values of K1 for Slow-
Ac-Dex systems are considerably smaller in relation to the values of t and the
constant, n. The values from this study show that Slow-Ac-Dex systems exhibited
short burst release followed by sustained release (2).
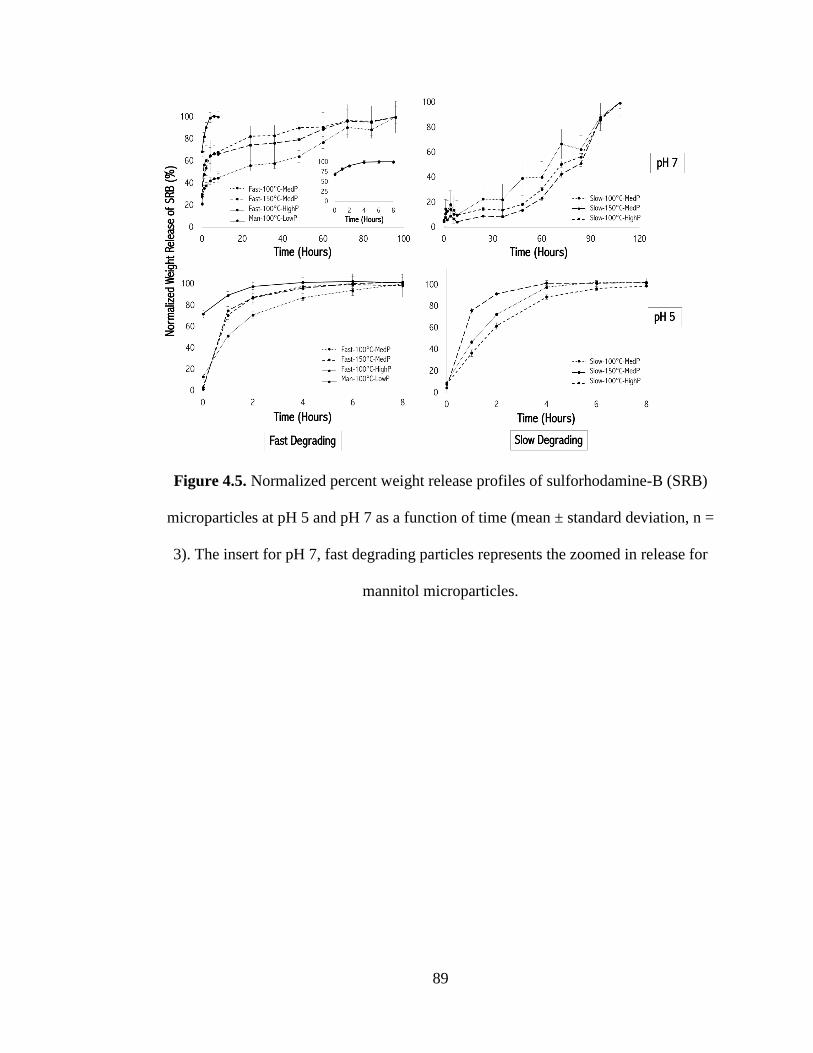
89
Figure 4.5. Normalized percent weight release profiles of sulforhodamine-B (SRB)
microparticles at pH 5 and pH 7 as a function of time (mean ± standard deviation, n =
3). The insert for pH 7, fast degrading particles represents the zoomed in release for
mannitol microparticles.
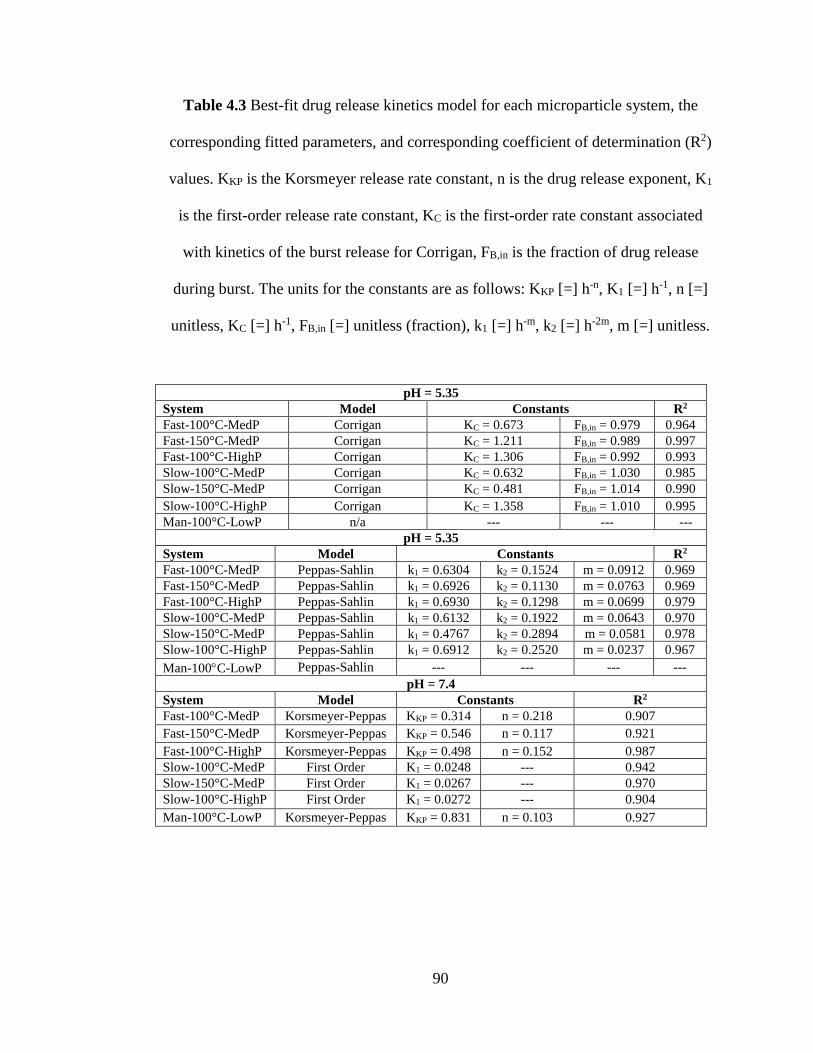
90
Table 4.3 Best-fit drug release kinetics model for each microparticle system, the
corresponding fitted parameters, and corresponding coefficient of determination (R2)
values. KKP is the Korsmeyer release rate constant, n is the drug release exponent, K1
is the first-order release rate constant, KC is the first-order rate constant associated
with kinetics of the burst release for Corrigan, FB,in is the fraction of drug release
during burst. The units for the constants are as follows: KKP [=] h-n, K1 [=] h-1, n [=]
unitless, KC [=] h-1, FB,in [=] unitless (fraction), k1 [=] h-m, k2 [=] h-2m, m [=] unitless.
pH = 5.35
System Model Constants R2
Fast-100°C-MedP Corrigan KC = 0.673 FB,in = 0.979 0.964
Fast-150°C-MedP Corrigan KC = 1.211 FB,in = 0.989 0.997
Fast-100°C-HighP Corrigan KC = 1.306 FB,in = 0.992 0.993
Slow-100°C-MedP Corrigan KC = 0.632 FB,in = 1.030 0.985
Slow-150°C-MedP Corrigan KC = 0.481 FB,in = 1.014 0.990
Slow-100°C-HighP Corrigan KC = 1.358 FB,in = 1.010 0.995
Man-100°C-LowP n/a --- --- ---
pH = 5.35
System Model Constants R2
Fast-100°C-MedP Peppas-Sahlin k1 = 0.6304 k2 = 0.1524 m = 0.0912 0.969
Fast-150°C-MedP Peppas-Sahlin k1 = 0.6926 k2 = 0.1130 m = 0.0763 0.969
Fast-100°C-HighP Peppas-Sahlin k1 = 0.6930 k2 = 0.1298 m = 0.0699 0.979
Slow-100°C-MedP Peppas-Sahlin k1 = 0.6132 k2 = 0.1922 m = 0.0643 0.970
Slow-150°C-MedP Peppas-Sahlin k1 = 0.4767 k2 = 0.2894 m = 0.0581 0.978
Slow-100°C-HighP Peppas-Sahlin k1 = 0.6912 k2 = 0.2520 m = 0.0237 0.967
Man-100C-LowP Peppas-Sahlin --- --- --- ---
pH = 7.4
System Model Constants R2
Fast-100°C-MedP Korsmeyer-Peppas KKP = 0.314 n = 0.218 0.907
Fast-150°C-MedP Korsmeyer-Peppas KKP = 0.546 n = 0.117 0.921
Fast-100°C-HighP Korsmeyer-Peppas KKP = 0.498 n = 0.152 0.987
Slow-100°C-MedP First Order K1 = 0.0248 --- 0.942
Slow-150°C-MedP First Order K1 = 0.0267 --- 0.970
Slow-100°C-HighP First Order K1 = 0.0272 --- 0.904
Man-100°C-LowP Korsmeyer-Peppas KKP = 0.831 n = 0.103 0.927
91
4.6.5 Cytotoxicity, uptake, and transepithelial electrical resistance of cells
The integrity of H441 air-interface culture (AIC) lung epithelial cells exposed
to aerosolized MP was analyzed using transepithelial electrical resistance (TEER). The
presence of an initial confluent monolayer was confirmed by steady TEER values (>
100 Ω cm2) following 9-11 days of culturing in AIC conditions. Beginning 24 hours
after exposure to the formulated particles, TEER was evaluated. As seen in Figure
4.6A, the TEER values remained statistically the same or higher following MP
exposure (p > 0.05) and were similar to that of the control. The influence of the
formulated MP systems on A549 viability was evaluated (Figure 4.6B) and results
indicate that the cells exposed to MP exhibited viability values similar to those the
control for up to 108 hours of exposure. Increasing the concentration of microparticles
imparted no significant change in the viability of A549 cells for the concentrations
tested. The cellular uptake of the MP systems was evaluated in A549, Calu-3, and
H441 cells for 3 hours (Figure 4.6C). The presence of SRB-loaded MP within the
cells were detected via fluorescence imaging and spectroscopy. Significantly more
Fast-Ac-Dex MP were uptaken by all the cells in comparison to Slow-Ac-Dex MP. In
addition, more MP uptake was evident in Calu-3 and H441 cells in comparison to
A549 cells. The morphology of the cells was similar at all time points and following
exposure to the MP.
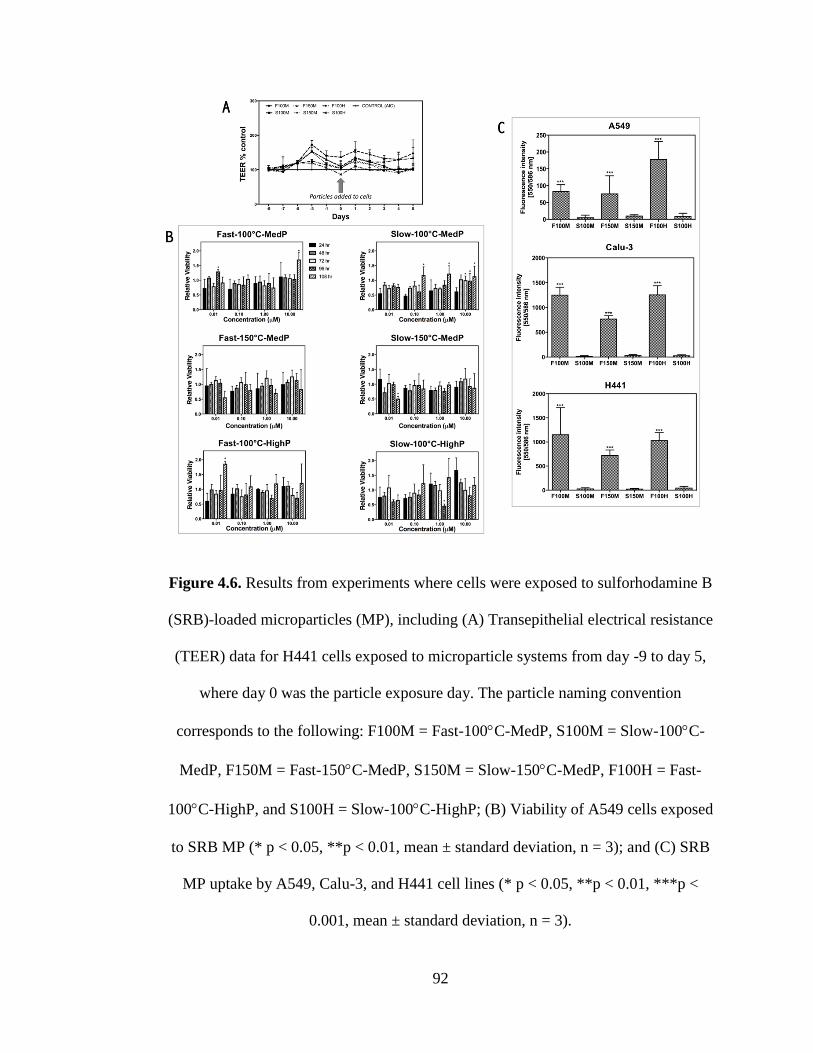
92
Figure 4.6. Results from experiments where cells were exposed to sulforhodamine B
(SRB)-loaded microparticles (MP), including (A) Transepithelial electrical resistance
(TEER) data for H441 cells exposed to microparticle systems from day -9 to day 5,
where day 0 was the particle exposure day. The particle naming convention
corresponds to the following: F100M = Fast-100C-MedP, S100M = Slow-100C-
MedP, F150M = Fast-150C-MedP, S150M = Slow-150C-MedP, F100H = Fast-
100C-HighP, and S100H = Slow-100C-HighP; (B) Viability of A549 cells exposed
to SRB MP (* p < 0.05, **p < 0.01, mean ± standard deviation, n = 3); and (C) SRB
MP uptake by A549, Calu-3, and H441 cell lines (* p < 0.05, **p < 0.01, ***p <
0.001, mean ± standard deviation, n = 3).
93
4.7 Discussion
Ac-Dex is a biodegradable polymer that exhibits tunable degradation rates
based on the synthesis time and formation and type of acetals (cyclic versus acyclic).
A higher CAC ratio results in slower degradation, whereas higher -OH conversion
results in Ac-Dex that is more hydrophobic, allowing for facile particle formation. For
the described formulations, Fast-Ac-Dex data were similar to previously reported data
(19, 40, 43, 45, 54) and Slow-Ac-Dex values were similar or higher than previous
reports (45, 49). Furthermore, the increase in CAC for Slow-Ac-Dex correlates to
slower release, as shown in the kinetic release analysis.
Differences in the morphology of the MP systems (Ac-Dex MP = corrugated,
mannitol MP = spherical) are due to the difference in surface tensions and boiling
points of the solvents used during spray drying. For Ac-Dex MP, solvent droplets
comprised primarily of IPA (and Ac-Dex) and a small amount water (and SRB) are
vaporized rapidly due to the high inlet temperatures (≥ 100 C) in relation to the
boiling point of IPA (82.6 C). Owing to the low surface tension of IPA and fast
solvent vaporization during spray drying, the droplets dry quickly and a thin polymer
wall forms, leading to hollow particles. As the particles cool, the walls of the droplets
collapse, resulting in a corrugated structure (45, 145). In contrast, the spray-dried
mannitol solution contains only mannitol and SRB in water. Due to the high surface
tension and boiling point of water, these droplets are able to hold their spherical shape
more efficiently during the drying process, allowing for the formation of spherical
particles (145).
94
The analysis of particle hydrodynamic diameters in solution allow for the
observation of MP in their wet state, and PDI values indicate that the particles were
fairly homogenous in size in this state. The tapped densities of the MP systems were
much lower than the reference density (1 g/cm3). For Ac-Dex MP, low density values
are likely due to the corrugated morphology of the particles and the void space of both
particle types in their dry state can lower the overall density values. The low tapped
density values resulted in theoretical MMAD values that are smaller than the
geometric diameters, indicating that the actual densities of the MP are higher than
reported here.
Experimental MMAD and GSD values were similar to previously reported
data (45). Theoretical MMAD of all particle sets were less than MMADEXP, which is
likely due to the agglomeration of the dry particles during aerosolization (45).
MMADECP values were within the 1 – 5 m range required for aerosol deposition of
particles into the lungs (135). FPF values > 90% indicate that the aerosolized particles
have the potential to deposit in the lower airways. High ED values indicate that the
majority of particles are released from the capsules. In addition, a significant portion
of particles have the potential to be delivered from the inhaler to the lower airways of
the lungs, as indicated by high RF values. In all cases, these values were higher in
comparison to previously published reports (45, 218, 230–232). Particles that were
synthesized using a high pump rate exhibited higher PDI, hydrodynamic diameters,
and experimental MMAD values. This is likely due to the lower exposure time to
heated gas due to the higher pump rate. Solutions dried using these settings allow for
more rapid drying in comparison to other settings, which allows for uneven formation
95
of particles. Particles synthesized using a temperature of 100°C had higher geometric
diameters and hydrodynamic diameters compared to systems synthesized with 150°C
(44).
Solid-state analysis of the MP indicate that the systems exhibit water content
values low enough to be ideal for dry powder storage and stability (145). Higher water
content is associated with destabilization of amorphous formulations, causing re-
crystallization of the cargo (145, 213, 233), which can be detrimental to the
formulation and overall therapeutic outcomes. Furthermore, high water content can
cause hydrolysis of Ac-Dex and particle cohesion, which would result in larger
particle size and a shift in particle deposition toward the upper regions of the lungs
(44). DSC data indicate that the transition temperatures of the compounds are 50C
greater than their storage conditions, which can allow for product stability (145).
Comparison of DSC and PLM data confirm minimal to no crystallinity in the Ac-Dex
formulations compared to high crystallinity in mannitol formulations.
The drug release patterns of Ac-Dex MP at acidic and physiological pH values
are similar to previous studies (35, 45, 49). By controlling the reaction time of Ac-
Dex, alterations in the acetalation of dextran altered the release kinetics. However,
regardless of Ac-Dex synthesis time, hydrolysis of acetal groups accelerated in acidic
conditions, resulting in fast drug release from the NP. The Corrigan model was
developed to evaluate initial burst release that occurs in drug delivery systems (234).
When exposed to acidic pH conditions, Ac-Dex degrades quickly, which allows for
burst release, resulting in a release pattern similar to those described in a previous
report which studied 152 drug release experiments to evaluate burst release (227, 234,
96
235). The variation in KC values is likely related to differences in the diffusion
coefficient and solubility of the drug, as well as the differences in surface area of the
systems (235). Since all of the systems encapsulated the same compound and were
similar in diameter, the effect of surface area is the likely caused by the different
morphologies of the particles (145).
The Peppas-Sahlin kinetics model (236) is based on a two-kinetic constant
theory, with k1 relating to the Fickian contribution (diffusion) and k2 relating to the
case II relaxation contribution (erosion). Using k1 and k2, the R/F ratio was calculated
to determine the dominating contribution occurring during drug release (Table SII)
(237). For R/F > 1, the case II relaxational contribution dominates, indicating erosion
of the delivery system, whereas diffusion is the dominating contribution for R/F < 1.
Based on constants k1 and k2, and R/F values, drug release from all particle systems at
pH 5.35 are predicted to be based on diffusion (k1 < k2 and R/F < 1, in all cases) (236,
237). This is likely due to the highly water soluble nature of SRB (2, 236).
As stated previously, at pH 5.35 all particle systems exhibited Peppas-Sahlin or
Corrigan type kinetics. Peppas-Sahlin showed that release kinetics were based on the
diffusion of SRB from the systems rather than erosion of the systems. Corrigan
showed that all systems exhibited burst release kinetics, in which all of the
encapsulated SRB was released and the kinetics was based on the surface area of the
system. Overall, the systems exposed to pH 5.35 exhibited a combination of burst
release and exceptionally quick diffusion, likely due to not only the acidic sensitivity
of Ac-Dex, but also the high solubility of SRB. At pH 7.4, Fast-Ac-Dex particles
exhibited Korsmeyer-Peppas release kinetics, whereas Slow-Ac-Dex exhibited first-
97
order release kinetics. Fast-Ac-Dex systems experienced diffusion-based release,
likely due to the high solubility of SRB and the extremely slow of erosion of Ac-Dex.
Slow-Ac-Dex systems demonstrated short burst release, followed by a highly-
controlled rate of release for SRB, likely due to the high stability (more so than Fast-
Ac-Dex) of Slow-Ac-Dex at neutral pH values. Overall, the release kinetics for all
systems are ideal for various diseases of the lung, where physiological diseases can be
treated with sustained release formulations and diseases associated with acidic
conditions (cancer, infectious diseases) can utilize burst release in a controllable
manner.
The formulated MP were evaluated using several cell culture techniques as
described in the Results. The presence of steady TEER values following exposure of
AIC H441 cells to the MP indicates that the systems do not impact the lung epithelium
integrity. H441 cells were used for TEER due to their epithelial cell typing.
Furthermore, the MP were not toxic to A549, a commonly used lung cancer cell line,
at the concentrations and times tested. Finally, results demonstrated that Slow-Ac-Dex
MP have the ability to be uptaken into H441, A549, and Calu-3 cells. Uptake is likely
due to two phenomena. One explanation is the lipophilicity of the polymer; too high of
lipophilicity (Slow-Ac-Dex) can inhibit the uptake of particles in comparison to those
that are not as lipophilic. Another explanation could be due to the fact that the cell
types are cancerous and inherently have leaky channels. Based on the results, it is
likely that both explanations contributed to the uptake of the MP systems. Overall, the
results indicate that the MP are likely safe for pulmonary delivery applications.
4.8 Conclusions
98
Ac-Dex MP systems were successfully developed results in the sustained
release of a water-soluble compound. Both ‘Fast’ and ‘Slow’ MP systems were
corrugated in structure, similar in size, and in physical states. The formulations
exhibited aerosol dispersion properties that demonstrate they could be used for
pulmonary drug delivery. Release of SRB from the formulations was dependent on
both the degradation rate of the polymer and the pH conditions. These factors allowed
for burst, sustained, and/or controlled release of the cargo depending on the
environment and type of Ac-Dex. In terms of biological interactions, the MP systems
showed minimal toxicity and no disruption of epithelial monolayer integrity, while
Fast-Ac-Dex particles showed significant uptake compared to their Slow-Ac-Dex
counterparts. Overall, the engineered Ac-Dex MP systems developed have the
capability of not only delivering water-soluble agents to the whole lung, but also
controlling the release of such cargo. These results confirm our previously mentioned
hypothesis.
99
CHAPTER 5
COMPARISON OF NANOPARTICLE PURIFICATION PROCESS VIA
CENTRIFUGATION AND TANGENTIAL FLOW FILTRATION: A CASE STUDY
ON ACETALATED DEXTRAN NANOPARTICLES
Submitted for publication in Particuology in April 2019.
Nishan K. Shah1, Ryan Ivone1, Jie Shen1,2, Samantha A. Meenach1,2,*
1University of Rhode Island, College of Pharmacy, Department of Biomedical and
Pharmaceutical Sciences, Kingston, RI 02881
2University of Rhode Island, College of Engineering, Department of Chemical
Engineering, Kingston, RI 02881
100
5.1 Abstract
Tangential flow filtration (TFF) is a commonly used purification method in a
multitude of fields, including particle engineering. Despite this, there is no
comprehensive examination on the effects of key parameters of TFF on nanoparticle
(NP) outcomes (characteristics). Therefore, this study aims to investigate the influence
of various factors on the characteristics of TFF-purified NP, while using
centrifugation, the most commonly used NP purification method, as a comparison. In
total, this study is divided into three parts: (i) a design of experiment approach to
investigate the influence of transmembrane pressure, flow rate, and initial drug loading
on NP characteristics using paclitaxel as a model small molecule; (ii) determination of
the optimized parameters following statistical analysis; and (iii) evaluation in the
variability of NP characteristics following encapsulation of different small molecules.
Once the optimized parameters were determined, paclitaxel tacrolimus and
resveratrol-loaded NP were synthesized and purified via centrifugation and TFF.
Results indicated that both key parameters and encapsulated drug play significant roles
in the outcomes of purified NP, and that TFF can serve as a suitable scale-up
purification method, demonstrating significantly smaller NP diameters and increased
drug loading in comparison to centrifugation.
5.2 Keywords
Tangential flow filtration, nanoparticle purification, Box-Behnken design, acetalated
dextran; drug delivery
101
5.3 1Abbreviations
(Included as footnote)
5.4 Introduction
The application of nanotechnology in biomedical and pharmaceutical sciences has
drastically impacted the way diseases are diagnosed and treated (5, 238, 239).
Polymeric nanoparticles (NP) are attractive drug delivery systems, owing to their
biocompatibility, tunable characteristics, and environmental responsiveness (1, 2, 19).
Commonly used fabrication methods for polymeric NP include single or double
emulsification, nanoprecipitation, and salting out (240). Following nanoparticle
fabrication, a purification process is often used to remove additives, surfactants, and/or
unencapsulated drug.
The most common method used for NP purification is ultracentrifugation, which
utilizes centrifugal force to separate final products from undesired material (24).
Similarly, diafiltrating centrifugal devices can be used to separate NP from their raw
materials by combining centrifugal forces with the use of filters with a known
molecular weight cut off (MWCO) that are added to centrifuge tubes (24, 31). While
these are simple, easy separation processes, the g forces generated during
centrifugation can lead to challenges during the purification process. The compaction
of NP by these forces can result in caking and densely packed NP pellets that require
12-methoxypropene: 2-MOP; Acetalated dextran: Ac-Dex; Acetonitrile; ACN; Box-Behnken design:
BBD; Dimethyl sulfoxide: DMSO; drug loading : DL; encapsulation efficiency: EE; nanoparticle: NP;
poly(vinyl alcohol): PVA; paclitaxel : PTX; pyridinium p-toluenesulfonate: PPTS; phosphate buffered
saline: PBS; resveratrol: RSV; tacrolimus: TAC; triethylamine: TEA; Trifluoroacetic acid: TFA;
tangential flow filtration: TFF; transmembrane pressure: TMP; ultra performance liquid
chromatography: UPLC; zeta potential: ZP.
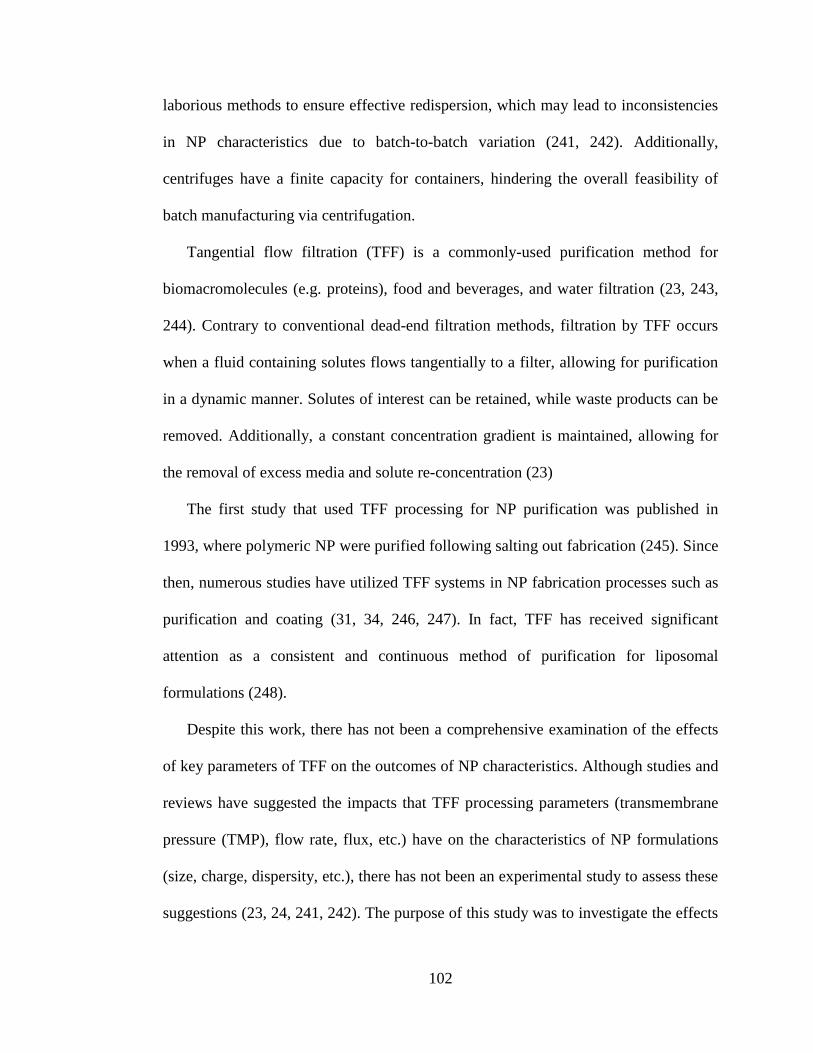
102
laborious methods to ensure effective redispersion, which may lead to inconsistencies
in NP characteristics due to batch-to-batch variation (241, 242). Additionally,
centrifuges have a finite capacity for containers, hindering the overall feasibility of
batch manufacturing via centrifugation.
Tangential flow filtration (TFF) is a commonly-used purification method for
biomacromolecules (e.g. proteins), food and beverages, and water filtration (23, 243,
244). Contrary to conventional dead-end filtration methods, filtration by TFF occurs
when a fluid containing solutes flows tangentially to a filter, allowing for purification
in a dynamic manner. Solutes of interest can be retained, while waste products can be
removed. Additionally, a constant concentration gradient is maintained, allowing for
the removal of excess media and solute re-concentration (23)
The first study that used TFF processing for NP purification was published in
1993, where polymeric NP were purified following salting out fabrication (245). Since
then, numerous studies have utilized TFF systems in NP fabrication processes such as
purification and coating (31, 34, 246, 247). In fact, TFF has received significant
attention as a consistent and continuous method of purification for liposomal
formulations (248).
Despite this work, there has not been a comprehensive examination of the effects
of key parameters of TFF on the outcomes of NP characteristics. Although studies and
reviews have suggested the impacts that TFF processing parameters (transmembrane
pressure (TMP), flow rate, flux, etc.) have on the characteristics of NP formulations
(size, charge, dispersity, etc.), there has not been an experimental study to assess these
suggestions (23, 24, 241, 242). The purpose of this study was to investigate the effects
103
of TFF flow rate and TMP as well as initial drug loading on NP characteristics
utilizing a design of experiment (DoE) approach. Acetalated dextran (Ac-Dex) was
chosen as the model polymeric carrier, as it has attracted increasing attention as a drug
delivery polymer due to its biocompatibility and biodegradability (19). Compared to
poly(lactic-co-glycolic acid), Ac-Dex has been shown to be easily tunable and pH
responsive, allowing it to be used for a variety of disease states (44). Moreover, Ac-
Dex can be easily produced through a facile one-step reaction, allowing for cost- and
time-effective synthesis. Paclitaxel (PTX) was chosen as the model drug in the DoE
studies. In addition to PTX, two other hydrophobic small molecules i.e. tacrolimus
(TAC) and resveratrol (RSV) were utilized to understand the effect of purification
process (centrifugation vs TFF) on the NP characteristics.
5.5 Experimental Methods
5.5.1 Materials
Dextran from Leuconostoc mesenteroides (9,000-11,000 MW), pyridinium p-
toluenesulfonate (PPTS, ≥ 99.9%), 2-methoxypropene (2-MOP, ≥ 97%), triethylamine
(TEA, ≥ 99%), anhydrous dimethyl sulfoxide (DMSO, ≥ 99.9%), dichloromethane
(DCM, ≥ 99.9%) and trifluoroacetic acid (TFA) were purchased from Sigma Aldrich
(St. Louis, MO, USA). Poly(vinyl alcohol) (PVA), iodine, boric acid (≥ 99.5%),
potassium iodide ( ≥ 99%), acetonitrile (HPLC grade), phosphoric acid (85%), and
phosphate buffered saline (PBS) were purchased from Fisher Scientific (Waltham,
MA, USA). Tacrolimus (TAC) and paclitaxel (PTX) were purchased from LC
Laboratories (Woburn, MA). Resveratrol (RSV) was purchased from AdipoGen (San
104
Diego, CA). The physical characteristics of paclitaxel, tacrolimus, and resveratrol can
be found in Supplemental Information.
5.5.2 Design of experiment study
5.5.2.1 Nanoparticle synthesis and purification via centrifugation
Acetalated dextran (Ac-Dex) was synthesized using a previously reported method
(44) and drug-loaded Ac-Dex NP were synthesized via a single emulsion method.
Briefly, PTX and Ac-Dex (40 mg total; 2, 6, or 10 wt% initial PTX loading) were
dissolved in 1 mL DCM to form the organic phase. 6 mL of 3% (w/v) poly(vinyl
alcohol) (PVA) in phosphate buffer saline (PBS) (aqueous phase) was added to the
organic phase. The organic-water mixture was sonicated (Q500 Sonicator; Qsonica,
Newtown, CT) at 70% amplitude for 30 s with 1 s on/off pulses. The resulting
emulsion was added to 40 mL of 0.3% (w/v) PVA spinning solution and stirred for 4
hours to allow for particle hardening and solvent evaporation. NP formulations were
made in triplicate.
5.5.2.2 Nanoparticle purification via tangential flow filtration (TFF)
NP suspensions were made as described above and prior to purification, several
batches of NP were combined and added to a TFF system (KRi2 KrosFlo, Spectrum
Inc., Rancho Dominguez, CA). The NP suspensions underwent diafiltration using a
500 kDa polyethersulfone-modified (mPES) MidiKros® hollow fiber filter until 15 mL
of concentrated NP remained. 10 mL of 0.05% (w/v) PVA was added to the
suspension, which was further concentrated to a final volume of 5 mL. The TFF
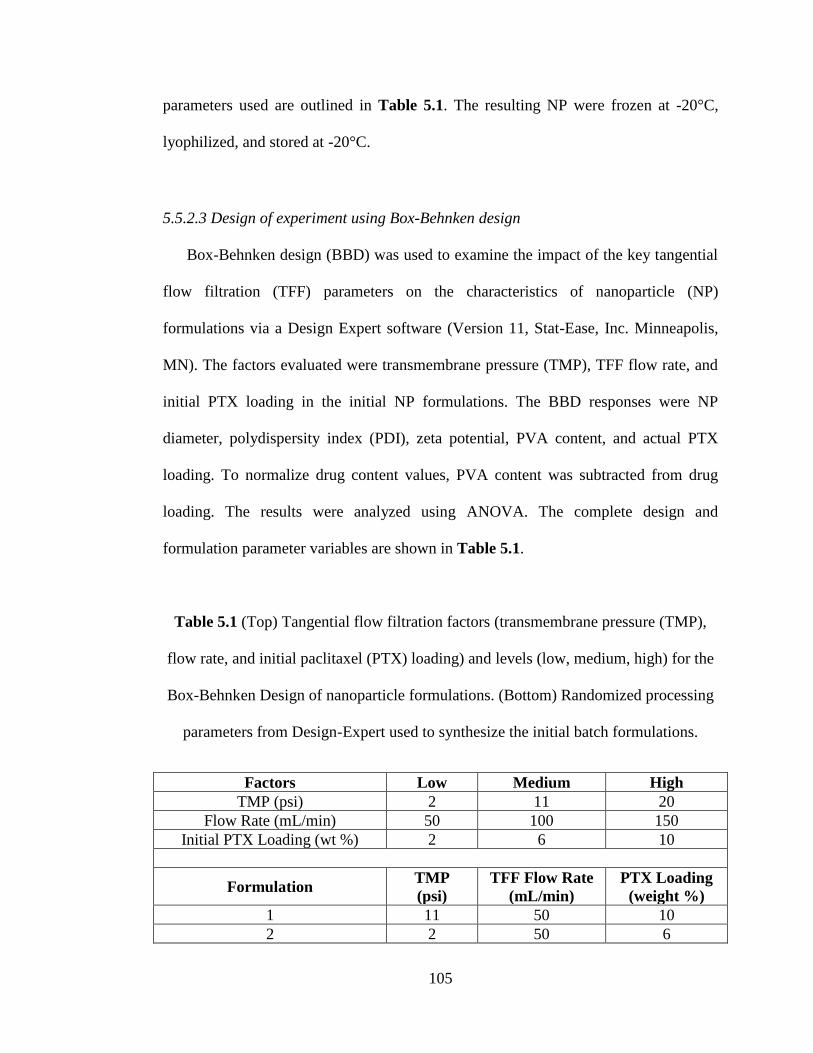
105
parameters used are outlined in Table 5.1. The resulting NP were frozen at -20°C,
lyophilized, and stored at -20°C.
5.5.2.3 Design of experiment using Box-Behnken design
Box-Behnken design (BBD) was used to examine the impact of the key tangential
flow filtration (TFF) parameters on the characteristics of nanoparticle (NP)
formulations via a Design Expert software (Version 11, Stat-Ease, Inc. Minneapolis,
MN). The factors evaluated were transmembrane pressure (TMP), TFF flow rate, and
initial PTX loading in the initial NP formulations. The BBD responses were NP
diameter, polydispersity index (PDI), zeta potential, PVA content, and actual PTX
loading. To normalize drug content values, PVA content was subtracted from drug
loading. The results were analyzed using ANOVA. The complete design and
formulation parameter variables are shown in Table 5.1.
Table 5.1 (Top) Tangential flow filtration factors (transmembrane pressure (TMP),
flow rate, and initial paclitaxel (PTX) loading) and levels (low, medium, high) for the
Box-Behnken Design of nanoparticle formulations. (Bottom) Randomized processing
parameters from Design-Expert used to synthesize the initial batch formulations.
Factors Low Medium High
TMP (psi) 2 11 20
Flow Rate (mL/min) 50 100 150
Initial PTX Loading (wt %) 2 6 10
Formulation TMP
(psi)
TFF Flow Rate
(mL/min)
PTX Loading
(weight %)
1 11 50 10
2 2 50 6
106
3 11 100 6
4 20 100 2
5 11 100 6
6 20 100 10
7 2 150 6
8 20 50 6
9 2 100 10
10 11 150 2
11 2 100 2
12 11 100 6
13 11 100 6
14 11 150 10
15 11 100 6
16 11 50 2
17 20 150 6
5.5.2.4 Nanoparticle characterization
The hydrodynamic diameters and surface charges of NP were evaluated via
dynamic light scattering (DLS) and zeta potential analysis, respectively, using a
Malvern Nano Zetasizer (Malvern Instruments, Worcestershire, UK) as previously
described (45). In order to determine the actual drug loading in the NP, formulations
were dissolved in mobile phase and their drug content was evaluated via ultra
performance liquid chromatography (UPLC, LaChrom, Hitachi, Japan), as described
in Supplemental Materials. Theoretical and actual drug loading (DL) was calculated
using the following equations:
107
The amount of PVA in the NP formulations was determined using a previously
reported method (Procházková et al., 2014). The actual DL of the NP formulations
without PVA was calculated using the following equation:
The morphology of the NP formulations was assessed using a Zeiss Sigma VP
Field Emission-Scanning Electron Microscope (FE-SEM) (Germany). To demonstrate
the presence of the PVA coating, lyophilized NP were suspended in basic water (pH 9)
and one to two drops of this suspension were transferred to aluminum SEM stubs
(TedPella Inc., Redding, CA) prior to air drying. To show particle morphology and
size in the absence of the PVA coating, NP were washed once with DI water, and
centrifuged at 23,102 g for 2 minutes to remove PVA prior to sample preparation and
imaging.
5.5.3 Comparison of the purification processes
PTX, tacrolimus (TAC), and resveratrol (RSV)-loaded Ac-Dex NP with 10 wt%
initial drug loading were prepared and purified via either centrifugation or TFF. For
centrifugation, deionized (DI) water was added to dilute the NP formulations, which
were centrifuged at 19,802 g for 20 min to concentrate the NP. The NP were then
washed with DI water and centrifuged at 19,802 g for 20 min again. The resulting NP
were dispersed in 0.1% (w/v) PVA to prevent particle agglomeration. Purification via
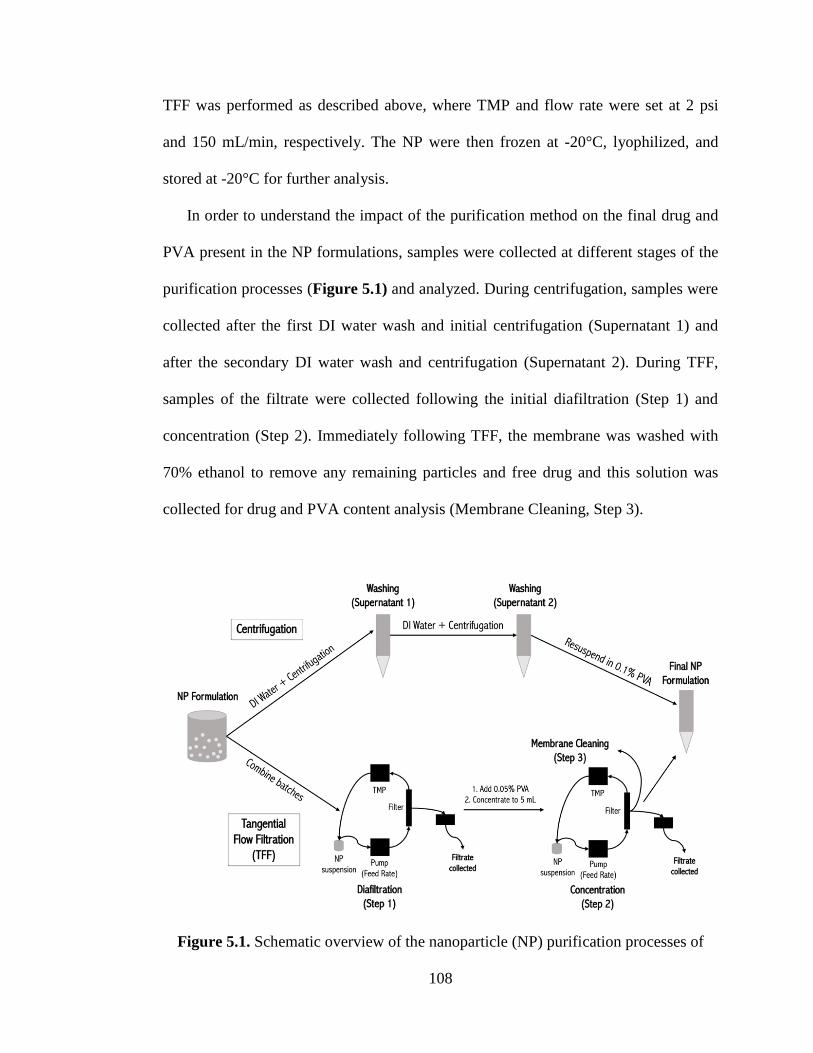
108
TFF was performed as described above, where TMP and flow rate were set at 2 psi
and 150 mL/min, respectively. The NP were then frozen at -20°C, lyophilized, and
stored at -20°C for further analysis.
In order to understand the impact of the purification method on the final drug and
PVA present in the NP formulations, samples were collected at different stages of the
purification processes (Figure 5.1) and analyzed. During centrifugation, samples were
collected after the first DI water wash and initial centrifugation (Supernatant 1) and
after the secondary DI water wash and centrifugation (Supernatant 2). During TFF,
samples of the filtrate were collected following the initial diafiltration (Step 1) and
concentration (Step 2). Immediately following TFF, the membrane was washed with
70% ethanol to remove any remaining particles and free drug and this solution was
collected for drug and PVA content analysis (Membrane Cleaning, Step 3).
Figure 5.1. Schematic overview of the nanoparticle (NP) purification processes of
109
centrifugation and tangential flow filtration (TFF). For centrifugation, deionized (DI)
water was added to the NP suspension, following by centrifugation (Washing,
Supernatant 1), this step was repeated (Washing, Supernatant 2), and the NP were
resuspended in 0.1% poly(vinyl alcohol) (PVA). For TFF, the NP suspension
underwent an initial filtration (Diafiltration, Step 1), then a concentration step
occurred following addition of 0.05% PVA to get 15 mL of concentration NP
(Concentration, Step 2), and finally the TFF membrane was cleaned to collect residual
residue (Membrane Cleaning, Step 3).
5.5.4 Statistical analysis
All measurements were performed in at least triplicate and values are given as
mean ± standard deviation. Statistical significance was determined using ANOVA or
Student’s t-test, where a p-value of < 0.05 was considered statistically significant.
Statistical analysis was performed using either Design Expert software or GraphPad
Prism.
5.6 Results
5.6.1 Design of experiment results for PTX-loaded Ac-Dex NP (PTX-NP)
Figure 5.2 shows the BBD study responses (NP characteristics) from the initial
batch formulations including NP diameter, PDI, zeta potential, PVA content, and
actual PTX loading. NP diameters following TFF purification ranged from 141 to 172
nm, and the PDI and zeta potential (ZP) values varied slightly from sample-to-sample
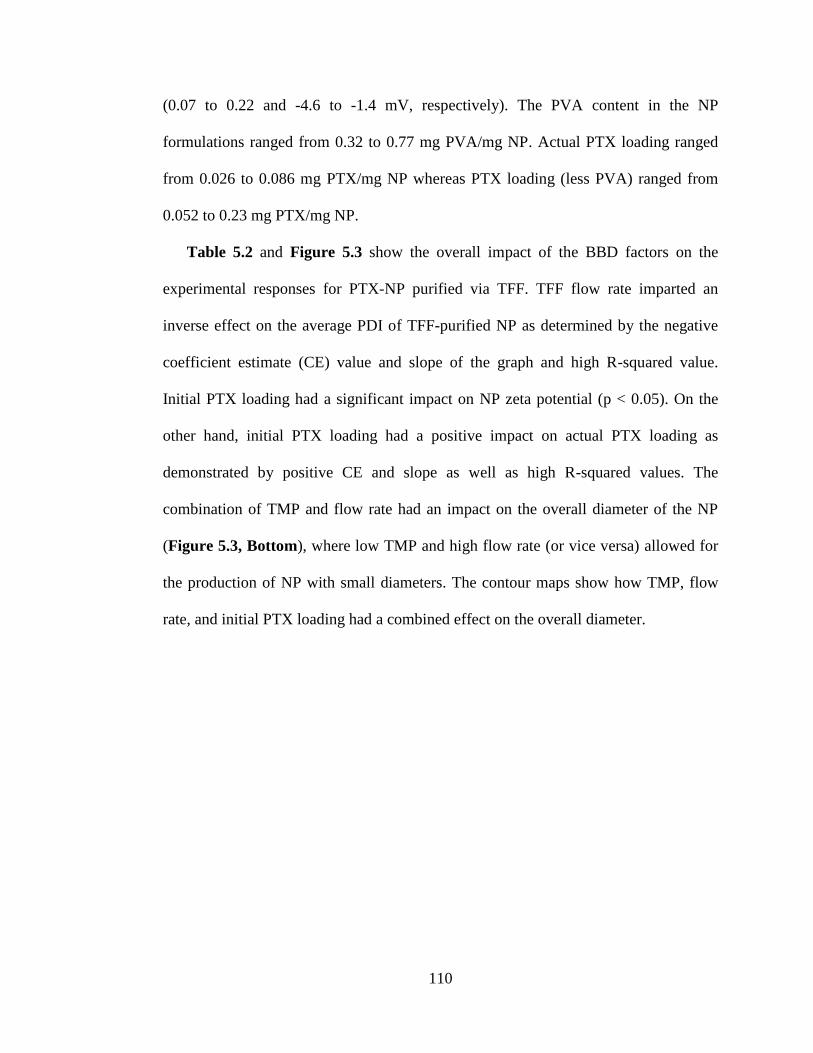
110
(0.07 to 0.22 and -4.6 to -1.4 mV, respectively). The PVA content in the NP
formulations ranged from 0.32 to 0.77 mg PVA/mg NP. Actual PTX loading ranged
from 0.026 to 0.086 mg PTX/mg NP whereas PTX loading (less PVA) ranged from
0.052 to 0.23 mg PTX/mg NP.
Table 5.2 and Figure 5.3 show the overall impact of the BBD factors on the
experimental responses for PTX-NP purified via TFF. TFF flow rate imparted an
inverse effect on the average PDI of TFF-purified NP as determined by the negative
coefficient estimate (CE) value and slope of the graph and high R-squared value.
Initial PTX loading had a significant impact on NP zeta potential (p < 0.05). On the
other hand, initial PTX loading had a positive impact on actual PTX loading as
demonstrated by positive CE and slope as well as high R-squared values. The
combination of TMP and flow rate had an impact on the overall diameter of the NP
(Figure 5.3, Bottom), where low TMP and high flow rate (or vice versa) allowed for
the production of NP with small diameters. The contour maps show how TMP, flow
rate, and initial PTX loading had a combined effect on the overall diameter.
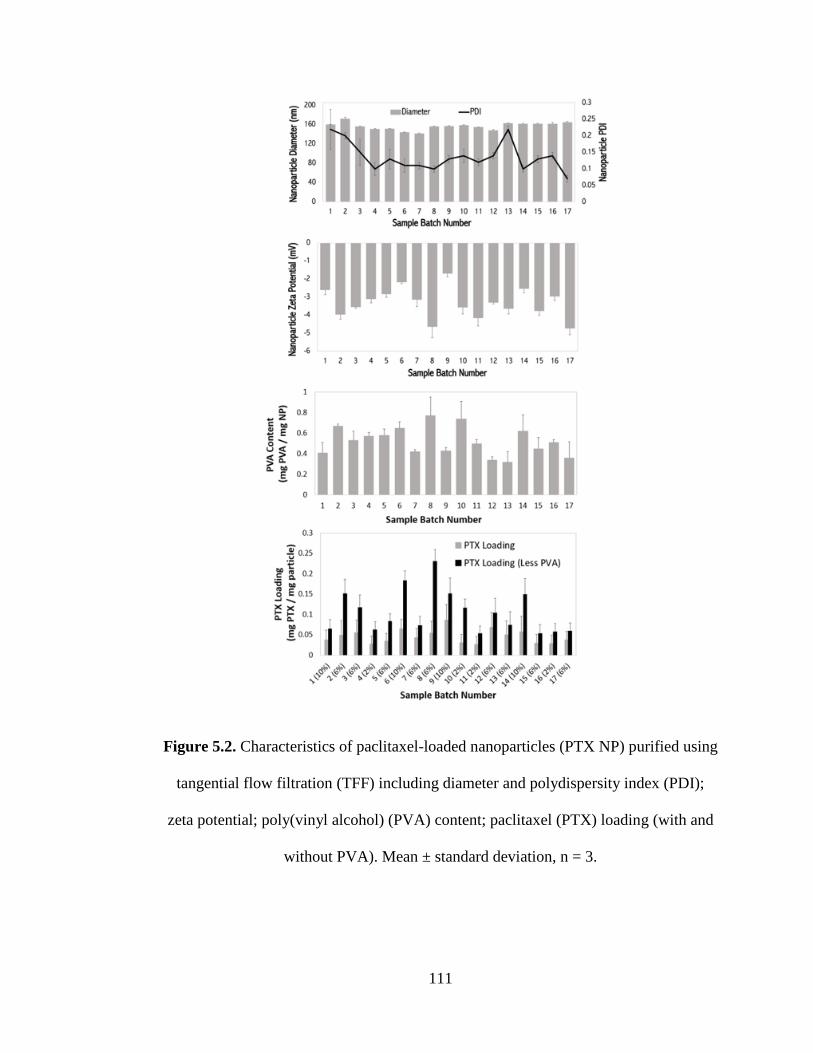
111
Figure 5.2. Characteristics of paclitaxel-loaded nanoparticles (PTX NP) purified using
tangential flow filtration (TFF) including diameter and polydispersity index (PDI);
zeta potential; poly(vinyl alcohol) (PVA) content; paclitaxel (PTX) loading (with and
without PVA). Mean ± standard deviation, n = 3.
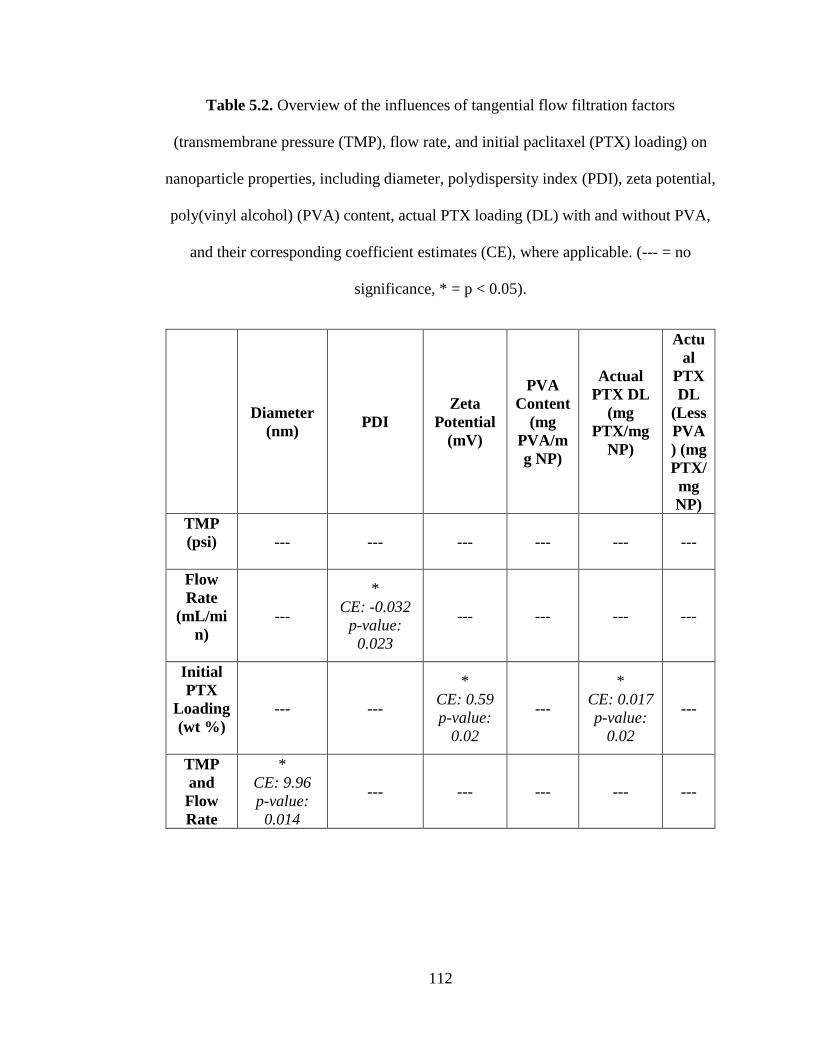
112
Table 5.2. Overview of the influences of tangential flow filtration factors
(transmembrane pressure (TMP), flow rate, and initial paclitaxel (PTX) loading) on
nanoparticle properties, including diameter, polydispersity index (PDI), zeta potential,
poly(vinyl alcohol) (PVA) content, actual PTX loading (DL) with and without PVA,
and their corresponding coefficient estimates (CE), where applicable. (--- = no
significance, * = p < 0.05).
Diameter
(nm) PDI
Zeta
Potential
(mV)
PVA
Content
(mg
PVA/m
g NP)
Actual
PTX DL
(mg
PTX/mg
NP)
Actu
al
PTX
DL
(Less
PVA
) (mg
PTX/
mg
NP)
TMP
(psi)
--- --- --- --- --- ---
Flow
Rate
(mL/mi
n)
---
*
CE: -0.032
p-value:
0.023
--- --- --- ---
Initial
PTX
Loading
(wt %)
--- ---
*
CE: 0.59
p-value:
0.02
---
*
CE: 0.017
p-value:
0.02
---
TMP
and
Flow
Rate
*
CE: 9.96
p-value:
0.014
--- --- --- --- ---
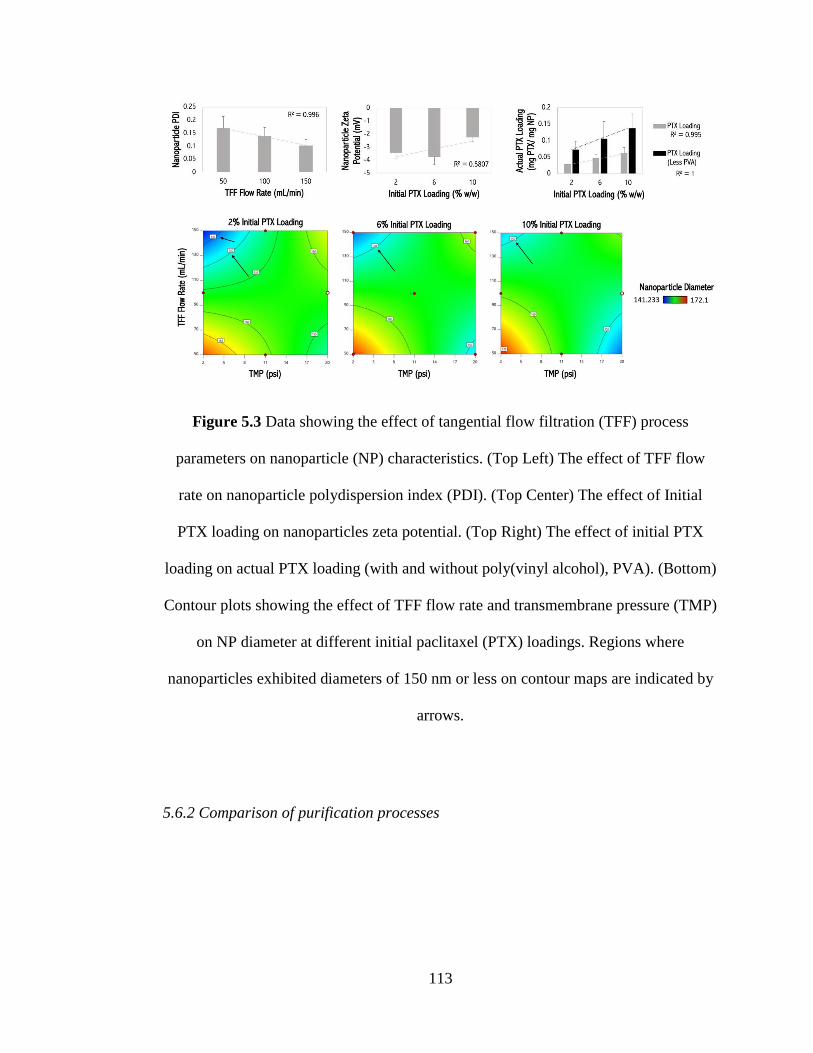
113
Figure 5.3 Data showing the effect of tangential flow filtration (TFF) process
parameters on nanoparticle (NP) characteristics. (Top Left) The effect of TFF flow
rate on nanoparticle polydispersion index (PDI). (Top Center) The effect of Initial
PTX loading on nanoparticles zeta potential. (Top Right) The effect of initial PTX
loading on actual PTX loading (with and without poly(vinyl alcohol), PVA). (Bottom)
Contour plots showing the effect of TFF flow rate and transmembrane pressure (TMP)
on NP diameter at different initial paclitaxel (PTX) loadings. Regions where
nanoparticles exhibited diameters of 150 nm or less on contour maps are indicated by
arrows.
5.6.2 Comparison of purification processes
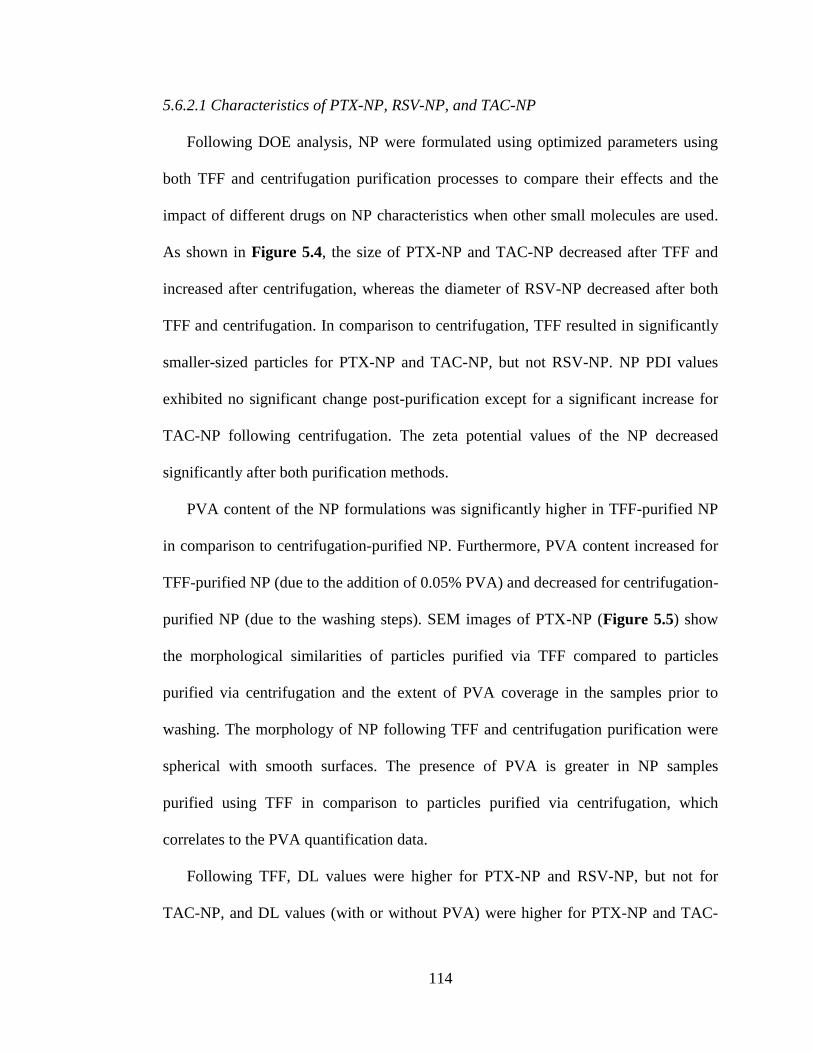
114
5.6.2.1 Characteristics of PTX-NP, RSV-NP, and TAC-NP
Following DOE analysis, NP were formulated using optimized parameters using
both TFF and centrifugation purification processes to compare their effects and the
impact of different drugs on NP characteristics when other small molecules are used.
As shown in Figure 5.4, the size of PTX-NP and TAC-NP decreased after TFF and
increased after centrifugation, whereas the diameter of RSV-NP decreased after both
TFF and centrifugation. In comparison to centrifugation, TFF resulted in significantly
smaller-sized particles for PTX-NP and TAC-NP, but not RSV-NP. NP PDI values
exhibited no significant change post-purification except for a significant increase for
TAC-NP following centrifugation. The zeta potential values of the NP decreased
significantly after both purification methods.
PVA content of the NP formulations was significantly higher in TFF-purified NP
in comparison to centrifugation-purified NP. Furthermore, PVA content increased for
TFF-purified NP (due to the addition of 0.05% PVA) and decreased for centrifugation-
purified NP (due to the washing steps). SEM images of PTX-NP (Figure 5.5) show
the morphological similarities of particles purified via TFF compared to particles
purified via centrifugation and the extent of PVA coverage in the samples prior to
washing. The morphology of NP following TFF and centrifugation purification were
spherical with smooth surfaces. The presence of PVA is greater in NP samples
purified using TFF in comparison to particles purified via centrifugation, which
correlates to the PVA quantification data.
Following TFF, DL values were higher for PTX-NP and RSV-NP, but not for
TAC-NP, and DL values (with or without PVA) were higher for PTX-NP and TAC-
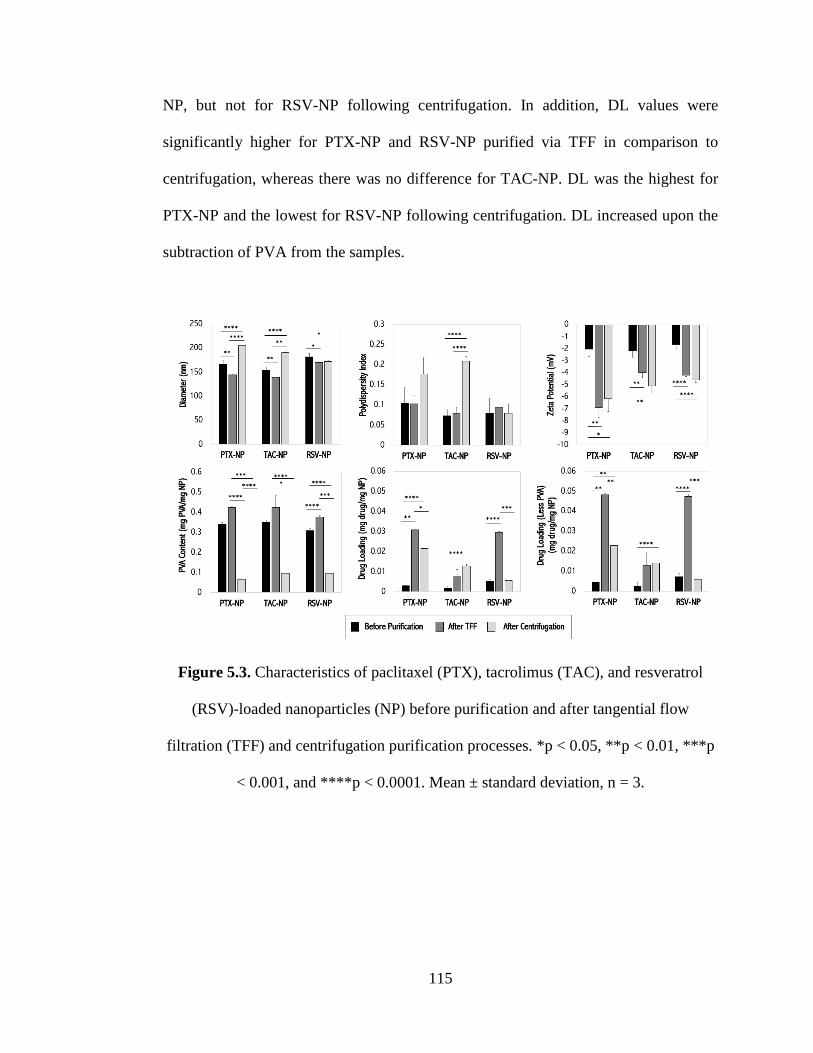
115
NP, but not for RSV-NP following centrifugation. In addition, DL values were
significantly higher for PTX-NP and RSV-NP purified via TFF in comparison to
centrifugation, whereas there was no difference for TAC-NP. DL was the highest for
PTX-NP and the lowest for RSV-NP following centrifugation. DL increased upon the
subtraction of PVA from the samples.
Figure 5.3. Characteristics of paclitaxel (PTX), tacrolimus (TAC), and resveratrol
(RSV)-loaded nanoparticles (NP) before purification and after tangential flow
filtration (TFF) and centrifugation purification processes. *p < 0.05, **p < 0.01, ***p
< 0.001, and ****p < 0.0001. Mean ± standard deviation, n = 3.
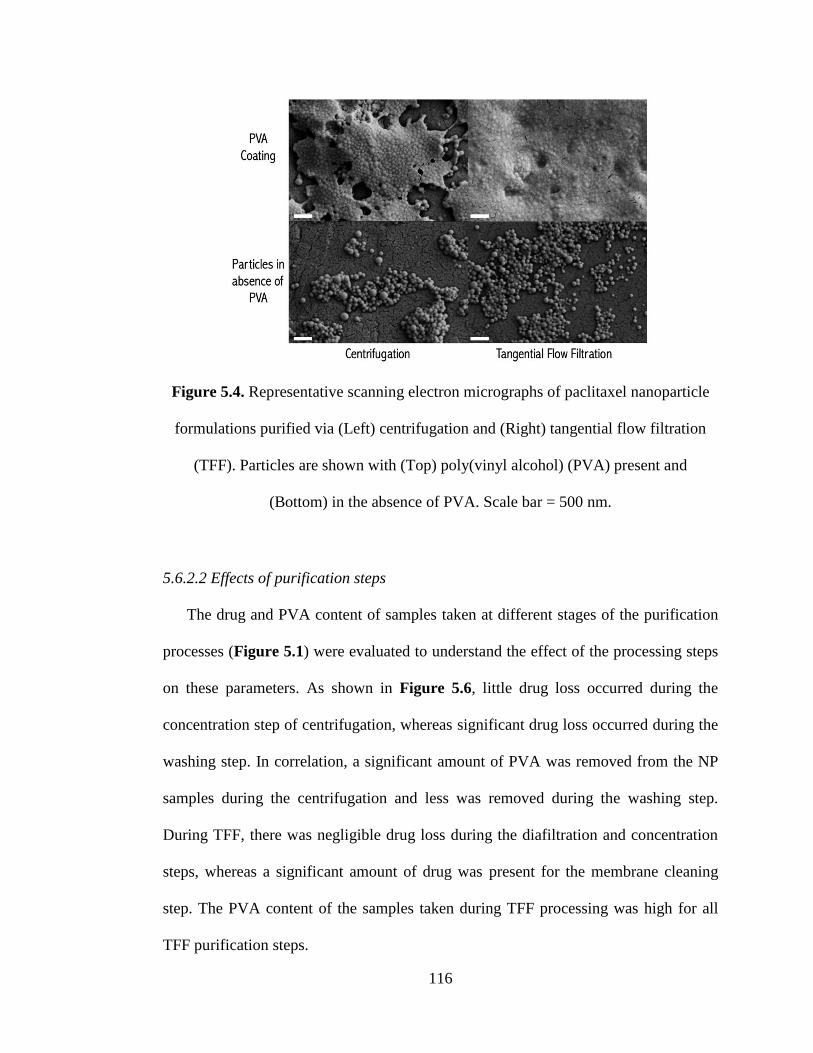
116
Figure 5.4. Representative scanning electron micrographs of paclitaxel nanoparticle
formulations purified via (Left) centrifugation and (Right) tangential flow filtration
(TFF). Particles are shown with (Top) poly(vinyl alcohol) (PVA) present and
(Bottom) in the absence of PVA. Scale bar = 500 nm.
5.6.2.2 Effects of purification steps
The drug and PVA content of samples taken at different stages of the purification
processes (Figure 5.1) were evaluated to understand the effect of the processing steps
on these parameters. As shown in Figure 5.6, little drug loss occurred during the
concentration step of centrifugation, whereas significant drug loss occurred during the
washing step. In correlation, a significant amount of PVA was removed from the NP
samples during the centrifugation and less was removed during the washing step.
During TFF, there was negligible drug loss during the diafiltration and concentration
steps, whereas a significant amount of drug was present for the membrane cleaning
step. The PVA content of the samples taken during TFF processing was high for all
TFF purification steps.
117
Figure 5.5. Drug loading and poly(vinyl alcohol) (PVA) content of paclitaxel,
tacrolimus, and resveratrol-loaded nanoparticle (PTX-NP, TAC-NP, and RSV-NP,
respectively) suspensions taken during the centrifugation and tangential flow filtration
purification processes. *p < 0.05, **p < 0.01, ***p < 0.001, and ****p < 0.0001.
Mean ± standard deviation, n = 3.
5.7 Discussion
The main goal of this study was to determine the effects of key TFF parameters on
NP characteristics. BBD factor levels for TFF purification were chosen based on the
manufacturer’s recommendations for flow rate and TMP in accordance with the
material type and pore size of the membrane used. In addition, centrifugation was used
as a comparative purification method. The model molecules used in this study have
slightly different chemical properties and structures (taxane, stilbene, and macrolide;

118
see Supplement Table S.1); however, they are all lipophilic, which makes them ideal
candidates to be encapsulated into polymeric NP. PTX was chosen as the initial model
drug due to its extensive use as an FDA-approved chemotherapeutic (249–252). RSV
is a well-studied natural product that has demonstrated numerous pharmacological
benefits such as anti-inflammatory and anti-cancer properties (253). TAC is one of the
most widely used immunosuppressive therapeutics for post-operative organ
transplantation (254–256).
Several BBD factors (TFF parameters) had significant influences on the responses
(NP characteristics). Varying TFF flow rate had an influence on the PDI of NP, where
increasing the flow rate resulted in decreased PDI values. Smaller constituents (e.g.
unencapsulated drug or smaller NP) can be more readily filtered out with a higher
flow rate, resulting in more uniform particle sizes, and thereby decreasing PDI. This
indicates that a high flow rate is desirable to achieve NP with a narrow size
distribution. Although zeta potential was significantly influenced by the initial PTX
loading (ZP increased as DL increased), the NP can be considered functionally neutral
(79, 80). The initial PTX loading had a significant influence on the final PTX loading
of the NP, where there was a positive correlation.
The combination of flow rate and TMP significantly influenced the size of the NP
formulations. By increasing the flow rate, the membrane exposure time decreases,
which reduces the potential for membrane fouling. Thus, the resulting concentration
gradient at the membrane surface allows smaller permeable species (free polymer, free
drug, smaller particles, etc.) to pass through more readily through the membrane via
passive diffusion. In turn, an increase in TMP drives more fluid through the
119
membrane, thereby increasing filtration capacity, but also increasing the potential of
membrane fouling. In addition, increasing the TMP close to or beyond manufacturer
recommendations risks the destruction of the membrane itself. Therefore, utilizing a
high flow rate and low TMP were determined as the best-case scenario for achieving
diameters within the range of 145 to 150 nm. Therefore, based on these results, a
lower TMP, higher flow rate, and higher drug loading were selected for further
studies.
Following TFF parameter optimization, NP loaded with PTX, RSV, and TAC
were formulated using the optimized TFF parameters (TMP = 2 psi, flow rate = 150
mL/min, and initial drug loading = 10 wt%) and via centrifugation as a comparison of
the effect of purification process on NP parameters when different small molecules are
used. The increase in diameter and PDI for PTX-NP and TAC-NP following
centrifugation was likely due to the agglomeration that occurred during centrifugation
process. This phenomenon can potentially be attributed to the challenge in re-
dispersing NP pellets, the fact that smaller NP may not have been removed, and the
lower zeta potential values, which may indicated less PVA coating as Ac-Dex is
negatively charged. In comparison, the 500 kDa membrane used during TFF was able
to retain NP 50 nm. The differences in diameters observed between TFF-purified NP
and centrifugation-purified NP lies in the underlying mechanistic differences between
the techniques. Centrifugation utilizes g forces to isolate the NP and is a type of dead-
end filtration (24). These forces, in addition to redispersion variability, can inherently
result in larger NP diameters. In contrast, TFF utilizes a dynamic filtration process,
where NP suspensions are constantly flowing tangentially to the membrane, which
120
prevents potential agglomeration while allowing for size exclusion purification (241,
242).
The decrease in zeta potential values post-purification can be attributed to the
exposure of Ac-Dex on the NP surfaces during processing (Ac-Dex is slightly
negatively charged) and overall the NP can be considered functionally neutral (79,
80). During purification via centrifugation, NP suspensions were exposed to PVA-free
media and the PVA was washed off the NP. In comparison, NP in the TFF membrane
were diafiltrated with PVA-laden media, and as a result, the NP are exposed to more
PVA, resulting in higher PVA content. In addition, variations in PVA content of post-
TFF samples were observed. Since the amount of PVA in suspension varies from
batch-to-batch, the PVA content of final formulations often varies (23). NP
purification via centrifugation resulted in lower PVA content compared with TFF. Due
to its water solubility, PVA diffused into the fresh water during washing and was
thereby removed from the surface of the NP during centrifugation. On the other hand,
there was a higher volume of PVA-saturated media that remained unchanged in the
diafiltration steps during TFF, resulting in higher PVA content for these samples.
It has been shown that centrifugation often results in higher drug loading in
comparison to TFF (23). However, in this study, TFF purification resulted in higher
drug loading in comparison to centrifugation for PTX-NP and RSV-NP, and resulted
in lower drug loading for TAC-NP. Overall, there were no trends related to changes in
NP diameter, PDI, zeta potential, PVA content, or drug loading despite the
fundamental differences in the physicochemical characteristics (chemical structure,
molecular weight, Log P, or water solubility) of the model drugs investigated.

121
The large amounts of drug removed from the TFF membrane during membrane
washing (Step 3) indicated significant interactions between the free drug or NP and the
mPES membrane. The physicochemical characteristics of the model drugs play a role
in drug-membrane interactions. For example, the drugs may result in high membrane
adsorption due to their high Log P values. Molecular interactions such as hydrogen
bonding (PTX and TAC), non-polar interactions (TAC), and pi-pi stacking (due to the
presence of aromatic rings in RSV, PTX, and the mPES membrane) are other possible
interactions that likely could have caused drug-membrane interactions, thereby
influencing the outcome of the DL values of the formulations.
5.8 Conclusions
BBD was used to identify the influence of key TFF parameters, in addition to
initial drug loading, on NP characteristics. It was found that NP characteristics were
dependent on a multitude of factors, including TFF flow rate and TMP, the initial drug
loading, and potential membrane-drug interactions. Upon comparison of the two
purification methods, TFF results in difficulties in controlling PVA content and
requires consideration for drug-membrane interactions and formulation dependent
optimization. In contrast, centrifugation is able to reduce PVA content, but produces
shear forces that can affect NP characteristics. TFF circumvents the issues associated
with centrifugation. In addition, TFF is an automated process capable of both
purification and filtration of NP, resulting in outcomes similar to that of, or better than,
centrifugation.
122
CHAPTER 6
PHYSICAL CHARACTERIZATION AND FORMULATION DEVELOPMENT OF
EACT FOR THE TREATMENT OF PULMONARY ARTERIAL HYPERTENSION
Nishan K. Shah1, Zimeng Wang2, Sweta K. Gupta3, Samantha A. Meenach1,3
1Department of Biomedical and Pharmaceutical Sciences, College of Pharmacy,
University of Rhode Island, Kingston, RI 02881 USA
2Phosphorex Inc., Hopkinton, MA 01748
3Department of Chemical Engineering, College of Engineering, University of Rhode
Island, Kingston, RI 02881 USA
123
6.1 Abstract
Pulmonary arterial hypertension (PAH) is a progressive disease associated with
structural remodeling of pulmonary vasculature. The excessive proliferation of the
endothelial cells results in thicker vascular walls and eventually in increased
pulmonary resistance. Currently, treatment for PAH is limited to improving quality of
life, rather than treating the disease itself. Therefore, alternative approaches are being
taken to treat and/or slow the progress of the disease. One approach is through
activation of TMEM16A, a calcium-activated chloride channel. Studies have shown
that TMEM16A represents a promising therapeutic target for PAH. Recently, a study
demonstrated TMEM16A’s ability to induce apoptosis of pulmonary endothelial cells
via p38-MAPK-induced apoptosis using Eact, a known activator of TMEM16A.
Complimenting this previous study, the purpose of this study was to develop a
nanocomposite microparticle (nCmP) delivery system for pulmonary administration of
Eact. Results thus far demonstrate successful formation of nCmP, as well as their
favorable deposition in a Next Generation Impactor. Overall, Eact is a polymorphic
small molecule that needs to be further researched to properly develop a stable and
usable formulation for the treatment of PAH.
6.2 Keywords
Acetalated dextran (Ac-Dex); Eact; pulmonary arterial hypertension;
pulmonary drug delivery; nanocomposite microparticles
124
6.3 Abbreviations
2-methoxypropene (2-MOP), acetalated dextran (Ac-Dex), bone morphogenetic
protein receptor-2 (BMPR-2), cyclic-to-acyclic ratio (CAC), dichloromethane (DCM),
dimethyl sulfoxide (DMSO), deionized (DI) water, differential scanning calorimetry
(DSC), dynamic light scattering (DLS), encapsulation efficiency (EE), Karl Fischer
Titration (KFT), nanocomposite microparticles (nCmP), nanoparticles (NP), Next
Generation Impactor (NGI), phosphate buffered saline (PBS), poly(vinyl alcohol)
(PVA), poly(lactic-co-glycolic acid) (PLGA), pyridium p-toluenesulfonate (PPTS),
pulmonary arterial hypertension (PAH), polarized light microscopy (PLM), scanning
electron microscopy (SEM), triethylamine (TEA), ultra performance liquid
chromatography (UPLC), X-ray diffraction (XRD).
6.4 Introduction
Pulmonary arterial hypertension (PAH) is a progressive, life-threatening
cardiovascular disease that is defined by an increase in mean pulmonary arterial
pressure of the right side of the heart (257–259). This increase in pressure can be
traced back to remodeling of the arterial walls, which can result from idiopathic causes
(in most cases), or both genetic anomalies and environmental insults (53, 257).
Ultimately, the remodeling and subsequent thickening of the arterial walls manifests
from excessive proliferation and dysfunction of endothelial cells and inflammation
(260). Currently, treatments for PAH are based on improving overall cardiopulmonary
function and patient quality of life. However, these treatment options are generally
unable to inhibit the progress of the disease (53).
125
Due to the challenges that lie with current treatment options, newer approaches
are being taken to attempt to treat PAH, particularly through focus on cellular-based
mechanisms (53). One approach in treating PAH is through improving the function of
bone morphogenetic protein receptor-2 (BMPR-2) signaling pathway (259). Mutations
to BMPR-2 account for approximately 60-80% of familial cases of PAH (255, 261,
262). To capitalize on this approach, tacrolimus (TAC) has been explored as a possible
therapeutic approach. Aside from its traditional use as an immunosuppressive agent
(254), TAC has been shown to increase BMPR-2 signaling. Clinical evidence has
shown improvements in patients suffering from PAH following treatment with low-
dose TAC, prompting research to further understand the underlying mechanism and
potential use of it as a therapeutic option for the disease (263).
Another approach in the treatment of PAH is the activation of anoctamin-1
(TMEM16A), which, like other calcium-activated chloride channels (CaCCs), is vital
for physiological functions, and is expressed in epithelial and non-epithelial cells
(264–266). In moments of dysfunction, TMEM16A can be associated with diseases
including cancer, cystic fibrosis, and hypertension (265, 267–272). Specifically, an
increase in expression of TMEM16A can lead to increased proliferation of cancer cells
and a decrease in proliferation of smooth muscle tissue (258). Recently, TMEM16A
activation by Eact was shown to promote apoptosis of pulmonary endothelial cells by
the p38-MAPK signaling pathway (258). This apoptotic promotion can be a potential
treatment method, given that the hyperproliferative phenotype of endothelial cells is a
hallmark sign of PAH (258). Eact, the small molecule used in this study, was
originally discovered using cell-based high-throughput screening (273). Prior to 2017,
126
Eact research had been published in a limited amount of studies, primarily as a control
or inducing agent (269, 274, 275).
Pulmonary delivery has received an increasing amount of attention for the
treatment of diseases involving the lungs, primarily due to the potential for localized
delivery to tissue and molecular sites of interest (145, 148, 276). In addition to
localized delivery, pulmonary administration offers reduced systemic side effects, a
rapid onset of action, and avoidance of first-pass metabolism (135, 277). Dry powder
aerosols are a highly attractive method of pulmonary administration owing to the
aforementioned advantages plus increased product stability (via absence of water)
compared to other dosage forms such as nebulizers (145). Typically, dry powder
aerosol particles in the range of < 500 nm are exhaled due to low mass, while particles
that are 1 – 5 μm are likely to deposit in lower regions of the pulmonary system;
however, particles within this range are susceptible to macrophage uptake (53). To
overcome these obstacles, nanocomposite microparticles can be utilized. A nCmP
involves nanoparticles (NP) entrapped in a microparticle matrix. nCmP maintain the 1
- 5 μm size window, allowing for deep lung deposition via sedimentation (45), and
following their deposition, nCmP dissociate to NP, allowing for avoidance of
macrophage uptake.
This study involves the development and evaluation of a nCmP formulation
encapsulating Eact, using acetalated dextran (Ac-Dex) as the polymeric carrier. In
comparison to poly(lactic-co-glycolic acid) (PLGA), Ac-Dex can be produced using a
single-step, facile reaction (53). This reaction can be controlled to alter the acetal
coverage of the dextran backbone, allowing for alteration in the release kinetics
127
associated with its encapsulated cargo. Additionally, degradation of Ac-Dex produces
neutral byproducts (acetone, methanol, dextran) and has been shown to be safe in vivo
(19).
6.5 Materials and Methods
6.5.1 Materials
Unless stated otherwise, all materials were purchased from Sigma Aldrich (St.
Louis, MO). Eact was purchased from Tocris Bioscience (Bristol, UK).
6.5.2 Synthesis and Characterization of Acetalated Dextran
Acetalated dextran (Ac-Dex) was synthesized using previously described
methods with minor modifications (40). 1 g of lyophilized dextran (MW 9,000 –
11,000) was dissolved in 10 mL of anhydrous DMSO with 30 mg of p-
toluenesulfonate (PPTS) under nitrogen gas. The reaction was carried out for 3 hours
by adding 6.5 mL 2-methoxypropene (2-MOP), and the reaction was quenched after 5
minutes using 1 mL of triethylamine (TEA). The polymer was precipitated in basic
water, filtered, lyophilized, and stored at -20°C. The cyclic-to-acyclic (CAC) ratio of
Ac-Dex and acetal coverage was verified using 1H NMR (Bruker 300 MHz, NMR,
MA) as described previously (54).
6.5.3 Synthesis of Eact-Encapsulated Nanoparticles
NP encapsulating 10% (w/w) Eact were synthesized using single
emulsion/solvent evaporation method. 36 mg of Ac-Dex and 4 mg of Eact were
128
dissolved in 1 mL of dichloromethane (DCM) containing 0.01% (w/w) QD. This
organic solution was added to 6 mL of 3% poly(vinyl alcohol) (PVA), and the mixture
was emulsified using a probe sonicator attached to an ultrasonic processer at 120 W
and 20 kHz for 30 seconds, with 1 second on/off pulses and an amplitude of 70%.
6.5.4 nCmP Synthesis Via Spray Drying
nCmP were made using previously established methods, using a Buchi B-290
spray dryer (Buchi Labortechnik, AG, Switzerland) (44, 45). Briefly, NP batches were
combined, diluted to 10 mg/mL, and sonicated for 10 minutes prior to spray drying.
The spray drying conditions were inlet temperature of 70°C, 0.7 mm nozzle diameter,
atomization gas flow rate of 414L/h (nitrogen), aspiration of 28m3/h, pump rate of 0.9
mL/min, and nozzle cleaner rate of 3 (45). Following spray drying, the resulting nCmP
were allowed to dry in the cyclone under nitrogen gas for an additional 15 minutes.
The nCmP were collected in an amber glass vial and stored at -20 °C under
desiccation until use.
6.5.5 Nanoparticle Size and Surface Charge Characterization
The hydrodynamic diameter and surface charge of the NP and re-dispersed NP
were evaluated via dynamic light scattering (DLS) and zeta potential analysis,
respectively, using a Malvern Nano Zetasizer (Malvern Instruments, Worcestershire,
UK). The parent NP and re-dispersed NP were diluted to 0.25 mg/mL in DI water, and
were analyzed at 25°C and an angle of 90°.
129
6.5.6 Particle Morphology and Shape Analysis via Scanning Electron Microscopy
(SEM)
The shape and morphology of nCmP, NP, and raw Eact were evaluated by
SEM using a Zeiss SIGMA VP Field Emission-Scanning Electron Microscope (FE-
SEM) (Germany). NP samples were concentrated to 15 mg/mL and 1 μL of the
resulting suspension was added to aluminum SEM stubs prior to drying (Ted Pella,
Inc., Redding, CA). nCmP and raw Eact samples were added directly to double-sided
adhesive carbon tabs. The samples were sputter coated with a thin film of
gold/palladium alloy under argon gas. Images were taken at 5 kV at various
magnifications.
6.5.7 Crystallinity and Phase Transition Analysis
Thermal phase transitions of the nCmP and raw materials were analyzed via
differential scanning calorimetry (DSC) using a TA Q10 DSC system (TA
Instruments, New Castle, DE) connected to an RSC-90 cooling accessory. 3-5 mg of
sample were hermetically sealed in aluminum pans and were placed into the DSC
furnace. Samples were heated from 0-230°C at a rate of 10°/min (45). The crystallinity
of the nCmP and raw materials were examined by X-ray diffraction (XRD) using a
Rigaku Multiflex X-ray diffractometer (The Woodlands, TX) as described previously
with a scan range of 5-60° in 2Θ with a width of 0.1 and scan rate of 1°/min. (45).
Images of the nCmP and raw materials were observed for birefringence via polarized
light microscopy (PLM) using an AmScope polarized microscope (Irvine, CA) (225,
130
278). Samples were mounted onto microscope slides, smeared with mineral oil for
dispersion, and imaged at 10x at room temperature.
6.5.8 Karl Fischer Coulometric Titration
The water content of nCmP was quantified by Karl Fischer (KF) titration using
a 737 KF coulometer (Metrohm, Riverview, FL). 5 mg of powder was dissolved in
anhydrous methanol. The solution was injected into the reaction cell filled with
Hydranal® KF reagent, and the amount of water was analyzed. Pure solvent was
injected as a background sample.
6.5.9 In Vitro Aerosol Performance
In vitro aerosol performance of the nCmP was evaluated using a Next
Generation Impactor (NGI, MSP Corporation, Shoreview, MN) equipped with a
stainless steel induction port attachment and gravimetric insert cups. The system was
coupled with a TPK 2000 critical flow controller and HCP5 vacuum pump (Copley
Scientific, UK). The air flow rate (Q) was measured and adjusted to 60 L/min prior to
each experiment to simulate breath flow by healthy human patients. Fiber glass filters
(55 mm, Type A/E, Pall Life Sciences, PA) were placed in the insert cups for stages 1
to 7 for the minimization of MP bounce or re-entrapment (279). Filters were weighed
before and after experiments to determine nCmP amount deposited in each stage. 8-12
mg of powder was loaded into hydroxypropyl methylcellulose capsules (HPMC, size
3, Quali-V®, Quali-caps Inc., Whitsett, NC, USA). The capsules were then loaded into
a dry powder inhaler (HandiHaler, Boehringer Ingelheim Pharmaceuticals, CT) and
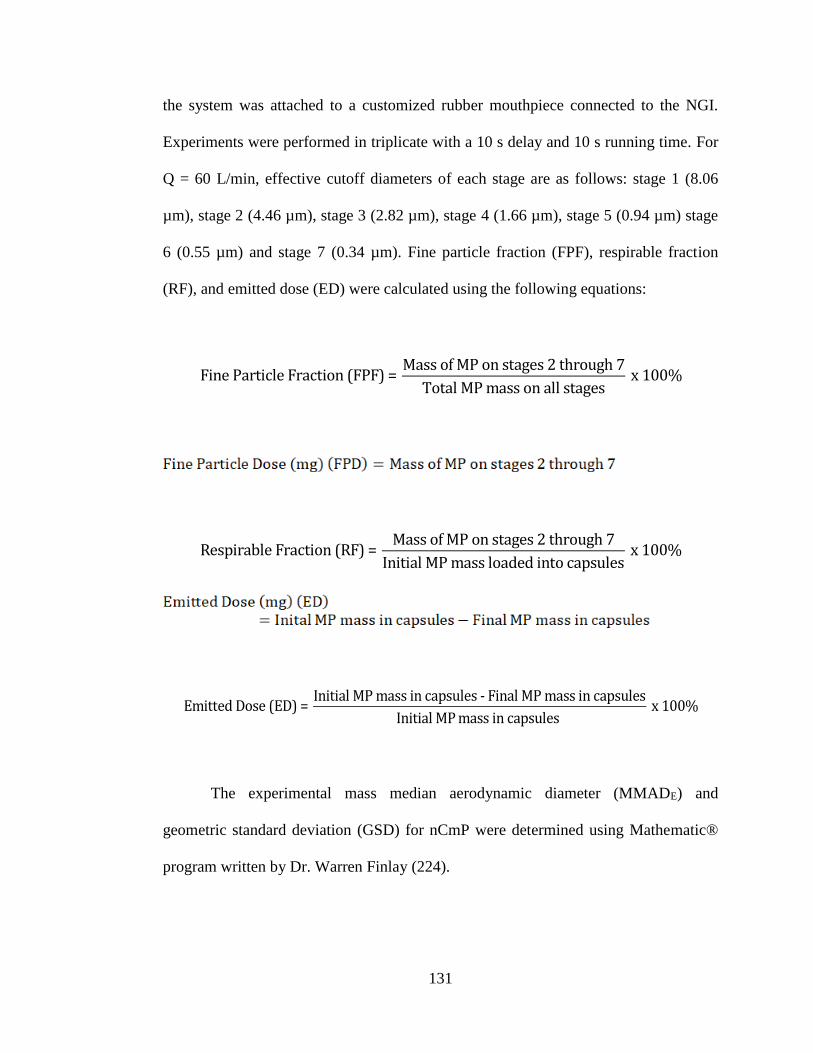
131
the system was attached to a customized rubber mouthpiece connected to the NGI.
Experiments were performed in triplicate with a 10 s delay and 10 s running time. For
Q = 60 L/min, effective cutoff diameters of each stage are as follows: stage 1 (8.06
µm), stage 2 (4.46 µm), stage 3 (2.82 µm), stage 4 (1.66 µm), stage 5 (0.94 µm) stage
6 (0.55 µm) and stage 7 (0.34 µm). Fine particle fraction (FPF), respirable fraction
(RF), and emitted dose (ED) were calculated using the following equations:
FineParticleFraction(FPF)=MassofMPonstages2through7
TotalMPmassonallstagesx100%
RespirableFraction(RF)=MassofMPonstages2through7
InitialMPmassloadedintocapsulesx100%
EmittedDose(ED)=
InitialMPmassincapsules-FinalMPmassincapsules
InitialMPmassincapsulesx100%
The experimental mass median aerodynamic diameter (MMADE) and
geometric standard deviation (GSD) for nCmP were determined using Mathematic®
program written by Dr. Warren Finlay (224).
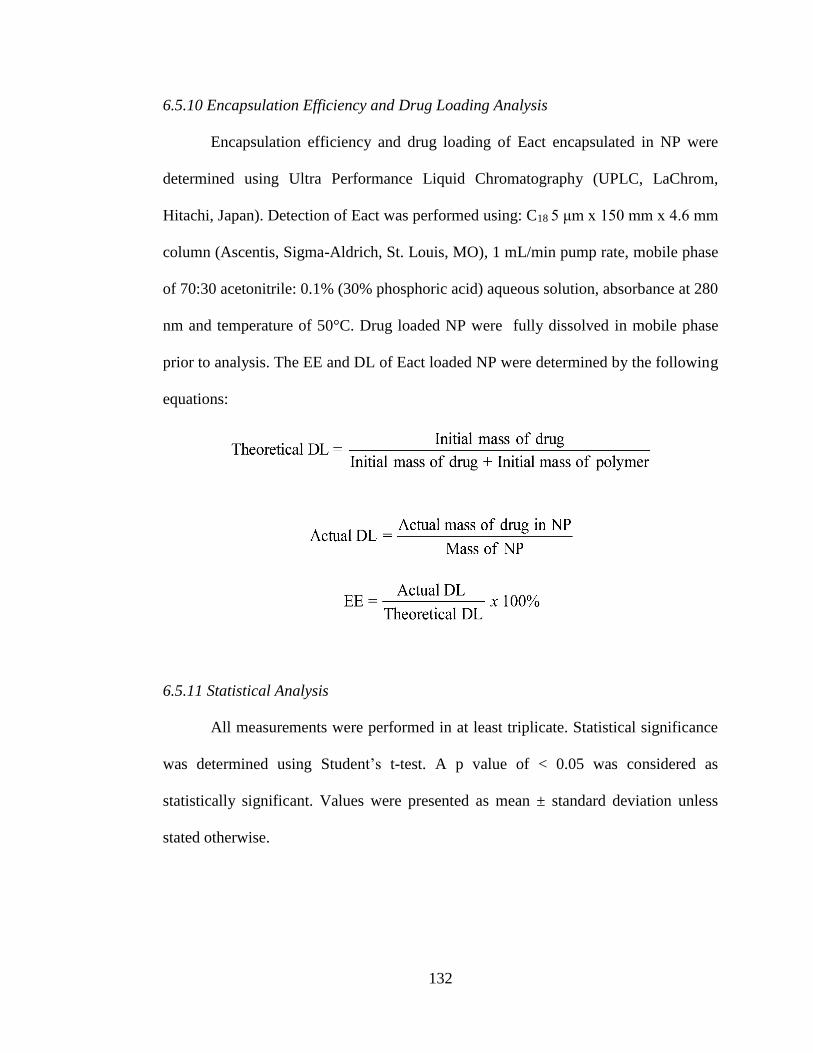
132
6.5.10 Encapsulation Efficiency and Drug Loading Analysis
Encapsulation efficiency and drug loading of Eact encapsulated in NP were
determined using Ultra Performance Liquid Chromatography (UPLC, LaChrom,
Hitachi, Japan). Detection of Eact was performed using: C18 5 μm x 150 mm x 4.6 mm
column (Ascentis, Sigma-Aldrich, St. Louis, MO), 1 mL/min pump rate, mobile phase
of 70:30 acetonitrile: 0.1% (30% phosphoric acid) aqueous solution, absorbance at 280
nm and temperature of 50°C. Drug loaded NP were fully dissolved in mobile phase
prior to analysis. The EE and DL of Eact loaded NP were determined by the following
equations:
6.5.11 Statistical Analysis
All measurements were performed in at least triplicate. Statistical significance
was determined using Student’s t-test. A p value of < 0.05 was considered as
statistically significant. Values were presented as mean ± standard deviation unless
stated otherwise.
133
6.6 Results and Discussion
6.6.1 Morphology Analysis of NP and nCmP
In this study, 3-hour Ac-Dex was used for nanoparticle (NP) synthesis due to
its ability to control the release of therapeutic cargo at physiological conditions for a
longer period of time than 5-min Ac-Dex (36, 45). This phenomenon is due to the
higher ratio of cyclic acetal groups to acyclic groups in 3-hour Ac-Dex compared to 5-
min Ac-Dex, allowing for slower degradation over time (35). In previous studies, it
was shown that both 5-min and 3-hour Ac-Dex allowed for sustained release of
various lipophilic compounds, however, 3-hour Ac-Dex resulted in longer release of
these compounds (35, 43, 45).
As shown in Table 6.1, Eact-loaded NP were 191 nm in diameter, with
favorable polydispersity (0.11) and surface charge (functionally neutral; -4.18 mV).
The loading of Eact in the Eact NP formulation was 27.6 μg Eact/mg NP with an
overall Eact encapsulation efficiency of 25.9%. Following spray drying, nCmP were
re-dispersed in DI water to allow for dissociation into parent Eact NP. Like parent NP,
re-dispersed Eact-loaded NP were less than 200 nm in diameter, with similar PDI
(0.11) and surface charge (-4.20 mV). Statistical analysis showed that the two groups
were not significantly different from one another (p > 0.05). Parent Eact NP and Eact
NP re-dispersed from nCmP exhibited smooth and spherical morphology, whereas
nCmP were agglomerations of NP with corrugated structure (Figure 6.1).
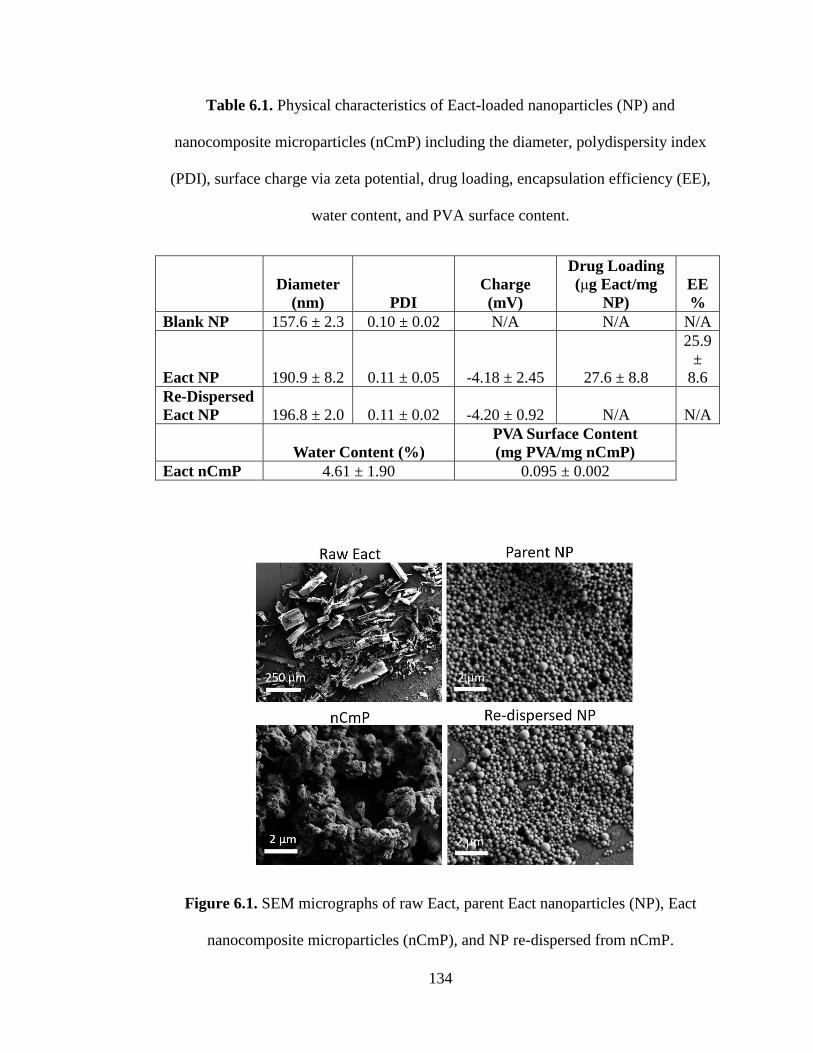
134
Table 6.1. Physical characteristics of Eact-loaded nanoparticles (NP) and
nanocomposite microparticles (nCmP) including the diameter, polydispersity index
(PDI), surface charge via zeta potential, drug loading, encapsulation efficiency (EE),
water content, and PVA surface content.
Diameter
(nm) PDI
Charge
(mV)
Drug Loading
(μg Eact/mg
NP)
EE
%
Blank NP 157.6 ± 2.3 0.10 ± 0.02 N/A N/A N/A
Eact NP 190.9 ± 8.2 0.11 ± 0.05 -4.18 ± 2.45 27.6 ± 8.8
25.9
±
8.6
Re-Dispersed
Eact NP 196.8 ± 2.0 0.11 ± 0.02 -4.20 ± 0.92 N/A N/A
Water Content (%)
PVA Surface Content
(mg PVA/mg nCmP)
Eact nCmP 4.61 ± 1.90 0.095 ± 0.002
Figure 6.1. SEM micrographs of raw Eact, parent Eact nanoparticles (NP), Eact
nanocomposite microparticles (nCmP), and NP re-dispersed from nCmP.
135
The formation of the corrugated nCmP structures are a result of the spray-
drying process (45). Following suspension of NP in water, the suspension is exposed
to the drying gas, resulting in NP dispersed in droplets. As water evaporates, NP are
transported to the outside of the droplet due to droplet saturation (280). Once drying
occurs the droplet walls collapse, resulting in corrugation (145). The hollow structure
of the particles results in lower particle density, altering the overall aerodynamic
diameter, and increasing flowability during patient inspiration (146). Additionally, due
to their ability to dissociate into NP following sedimentation, nCmP are able to
delivery NP to the latter depths of the lungs (44).
6.6.2 Solid-State Analysis of nCmP
X-ray diffractograms of raw Eact, Eact nCmP, and raw 3-hour Ac-Dex are
shown in Figure 6.2A. Raw Eact exhibited strong signals corresponding to
crystallinity, whereas Ac-Dex showed no distinct peaks, indicating an amorphous
physical characteristic. Eact nCmP exhibited fewer peaks, although several strong
visible peaks were present. It is possible that the lack of peaks is due to a detection
limitation of the equipment, in addition to the lower drug loading. DSC thermograms
of raw Eact showed a melting peak at 105°C (Figure 6.2B), whereas no observable
transitions were observed for raw 3-hour Ac-Dex. Following spray drying and
formation of the nCmP, two endothermic peaks were seen at 155°C and 200°C for
Eact nCmP, corresponding to possible polymorphs of Eact. Prior to the melting of
Eact nCmP at 200°C, brief re-crystallization may have occurred at 155ºC, signifying
an increase in molecular mobility and subsequent re-crystallization to form another
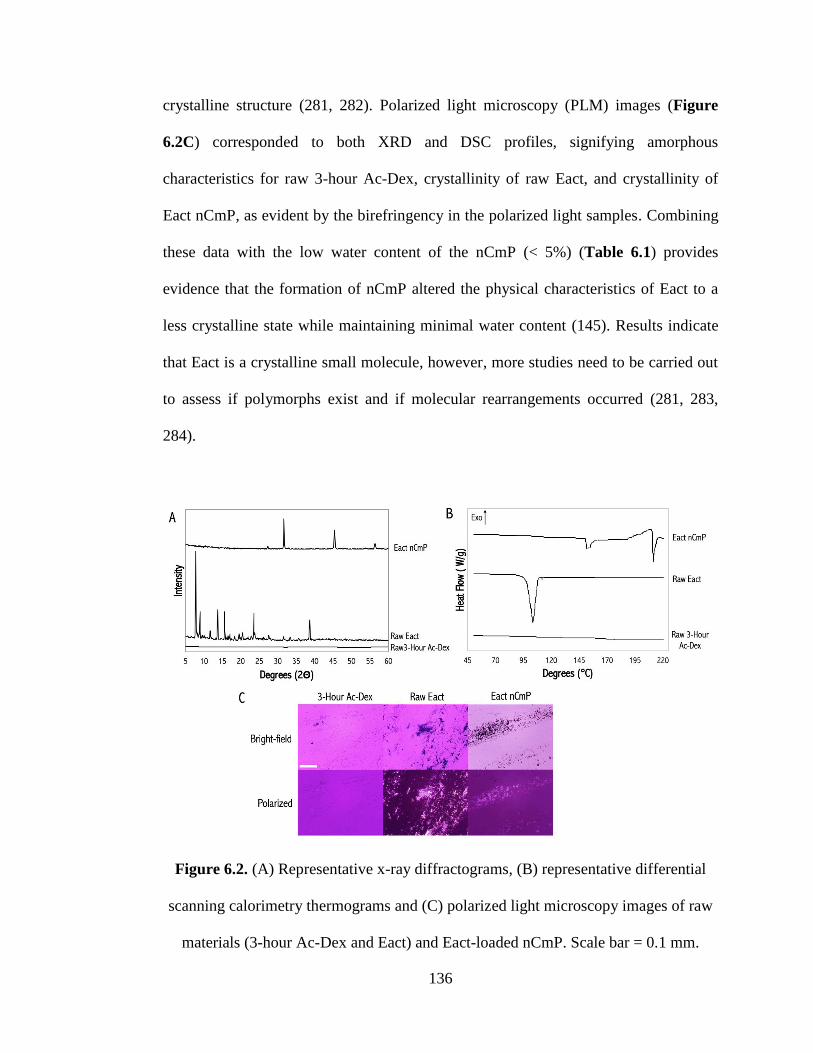
136
crystalline structure (281, 282). Polarized light microscopy (PLM) images (Figure
6.2C) corresponded to both XRD and DSC profiles, signifying amorphous
characteristics for raw 3-hour Ac-Dex, crystallinity of raw Eact, and crystallinity of
Eact nCmP, as evident by the birefringency in the polarized light samples. Combining
these data with the low water content of the nCmP (< 5%) (Table 6.1) provides
evidence that the formation of nCmP altered the physical characteristics of Eact to a
less crystalline state while maintaining minimal water content (145). Results indicate
that Eact is a crystalline small molecule, however, more studies need to be carried out
to assess if polymorphs exist and if molecular rearrangements occurred (281, 283,
284).
Figure 6.2. (A) Representative x-ray diffractograms, (B) representative differential
scanning calorimetry thermograms and (C) polarized light microscopy images of raw
materials (3-hour Ac-Dex and Eact) and Eact-loaded nCmP. Scale bar = 0.1 mm.
137
6.6.3 Aerosol Performance Characterization of nCmP
In vitro aerosol performance of nCmP was evaluated using a Next Generation
Impactor (NGI) coupled to a dry powder inhaler. nCmP deposited on all stages of the
NGI (Figure 6.3), indicating the potential for the particles to deposit in multiple areas
of the lungs. The high fine particle fraction (>96%, Table 6.2) indicates that a
significant portion of the particles are capable of aerosolization (53, 54). In addition,
RF and ED were similar or higher than previously published studies, and indicate that
inhalation of nCmP aerosols would likely result in effective particle delivery to the
lungs. MMADE values were within the 1-5 μm range necessary for deep lung
deposition (45), while geometric standard deviation (GSD) was higher compared to
previous studies (45, 49, 53, 153, 285). The high GSD is likely due to unequal
agglomeration of the NP when forming the nCmP (44). PAH is a cardiopulmonary
related disease, and would benefit from deep lung deposition due to the high
vascularization of alveolar tissue and location of the arterial walls of the heart (53,
142, 257). While MP have shown the capability for deep lung deposition, a previously
published study evaluated the aerosol performance between nCmP and MP. Results
indicated that nCmP were able to better deposit in latter stages of the NGI compared to
MP. Due to the location of PAH, utilization of nCmP formulations may be more
beneficial than MP (45).
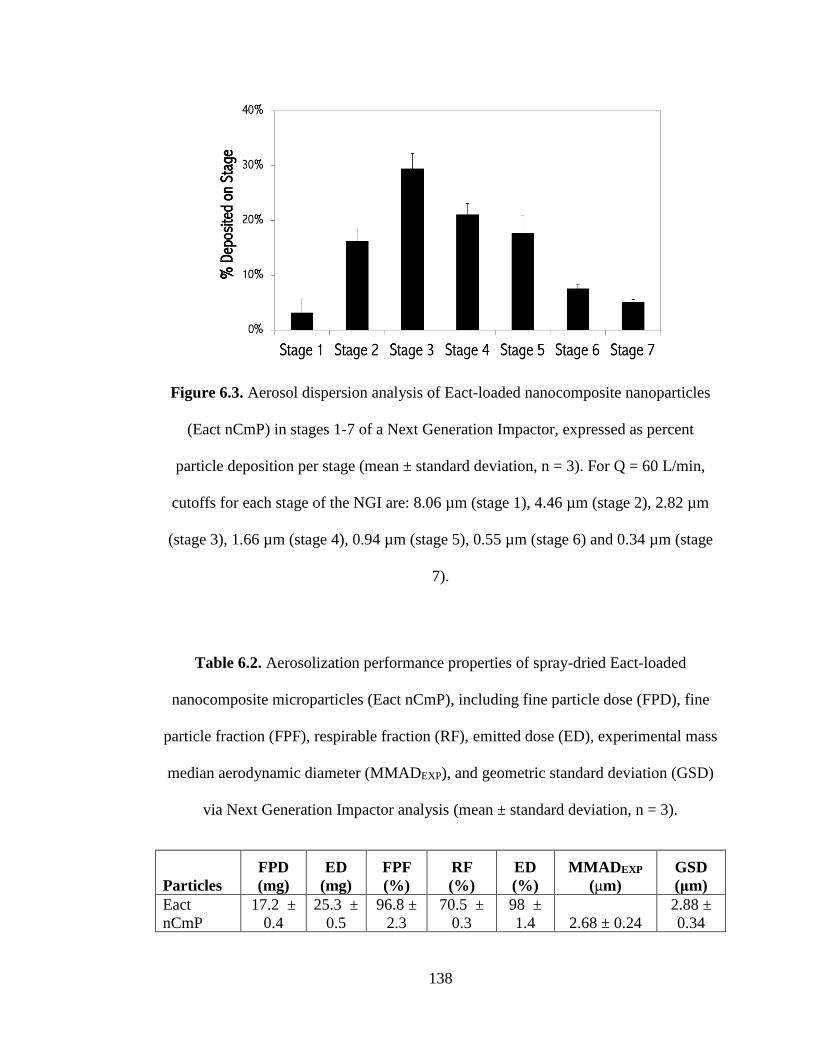
138
Figure 6.3. Aerosol dispersion analysis of Eact-loaded nanocomposite nanoparticles
(Eact nCmP) in stages 1-7 of a Next Generation Impactor, expressed as percent
particle deposition per stage (mean ± standard deviation, n = 3). For Q = 60 L/min,
cutoffs for each stage of the NGI are: 8.06 µm (stage 1), 4.46 µm (stage 2), 2.82 µm
(stage 3), 1.66 µm (stage 4), 0.94 µm (stage 5), 0.55 µm (stage 6) and 0.34 µm (stage
7).
Table 6.2. Aerosolization performance properties of spray-dried Eact-loaded
nanocomposite microparticles (Eact nCmP), including fine particle dose (FPD), fine
particle fraction (FPF), respirable fraction (RF), emitted dose (ED), experimental mass
median aerodynamic diameter (MMADEXP), and geometric standard deviation (GSD)
via Next Generation Impactor analysis (mean ± standard deviation, n = 3).
Particles
FPD
(mg)
ED
(mg)
FPF
(%)
RF
(%)
ED
(%)
MMADEXP
(μm)
GSD
(μm)
Eact
nCmP
17.2 ±
0.4
25.3 ±
0.5
96.8 ±
2.3
70.5 ±
0.3
98 ±
1.4 2.68 ± 0.24
2.88 ±
0.34
139
6.7 Conclusions
An aerosol nCmP system was developed for the delivery of the novel
therapeutic Eact that can be used to treat pulmonary arterial hypertension. Results thus
far show that Eact was successfully encapsulated in 3-hour Ac-Dex NP and that the
resulting NP were successfully formulated into nCmP. The size of NP before nCmP
synthesis and after dissociation from the nCmP were below 200 nm and were similar
with respect to surface charge and PDI, providing evidence that NP characteristics
were not altered following encapsulation in and release from nCmP. XRD data
indicated changes in Eact crystallinity following nCmP formation. In addition, DSC
thermograms showed the presence of two crystalline states in Eact nCmP, indicating
the polymorphic nature of Eact. The water content of nCmP were below 5%. Finally,
nCmP showed favorable aerosol performance, capable of depositing in all stages of
the NGI. Overall, Eact-encapsulated nCmP may be a favorable delivery system for
Eact for the treatment of PAH in a patient convenient and effective manner. However,
the polymorphic nature of Eact must be evaluated further and the crystallinity of Eact
may need to be controlled through the use of additional polymers.
6.8 Acknowledgements
The authors thank Dr. Gaurav Choudhary M.D and the Vascular Research
Laboratory for the purchase of Eact, and RIN2 for SEM and XRD access.
Additionally, this work was made possible by the use of equipment and services
available through the RI-INBRE Centralized Research Core Facility.
140
CHAPTER 7
CONCLUSIONS AND FUTURE WORK
7.1 Conclusions
This primary focus of this dissertation was on the exploration of the polymer
acetalated dextran (Ac-Dex) as a versatile drug carrier that has the potential to
overcome contemporary obstacles in drug delivery. One of the main obstacles faced in
drug delivery applications is drug toxicity and a cause of this is the typical lack of
active targeting for drug delivery systems to reach desired tissues. To actively target
macrophages in an effort to combat this obstacle, Ac-Dex nanoparticles (NP) were
coated in phosphatidylserine (PS) to mimic apoptotic cells. Results indicated minimal
toxicity of the NP delivery systems, as well as significant PS NP uptake by
macrophages, providing evidence that active targeting is achievable using Ac-Dex-
based nanoparticle formulations.
Sustained release of therapeutics is an ongoing research interest, for both lipophilic
and hydrophilic entities. However, the release of hydrophilic entities is inherently
more difficult to control, given their solubility in biological medium and the inability
to control the release of these entities can generate another avenue for drug toxicity.
Taking advantage of Ac-Dex’s hydrophobicity and tunability, multiple aerosol powder
formulations were synthesized via spray drying to modify the release behavior of a
highly water-soluble dye. Results show that the release kinetics were both pH and
141
polymer tunability dependent, where sustained release was reached in physiological
conditions and controlled release was achieved in acidic conditions. In addition, 3-
hour and 5-minute Ac-Dex experienced differences in their kinetic analysis, where the
former resulted in slower release of a water-soluble compound.
During the production of nanoscale delivery systems, purification methods are
employed to ensure that the desired product is collected and packaged prior to usage.
However, conventional methods of purification may be inefficient, especially when
scale-up approaches are needed. To overcome this challenge, tangential flow filtration
was evaluated using a DoE approach to understand the influence of key parameters on
NP characteristics using Ac-Dex as a model carrier. Following this, a set of parameters
were chosen, and using these parameters, NP were synthesized, encapsulating one of
three small molecules. Results show that tangential flow filtration is a suitable
purification method but requires drug, system, and external factor considerations.
PAH is a life-threatening disease with no known treatment options. Current
therapeutics for the disease rely on improving quality of life rather than slowing the
progress of the disease. Eact, a TMEM16A activator, has been shown to induce
apoptosis of hyperproliferating pulmonary endothelial cells, and can serve as a
possible route of treatment. Utilizing the rationale described previously, nCmP were
developed with the intention of pulmonary administration to increase localization and
subsequent absorption of Eact into the cardiopulmonary regions of the body.
Preliminary data shows that nCmP encapsulating Eact were successful in depositing in
latter stages of an NGI, simulating deep lung deposition. It was also determined that
142
Eact is a highly-crystalline, polymorphic small molecule that requires further
exploration into both the polymorphs and possible formulation development.
7.2 Future Work
Although this dissertation provides a comprehensive evaluation of Ac-Dex and its
promise as a drug carrier, there are still opportunities to further research the
biopolymer. These opportunities include
1. The use of Ac-Dex in other delivery systems not mentioned here or in literature.
2. Investigation of Ac-Dex-based systems designed here using disease models and
active pharmaceuticals.
3. Use of in vivo models to demonstrate the potential of the systems described and
researched in this dissertation.
4. Completion of studies that were based on preliminary data.
5. Usage of other polymers to aid in Ac-Dex’s encapsulation.

143
APPENDIX A
Supplementary Material for Chapter 3
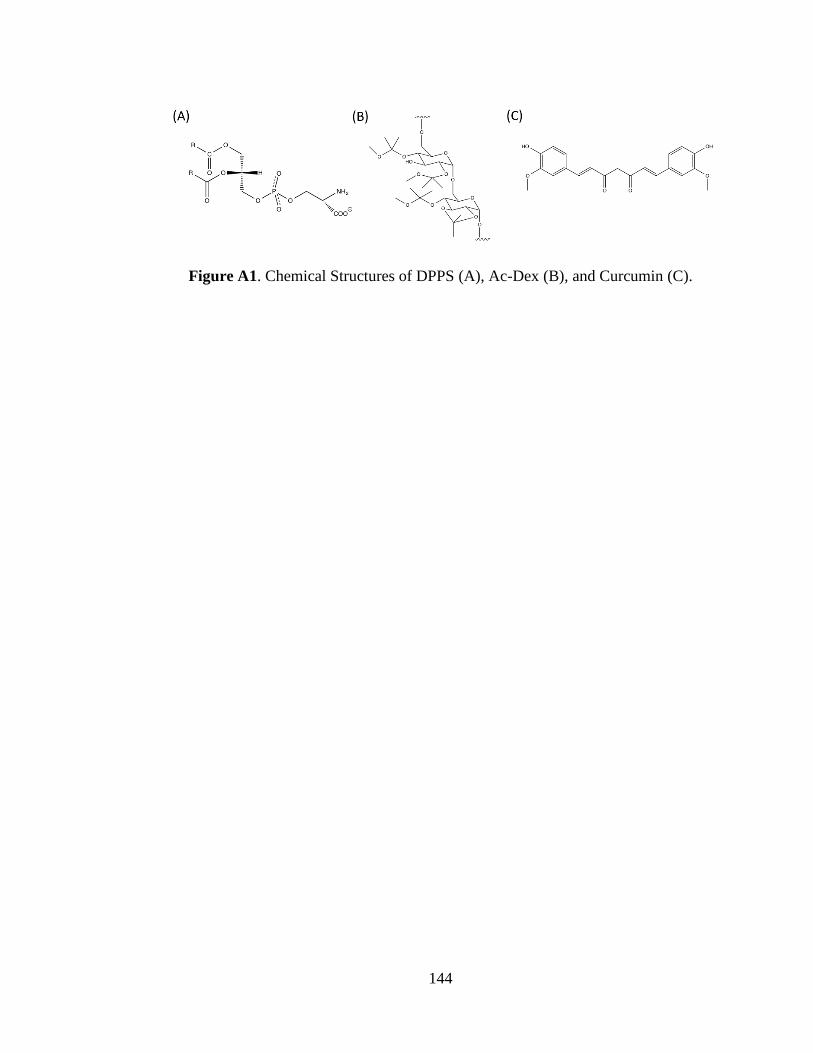
144
Figure A1. Chemical Structures of DPPS (A), Ac-Dex (B), and Curcumin (C).
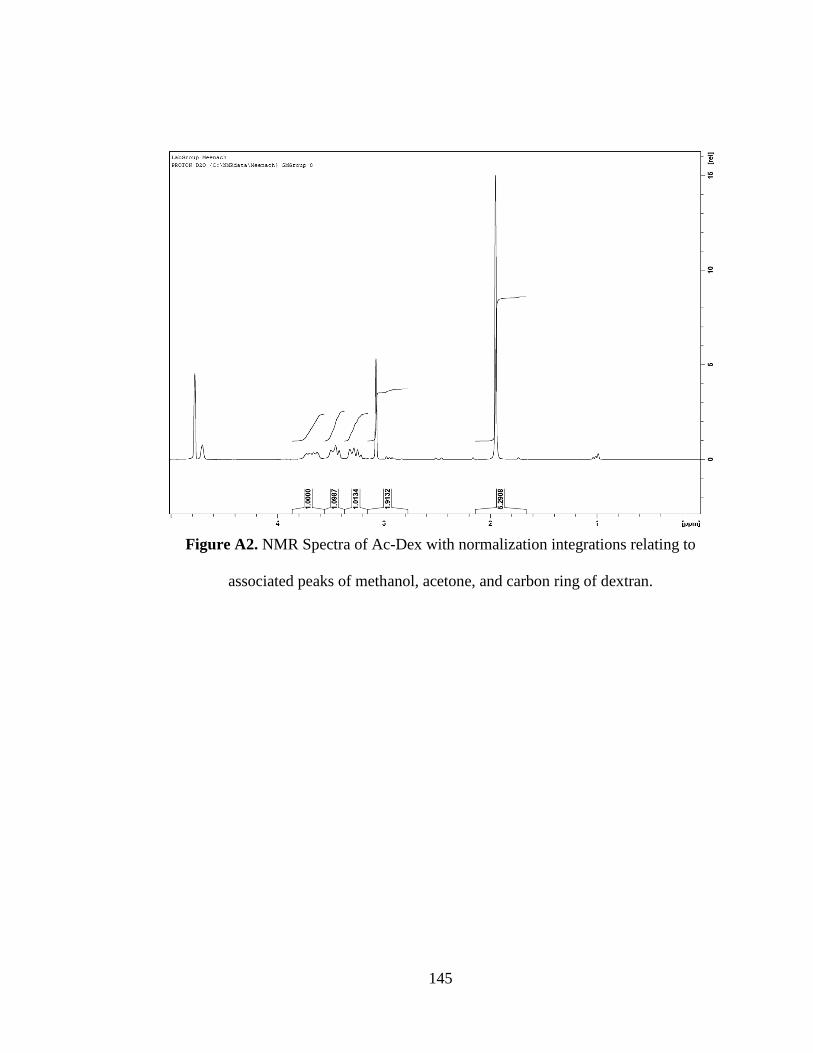
145
Figure A2. NMR Spectra of Ac-Dex with normalization integrations relating to
associated peaks of methanol, acetone, and carbon ring of dextran.
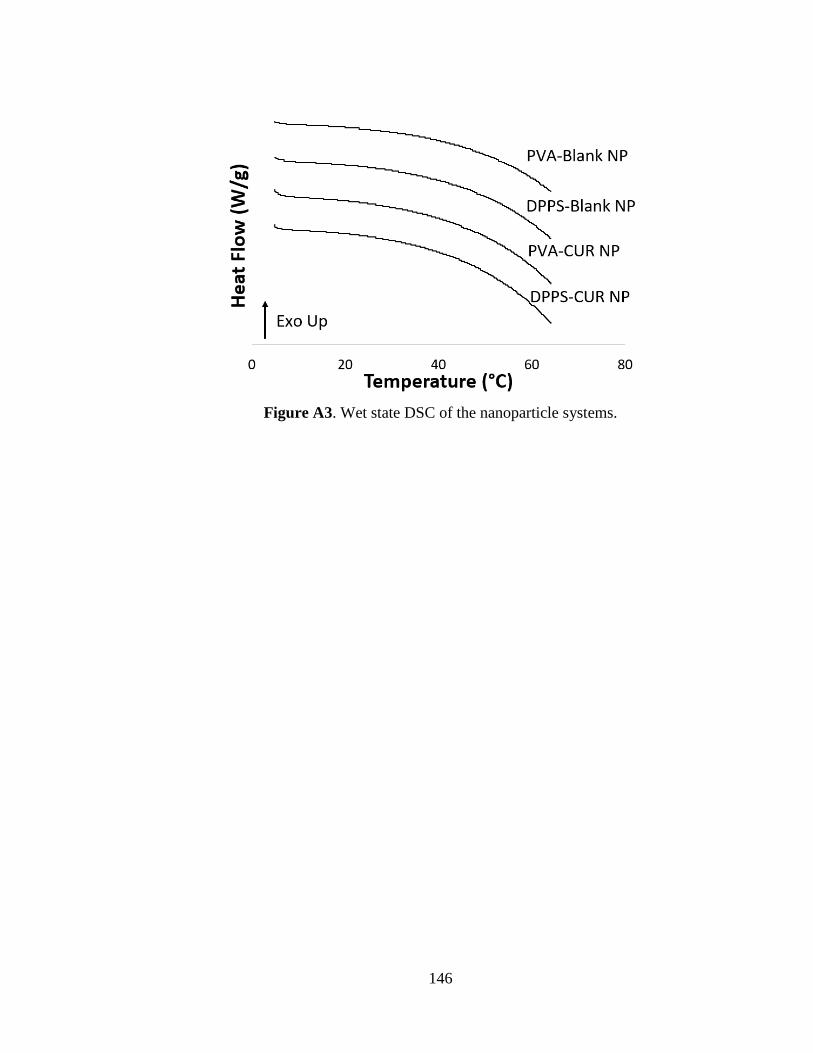
146
Figure A3. Wet state DSC of the nanoparticle systems.
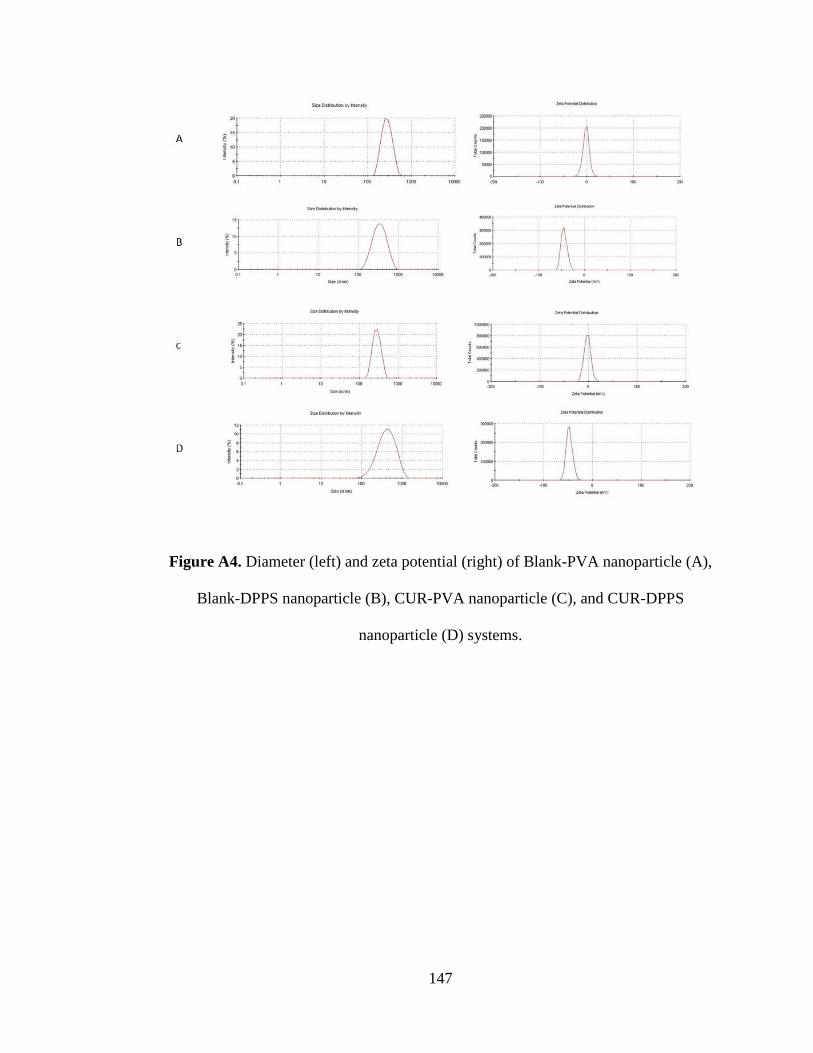
147
Figure A4. Diameter (left) and zeta potential (right) of Blank-PVA nanoparticle (A),
Blank-DPPS nanoparticle (B), CUR-PVA nanoparticle (C), and CUR-DPPS
nanoparticle (D) systems.

148
APPENDIX B
Supplementary Material for Chapter 4
149
B.1 Materials
The following chemicals were used: dextran from Leuconostoc mesenteroides
(9,000-11,000 MW), pyridinium p-toluenesulfonate (PPTS, ≥ 99.9%), 2-
methoxypropene (2-MOP, ≥ 97%), triethylamine (TEA, ≥ 99%), anhydrous dimethyl
sulfoxide (DMSO, ≥ 99.9%), deuterium chloride (DCl, 35 wt% in D2O, ≥ 99% atom
D), sodium acetate (≥ 99%), acetic acid (1.0 N), chloroform (≥ 99%), anhydrous
methanol (≥ 99.9%), and isopropanol (≥ 99%), sulforhodamine B sodium salt (SRB),
Hydranal® KF reagent, and deuterium oxide (D2O, 99.8% atom D). All cell culture
materials were purchased from American Type Culture Collection (ATCC, Manassas,
VA, USA), Caisson Labs (Smithfield, UT, USA), or Fisher Scientific.
B.1.1 Kinetics and Release Models
The zero-order model describes the constant, controlled release of drug from a
drug formulation, disregarding changes in equilibrium and erosion of the formulation
(286). Ideal delivery of drugs would follow zero-order kinetics to keep blood levels
constant. The zero-order model is described by:
M
t= K
0t + M
0
where Mt is the mass of drug released at time t, M0 is the initial mass of drug released
at t = 0, and K0 is the zero-order release rate constant.
150
The first-order model describes drug release profiles as proportional to the
amount of unreleased drug remaining at time, t, thereby indicating sustained release of
the drug (286), as described by:
logC
t= logC
0+
K1
2.303t
where Ct is the concentration of drug at time t, C0 is the initial drug concentration at t
= 0, and K1 is the first-order release rate constant.
The Higuchi model describes drug release profiles based on square root time
dependence (286) as seen in:
Mt
M¥
= KHt1/2
where Mt/M∞ is fraction of drug released at time t and KH is the Higuchi dissolution
constant.
The Korsmeyer-Peppas (K-P) model (a.k.a. Ritger-Peppas model) is a semi-
empirical model that exponentially relates the amount of drug released with time (286)
as seen in:
Mt
M¥
= KKP
t n
151
where Mt/M∞ is fraction of drug released at time t, KKP is the Korsmeyer-Peppas
release rate constant that characterizes the structural and geometric properties of the
particles, and n is the drug release exponent indicating the drug release mechanism.
The K-P model allows for the understanding of the type of dissolution mechanism
occurring during degradation, where an n value of 0.43 indicates Fickian diffusion, n
of 0.85 indicates case II transport (erosion), and 0.43 < n < 0.85 indicates anomalous
drug transport.
The Corrigan model is used to model burst release kinetics by combining
contributions from first-order kinetics and polymer degradation, where release of drug
molecules close to the surface of the system and polymer degradation are both
contributions to release (234, 235).
Q =
Mt
M¥= F
B ,in1-exp -K
Ct( )( )
where Q is the fraction of drug released at time t, FB,in is the fraction of drug released
during burst, and KC is the first-order Corrigan rate constant associated with the
kinetics of the burst release (227).
The Peppas-Sahlin model (236, 237) accounts for both Fickian diffusion (first
term in equation) and case II relaxation (second term in equation) release
contributions:
Mt
M¥
= k1t m +k
2t2m
152
where Mt/M∞ is fraction of drug released at time t, k1 and k2 are the kinetic constants,
and m is the diffusional exponent. The ratio of relaxation versus Fickian contributions
can be calculated from:
R
F=
k2
k1
t m
where R/F = 1 indicates a release mechanism contains both erosion and diffusion
equally, R/F > 1 indicates that relaxation (erosion) dominates, and R/F < 1 indicates
that diffusion dominates.
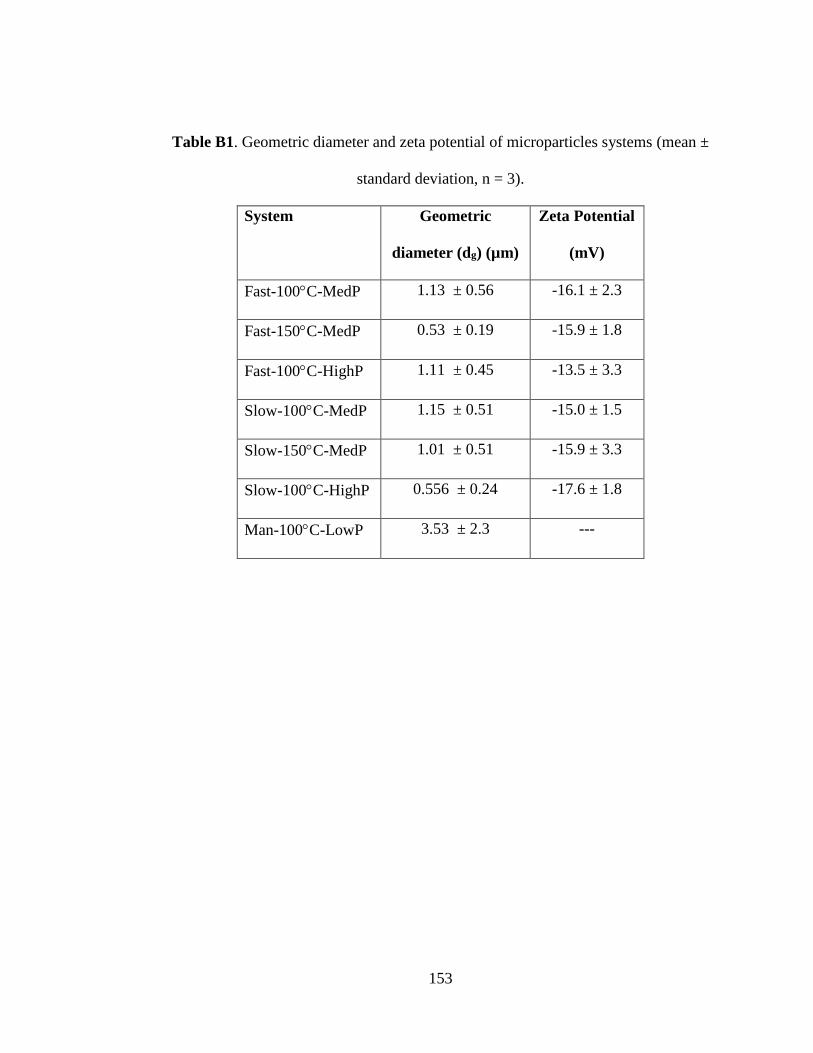
153
Table B1. Geometric diameter and zeta potential of microparticles systems (mean ±
standard deviation, n = 3).
System Geometric
diameter (dg) (µm)
Zeta Potential
(mV)
Fast-100C-MedP 1.13 ± 0.56 -16.1 ± 2.3
Fast-150C-MedP 0.53 ± 0.19 -15.9 ± 1.8
Fast-100C-HighP 1.11 ± 0.45 -13.5 ± 3.3
Slow-100C-MedP 1.15 ± 0.51 -15.0 ± 1.5
Slow-150C-MedP 1.01 ± 0.51 -15.9 ± 3.3
Slow-100C-HighP 0.556 ± 0.24 -17.6 ± 1.8
Man-100C-LowP 3.53 ± 2.3 ---
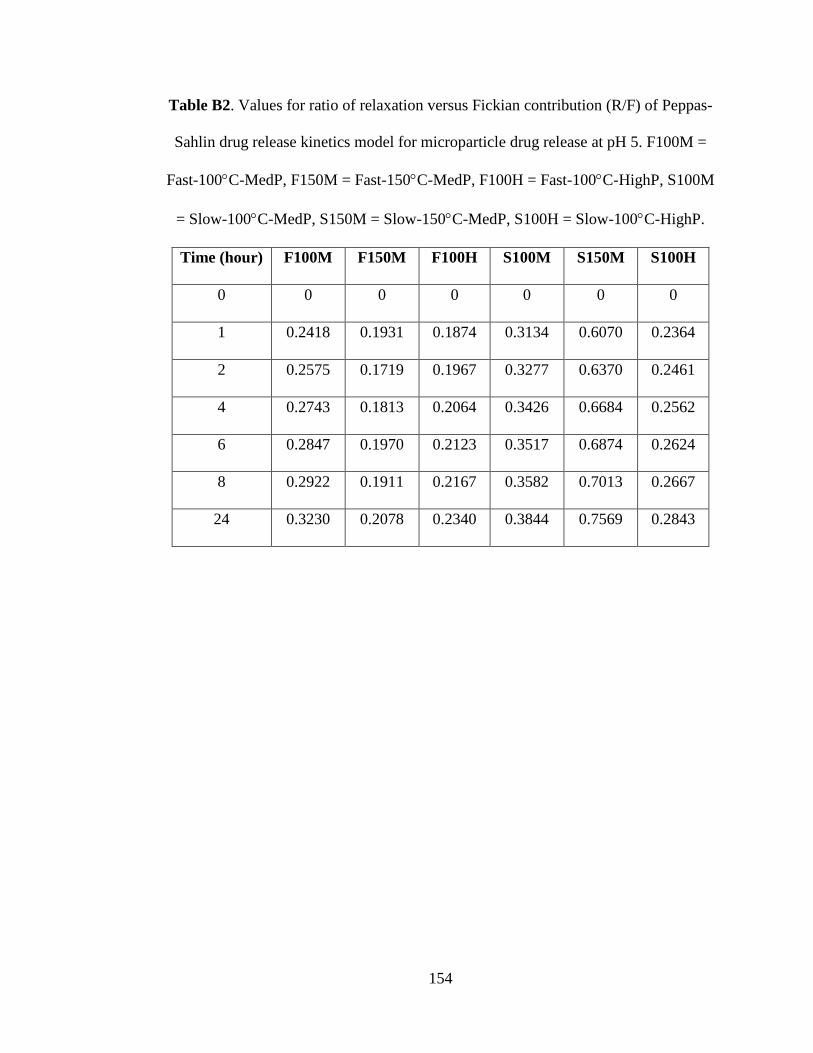
154
Table B2. Values for ratio of relaxation versus Fickian contribution (R/F) of Peppas-
Sahlin drug release kinetics model for microparticle drug release at pH 5. F100M =
Fast-100C-MedP, F150M = Fast-150C-MedP, F100H = Fast-100C-HighP, S100M
= Slow-100C-MedP, S150M = Slow-150C-MedP, S100H = Slow-100C-HighP.
Time (hour) F100M F150M F100H S100M S150M S100H
0 0 0 0 0 0 0
1 0.2418 0.1931 0.1874 0.3134 0.6070 0.2364
2 0.2575 0.1719 0.1967 0.3277 0.6370 0.2461
4 0.2743 0.1813 0.2064 0.3426 0.6684 0.2562
6 0.2847 0.1970 0.2123 0.3517 0.6874 0.2624
8 0.2922 0.1911 0.2167 0.3582 0.7013 0.2667
24 0.3230 0.2078 0.2340 0.3844 0.7569 0.2843
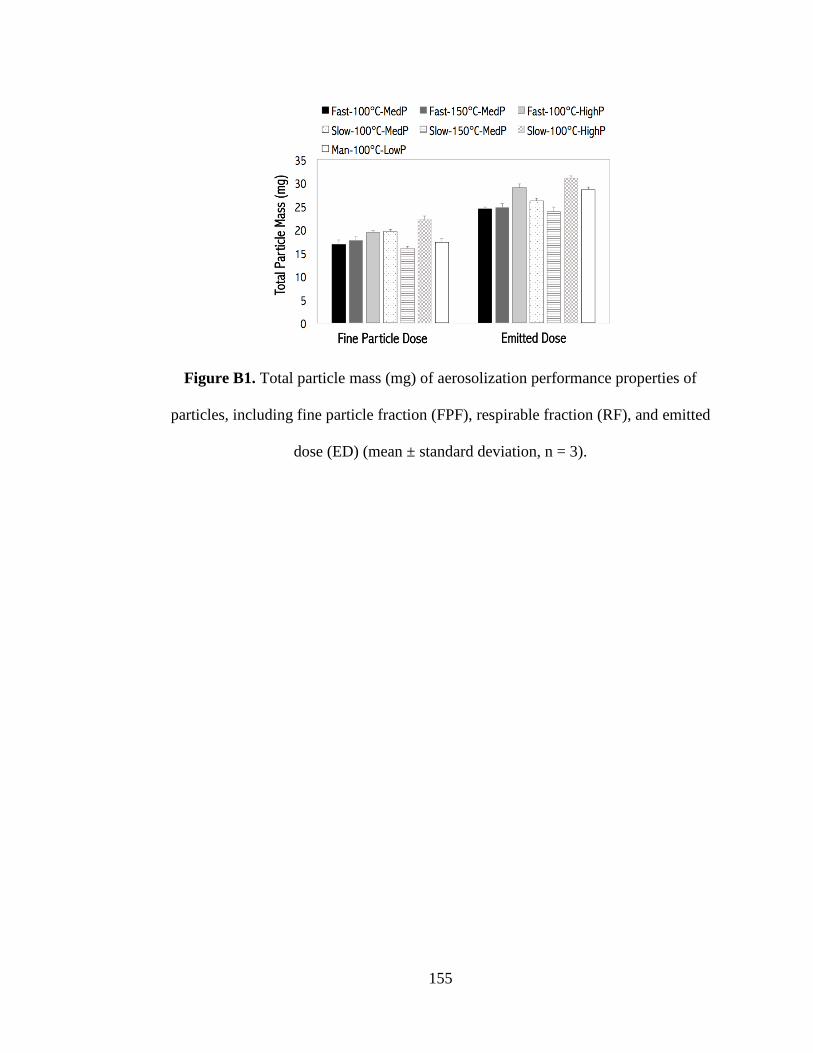
155
Figure B1. Total particle mass (mg) of aerosolization performance properties of
particles, including fine particle fraction (FPF), respirable fraction (RF), and emitted
dose (ED) (mean ± standard deviation, n = 3).
156
APPENDIX C
Supplementary Material for Chapter 5
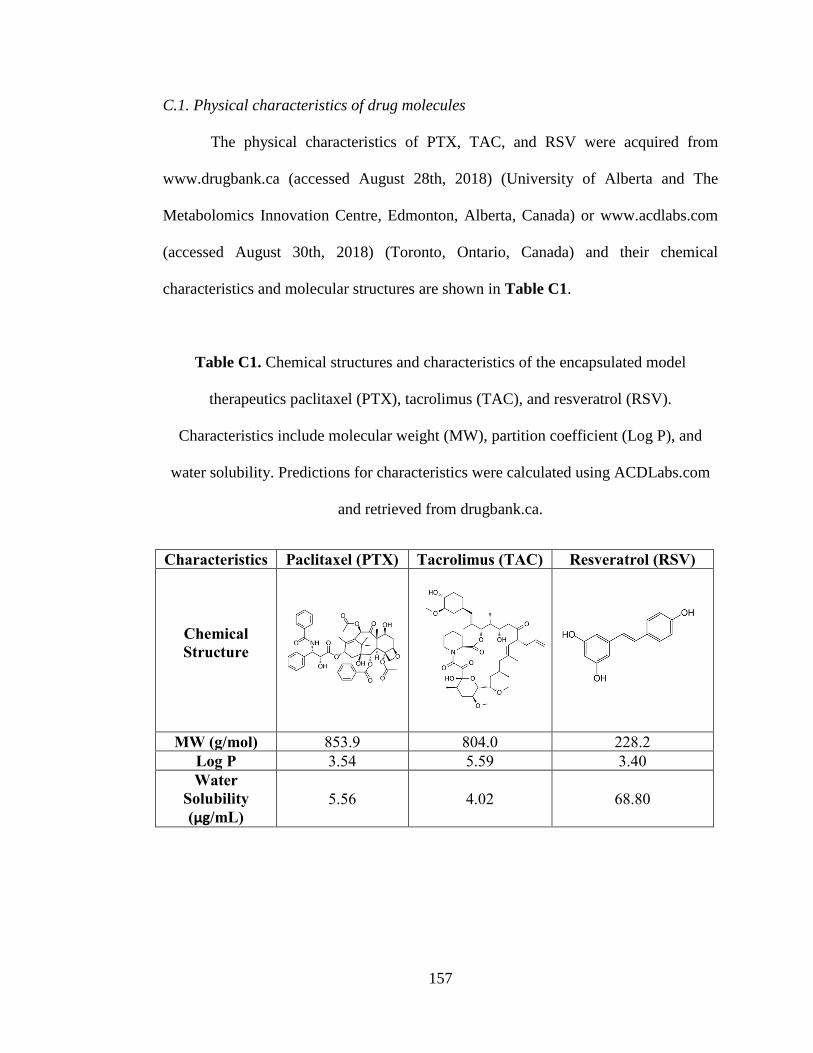
157
C.1. Physical characteristics of drug molecules
The physical characteristics of PTX, TAC, and RSV were acquired from
www.drugbank.ca (accessed August 28th, 2018) (University of Alberta and The
Metabolomics Innovation Centre, Edmonton, Alberta, Canada) or www.acdlabs.com
(accessed August 30th, 2018) (Toronto, Ontario, Canada) and their chemical
characteristics and molecular structures are shown in Table C1.
Table C1. Chemical structures and characteristics of the encapsulated model
therapeutics paclitaxel (PTX), tacrolimus (TAC), and resveratrol (RSV).
Characteristics include molecular weight (MW), partition coefficient (Log P), and
water solubility. Predictions for characteristics were calculated using ACDLabs.com
and retrieved from drugbank.ca.
Characteristics Paclitaxel (PTX) Tacrolimus (TAC) Resveratrol (RSV)
Chemical
Structure
MW (g/mol) 853.9 804.0 228.2
Log P 3.54 5.59 3.40
Water
Solubility
(μg/mL)
5.56 4.02 68.80
158
C.2 Ultra performance liquid chromatography (UPLC) analysis
The quantification of PTX, TAC, and RSV was conducted using UPLC (LaChrom,
Hitachi, Japan). A C18 column (5 µm, 150 mm 4.6 mm, Ascentis, St. Louis, MO)
was used at a flow rate of 1 mL/min. For PTX and TAC content determination, the
mobile phase consisted of 70% (v/v) acetonitrile (ACN) and 30% (v/v) aqueous
phosphoric acid (0.1%, v/v) and the column temperature was set at 50°C. The UV
wavelengths were 227 nm and 215 nm, respectively. For RSV content determination,
the mobile phase was 50% ACN and 50% water containing 0.1% trifluoroacetic acid.
The column temperature was set at room temperature and the UV wavelength was set
at 306 nm.
159
BIBLIOGRAPHY
1. Bobo D, Robinson KJ, Islam J, Thurecht KJ, Corrie SR (2016) Nanoparticle-
Based Medicines: A Review of FDA-Approved Materials and Clinical Trials to
Date. Pharm Res 33(10):2373–2387.
2. Kamaly N, Yameen B, Wu J, Farokhzad OC (2016) Degradable controlled-
release polymers and polymeric nanoparticles: Mechanisms of controlling drug
release. Chem Rev 116(4):2602–2663.
3. Loira-Pastoriza C, Todoroff J, Vanbever R (2014) Delivery strategies for
sustained drug release in the lungs. Adv Drug Deliv Rev 75:81–91.
4. Mohyeldin SM, Mehanna MM, Elgindy NA (2016) The relevancy of controlled
nanocrystallization on rifampicin characteristics and cytotoxicity. Int J
Nanomedicine 11:2209–2222.
5. Junghanns JUAH, Müller RH (2008) Nanocrystal technology, drug delivery and
clinical applications. Int J Nanomedicine 3(3):295–309.
6. Bannunah AM, Vllasaliu D, Lord J, Stolnik S (2014) Mechanisms of
nanoparticle internalization and transport across an intestinal epithelial cell
model: effect of size and surface charge. Mol Pharm 11(12):4363–4373.
7. Li M, et al. (2018) Enhanced Synergism of Thermo-chemotherapy For Liver
Cancer with Magnetothermally Responsive Nanocarriers. Theranostics
8(3):693–709.
8. Tyagi P, Subramony JA (2018) Nanotherapeutics in oral and parenteral drug
delivery: Key learnings and future outlooks as we think small. J Control
Release 272(December 2017):159–168.
160
9. Wu B, et al. (2017) MRI-guided targeting delivery of doxorubicin with
reduction-responsive lipid-polymer hybrid nanoparticles. Int J Nanomedicine
12:6871–6882.
10. Geelen T, et al. (2012) Internalization of paramagnetic phosphatidylserine-
containing liposomes by macrophages. J Nanobiotechnology 10(1):37.
11. Jiang SP, et al. (2013) Preparation and characteristics of lipid nanoemulsion
formulations loaded with doxorubicin. Int J Nanomedicine 8:3141–3150.
12. Romeo C, et al. (2019) Gynecologic Oncology Non-pegylated liposomal
doxorubicin ( NPLD , Myocet ® ) + carboplatin in patients with platinum
sensitive ovarian cancers : A ARCAGY- GINECO phase IB-II trial. Gynecol
Oncol 152(1):68–75.
13. Rafiyath SM, et al. (2012) Comparison of safety and toxicity of liposomal
doxorubicin vs . conventional anthracyclines : a meta-analysis. Exp Hematol
Oncol 1(10):1–9.
14. Yang X, Yang M, Pang B, Vara M, Xia Y (2015) Gold Nanomaterials at Work
in Biomedicine. Chem Rev 115(19):10410–10488.
15. Laurent S, et al. (2008) Magnetic Iron Oxide Nanoparticles: Synthesis,
Stabilization, Vectorization, Physicochemical Characterizations, and Biological
Applications (vol 108, pg 2064, 2008). Chem Rev 108(6):2064–2110.
16. Dissanayake S, Denny WA, Gamage S, Sarojini V (2017) Recent developments
in anticancer drug delivery using cell penetrating and tumor targeting peptides.
J Control Release 250:62–76.
17. Joubert N, Denevault-Sabourin C, Bryden F, Viaud-Massuard MC (2017)
161
Towards antibody-drug conjugates and prodrug strategies with extracellular
stimuli-responsive drug delivery in the tumor microenvironment for cancer
therapy. Eur J Med Chem 142:393–415.
18. Gu M, Wang X, Toh TB, Chow EK-H (2017) Applications of stimuli-
responsive nanoscale drug delivery systems in translational research. Drug
Discov Today 00(00). doi:10.1016/j.drudis.2017.11.009.
19. Bachelder EM, Pino EN, Ainslie KM (2017) Acetalated Dextran: A Tunable
and Acid-Labile Biopolymer with Facile Synthesis and a Range of
Applications. Chem Rev 117(3):1915–1926.
20. Baumgartner R, et al. (2014) Nano-extrusion : A promising tool for continuous
manufacturing of solid nano-formulations. Int J Pharm 477(1–2):1–11.
21. Sayes CM, Aquino G V, Hickey AJ (2017) Nanomaterial Drug Products :
Manufacturing and Analytical Perspectives. AAPS J 19(1):18–25.
22. Worsham RD, Thomas V, Farid SS (2019) Potential of Continuous
Manufacturing for Liposomal Drug Products. Biotechnol J 1700740(14):1–8.
23. Musumeci T, Leonardi A, Bonaccorso A, Pignatello R, Puglisi G (2018)
Tangential Flow Filtration Technique: An Overview on Nanomedicine
Applications. Pharm Nanotechnol. doi:10.2174/2211738506666180306160921.
24. Dalwadi G, Benson HAE, Chen Y (2005) Comparison of diafiltration and
tangential flow filtration for purification of nanoparticle suspensions. Pharm
Res 22(12):2152–2162.
25. Limayem I, Charcosset C, Fessi H (2004) Purification of nanoparticle
suspensions by a concentration/diafiltration process. Sep Purif Technol 38(1):1–
162
9.
26. Heydenreich A V., Westmeier R, Pedersen N, Poulsen HS, Kristensen HG
(2003) Preparation and purification of cationic solid lipid nanospheres - Effects
on particle size, physical stability and cell toxicity. Int J Pharm 254(1):83–87.
27. Morrison MA, Benoit G (2004) Investigation of conventional membrane and
tangential flow ultrafiltration artifacts and their application to the
characterization of freshwater colloids. Environ Sci Technol 38(24):6817–6823.
28. Sweeney SF, Woehrle GH, Hutchison JE (2006) Rapid purification and size
separation of gold nanoparticles via diafiltration. J Am Chem Soc
128(10):3190–3197.
29. Hirsjärvi S, Peltonen L, Hirvonen J (2009) Effect of Sugars, Surfactant, and
Tangential Flow Filtration on the Freeze-Drying of Poly(lactic acid)
Nanoparticles. AAPS PharmSciTech 10(2):488–494.
30. Hirsjärvi S, Qiao Y, Royere A, Bibette J, Benoit JP (2010) Layer-by-layer
surface modification of lipid nanocapsules. Eur J Pharm Biopharm 76(2):200–
207.
31. Mihaila R, et al. (2011) Lipid nanoparticle purification by Spin Centrifugation-
Dialysis (SCD): A facile and high-throughput approach for small scale
preparation of siRNA-lipid complexes. Int J Pharm 420(1):118–121.
32. Satzer P, Wellhoefer M, Jungbauer A (2014) Continuous separation of protein
loaded nanoparticles by simulated moving bed chromatography. J Chromatogr
A 1349:44–49.
33. Heinemann ML, et al. (2014) Benchtop isolation and characterization of
163
functional exosomes by sequential filtration. J Chromatogr A 1371:125–135.
34. Bjornmalm M, et al. (2015) Flow-Based Assembly of Layer-by-Layer Capsules
through Tangential Flow Filtration. Langmuir 31(33):9054–9060.
35. Chen N, et al. (2016) Degradation of acetalated dextran can be broadly tuned
based on cyclic acetal coverage and molecular weight. Int J Pharm 512(1):147–
157.
36. Broaders KE, Cohen J a, Beaudette TT, Bachelder EM, Fréchet JMJ (2009)
Acetalated dextran is a chemically and biologically tunable material for
particulate immunotherapy. Proc Natl Acad Sci U S A 106(14):5497–502.
37. Wahyu D, Kumar A, Dhawan G, Mishra D (2018) Therapeutic inhibition of
spleen tyrosine kinase in in fl ammatory macrophages using PLGA
nanoparticles for the treatment of non-alcoholic steatohepatitis. J Control
Release 288(September):227–238.
38. Chachuli SHM, Nawaz A, Shah K, Naharudin I, Wong TW (2016) In Vitro
Investigation of Influences of Chitosan Nanoparticles on Fluorescein
Permeation into Alveolar Macrophages. Pharm Res 33(6):1497–1508.
39. Gupta N, Ibrahim HM, Ahsan F (2014) Peptide–Micelle Hybrids Containing
Fasudil for Targeted Delivery to the Pulmonary Arteries and Arterioles to Treat
Pulmonary Arterial Hypertension. J Pharm Sci 103(11):3743–3753.
40. Bachelder EM, Beaudette TT, Broaders KE, Dashe J, Fréchet JMJ (2008)
Acetal-derivatized dextran: An acid-responsive biodegradable material for
therapeutic applications. J Am Chem Soc 130(32):10494–10495.
41. Collier MA, et al. (2016) Host-mediated Leishmania donovani treatment using
164
AR-12 encapsulated in acetalated dextran microparticles. Int J Pharm 499(1–
2):186–194.
42. Peine KJ, et al. (2014) Treatment of experimental autoimmune
encephalomyelitis by codelivery of disease associated peptide and
dexamethasone in acetalated dextran microparticles. Mol Pharm 11(3):828–
835.
43. Kauffman KJ, et al. (2012) Optimization of rapamycin-loaded acetalated
dextran microparticles for immunosuppression. Int J Pharm 422(1–2):356–363.
44. Wang Z, Meenach SA (2017) Optimization of Acetalated Dextran–Based
Nanocomposite Microparticles for Deep Lung Delivery of Therapeutics via
Spray-Drying. J Pharm Sci:1–9.
45. Wang Z, Gupta SK, Meenach SA (2017) Development and physicochemical
characterization of acetalated dextran aerosol particle systems for deep lung
delivery. Int J Pharm 525(1):264–274.
46. Gause KT, et al. (2016) Immunological Principles Guiding the Rational Design
of Particles for Vaccine Delivery. (i). doi:10.1021/acsnano.6b07343.
47. Chen N, et al. (2018) Tunable degradation of acetalated dextran microparticles
enables controlled vaccine adjuvant and antigen delivery to modulate adaptive
immune responses. J Control Release 273(January):147–159.
48. Kanthamneni N, et al. (2012) Enhanced stability of horseradish peroxidase
encapsulated in acetalated dextran microparticles stored outside cold chain
conditions. Int J Pharm 431(1–2):101–110.
49. Meenach S a, et al. (2012) Synthesis, Optimization, and Characterization of
165
Camptothecin- Loaded Acetalated Dextran Porous Microparticles for
Pulmonary Delivery. Mol Pharm. doi:10.1021/mp2003785.
50. Graham-Gurysh E, et al. (2018) Sustained Delivery of Doxorubicin via
Acetalated Dextran Scaffold Prevents Glioblastoma Recurrence after Surgical
Resection. Mol Pharm 15(3):1309–1318.
51. Hoang K V., et al. (2014) Acetalated dextran encapsulated AR-12 as a host-
directed therapy to control Salmonella infection. Int J Pharm 477(1–2):334–
343.
52. Shah NK, Gupta SK, Wang Z, Meenach SA (2019) Enhancement of
macrophage uptake via phosphatidylserine-coated acetalated dextran
nanoparticles. J Drug Deliv Sci Technol 50(December 2018):57–65.
53. Wang Z, Cuddigan JL, Gupta SK, Meenach SA (2016) Nanocomposite
microparticles (nCmP) for the delivery of tacrolimus in the treatment of
pulmonary arterial hypertension. Int J Pharm 512(1):305–313.
54. Wang Z, Meenach SA (2016) Synthesis and Characterization of Nanocomposite
Microparticles (nCmP) for the Treatment of Cystic Fibrosis-Related Infections.
Pharm Res:1–11.
55. Shah NK, Torrico EA, Wang Z, Meenach SA (2019) Nanoparticles for
Biomedical Applications: Fundamental Concepts, Body Interactions, and
Clinical Potential. Chapter 6: Routes of Administration eds Chung EJ, Leon L,
Rinaldi C (Elsevier Science & Technology; Amsterdam, The Netherlands).
56. Othmer K (2002) Encyclopedia of Chemical Technology (John Wiley & Sons
Inc.).
166
57. Albanese A, Tang PS, Chan WCW (2012) The Effect of Nanoparticle Size ,
Shape , and Surface Chemistry on Biological Systems. Annu Rev Biomed Eng.
doi:10.1146/annurev-bioeng-071811-150124.
58. Citrome L (2010) Paliperidone palmitate – review of the efficacy , safety and
cost of a new second-generation depot antipsychotic medication. Int J Clin
Pract 64(2):216–239.
59. Wang Y, Qu W, Choi S (2016) FDA’s Regulatory Science Program for Generic
PLA/ PLGA-Based Drug Products. 1.
60. Haynes A, et al. (2016) Inhalation of tobramycin using simulated cystic fibrosis
patient profiles. Pediatr Pulmonol 51(11):1159–1167.
61. PH H, et al. (2002) In vivo lung deposition of hollow porous particles from a
pressurized metered dose inhaler. Pharm Res 19(3):258–264.
62. Newswire CP (2018) U.S. FDA Clears Sebacia Microparticles for the
Treatment of Mild to Moderate Inflammatory Acne. Sebacia, Inc.
63. Paithankar DY, et al. (2015) Acne Treatment Based on Selective
Photothermolysis of Sebaceous Follicles with Topically Delivered. J Investig
Dermatology 135:1727–1734.
64. Jia Z, Wang W (2018) Yttrium-90 radioembolization for unresectable
metastatic neuroendocrine liver tumor : A systematic review. Eur J Radiol
100(September 2017):23–29.
65. Hulla JE, Sahu SC, Hayes AW (2015) Nanotechnology : History and future.
Hum Exp Toxicol 34(12):1318–1321.
66. Havel HA (2016) Where Are the Nanodrugs ? An Industry Perspective on
167
Development of Drug Products Containing Nanomaterials. AAPS J 18(6):1351–
1353.
67. Shi Y, Li L (2005) Current advances in sustained-release systems for parenteral
drug delivery. Expert Opin Drug Deliv 2(6):1039–1058.
68. Gulati N, Gupta H (2011) Parenteral Drug Delivery : A Review. 133–145.
69. Teekamp N, Duque LF, Frijlink HW, Hinrichs WL, Olinga P (2015) Production
methods and stabilization strategies for polymer-based nanoparticles and
microparticles for parenteral delivery of peptides and proteins. Expert Opin
Drug Deliv 12(8):1311–1331.
70. Luo C, Sun J, Du Y, He Z (2014) Emerging integrated nanohybrid drug
delivery systems to facilitate the intravenous-to-oral switch in cancer
chemotherapy. J Control Release 176:94–103.
71. Reddy LH, Bazile D (2014) Drug delivery design for intravenous route with
integrated physicochemistry, pharmacokinetics and pharmacodynamics:
Illustration with the case of taxane therapeutics. Adv Drug Deliv Rev 71:34–57.
72. Almeida AJ, Souto E (2007) Solid lipid nanoparticles as a drug delivery system
for peptides and proteins. Adv Drug Deliv Rev 59(6):478–490.
73. Gamazo C, et al. (2007) Biodegradable gentamicin delivery systems for
parenteral use for the treatment of intracellular bacterial infections. Expert Opin
Drug Deliv 4(6):677–688.
74. Ahmed TA, Aljaeid BM (2016) Preparation, characterization, and potential
application of chitosan, chitosan derivatives, and chitosan metal nanoparticles
in pharmaceutical drug delivery. Drug Des Devel Ther 10(January):483–507.
168
75. de Souza Carvalho C, Daum N, Lehr CM (2014) Carrier interactions with the
biological barriers of the lung: Advanced in vitro models and challenges for
pulmonary drug delivery. Adv Drug Deliv Rev 75:129–140.
76. Fornaguera C, et al. (2015) Interactions of PLGA nanoparticles with blood
components: Protein adsorption, coagulation, activation of the complement
system and hemolysis studies. Nanoscale. doi:10.1039/c5nr00733j.
77. Anselmo AC, Mitragotri S (2016) Nanoparticles in the clinic. Bioeng Transl
Med 1(1):10–29.
78. Rafiei P, Haddadi A (2017) Docetaxel-loaded PLGA and PLGA-PEG
nanoparticles for intravenous application: Pharmacokinetics and biodistribution
profile. Int J Nanomedicine. doi:10.2147/IJN.S121881.
79. Honary S, Zahir F (2013) Effect of zeta potential on the properties of nano-drug
delivery systems - A review (Part 1). Trop J Pharm Res 12(2):255–264.
80. Honary S, Zahir F (2013) Effect of Zeta Potential on the Properties of Nano -
Drug Delivery Systems - A Review (Part 2). Trop J Pharm al Res 12(2):265–
273.
81. Qie Y, et al. (2016) Surface modification of nanoparticles enables selective
evasion of phagocytic clearance by distinct macrophage phenotypes. Sci Rep
6(April):26269.
82. Bagalkot V, Deiuliis JA, Rajagopalan S, Maiseyeu A (2016) “Eat me” imaging
and therapy. Adv Drug Deliv Rev 99:2–11.
83. Suk JS, Xu Q, Kim N, Hanes J, Ensign LM (2016) PEGylation as a strategy for
improving nanoparticle-based drug and gene delivery. Adv Drug Deliv Rev
169
99:28–51.
84. Gratton SEA, et al. (2008) The effect of particle design on cellular
internalization pathways. Proc Natl Acad Sci U S A 105(33).
85. Ajorlou E, Khosroushahi AY (2017) Trends on polymer- and lipid-based
nanostructures for parenteral drug delivery to tumors. Cancer Chemother
Pharmacol 79(2):251–265.
86. Xi A, Bothun GD (2014) Centrifugation-based assay for examining
nanoparticle-lipid membrane binding and disruption. Analyst.
doi:10.1039/c3an01601c.
87. Ventola CL (2017) Progress in Nanomedicine: Approved and Investigational
Nanodrugs. P T 42(12):742–755.
88. Gupta N, Hatoum H, Dy GK (2014) First line treatment of advanced non-small-
cell lung cancer - specific focus on albumin bound paclitaxel. Int J
Nanomedicine 9:209–21.
89. Oliveira CL, et al. (2017) Characterization of polymeric nanoparticles for
intravenous delivery: Focus on stability. Colloids Surfaces B Biointerfaces.
doi:10.1016/j.colsurfb.2016.10.046.
90. Hunt H, et al. (2017) Targeting of p32 in peritoneal carcinomatosis with
intraperitoneal linTT1 peptide-guided pro-apoptotic nanoparticles. J Control
Release 260(June):142–153.
91. Colby AH, et al. (2017) Nanoparticle drug-delivery systems for peritoneal
cancers: a case study of the design, characterization and development of the
expansile nanoparticle. Wiley Interdiscip Rev Nanomedicine
170
Nanobiotechnology 9(3):1–20.
92. Dakwar GR, et al. (2014) Colloidal stability of nano-sized particles in the
peritoneal fluid: Towards optimizing drug delivery systems for intraperitoneal
therapy. Acta Biomater. doi:10.1016/j.actbio.2014.03.012.
93. Nowacki M, et al. (2017) Nanoparticle as a novel tool in hyperthermic
intraperitoneal and pressurized intraperitoneal aerosol chemotheprapy to treat
patients with peritoneal carcinomatosis. Oncotarget.
doi:10.18632/oncotarget.20596.
94. Xu S, et al. (2016) Thermosensitive hydrogel system assembled by PTX-loaded
copolymer nanoparticles for sustained intraperitoneal chemotherapy of
peritoneal carcinomatosis. Eur J Pharm Biopharm 104:251–259.
95. Williamson SK, et al. (2015) A phase i study of intraperitoneal nanoparticulate
paclitaxel (Nanotax®) in patients with peritoneal malignancies. Cancer
Chemother Pharmacol 75(5):1075–1087.
96. Sun B, et al. (2016) Intraperitoneal chemotherapy of ovarian cancer by hydrogel
depot of paclitaxel nanocrystals. J Control Release 235:91–98.
97. Deng Y, et al. (2016) Improved i.p. drug delivery with bioadhesive
nanoparticles. Proc Natl Acad Sci 113(41):11453–11458.
98. Dasa SSK, et al. (2018) Plectin-targeted liposomes enhance the therapeutic
efficacy of a PARP inhibitor in the treatment of ovarian cancer. Theranostics.
doi:10.7150/thno.23050.
99. Wu C-C, et al. (2015) Nanoparticle-induced intraperitoneal hyperthermia and
targeted photoablation in treating ovarian cancer. Oncotarget 6(29):26861–
171
26875.
100. Ye H, Karim AA, Loh XJ (2015) Current treatment options and drug delivery
systems as potential therapeutic agents for ovarian cancer: A review. Mater Sci
Eng C 45:609–619.
101. MIKOLAJCZYK A, et al. (2018) Particle Stability During Pressurized Intra-
peritoneal Aerosol Chemotherapy (PIPAC). Anticancer Res 38(8):4645–4649.
102. Solaß W, Giger-Pabst U, Zieren J, Reymond MA (2013) Pressurized
intraperitoneal aerosol chemotherapy (PIPAC): Occupational health and safety
aspects. Ann Surg Oncol 20(11):3504–3511.
103. Bagley AF, Hill S, Rogers GS, Bhatia SN (2013) Plasmonic photothermal
heating of intraperitoneal tumors through the use of an implanted near-infrared
source. ACS Nano 7(9):8089–8097.
104. Vaccine Recommendations and Guidelines of the ACIP
https://www.cdc.gov/vaccines/hcp/acip-recs/general-recs/administration.html.
105. Din F ud, et al. (2017) Irinotecan-loaded double-reversible thermogel with
improved antitumor efficacy without initial burst effect and toxicity for
intramuscular administration. Acta Biomater. doi:10.1016/j.actbio.2017.03.007.
106. Wright L, Rao S, Thomas N, Boulos RA, Prestidge CA (2018)
Ramizol®encapsulation into extended release PLGA micro- and nanoparticle
systems for subcutaneous and intramuscular administration: in vitro and in vivo
evaluation. Drug Dev Ind Pharm 44(9):1451–1457.
107. Gonzalez-Aramundiz JV, Peleteiro Olmedo M, Gonzalez-Fernandez A, Alonso
Fernandez MJ, Csaba NS (2015) Protamine-based nanoparticles as new antigen
172
delivery systems. Eur J Pharm Biopharm 97:51–59.
108. Dewangan HK, Pandey T, Maurya L, Singh S (2018) Rational design and
evaluation of HBsAg polymeric nanoparticles as antigen delivery carriers. Int J
Biol Macromol 111:804–812.
109. Darville N, et al. (2016) Modeling the Time Course of the Tissue Responses to
Intramuscular Long-acting Paliperidone Palmitate Nano-/Microcrystals and
Polystyrene Microspheres in the Rat. Toxicol Pathol 44(2):189–210.
110. Xie B, et al. (2018) Progesterone PLGA/mPEG-PLGA Hybrid Nanoparticle
Sustained-Release System by Intramuscular Injection. Pharm Res.
doi:10.1007/s11095-018-2357-x.
111. Darville N, et al. (2014) Intramuscular administration of paliperidone palmitate
extended-release injectable microsuspension induces a subclinical inflammatory
reaction modulating the pharmacokinetics in rats. J Pharm Sci 103(7):2072–
2087.
112. Caputo A, et al. (2009) Induction of humoral and enhanced cellular immune
responses by novel core-shell nanosphere- and microsphere-based vaccine
formulations following systemic and mucosal administration. Vaccine
27(27):3605–3615.
113. Lu F, et al. (2015) Dendrimer-like alpha-d-glucan nanoparticles activate
dendritic cells and are effective vaccine adjuvants. J Control Release.
doi:10.1016/j.jconrel.2015.03.002.
114. Ogston-Tuck S (2014) Subcutaneous injection technique: an evidence-based
approach. Nurs Stand 29(3):53–58.
173
115. McLennan DN, Porter CJH, Charman SA (2005) Subcutaneous drug delivery
and the role of the lymphatics. Drug Discov Today Technol 2(1):89–96.
116. Singh Y, et al. (2016) Subcutaneously Administered Ultrafine PLGA
Nanoparticles Containing Doxycycline Hydrochloride Target Lymphatic
Filarial Parasites. Mol Pharm 13(6):2084–2094.
117. Trevaskis NL, Kaminskas LM, Porter CJH (2015) From sewer to saviour-
targeting the lymphatic system to promote drug exposure and activity. Nat Rev
Drug Discov 14(11):781–803.
118. Zhu S, Li X, Lansakara-P DSP, Kumar A, Cui Z (2013) A nanoparticle depot
formulation of 4-(N)-stearoyl gemcitabine shows a strong anti-tumour activity.
J Pharm Pharmacol 65(2):236–242.
119. Viola M, et al. (2018) Subcutaneous delivery of monoclonal antibodies: How
do we get there? J Control Release 286(July):301–314.
120. Mandal S, et al. (2017) Tenofovir alafenamide and elvitegravir loaded
nanoparticles for long-acting prevention of HIV-1 vaginal transmission. Aids
31(4):469–476.
121. Gautier JC, et al. (1992) Biodegradable nanoparticles for subcutaneous
administration of growth hormone releasing factor (hGRF). J Control Release
20(1):67–77.
122. Jogala S, Chinnala KM, Aukunuru J (2016) Novel subcutaneous sustained
release nanoparticles encapsulating low molecular weight heparin (LMWH):
Preparation, characterization and evaluation. Int J Pharm Pharm Sci 8(6):264–
268.
174
123. Jean M, et al. (2009) Chitosan-plasmid nanoparticle formulations for IM and
SC delivery of recombinant FGF-2 and PDGF-BB or generation of antibodies.
Gene Ther 16(9):1097–1110.
124. Schumann C, et al. (2018) Increasing lean muscle mass in mice via
nanoparticle-mediated hepatic delivery of follistatin mRNA. Theranostics
8(19):5276–5288.
125. Nimitha Vv PSSCNVV (2017) Leflunomide loaded solid lipid nanoparticle in
rheumatoid. 9(2):29681–29706.
126. Pandey R, Khuller GK (2004) Subcutaneous nanoparticle-based antitubercular
chemotherapy in an experimental model. J Antimicrob Chemother 54(1):266–
268.
127. Turner MR, Balu-Iyer S V (2018) Challenges and Opportunities for the
Subcutaneous Delivery of Therapeutic Proteins. J Pharm Sci 107(5):1247–
1260.
128. Daniher DI, Zhu J (2008) Dry powder platform for pulmonary drug delivery.
Particuology 6(4):225–238.
129. Ruge CA, Kirch J, Lehr C-M (2013) Pulmonary drug delivery: from generating
aerosols to overcoming biological barriers—therapeutic possibilities and
technological challenges. Lancet Respir Med 1(5):402–413.
130. Loira-pastoriza C, Todoroff J, Vanbever R (2014) Delivery strategies for
sustained drug release in the lungs. Adv Drug Deliv Rev 75:81–91.
131. Bailey MM, Berkland CJ (2009) Nanoparticle formulations in pulmonary drug
delivery. Med Res Rev 29(1):196–212.
175
132. Ngan CL, Asmawi AA (2018) Lipid-based pulmonary delivery system: a
review and future considerations of formulation strategies and limitations. Drug
Deliv Transl Res 8(5):1527–1544.
133. Yang W, Peters JI, Williams RO (2008) Inhaled nanoparticles—A current
review. Int J Pharm 356(1):239–247.
134. Parumasivam T, et al. (2016) In vitro evaluation of novel inhalable dry powders
consisting of thioridazine and rifapentine for rapid tuberculosis treatment. Eur J
Pharm Biopharm 107:205–214.
135. Meenach SA, et al. (2013) Design, physicochemical characterization, and
optimization of organic solution advanced spray-dried inhalable
dipalmitoylphosphatidylcholine (DPPC) and
dipalmitoylphosphatidylethanolamine poly(ethylene glycol) (DPPE-PEG)
microparticles and nanoparticles f. Int J Nanomedicine 8:275–293.
136. Pilcer G, Amighi K (2010) Formulation strategy and use of excipients in
pulmonary drug delivery. Int J Pharm 392(1–2):1–19.
137. Mansour HM, Rhee YS, Wu X (2009) Nanomedicine in pulmonary delivery.
Int J Nanomedicine 4:299–319.
138. Myrdal PB, Sheth P, Stein SW (2014) Advances in metered dose inhaler
technology: formulation development. AAPS PharmSciTech 15(2):434–455.
139. Ibrahim M, Verma R, Garcia-Contreras L (2015) Inhalation drug delivery
devices: technology update. Med Devices 8:131–139.
140. Callard preedy E, Prokopovich P (2013) 2 - History of inhaler devices. Inhaler
Devices, ed Prokopovich P (Woodhead Publishing), pp 13–28.
176
141. Ali M (2010) CHAPTER 9 - Pulmonary Drug Delivery. Handbook of Non-
Invasive Drug Delivery Systems, ed Kulkarni VS (William Andrew Publishing,
Boston), pp 209–246.
142. Javadzadeh Y, Yaqoubi S (2017) Chapter 20 - Therapeutic nanostructures for
pulmonary drug delivery. Nanostructures for Drug Delivery, eds Andronescu E,
Grumezescu AM (Elsevier), pp 619–638.
143. Vogt FG, Hayes D, Mansour HM (2014) Microparticulate / Nanoparticulate
Mannitol Powders. 27(2):81–93.
144. Chew N, Chan H (2001) Use of solid corrugated particles to enhance powder
aerosol performance. Pharm Res 11(18):1570–7.
145. Weers JG, Miller DP (2015) Formulation Design of Dry Powders for
Inhalation. J Pharm Sci 104(10):3259–3288.
146. Chew NYK, Tang P, Chan HK, Raper JA (2005) How much particle surface
corrugation is sufficient to improve aerosol performance of powders? Pharm
Res 22(1):148–152.
147. Muralidharan P, Malapit M, Mallory E, Hayes D, Mansour HM (2015)
Inhalable nanoparticulate powders for respiratory delivery. Nanomedicine
Nanotechnology, Biol Med 11(5):1189–1199.
148. Pham D-D, Fattal E, Tsapis N (2015) Pulmonary drug delivery systems for
tuberculosis treatment. Int J Pharm 478(2):517–529.
149. Asmawi AA, et al. (2018) Excipient selection and aerodynamic characterization
of nebulized lipid-based nanoemulsion loaded with docetaxel for lung cancer
treatment. Drug Deliv Transl Res. doi:10.1007/s13346-018-0526-4.

177
150. Levet V, et al. (2016) Development of controlled-release cisplatin dry powders
for inhalation against lung cancers. Int J Pharm 515(1–2):209–220.
151. Khutoryanskiy V V. (2017) Beyond PEGylation: Alternative surface-
modification of nanoparticles with mucus-inert biomaterials. Adv Drug Deliv
Rev 124:140–149.
152. Zhang J, Wu L, Chan H-K, Watanabe W (2011) Formation, characterization,
and fate of inhaled drug nanoparticles. Adv Drug Deliv Rev 63(6):441–455.
153. Miller DP, et al. (2015) Physical Characterization of Tobramycin Inhalation
Powder: I. Rational Design of a Stable Engineered-Particle Formulation for
Delivery to the Lungs. Mol Pharm 12(8):2582–2593.
154. Lock JY, Carlson TL, Carrier RL (2017) Mucus models to evaluate the
diffusion of drugs and particles. Adv Drug Deliv Rev 124:34–49.
155. Lai SK, Wang YY, Wirtz D, Hanes J (2009) Micro- and macrorheology of
mucus. Adv Drug Deliv Rev 61(2):86–100.
156. Bansil R, Turner BS (2017) The biology of mucus: Composition, synthesis and
organization. Adv Drug Deliv Rev 124:3–15.
157. Lee W-H, Loo C-Y, Traini D, Young PM (2015) Inhalation of nanoparticle-
based drug for lung cancer treatment: Advantages and challenges. Asian J
Pharm Sci 10(6):481–489.
158. Bannunah AM, Vllasaliu D, Lord J, Stolnik S (2014) Mechanisms of
nanoparticle internalization and transport across an intestinal epithelial cell
model: Effect of size and surface charge. Mol Pharm 11(12):4363–4373.
159. Zhao F, et al. (2011) Cellular uptake, intracellular trafficking, and cytotoxicity
178
of nanomaterials. Small 7(10):1322–1337.
160. Kuhn DA, et al. (2014) Different endocytotic uptake mechanisms for
nanoparticles in epithelial cells and macrophages. Beilstein J Nanotechnol
5:1625–1636.
161. Karner S, Anne N (2011) The impact of electrostatic charge in pharmaceutical
powders with specific focus on inhalation-powders. J Aerosol Sci 42(6):428–
445.
162. Patil JS, Sarasija S (2012) Pulmonary drug delivery strategies: A concise,
systematic review. Lung India 29(1):44–49.
163. Mert O, et al. (2012) A poly ( ethylene glycol ) -based surfactant for
formulation of drug-loaded mucus penetrating particles. J Control Release
157(3):455–460.
164. Fromen CA, et al. (2016) Nanoparticle surface charge impacts distribution,
uptake and lymph node trafficking by pulmonary antigen-presenting cells.
Nanomedicine 12(3):677–687.
165. Thorley AJ, Ruenraroengsak P, Potter TE, Tetley TD (2014) Critical
Determinants of Uptake and Translocation of Nanoparticles by the Human
Pulmonary Alveolar Epithelium. ACS Nano 8(11):11778–11789.
166. Craparo EF, Porsio B, Sardo C, Giammona G, Cavallaro G (2016) Pegylated
Polyaspartamide-Polylactide-Based Nanoparticles Penetrating Cystic Fibrosis
Artificial Mucus. Biomacromolecules 17(3):767–777.
167. Leal J, et al. (2018) Mucus-penetrating phage-displayed peptides for improved
transport across a mucus-like model. Int J Pharm 553(1–2):57–64.
179
168. Khanvilkar K, Donovan MD, Flanagan DR (2001) Drug transfer through
mucus. Adv Drug Deliv Rev 48(2–3):173–193.
169. Murgia X, Loretz B, Hartwig O, Hittinger M, Lehr CM (2017) The role of
mucus on drug transport and its potential to affect therapeutic outcomes. Adv
Drug Deliv Rev 124:82–97.
170. Bhat PG, Flanagan DR, Donovan MD (1996) Drug diffusion through cystic
fibrotic mucus: Steady-state permeation, rheologic properties, and glycoprotein
morphology. J Pharm Sci 85(6):624–630.
171. Xu Q, et al. (2015) Impact of Surface Polyethylene Glycol (PEG) Density on
Biodegradable Nanoparticle Transport in Mucus ex Vivo and Distribution in
Vivo. ACS Nano 9(9):9217–9227.
172. Sanders NN, et al. (2000) Cystic fibrosis sputum: A barrier to the transport of
nanospheres. Am J Respir Crit Care Med 162(5):1905–1911.
173. Ahsan F, Rivas IP, Khan MA, Torres Suárez AI (2002) Targeting to
macrophages: Role of physicochemical properties of particulate carriers -
Liposomes and microspheres - On the phagocytosis by macrophages. J Control
Release 79(1–3):29–40.
174. Ravichandran KS (2011) Beginnings of a Good Apoptotic Meal: The Find-Me
and Eat-Me Signaling Pathways. Immunity 35(4):445–455.
175. Bagalkot V, et al. (2015) Hybrid nanoparticles improve targeting to
inflammatory macrophages through phagocytic signals. J Control Release
217:243–255.
176. Chachuli SHM, Nawaz A, Shah K, Naharudin I, Wong TW (2016) In Vitro
180
Investigation of Influences of Chitosan Nanoparticles on Fluorescein
Permeation into Alveolar Macrophages. Pharm Res:1–12.
177. El-sherbiny IM, Smyth HDC (2012) Controlled Release Pulmonary
Administration of Curcumin Using Swellable Biocompatible Microparticles.
Mol Pharm.
178. Fadok VA, et al. (1992) Exposure of phosphatidylserine on the surface of
apoptotic lymphocytes triggers specific recognition and removal by
macrophages. J Immunol 148(7):2207–16.
179. Gaspar DP, et al. (2016) Rifabutin-loaded solid lipid nanoparticles for inhaled
antitubercular therapy: Physicochemical and in vitro studies. Int J Pharm
497(1–2):199–209.
180. Gramatica A, et al. (2014) ??Env-decorated phosphatidylserine liposomes
trigger phagocytosis of HIV-virus-like particles in macrophages. Nanomedicine
Nanotechnology, Biol Med 10(5):981–989.
181. Matsumoto A, et al. (2016) Role of Phosphatidylserine-Derived Negative
Surface Charges in the Recognition and Uptake of Intravenously Injected
B16BL6-Derived Exosomes by Macrophages. J Pharm Sci 106(1):168–175.
182. Petazzi RA, Gramatica A, Herrmann A, Chiantia S (2015) Time-controlled
phagocytosis of asymmetric liposomes: Application to phosphatidylserine
immunoliposomes binding HIV-1 virus-like particles. Nanomedicine
Nanotechnology, Biol Med 11(8):1985–1992.
183. Wang J, et al. (2016) Enhancement of Anti-Inflammatory Activity of Curcumin
Using Phosphatidylserine-Containing Nanoparticles in Cultured Macrophages.
181
Int J Mol Sci 17(6):969.
184. Zhang L, Zhou H, Belzile O, Thorpe P, Zhao D (2014) Phosphatidylserine-
targeted bimodal liposomal nanoparticles for in vivo imaging of breast cancer in
mice. J Control Release 183(1):114–123.
185. Zheng Y, Chen Y, Jin L, Ye H, Liu G (2015) Cytotoxicity and Genotoxicity in
Human Embryonic Kidney Cells Exposed to Surface Modify Chitosan
Nanoparticles Loaded with Curcumin. AAPS PharmSciTech.
doi:10.1208/s12249-015-0471-1.
186. Van Ingen J, et al. (2011) Why do we use 600 mg of rifampicin in tuberculosis
treatment? Clin Infect Dis 52(9). doi:10.1093/cid/cir184.
187. Peterson KR, Cottam MA, Kennedy AJ, Hasty AH (2018) Macrophage-
Targeted Therapeutics for Metabolic Disease. Cell Press 39(6):536–546.
188. Costa A, Sarmento B, Seabra V (2018) Mannose-functionalized solid lipid
nanoparticles are e ff ective in targeting alveolar macrophages. Eur J Pharm Sci
114(December 2017):103–113.
189. Maretti E, et al. (2017) Surface engineering of Solid Lipid Nanoparticle
assemblies by methyl a - D -mannopyranoside for the active targeting to
macrophages in anti-tuberculosis inhalation therapy. Int J Pharm 528(1–
2):440–451.
190. Zou L, et al. (2016) Targeted delivery of nano-PTX to the brain tumor-
associated macrophages. Oncotarget:1–15.
191. Binnemars-postma K, Storm G, Prakash J (2017) Nanomedicine Strategies to
Target Tumor-Associated Macrophages. Int J Mol Sci 18(979):1–27.

182
192. Mubin N, Umar MS, Zubair S, Owais M (2018) Selective Targeting of
Functionalized Mycobacterium tuberculosis Protein Loaded Chitosan
Nanoparticle to Macrophages : Correlation With Activation of Immune System.
Front Microbiol 9(November):1–15.
193. Lewis RN, McElhaney RN (2000) Calorimetric and spectroscopic studies of the
thermotropic phase behavior of lipid bilayer model membranes composed of a
homologous series of linear saturated phosphatidylserines. Biophys J
79(4):2043–2055.
194. Segawa K, Nagata S (2015) An Apoptotic “Eat Me” Signal: Phosphatidylserine
Exposure. Trends Cell Biol 25(11):639–650.
195. Badalà F, Nouri-mahdavi K, Raoof DA (2008) Apoptotic cell clearance: basic
biology and therapeutic potential. Nat Rev Immunol 144(5):724–732.
196. Manrique-moreno M, Heinbockel L, Suwalsky M, Garidel P, Brandenburg K
(2016) Biochimica et Biophysica Acta Biophysical study of the non-steroidal
anti-in fl ammatory drugs ( NSAID ) ibuprofen , naproxen and diclofenac with
phosphatidylserine bilayer membranes. BBA - Biomembr 1858(9):2123–2131.
197. Joshi N, Shanmugam T, Kaviratna A, Banerjee R (2011) Proapoptotic lipid
nanovesicles: Synergism with paclitaxel in human lung adenocarcinoma A549
cells. J Control Release 156(3):413–420.
198. Hosseini H, et al. (2015) Phosphatidylserine liposomes mimic apoptotic cells to
attenuate atherosclerosis by expanding polyreactive IgM producing B1a
lymphocytes. Cardiovasc Res 106(3):443–452.
199. Kunwar A, et al. (2008) Quantitative cellular uptake, localization and
183
cytotoxicity of curcumin in normal and tumor cells. Biochim Biophys Acta -
Gen Subj 1780(4):673–679.
200. Cong Y, Wang L, Konrad A, Schoeb T, Elson CO (2009) Curcumin induces the
tolerogenic dendritic cell that promotes differentiation of intestine-protective
regulatory T cells. Eur J Immunol 39(11):3134–3146.
201. Chanburee S, Tiyaboonchai W (2017) Enhanced intestinal absorption of
curcumin in Caco-2 cell monolayer using mucoadhesive nanostructured lipid
carriers. J Biomed Mater Res B Appl Biomater:1–8.
202. Tima S, Anuchapreeda S, Ampasavate C, Berkland C, Okonogi S (2017) Stable
curcumin-loaded polymeric micellar formulation for enhancing cellular uptake
and cytotoxicity to FLT3 overexpressing EoL-1 leukemic cells. Eur J Pharm
Biopharm 114:57–68.
203. Beloqui A, et al. (2014) PH-sensitive nanoparticles for colonic delivery of
curcumin in inflammatory bowel disease. Int J Pharm 473(1–2):203–212.
204. Malekar SA, et al. (2015) Radio Frequency-Activated Nanoliposomes for
Controlled Combination Drug Delivery. AAPS PharmSciTech 16(6):1335–43.
205. Malekar SA, Sarode AL, Bach AC, Worthen DR (2016) The Localization of
Phenolic Compounds in Liposomal Bilayers and Their Effects on Surface
Characteristics and Colloidal Stability. AAPS PharmSciTech 17(6):in press.
206. Procházková L, Rodríguez-Muñoz Y, Procházka J, Wanner J (2014) Simple
spectrophotometric method for determination of polyvinylalcohol in different
types of wastewater. Int J Environ Anal Chem 94(4):399–410.
207. Charles J, Stewart M (1980) Colorimetric Determination of Phospholipids with
184
Ammonium Ferrothiocyanate. Anal Biochem 14(104):10–14.
208. Coleman JW (2001) Nitric Oxide in Immunity and Inflammation. Int
Immunopharmacol 1:1397–1406.
209. Jensen DMK, et al. (2010) Spray drying of siRNA-containing PLGA
nanoparticles intended for inhalation. J Control Release 142(1):138–145.
210. Barroso RP, Basso LGM, Costa-filho AJ (2015) Interactions of the antimalarial
amodiaquine with lipid model membranes. Chem Phys Lipids 186:68–78.
211. Fang RH, Aryal S, Hu CMJ, Zhang L (2010) Quick synthesis of lipid-polymer
hybrid nanoparticles with low polydispersity using a single-step sonication
method. Langmuir 26(22):16958–16962.
212. Maretti E, et al. (2014) Inhaled Solid Lipid Microparticles to target alveolar
macrophages for tuberculosis. Int J Pharm 462(1–2):74–82.
213. Jensen DK, et al. (2012) Design of an inhalable dry powder formulation of
DOTAP-modified PLGA nanoparticles loaded with siRNA. J Control Release
157(1):141–148.
214. Meenach SA, et al. (2012) Synthesis, optimization, and characterization of
camptothecin-loaded acetalated dextran porous microparticles for pulmonary
delivery. Mol Pharm 9(2):290–298.
215. Kim I, et al. (2012) Biomaterials Doxorubicin-loaded highly porous large
PLGA microparticles as a sustained- release inhalation system for the treatment
of metastatic lung cancer. Biomaterials 33(22):5574–5583.
216. Azarmi S, et al. (2006) Formulation and cytotoxicity of doxorubicin
nanoparticles carried by dry powder aerosol particles. Int J Pharm 319(1–
185
2):155–161.
217. Sosnik A, Seremeta KP (2015) Advantages and challenges of the spray-drying
technology for the production of pure drug particles and drug-loaded polymeric
carriers. Adv Colloid Interface Sci 223:40–54.
218. Salama RO, et al. (2009) Preparation and evaluation of controlled release
microparticles for respiratory protein therapy. J Pharm Sci 98(8):2709–2717.
219. Liang W, et al. (2015) Inhalable Dry Powder Formulations of siRNA and pH-
Responsive Peptides with Antiviral Activity Against H1N1 Influenza Virus.
Mol Pharm 12(3):910–921.
220. Ong W, et al. (2016) Sustained Pulmonary Delivery of a Water-Soluble
Antibiotic Without Encapsulating Carriers. Pharm Res 33(3):563–572.
221. Kumar A, Deepak, Sharma S, Srivastava A, Kumar R (2017) Synthesis of
xanthan gum graft copolymer and its application for controlled release of highly
water soluble Levofloxacin drug in aqueous medium. Carbohydr Polym
171:211–219.
222. Broaders KE, Cohen J a, Beaudette TT, Bachelder EM, Fréchet JMJ (2009)
Acetalated dextran is a chemically and biologically tunable material for
particulate immunotherapy. Proc Natl Acad Sci U S A 106(14):5497–502.
223. Wang Z, Meenach SA (2017) Optimization of Acetalated Dextran-Based
Nanocomposite Microparticles for Deep Lung Delivery of Therapeutics via
Spray-Drying. J Pharm Sci 106(12):3539–3547.
224. Finlay WH The ARLA Respiratory Deposition Calculator.
225. Sarode AL, Sandhu H, Shah N, Malick W, Zia H (2013) Hot Melt Extrusion for
186
Amorphous Solid Dispersions : Temperature and Moisture Activated Drug −
Polymer Interactions for Enhanced Stability.
226. Vichai V, Kirtikara K (2006) Sulforhodamine B colorimetric assay for
cytotoxicity screening. Nat Protoc 1(3):1112–1116.
227. Rodrigues de Azevedo C, et al. (2017) Modeling of the burst release from
PLGA micro- and nanoparticles as function of physicochemical parameters and
formulation characteristics. Int J Pharm 532(1):229–240.
228. Siepmann J, Siepmann F (2008) Mathematical modeling of drug delivery. Int J
Pharm 364(2):328–343.
229. Singhvi G, Singh M (2011) Review : in-Vitro Drug Release Characterization
Models. Int J Pharm Stud Res II(I):77–84.
230. Ungaro F, et al. (2012) Dry powders based on PLGA nanoparticles for
pulmonary delivery of antibiotics: Modulation of encapsulation efficiency,
release rate and lung deposition pattern by hydrophilic polymers. J Control
Release 157(1):149–159.
231. Chvatal A, Farkas Á, Balásházy I, Szabó-Révész P, Ambrus R (2017)
Aerodynamic properties and in silico deposition of meloxicam potassium
incorporated in a carrier-free DPI pulmonary system. Int J Pharm 520(1–2):70–
78.
232. Salama RO, Traini D, Chan HK, Young PM (2008) Preparation and
characterisation of controlled release co-spray dried drug-polymer
microparticles for inhalation 2: Evaluation of in vitro release profiling
methodologies for controlled release respiratory aerosols. Eur J Pharm
187
Biopharm 70(1):145–152.
233. Thakral S, Terban MW, Thakral NK, Suryanarayanan R (2016) Recent
advances in the characterization of amorphous pharmaceuticals by X-ray
diffractometry. Adv Drug Deliv Rev 100:183–193.
234. Gallagher KM, Corrigan OI (2000) Mechanistic aspects of the release of
levamisole hydrochloride from biodegradable polymers. J Control Release
69(2):261–272.
235. Corrigan OI, Li X (2009) Quantifying drug release from PLGA
nanoparticulates. Eur J Pharm Sci 37(3–4):477–485.
236. Peppas NA, Sahlin JJ (1989) A simple equation for the description of solute
release. III. Coupling of diffusion and relaxation. International Journal of
Pharmaceutics, 1989. 57(2): p. 169-172. Int J Pharm 57(2):169–172.
237. Unagolla JM, Jayasuriya AC (2018) Drug transport mechanisms and in vitro
release kinetics of vancomycin encapsulated chitosan-alginate polyelectrolyte
microparticles as a controlled drug delivery system. Eur J Pharm Sci
114(December 2017):199–209.
238. Shatrohan Lal RK (2014) Synthesis of Organic Nanoparticles and their
Applications in Drug Delivery and Food Nanotechnology: A Review. J
Nanomater Mol Nanotechnol 03(04). doi:10.4172/2324-8777.1000150.
239. Zhang L, et al. (2008) Self-assembled lipid-polymer hybrid nanoparticles: A
robust drug delivery platform. ACS Nano 2(8):1696–1702.
240. Pal SL, Jana U, Manna PK, Mohanta GP, Manavalan R (2011) Nanoparticle:
An overview of preparation and characterization. J Appl Pharm Sci 01(06):228–
188
234.
241. Dalwadi G, Sunderland VB (2007) Purification of PEGylated nanoparticles
using tangential flow filtration (TFF). Drug Dev Ind Pharm 33(9):1030–1039.
242. Dalwadi G, Sunderland B (2008) Comparison and validation of drug loading
parameters of PEGylated nanoparticles purified by a diafiltration centrifugal
device and tangential flow filtration. Drug Dev Ind Pharm 34(12):1331–1342.
243. Dizon-Maspat J, Bourret J, D’Agostini A, Li F (2012) Single pass tangential
flow filtration to debottleneck downstream processing for therapeutic antibody
production. Biotechnol Bioeng 109(4):962–970.
244. Gagnon P (2012) Technology trends in antibody purification. J Chromatogr A
1221:57–70.
245. Allémann E, Leroux J, Gurny R, E D (1993) In vitro extended-release
properties of drug-loaded poly(DL-lactic acid) nanoparticles produced by a
salting-out procedure. Pharm Res 12(10):1732–7.
246. Dimov N, Kastner E, Hussain M, Perrie Y, Szita N (2017) Formation and
purification of tailored liposomes for drug delivery using a module-based micro
continuous-flow system. Sci Rep 7(1):1–13.
247. Dorney KM, et al. (2014) Tangential flow filtration of colloidal silver
nanoparticles: A “green” laboratory experiment for chemistry and engineering
students. J Chem Educ 91(7):1044–1049.
248. Worsham RD, Thomas V, Farid SS (2019) Potential of Continous
Manufacturing for Liposomal Drug Products. Biotechnol J 16:1–8.
249. Bernabeu E, Cagel M, Lagomarsino E, Moretton M, Chiappetta DA (2017)
189
Paclitaxel: What has been done and the challenges remain ahead. Int J Pharm
526(1–2):474–495.
250. Troiano G, Nolan J, Parsons D, Van Geen Hoven C, Zale S (2016) A Quality by
Design Approach to Developing and Manufacturing Polymeric Nanoparticle
Drug Products. AAPS J 18(6):1354–1365.
251. Yerlikaya F, et al. (2013) Development and evaluation of paclitaxel
nanoparticles using a quality-by-design approach. J Pharm Sci 102(10):3748–
3761.
252. Zong Y, Wu J, Shen K (2017) Nanoparticle albumin-bound paclitaxel as
neoadjuvant chemotherapy of breast cancer: a systematic review and meta-
analysis. Oncotarget 8(10):17360–17372.
253. Tomé-Carneiro J, et al. (2013) Resveratrol and Clinical Trials: The Crossroad
from In Vitro Studies to Human Evidence. Curr Pharm Des 19(34):6064–6093.
254. Dheer D, Jyoti, Gupta PN, Shankar R (2018) Tacrolimus: An updated review on
delivering strategies for multifarious diseases. Eur J Pharm Sci 114(October
2017):217–227.
255. Spiekerkoetter E, et al. (2015) Low-Dose FK506 (Tacrolimus) in End-Stage
Pulmonary Arterial Hypertension. Am J Respir Crit Care Med 192(2):254–257.
256. Chen Y-L, Hirabayashi H, Akhtar S, Pelzer M, Kobayashi M (2006)
Simultaneous determination of three isomeric metabolites of tacrolimus
(FK506) in human whole blood and plasma using high performance liquid
chromatography–tandem mass spectrometry. J Chromatogr B 830(2):330–341.
257. Hu J, et al. (2015) Novel Targets of Drug Treatment for Pulmonary
190
Hypertension. Am J Cardiovasc Drugs 15(4):225–234.
258. A AMA, et al. (2016) Activation of Anoctamin-1 Limits Pulmonary Endothelial
Cell proliferation via p38- MAPK-dependent Apoptosis. AJRCMB:1–53.
259. Montani D, et al. (2014) Targeted therapies in pulmonary arterial hypertension.
Pharmacol Ther 141(2):172–91.
260. Lambert M, et al. (2018) Ion Channels in Pulmonary Hypertension : A
Therapeutic Interest ? Int J Mol Sci 19(3162):1–49.
261. Evans JDW, et al. (2016) BMPR2 mutations and survival in pulmonary arterial
hypertension : an individual participant data meta-analysis. Lancet Respir Med
4:129–137.
262. West J, Austin E, Fessel JP, Loyd J, Hamid R (2014) Rescuing the BMPR2
signaling axis in pulmonary arterial hypertension. Drug Discov Today
19(8):1241–1245.
263. Spiekerkoetter E, et al. (2013) FK506 activates BMPR2, rescues endothelial
dysfunction, and reverses pulmonary hypertension. J Clin Invest 123(8):3600–
3613.
264. Qi J, Wang Y, Liu Y, Zhang F (2014) Development and validation of HTS
assay for screening the calcium-activated chloride channel modulators in
TMEM16A stably expressed CHO cells. Anal Bioanal Chem 406:1713–1721.
265. Ji Q, Wang X, An H (2018) Recent advances in TMEM16A : Structure ,
function , and disease. J Cell Physiol (November):1–18.
266. Leblanc N, et al. (2015) Molecular and functional significance of Ca 2 + -
activated Cl − channels in pulmonary arterial smooth muscle. Pulm Circ
191
5(2):244–268.
267. Forrest AS, et al. (2012) Increased TMEM16A-encoded calcium-activated
chloride channel activity is associated with pulmonary hypertension. Am J
Physiol Cell Physiol 303:1229–1243.
268. Forrest AS, et al. (2012) Increased TMEM16A-encoded calcium-activated
chloride channel activity is associated with pulmonary hypertension. Am J
Physiol Cell Physiol 303(12):C1229-43.
269. Jiang Y, Yu B, Yang H, Ma T (2016) Shikonin Inhibits Intestinal Calcium-
Activated Chloride Channels and Prevents Rotaviral Diarrhea. Front
Pharmacol 7(August):1–9.
270. Hübner CA, Schroeder BC, Jena FU, Schroeder BC (2015) Regulation of
vascular tone and arterial blood pressure : role of chloride transport in vascular
smooth muscle. Pflugers Arch-Eur J Physiol 467:605–614.
271. Oh U, Jung J (2016) Cellular functions of TMEM16 / anoctamin. Pflugers
Arch-Eur J Physiol 468:443–453.
272. Sun H, Xia Y, Paudel O, Yang X-R, Sham JSK (2012) Chronic hypoxia-
induced upregulation of Ca 2+ -activated Cl − channel in pulmonary arterial
myocytes: a mechanism contributing to enhanced vasoreactivity. J Physiol
590(15):3507–3521.
273. Namkung W, Yao Z, Finkbeiner WE, Verkman AS (2011) Small-molecule
activators of TMEM16A, a calcium-activated chloride channel, stimulate
epithelial chloride secretion and intestinal contraction. FASEB J 25(11):4048–
4062.
192
274. Liu S, et al. (2016) Eact, a small molecule activator of TMEM16A, activates
TRPV1 and elicits pain- and itch-related behaviours. Br J Pharmacol
173(7):1208–1218.
275. Burris SK, Wang Q, Bulley S, Neeb ZP (2015) 9-Phenanthrol inhibits
recombinant and arterial myocyte TMEM16A channels. Br J Pharmacol
172:2459–2468.
276. Pilcer G, Vanderbist F, Amighi K (2009) Preparation and characterization of
spray-dried tobramycin powders containing nanoparticles for pulmonary
delivery. Int J Pharm 365(1–2):162–169.
277. Meenach SA, Anderson KW, Zach Hilt J, McGarry RC, Mansour HM (2013)
Characterization and aerosol dispersion performance of advanced spray-dried
chemotherapeutic PEGylated phospholipid particles for dry powder inhalation
delivery in lung cancer. Eur J Pharm Sci 49(4):699–711.
278. Sarode AL, Sandhu H, Shah N, Malick W, Zia H (2013) European Journal of
Pharmaceutical Sciences Hot melt extrusion ( HME ) for amorphous solid
dispersions : Predictive tools for processing and impact of drug – polymer
interactions on supersaturation. Eur J Pharm Sci 48(3):371–384.
279. Li X, Vogt FG, Hayes D, Mansour HM (2014) Design, characterization, and
aerosol dispersion performance modeling of advanced co-spray dried antibiotics
with mannitol as respirable microparticles/nanoparticles for targeted pulmonary
delivery as dry powder inhalers. J Pharm Sci 103(9):2937–2949.
280. Walters RH, Bhatnagar B, Tchessalov S, Izutsu K (2014) Next Generation
Drying Technologies for Pharmaceutical Applications. J Pharm Sci
193
103(9):2673–2695.
281. Hancock BC, Shamblin SL, Zografi G (1995) Molecular Mobility of
Amorphous Pharmaceutical Solids Below Their Glass Transition Temperatures.
Pharm Res An Off J Am Assoc Pharm Sci 12(6):799–806.
282. Tian Y, Jones DS, Andrews GP (2015) An investigation into the role of
polymeric carriers on crystal growth within amorphous solid dispersion
systems. Mol Pharm 12(4):1180–1192.
283. Edueng K, Mahlin D, Larsson P, Bergström CAS (2017) Mechanism-based
selection of stabilization strategy for amorphous formulations: Insights into
crystallization pathways. J Control Release 256(January):193–202.
284. Andronis V, Yoshioka M, Zografi G (1997) Effects of sorbed water on the
crystallization of indomethacin from the amorphous state. J Pharm Sci
86(3):346–357.
285. Park CW, et al. (2013) Advanced spray-dried design, physicochemical
characterization, and aerosol dispersion performance of vancomycin and
clarithromycin multifunctional controlled release particles for targeted
respiratory delivery as dry powder inhalation aerosols. Int J Pharm 455(1–
2):374–392.
286. Costa, P., & Lobo JMS (2001) Modelling and Comparison of Dissolution
Profiles. Eur J Pharm Sci 13:123–133.


