
©FUNPEC-RP www.funpecrp.com.brGenetics and Molecular Research 7 (1): 184-195 (2008)
Agronomic and molecular characterization of introgression lines from the interspecific cross Oryza sativa (BG90-2) x Oryza glumaepatula (RS-16)
P.N. Rangel1, R.P.V. Brondani2, P.H.N. Rangel3 and C. Brondani2
1Laboratório de Biotecnologia, Embrapa Arroz e Feijão,Santo Antônio de Goiás, GO, Brasil2Genética Molecular, Embrapa Arroz e Feijão,Santo Antônio de Goiás, GO, Brasil3Melhoramento de Arroz, Embrapa Arroz e Feijão,Santo Antônio de Goiás, GO, Brasil
Corresponding author: P.N. Rangel E-mail: [email protected]
Genet. Mol. Res. 7 (1): 184-195 (2008)Received October 15, 2007Accepted December 22, 2007Published February 19, 2008
ABStRACt. The reduced genetic variability of modern rice varieties (Oryza sativa) is of concern because it reduces the possibilities of genetic gain in breeding programs. Introgression lines (ILs) containing genomic fragments from wild rice can be used to obtain new improved cultivars. The objective of the present study was to perform the agronomic and molecular characterizations of 35 BC2F8 ILs from the cross O. glumaepatula x O. sativa, aiming to select high-yielding ILs to be used in rice-breeding programs. All 35 ILs were field evaluated in the season 2002/2003 in three locations and the 15 best performing ones were evaluated in the season 2003/2004 in five locations. In 2003/2004, six ILs (CNAi 9934, CNAi 9931, CNAi 9930, CNAi 9935, CNAi 9936, and CNAi 9937) showed the highest yield means and were statistically superior to the controls Metica 1 and IRGA 417. Molecular characterization of the 35 ILs was performed with 92 microsatellite markers distributed on the 12 rice chromosomes and a simple regression
185
©FUNPEC-RP www.funpecrp.com.brGenetics and Molecular Research 7 (1): 184-195 (2008)
Oriza glumaepatula-derived introgression lines
quantitative trait locus analysis was performed using the phenotypic data from 2002/2003. The six high-yielding ILs showed a low proportion of wild fragment introgressions. A total of 14 molecular markers were associated with quantitative trait loci in the three locations. The six high-yielding ILs were incorporated in the Embrapa breeding program, and the line CNAi 9930 is recommended for cultivation due to additional advantages of good grain cooking and milling qualities and high yield stability. The O. glumaepatula-derived ILs proved to be a source of new alleles for the development of high-yielding rice cultivars.
Key words: Oryza glumaepatula; Introgression lines;Simple sequence repeat markers; yield
INtRoduCtIoN
Modern rice varieties (Oryza sativa) are the result of an extensive artificial selection pro-cess that led to an extreme pressure on a few target characteristics to rice cultivation, such as non-shattering of seeds, compact growth habit and loss of germination inhibition (Tanksley and Mc-Couch, 1997). This strongly directional selection reduced the genetic variability of cultivated rice due to a great loss of allelic variability in detriment to the fixation of some alleles, which resulted in a phenomenon called “genetic erosion” (Gowda et al., 2003). In addition, rice-breeding programs tend to favor methods that maximize endogamy in cultivar development, which drastically reduces new recombination opportunities (Rangel and Neves, 1997). Besides, breeders usually use the same adapted genitors repeatedly in initial breeding crosses (Moncada et al., 2001). These events led to a concerning restriction of selection gains obtained by breeding programs over the past years. One of the objectives of modern breeding has been the recovery of lost diversity through the search of potentially favorable alleles in wild ancestors of rice (Gur and Zamir, 2004).
The advanced backcross quantitative trait locus (AB-QTL) analysis (Tanksley and Nel-son, 1996) is a powerful strategy to exploit and use the potential of wild alleles in breeding pro-grams. This methodology integrates the QTL analysis and the introgression of alleles from wild germplasm into elite material under the assumption that marker regions positively associated with traits of agronomic interest can be identified and transferred into elite cultivars (Bernacchi et al., 1997; Frary et al., 2004). The AB-QTL analysis comprises a set of activities that include the development of a backcross population derived from an interspecific cross followed by its molecular and phenotypic characterization for QTL analysis. Marker loci associated with favor-able wild alleles can be used to select genotypes containing these specific genomic regions. After a few selfing generations, introgression lines (ILs) are obtained and can be field tested and used for variety development (Frary et al., 2004). Since they contain small wild fragments evenly distributed throughout the elite recurrent genome, ILs can be used for genetic and functional ge-nomics studies, such as the dissection of gene functions and map-based cloning of QTLs under-lying quantitative and qualitative traits (Li et al., 2004; Tian et al., 2006b). In addition, ILs are an important reservoir of alleles that can be used in breeding programs for the development of new cultivars with higher genetic diversity and that are more resistant to biotic and abiotic stresses.
Species related to the cultivated Oryza sativa have been used as an additional source of genetic variability in breeding programs, such as Oryza glumaepatula (Brondani et al., 2001), Oryza

186
©FUNPEC-RP www.funpecrp.com.brGenetics and Molecular Research 7 (1): 184-195 (2008)
P.N. Rangel et al.
rufipogon (Moncada et al., 2001; Nguyen et al., 2003; Septiningsih et al., 2003) and Oryza glaber-rima (Aluko et al., 2004). These studies used the AB-QTL methodology to monitor the effects of wild introgressions on important agronomic traits such as grain yield, aluminum tolerance and grain quality. O. glumaepatula is a diploid AA species that is autogamous and has an annual life cycle (Vaughan et al., 2003). Populations of O. glumaepatula were identified in three Brazilian biomes (Amazon, Pantanal and Cerrados) and their adaptation to tropical soil and weather increase their chance as donors of genes related to traits of economic importance to rice (Brondani et al., 2005).
The efficiency of using best performing ILs in breeding programs depends on a com-plete phenotypic and molecular characterization. Phenotypic characterization, which has been a routine in breeding programs, provides a great amount of information about IL field perfor-mance, helping breeders to choose those with desirable traits. Molecular characterization can be used as a complement to field evaluation, providing information about the position and estimated size of introgressed fragments on each IL. The objective of the present study was to perform agronomical and molecular characterizations of ILs derived from an O. glumaepatula (RS-16) x O. sativa (BG90-2) interspecific cross (Brondani et al., 2002). These lines were de-veloped at Embrapa Rice and Beans (Goiânia, GO, Brazil) over the past ten years, following the AB-QTL strategy (Brondani et al., 2001, 2002; Rangel et al., 2005).
MAteRIAl ANd MetHodS
development of the introgression lines
ILs were developed from an interspecific cross between the inbred line BG90-2 (Oryza sativa), the recurrent parent, and the wild accession RS-16 (Oryza glumaepatula), the donor parent, collected in the Brazilian Amazon biome. Thirty-five BC2F8 lines were obtained using the AB-QTL methodology, as described by Rangel et al. (2005). These lines were selected from BC2F2 families and field evaluated on the occasion of a QTL analysis (Brondani et al., 2002). These families were then advanced on subsequent generations using the bulk methodology, where a sample of seeds from each family was mixed and sown together to originate the next generation.
Phenotypical evaluations
The 35 ILs were characterized for grain yield and grain quality traits (amylose content, gelatinization temperature and cohesiveness) in three locations (Goianira - State of Goiás; Formoso do Araguaia - State of Tocantins, and Boa Vista - State of Roraima), as described in Rangel et al. (2005). The joint analysis of variance of these experiments was used to select the 15 best performing ILs, which were evaluated in five locations (Goiani-ra, Formoso do Araguaia, Boa Vista, Itajaí - State of Santa Catarina, and Alegrete - State of Rio Grande do Sul), following a complete randomized block design with four replica-tions and using four high-yielding lines as controls (BG90-2, BRS Formoso, Metica 1, and IRGA 417). The 15 lines were evaluated for total yield, measured as the weight of grains from 10 random plants in each family. The analysis of variance was performed for each environment individually and for the five environments together (joint analysis) using the Genes software (Cruz, 1997). IL trait means were compared by the Scott and Knott test (P < 0.05), also performed by the Genes software.
187
©FUNPEC-RP www.funpecrp.com.brGenetics and Molecular Research 7 (1): 184-195 (2008)
Oriza glumaepatula-derived introgression lines
Molecular marker assay
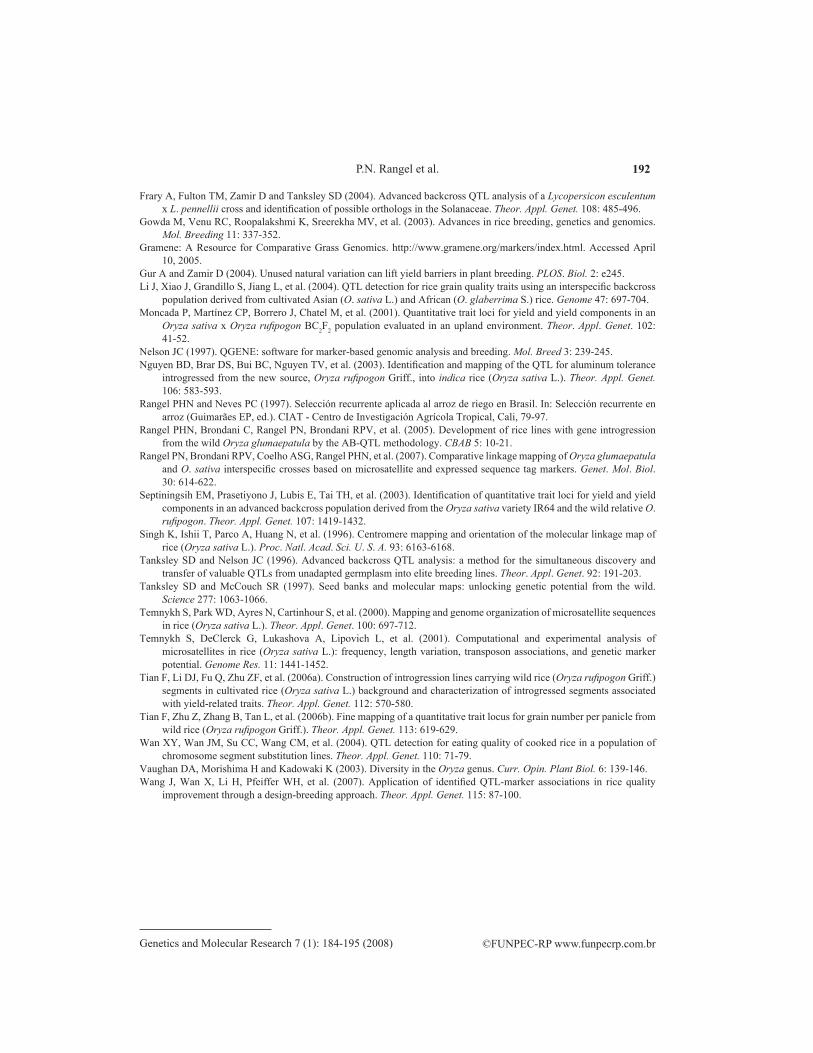
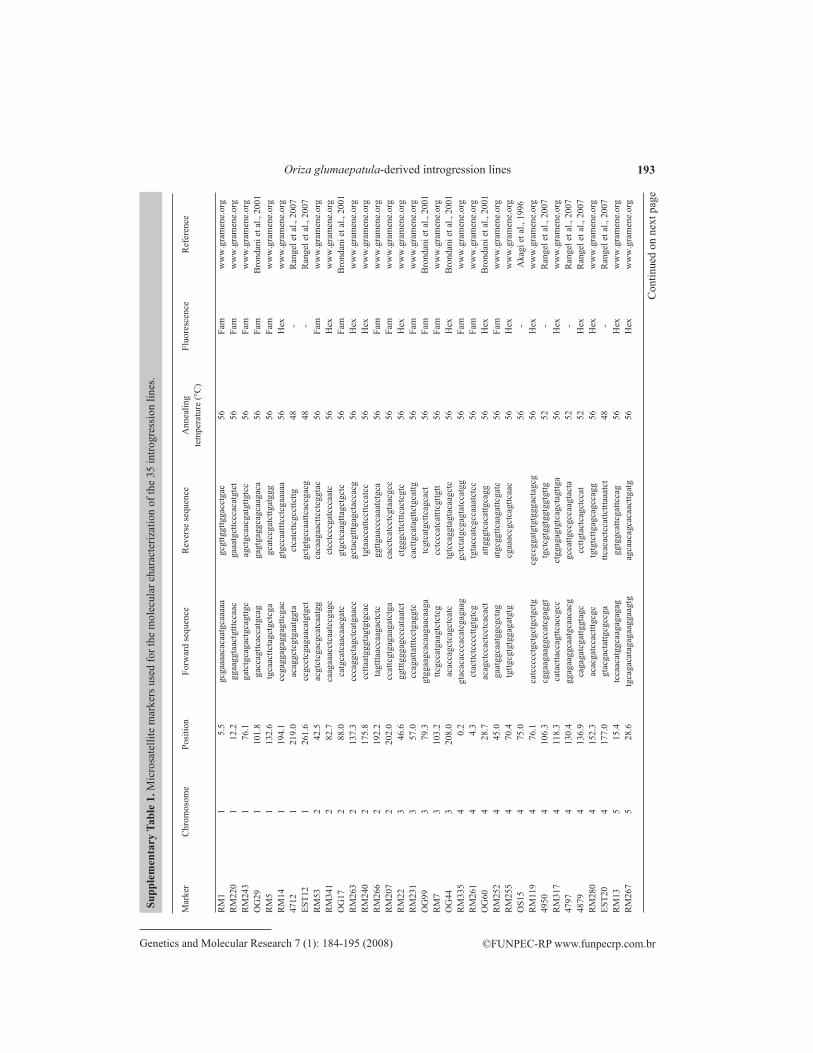
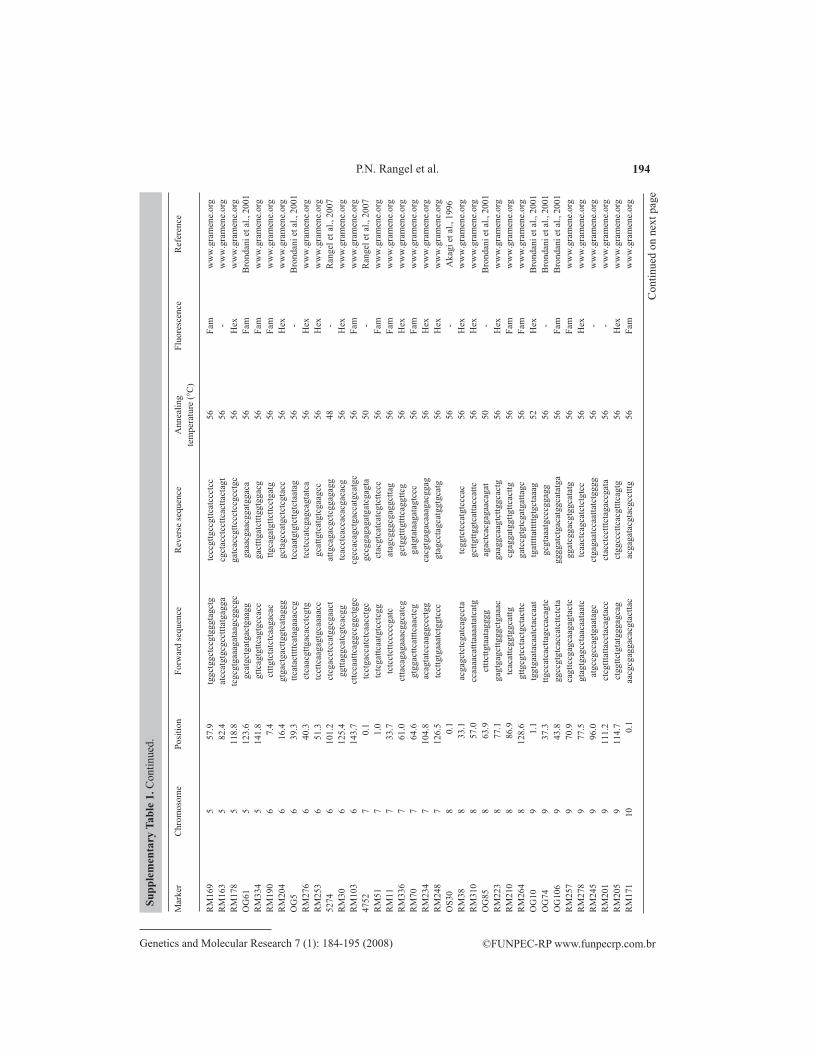
Fresh leaves of 10 representative plants of each one of the 35 ILs were collected and the DNA was extracted in bulk of plants, according to the protocol described by Ferreira and Gratta-paglia (1998). Microsatellite (simple sequence repeat) markers used in the molecular characteriza-tion were selected based on their distribution throughout the 12 rice chromosomes according to the O. glumaepatula x O. sativa linkage maps (Brondani et al., 2001; Rangel et al., 2005) and the Cornell O. sativa ssp indica (IR64) x O. sativa ssp japonica (Azucena) simple sequence repeat reference map (Singh et al., 1996; Temnykh et al., 2000, 2001; Cheng et al., 2001) available at the Gramene web site (http://www.gramene.org). A total of 92 polymorphic microsatellite markers were selected, from which 69 were fluorescent-labeled with either hexachloro-6-carboxyfluores-cein or 6-carboxyfluorescein, and the other 23 markers were not labeled (Supplementary Table 1). The amplification reactions were carried out in a final volume of 15 µL containing 15 ng of total genomic DNA, 0.3 µM of each primer, 0.25 mM of each dNTP, 10 mM Tris-HCl, pH 8.3, 50 mM KCl, 1.5 mM MgCl2, 0.2 mg/mL bovine serum albumin and 1.0 unit Taq DNA polymerase. The amplification reactions were conducted on a GeneAmp PCR System 9700 (Applied Biosystems) with a pre-cycle of 94°C for 5 min, followed by 40 cycles of 94°C for 1 min, 1 min at the anneal-ing temperature of each primer and 72°C for 1 min. An extension step of 72°C for 7 min was used. Electrophoresis was conducted on an ABI 3100 automated DNA analyzer (Applied Biosystems) and allele sizing was performed using the software GeneMapper 2.5 (Applied Biosystems). PCR products derived from the non-labeled markers were visualized on 6% denaturing polyacrylamide gels stained with silver nitrate, as described by Bassam et al. (1991). The software CSSL Finder (http://www.mapdisto.free.fr/CSSLFinder.htm) was used to estimate the proportion of the parents’ genome in each line and to construct the graphical genotypes.
The QTL analysis was conducted using the genotypic data from the 35 ILs obtained in this study and the phenotypic data obtained in field experiments conducted in Goianira, Boa Vista and Formoso do Araguaia, as described by Rangel et al. (2005). The QTL analysis was performed by the software QGene version 2.30 for MacIntosh (Nelson, 1997) using the single-marker regression method.
ReSultS
Phenotypic evaluation of introgression lines
In the season 2002/2003, the 35 ILs were evaluated in three field experiments for yield-related traits such as grain yield, tiller number and panicle number, and had their grains evalu-ated for milling and cooking quality traits (Rangel et al., 2005). For the average of the three locations, the most productive lines were CNAi 9930, CNAi 9931, CNAi 9934, CNAi 9935, CNAi 9936, and CNAi 9937. Among them, only CNAi 9930 showed long, thin and loose grains after cooking, characteristics of commercial value in Brazil and most parts of Latin America, and that were not present in the genitor BG90-2. The 15 best performing ILs were selected for further evaluation in five locations in the season 2003/2004.
Coefficients of variation of the experiments conducted in the season 2003/2004 ranged from 7% (Itajaí) to 14% (Alegrete) and were under the expected range for this kind of experiment. According to the joint analysis of variance obtained for the five locations, lines CNAi 9934, CNAi

188
©FUNPEC-RP www.funpecrp.com.brGenetics and Molecular Research 7 (1): 184-195 (2008)
P.N. Rangel et al.
9931, CNAi 9930, CNAi 9935, CNAi 9936, and CNAi 9937 showed the highest yield average and were statistically superior to the controls Metica 1 and IRGA 417 (Table 1). In the experiment conducted in Itajaí, lines CNAi 9931 and CNAi 9930 showed yield results that were statistically superior to the parent BG90-2. All lines, except CNAi 9934-85, CNAi 9924-92 and CNAi 9924-3, were statistically superior to the controls Metica 1 and IRGA 417. In Alegrete and Boa Vista, lines CNAi 9934, CNAi 9931, CNAi 9930, CNAi 9935, CNAi 9936, and CNAi 9937 showed yield av-erages that were statistically superior to the controls IRGA 417 and BRS Formoso, which are two of the most productive and extensively planted cultivars at each location, respectively (Table 1).
Lines Proportion of Proportion of Total Goianira Itajaí Formoso Alegrete Boa Vista homozygous heterogeneous mean* do Araguaia fragments fragments
CNAi 9934 1.09 3.26 8946a 7000a 7772b 7548a 12131a 10277a
CNAi 9931 1.09 2.17 8882a 6836a 8586a 6747a 11722a 10517a
BG90-2 - - 8598a 7941a 7750b 6380a 10357a 10561a
CNAi 9930 - 4.35 8574a 7586a 8295a 6371a 10973a 9644a
CNAi 9935 - 5.43 8554a 7278a 7817b 6919a 10247a 10511a
BRS Formoso - - 8479a 7495a 8747a 7867a 9755a 8533b
CNAi 9936 2.17 5.43 8438a 7383a 7847b 7077a 10003a 9879a
CNAi 9937 1.09 6.52 8390a 6461b 7921b 6558a 9949a 11064a
CNAi 9924-117 - 14.43 7742b 6464b 7643b 5359b 10389a 8856b
CNAi 9933 - 7.61 7577b 7109a 7528b 5820b 8308b 9121b
CNAi 9920-82 2.17 9.78 7394b 6020b 6787c 5523b 9774a 8869b
CNAi 9932 - 2.17 7344b 5556b 6899c 5820b 9397a 9048b
CNAi 9924-105 2.17 10.87 7317b 7158a 6300c 5165b 9489a 8475b
CNAi 9920-88 1.09 4.85 6961c 5625b 6640c 5751b 8349b 8442b
CNAi 9924-85 - 4.35 6957c 7352a 5726d 4580c 8901b 8225b
CNAi 9924-92 2.17 5.43 6916c 6158b 5349d 5017b 9714a 8343b
Metica 1 - - 6877c 6714a 5244d 5855b 6742b 9829a
IRGA 417 - - 6872c 5006b 5125d 6998a 8170b 9061b
CNAi 9924-3 3.26 9.78 6287c 6069b 5925d 3973c 8124b 7343b
Mean 7750 6752 7146 6070 9667 9290CV% 11 11 7 12 14 8
table 1. Grain yield (kg/ha) obtained in the trials conducted in the season 2003/2004 in five locations: Goianira, State of Goiás; Itajaí, State of Santa Catarina; Formoso do Araguaia, State of Tocantins; Alegrete, State of Rio Grande do Sul, and Boa Vista, State of Roraima, Brazil. The number of wild fragments and proportions of homozygous and heterogeneous fragments in the high-yielding introgression lines are shown.
*Total mean was obtained by the analysis of variance of the five locations together (joint analysis). CV = coefficient of variation. Superscribed letters represent statistical differences between the means according to the Scott and Knott test (P < 0.05).
Molecular characterization of introgression lines
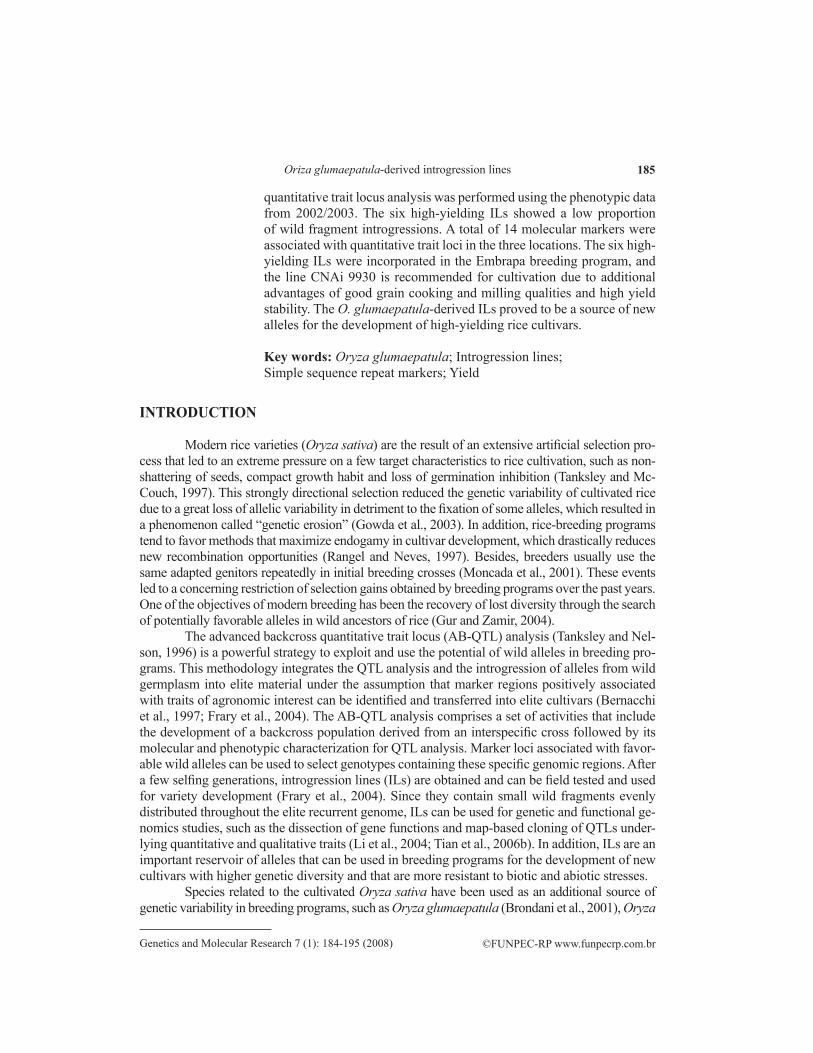
The 35 ILs were genotyped with 92 microsatellite markers distributed through the 12 rice chromosomes, with an average of 7 markers on each chromosome (Figure 1). A total of 30 wild alleles were detected among the 35 ILs on all chromosomes. The highest number of wild alleles was detected on chromosome 8 (10 alleles) and no homozygous wild allele was detected on chromosomes 5, 6, and 7. The average introgression proportion of homozygous wild alleles was 1.12% and ranged from 1.09 to 3.26%. Heterogeneous fragments ranged from 21.74 (line CNAi 9920-78) to 2.17% (lines CNAi 9930 and CNAi 9932), with an average of 8.18%.
189
©FUNPEC-RP www.funpecrp.com.brGenetics and Molecular Research 7 (1): 184-195 (2008)
Oriza glumaepatula-derived introgression lines
Lines CNAi 9934, CNAi 9931, CNAi 9930, CNAi 9935, CNAi 9936, and CNAi 9937 showed the best yield performance in the joint analysis of experiments and showed hetero-geneous introgression proportions of 3.26, 2.17, 4.35, 5.43, 5.43, and 6.52%, respectively. Homozygous wild introgression proportions were 1.09, 1.09, 2.17, and 1.09% (Table 1).
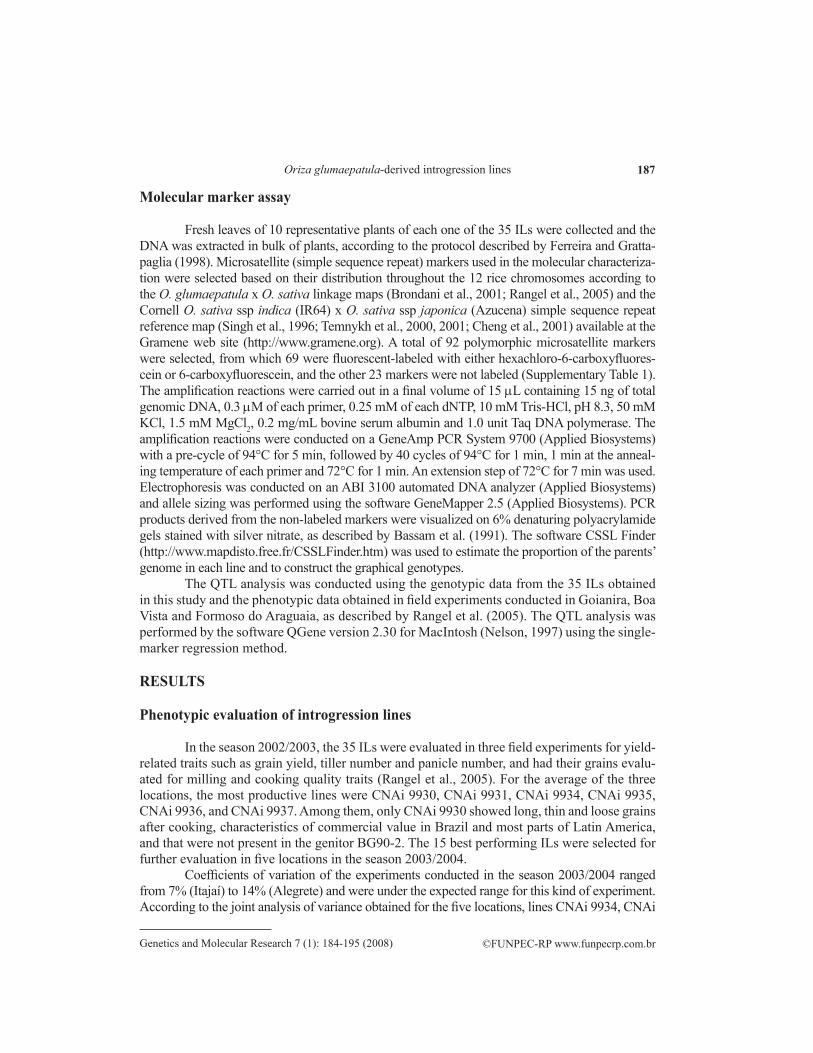
In an attempt to identify wild alleles related to high yield, a single-regression QTL analysis was performed using the molecular data obtained in the present study and phenotypic data for the 35 ILs obtained by Rangel et al. (2005). The analysis was performed using phenotypic data for grain yield measured in three locations: Goianira, Boa Vista and Formoso do Araguaia. In Goianira, six markers were associated with grain yield (P < 0.01) and explained from 21.58 (RM30) to 36.69% (RM1 and 5335) of the phenotypic variation (PV) of the trait. In Boa Vista, six markers were identi-fied and the PV explained by each one ranged from 15.34 (RM264) to 28.32% (OG10). Two markers were associated with grain yield in Formoso do Araguaia and explained 21.59 (OG10) and 17.58% (RM310) of the PV. In all QTLs, the alleles from BG90-2 were responsible for the positive effects on the trait, except the allele from the RM310 marker, identified in Formoso do Araguaia (Table 2).
Figure 1. Graphical genotypes of the 35 introgression lines showing the 12 rice chromosomes. Blue squares represent the recurrent parent (Oryza sativa) proportion of the genome. yellow squares represent the wild (Oryza glumaepatula) homozygous introgressions, red squares are the heterogeneous introgressions and gray squares represent missing data. Simple sequence repeat marker distributions on each chromosome are shown.
Location Marker Chromosome Source PV(%) P
Goianira RM1 1 BG90-2 36.68 0.0001 5335 11 BG90-2 36.68 0.0001 RM248 7 BG90-2 30.90 0.0005 RM220 1 BG90-2 30.43 0.0019 RM103 6 BG90-2 23.42 0.0043 RM30 6 BG90-2 21.58 0.0085
Boa Vista OG10 9 BG90-2 28.32 0.0017 RM178 5 BG90-2 23.41 0.0067 OG44 3 BG90-2 17.46 0.0125 RM210 8 BG90-2 16.43 0.0157 RM267 5 BG90-2 18.01 0.0173 RM264 8 BG90-2 15.34 0.022
Formoso do Araguaia OG10 9 BG90-2 21.59 0.0074 RM310 8 RS-16 17.58 0.0122
table 2. Quantitative trait loci detected for trait grain yield in 35 rice introgression lines with wild genomic fragments. Quantitative trait loci were detected under the minimum threshold of P < 0.01 in three locations: Goianira (State of Goiás), Boa Vista (State of Roraima) and Formoso do Araguaia (State of Tocantins), Brazil.
PV is the phenotypic variation explained by each marker.
190
©FUNPEC-RP www.funpecrp.com.brGenetics and Molecular Research 7 (1): 184-195 (2008)
P.N. Rangel et al.
QTLs detected in this study were compared to the ones detected for the BC2F2 popu-lation (Brondani et al., 2002) that derived the 35 ILs (BC2F8). This analysis revealed that the RM1 marker (chromosome 1) was associated with grain yield measured in Goianira for BC2F2 (PV% = 39.11) and BC2F8 (PV% = 36.68). In both analyses, the allele that was responsible for the positive effect came from the cultivated genitor BG90-2.
dISCuSSIoN
The agronomic and molecular characterizations of 35 ILs derived from the interspe-cific cross O. glumaepatula x O. sativa revealed that CNAi 9934, CNAi 9931, CNAi 9930, CNAi 9935, CNAi 9936, and CNAi 9937 were the most productive lines and that CNAi 9931 and CNAi 9930 were statistically superior to the parent BG90-2 in the trial conducted in Itajaí. These lines showed heterogeneous introgression proportions ranging from 2.17 to 6.42% and homozygous wild introgressions ranging from 1.09 to 2.17%. In fact, most of the wild introgres-sions were represented by heterogeneous fragments with an average proportion of 8.18 against 1.12% of homozygous introgressions. Since the lines were advanced in bulk in each selfing generation and the DNA was extracted in bulk from 10 plants, the presence of heterogeneous loci was expected, due to the possibility of occurrence, on each locus, of a mixture of heterozy-gous plants and/or homozygous plants for alleles from O. glumaepatula and O. sativa.
Lines with higher grain yield showed low introgression proportions. One of the main reasons may be the lower linkage drag in these lines, reducing the possibility of the presence of wild alleles with deleterious effects in genes related to traits of agronomic importance. Tian et al. (2006a) developed ILs containing introgressions from the wild O. rufipogon and also observed that the high-yielding ILs had the lowest number of introgressed fragments. The backcrosses performed as part of the AB-QTL methodology played an important role in reducing the linkage drag because they allowed a progressive breakage of wild fragments in each cross and the recovery of the cul-tivated genetic background. The results observed for the high-yielding lines CNAi 9934, CNAi 9931, CNAi 9930, CNAi 9935, CNAi 9936, and CNAi 9937 showed that the methodology was efficient in introducing favorable wild alleles while maintaining the best features of BG90-2.
The QTL analysis performed for the 35 ILs showed that markers were associated with grain yield in the three sites of evaluation. The comparison of QTLs detected in the ILs (BC2F8) and in the BC2F2 families in Goianira revealed that the RM1 marker was associated, on both generations, with grain yield. The proportions of phenotypic variation explained by this marker was high in BC2F2 and BC2F8 generations (39.11 and 36.68, respectively), indicat-ing that this marker was strongly associated with rice grain yield. The genomic region in the vicinity of the RM1 locus could be targeted to QTL fine mapping, in order to discover the gene responsible for the favorable expression of the trait. Since this marker was never identified in a QTL analysis involving intraspecific crosses, it can be implied that there are genomic regions from O. glumaepatula that could act positively with BG90-2 alleles to increase yield. There is also an opportunity to search for wild genomic fragments that could be involved as a trans-acting element to increase the effect of the BG90-2 allele at the RM1 locus.
Agronomic and molecular characterizations of the ILs allowed a better knowledge of their genomic composition and performance in the field. This strategy is being used routinely in the development of lines and cultivars originated from broad crosses in rice, mainly those involving interspecific crosses with O. glumaepatula, which is today an important source of

191
©FUNPEC-RP www.funpecrp.com.brGenetics and Molecular Research 7 (1): 184-195 (2008)
Oriza glumaepatula-derived introgression lines
genetic variability for the breeding program at Embrapa for traits such as yield and drought tolerance. A considerable number of rice ILs have been developed in recent years (Wan et al., 2004; Ebitani et al., 2005; Tian et al., 2006b; Wang et al., 2007). The power of QTL detection is higher in ILs than in primary mapping populations such as F2 or recombinant inbred lines, because, in ILs, it is possible to compare phenotypic effects between alleles on the substituted segments (Ebitani et al., 2005). Therefore, this type of population could be used to detect and confirm QTLs for important agronomic traits. Wan et al. (2004) used 66 ILs and detected six QTLs for grain quality traits that behaved as non-environment specific and that, according to the authors, could be used for marker-assisted selection. The molecular characterization of the 35 O. glumaepatula-derived ILs will allow a rapid identification of wild fragments facilitating the selection of ILs containing homozygous introgressions in regions of interest. Molecular markers allow the identification of introgressed fragments to the early selection of plants with smaller fragments, contributing to a faster and less expensive process. In addition, the effect of the incorporation of small fragments on the traits of interest can be measured, and the favor-able alleles, either from the cultivated or the wild parent, can be detected.
Lines CNAi 9934, CNAi 9931, CNAi 9930, CNAi 9935, CNAi 9936, and CNAi 9937 showed high yield performance in five replicated experiments. These high-yielding lines have different fragments of O. glumaepatula, combined in different individuals, which confer ge-netic variability that is useful for low-input agriculture. Among them, CNAi 9930 is ready to be released to small farmers, due to grain quality traits and high production in ratooning, which increases the total yield by 30% (Rangel et al., 2005). The best performing ILs are available for rice breeders as a source of new allelic variation for the development of high-yielding cultivars. The generation of new ILs derived from O. glumaepatula x O. sativa crosses is under way, to continuously offer genetic materials of broadened genetic basis for rice breeding programs.
ReFeReNCeS
Akagi H, yokozeki y, Inagaki A and Fujimura T (1996). Microsatellite DNA markers for rice chromosomes. Theor. Appl. Genet. 93: 1071-1077.
Aluko G, Martinez C, Tohme J, Castano C, et al. (2004). QTL mapping of grain quality traits from the interspecific cross Oryza sativa x O. glaberrima. Theor. Appl. Genet. 109: 630-639.
Bassam BJ, Caetano-Anolles G and Gresshoff PM (1991). Fast and sensitive silver staining of DNA in polyacrylamide gels. Anal. Biochem. 196: 80-83.
Bernacchi D, Beck-Bunn T, Eshed Y, Inai S, et al. (1997). Advanced backcross QTL analysis in tomato. I. Identification of QTL for traits of agronomic importance from Lycopersicon hirsutum. Theor. Appl. Genet. 97: 381-397.
Brondani C, Brondani RP, Rangel PH and Ferreira ME (2001). Development and mapping of Oryza glumaepatula-derived microsatellite markers in the interspecific cross Oryza glumaepatula x O. sativa. Hereditas 134: 59-71.
Brondani C, Rangel N, Brondani V and Ferreira E (2002). QTL mapping and introgression of yield-related traits from Oryza glumaepatula to cultivated rice (Oryza sativa) using microsatellite markers. Theor. Appl. Genet. 104: 1192-1203.
Brondani RP, Zucchi MI, Brondani C, Nakano Rangel PH, et al. (2005). Genetic structure of wild rice Oryza glumaepatula populations in three Brazilian biomes using microsatellite markers. Genetica 125: 115-123.
Cheng Z, Presting GG, Buell CR, Wing RA, et al. (2001). High-resolution pachytene chromosome mapping of bacterial artificial chromosomes anchored by genetic markers reveals the centromere location and the distribution of genetic recombination along chromosome 10 of rice. Genetics 157: 1749-1757.
Cruz CD (1997). Programa Genes: aplicativo computacional em genética e estatística. UFV, Viçosa.Ebitani T, Takeuchi y, Nonoue y, yamamoto T, et al. (2005). Construction and evaluation of chromosome segment
substitution lines carrying overlapping chromosome segments of indica rice cultivar Kasalath in a genetic background of japonica elite cultivar Kohihikari. Breeding Sci. 55: 65-73.
Ferreira ME and Grattapaglia D (1998). Introdução ao uso de marcadores moleculares em análise genética. Embrapa Cenargen, Brasília.
192
©FUNPEC-RP www.funpecrp.com.brGenetics and Molecular Research 7 (1): 184-195 (2008)
P.N. Rangel et al.
Frary A, Fulton TM, Zamir D and Tanksley SD (2004). Advanced backcross QTL analysis of a Lycopersicon esculentum x L. pennellii cross and identification of possible orthologs in the Solanaceae. Theor. Appl. Genet. 108: 485-496.
Gowda M, Venu RC, Roopalakshmi K, Sreerekha MV, et al. (2003). Advances in rice breeding, genetics and genomics. Mol. Breeding 11: 337-352.
Gramene: A Resource for Comparative Grass Genomics. http://www.gramene.org/markers/index.html. Accessed April 10, 2005.
Gur A and Zamir D (2004). Unused natural variation can lift yield barriers in plant breeding. PLOS. Biol. 2: e245.Li J, Xiao J, Grandillo S, Jiang L, et al. (2004). QTL detection for rice grain quality traits using an interspecific backcross
population derived from cultivated Asian (O. sativa L.) and African (O. glaberrima S.) rice. Genome 47: 697-704.Moncada P, Martínez CP, Borrero J, Chatel M, et al. (2001). Quantitative trait loci for yield and yield components in an
Oryza sativa x Oryza rufipogon BC2F2 population evaluated in an upland environment. Theor. Appl. Genet. 102: 41-52.
Nelson JC (1997). QGENE: software for marker-based genomic analysis and breeding. Mol. Breed 3: 239-245.Nguyen BD, Brar DS, Bui BC, Nguyen TV, et al. (2003). Identification and mapping of the QTL for aluminum tolerance
introgressed from the new source, Oryza rufipogon Griff., into indica rice (Oryza sativa L.). Theor. Appl. Genet. 106: 583-593.
Rangel PHN and Neves PC (1997). Selección recurrente aplicada al arroz de riego en Brasil. In: Selección recurrente en arroz (Guimarães EP, ed.). CIAT - Centro de Investigación Agrícola Tropical, Cali, 79-97.
Rangel PHN, Brondani C, Rangel PN, Brondani RPV, et al. (2005). Development of rice lines with gene introgression from the wild Oryza glumaepatula by the AB-QTL methodology. CBAB 5: 10-21.
Rangel PN, Brondani RPV, Coelho ASG, Rangel PHN, et al. (2007). Comparative linkage mapping of Oryza glumaepatula and O. sativa interspecific crosses based on microsatellite and expressed sequence tag markers. Genet. Mol. Biol. 30: 614-622.
Septiningsih EM, Prasetiyono J, Lubis E, Tai TH, et al. (2003). Identification of quantitative trait loci for yield and yield components in an advanced backcross population derived from the Oryza sativa variety IR64 and the wild relative O. rufipogon. Theor. Appl. Genet. 107: 1419-1432.
Singh K, Ishii T, Parco A, Huang N, et al. (1996). Centromere mapping and orientation of the molecular linkage map of rice (Oryza sativa L.). Proc. Natl. Acad. Sci. U. S. A. 93: 6163-6168.
Tanksley SD and Nelson JC (1996). Advanced backcross QTL analysis: a method for the simultaneous discovery and transfer of valuable QTLs from unadapted germplasm into elite breeding lines. Theor. Appl. Genet. 92: 191-203.
Tanksley SD and McCouch SR (1997). Seed banks and molecular maps: unlocking genetic potential from the wild. Science 277: 1063-1066.
Temnykh S, Park WD, Ayres N, Cartinhour S, et al. (2000). Mapping and genome organization of microsatellite sequences in rice (Oryza sativa L.). Theor. Appl. Genet. 100: 697-712.
Temnykh S, DeClerck G, Lukashova A, Lipovich L, et al. (2001). Computational and experimental analysis of microsatellites in rice (Oryza sativa L.): frequency, length variation, transposon associations, and genetic marker potential. Genome Res. 11: 1441-1452.
Tian F, Li DJ, Fu Q, Zhu ZF, et al. (2006a). Construction of introgression lines carrying wild rice (Oryza rufipogon Griff.) segments in cultivated rice (Oryza sativa L.) background and characterization of introgressed segments associated with yield-related traits. Theor. Appl. Genet. 112: 570-580.
Tian F, Zhu Z, Zhang B, Tan L, et al. (2006b). Fine mapping of a quantitative trait locus for grain number per panicle from wild rice (Oryza rufipogon Griff.). Theor. Appl. Genet. 113: 619-629.
Wan Xy, Wan JM, Su CC, Wang CM, et al. (2004). QTL detection for eating quality of cooked rice in a population of chromosome segment substitution lines. Theor. Appl. Genet. 110: 71-79.
Vaughan DA, Morishima H and Kadowaki K (2003). Diversity in the Oryza genus. Curr. Opin. Plant Biol. 6: 139-146.Wang J, Wan X, Li H, Pfeiffer WH, et al. (2007). Application of identified QTL-marker associations in rice quality
improvement through a design-breeding approach. Theor. Appl. Genet. 115: 87-100.
193
©FUNPEC-RP www.funpecrp.com.brGenetics and Molecular Research 7 (1): 184-195 (2008)
Oriza glumaepatula-derived introgression linesM
arke
r C
hrom
osom
e Po
sitio
n Fo
rwar
d se
quen
ce
Rev
erse
sequ
ence
A
nnea
ling
Fluo
resc
ence
R
efer
ence
tem
pera
ture
(°C
)
RM
1
1
5.5
gc
gaaa
acac
aatg
caaa
aa
gcgt
tggt
tgga
cctg
ac
56
Fam
w
ww
.gra
men
e.or
gR
M22
0 1
12.
2 gg
aagg
taac
tgttt
ccaa
c ga
aatg
cttc
ccac
atgt
ct
56
Fam
w
ww
.gra
men
e.or
gR
M24
3 1
76.
1 ga
tctg
caga
ctgc
agttg
c ag
ctgc
aacg
atgt
tgtc
c 56
Fa
m
ww
w.g
ram
ene.
org
OG
29
1 10
1.8
gacc
agttc
acca
tgca
g ga
gtga
ggca
gcaa
gaca
56
Fa
m
Bro
ndan
i et a
l., 2
001
RM
5
1 13
2.6
tgca
acttc
tagc
tgct
cga
gcat
ccga
tcttg
atgg
g 56
Fa
m
ww
w.g
ram
ene.
org
RM
14
1 19
4.1
ccga
ggag
agga
gttc
gac
gtgc
caat
ttcct
cgaa
aaa
56
Hex
w
ww
.gra
men
e.or
g47
12
1 21
9.0
acag
gctc
gtga
atgg
ta
ctca
tcttc
gcct
tcttg
48
-
Ran
gel e
t al.,
200
7ES
T12
1 26
1.6
ccgc
ctcg
agaa
catg
tgct
gc
tgtg
ccaa
ttcac
cgac
g 48
-
Ran
gel e
t al.,
200
7 R
M53
2
42.
5 ac
gtct
cgac
gcat
caat
gg
caca
agaa
cttc
ctcg
gtac
56
Fa
m
ww
w.g
ram
ene.
org
RM
341
2 8
2.7
caag
aaac
ctca
atcc
gagc
ct
cctc
ccga
tccc
aatc
56
H
ex
ww
w.g
ram
ene.
org
OG
17
2 8
8.0
catg
catc
aaca
acga
tc
gtgc
tcaa
gtta
gctg
ctc
56
Fam
B
rond
ani e
t al.,
200
1R
M26
3 2
137.
3 cc
cagg
ctag
ctca
tgaa
cc
gcta
cgttt
gagc
tacc
acg
56
Hex
w
ww
.gra
men
e.or
gR
M24
0 2
175.
8 cc
ttaat
gggt
agtg
tgca
c tg
taac
cattc
cttc
catc
c 56
H
ex
ww
w.g
ram
ene.
org
RM
266
2 19
2.2
tagt
ttaac
caag
actc
tc
ggttg
aacc
caaa
tctg
ca
56
Fam
w
ww
.gra
men
e.or
gR
M20
7 2
202.
0 cc
attc
gtga
gaag
atct
ga
cacc
tcat
cctc
gtaa
cgcc
56
Fa
m
ww
w.g
ram
ene.
org
RM
22
3 4
6.6
ggttt
ggga
gccc
ataa
tct
ctgg
gcttc
tttca
ctcg
tc
56
Hex
w
ww
.gra
men
e.or
gR
M23
1 3
57.
0 cc
agat
tattt
cctg
aggt
c ca
cttg
cata
gttc
tgca
ttg
56
Fam
w
ww
.gra
men
e.or
gO
G99
3
79.
3 gt
ggaa
gcac
aaga
acaa
ga
tcgt
catg
cttc
agca
ct
56
Fam
B
rond
ani e
t al.,
200
1R
M7
3
103.
2 ttc
gcca
tgaa
gtct
ctcg
cc
tccc
atca
tttcg
ttgtt
56
Fam
w
ww
.gra
men
e.or
gO
G44
3
208.
0 ac
acca
gctc
agct
catc
tg
tcca
ggta
gtac
aagc
tc
56
Hex
B
rond
ani e
t al.,
200
1R
M33
5 4
0
.2
gtac
acac
ccac
atcg
agaa
g gc
tcta
tgcg
agta
tcca
tgg
56
Fam
w
ww
.gra
men
e.or
gR
M26
1 4
4
.3
ctac
ttctc
ccct
tgtg
tcg
tgta
ccat
cgcc
aaat
ctcc
56
Fa
m
ww
w.g
ram
ene.
org
OG
60
4 2
8.7
acag
ctcc
actc
ctca
cact
at
tggg
tcac
attg
cagg
56
H
ex
Bro
ndan
i et a
l., 2
001
RM
252
4 4
5.0
gaat
ggca
atgg
cgct
ag
atgc
ggttc
aaga
ttcga
tc
56
Fam
w
ww
.gra
men
e.or
gR
M25
5 4
70.
4 tg
ttgcg
tgtg
gaga
tgtg
cg
aaac
cgct
cagt
tcaa
c 56
H
ex
ww
w.g
ram
ene.
org
OS1
5 4
75.
0
56
-
Aka
gi e
t al.,
199
6 R
M11
9 4
76.
1 ca
tccc
cctg
ctgc
tgct
gctg
cg
ccgg
atgt
gtgg
gact
agcg
56
H
ex
ww
w.g
ram
ene.
org
4950
4
106.
3 cg
gaag
aagg
ccat
cgag
gt
tgct
cgtg
gtgg
tggt
gttg
52
-
Ran
gel e
t al.,
200
7 R
M31
7 4
118.
3 ca
tact
tacc
agttc
accg
cc
ctgg
agag
tgtc
agct
agttg
a 56
H
ex
ww
w.g
ram
ene.
org
4797
4
130.
4 gg
agaa
ggca
atgc
aaca
cg
gcca
ttgcc
gcca
agta
cta
52
- R
ange
l et a
l., 2
007
4879
4
136.
9 ca
gaga
tcga
ttggt
agc
ccttg
tact
cagc
tcca
t 52
H
ex
Ran
gel e
t al.,
200
7 R
M28
0 4
152.
3 ac
acga
tcca
ctttg
cgc
tgtg
tcttg
agca
gcca
gg
56
Hex
w
ww
.gra
men
e.or
gES
T20
4 17
7.0
gtac
gact
attg
cgcc
ga
ttcac
actc
cattc
tttaa
atct
48
-
Ran
gel e
t al.,
200
7R
M13
5
15.
4 tc
caac
atgg
caag
agag
ag
ggtg
gcat
tcga
ttcca
g 56
H
ex
ww
w.g
ram
ene.
org
RM
267
5 2
8.6
tgca
gaca
taga
gaag
gaag
tg
agca
acag
caca
acttg
atg
56
Hex
w
ww
.gra
men
e.or
g
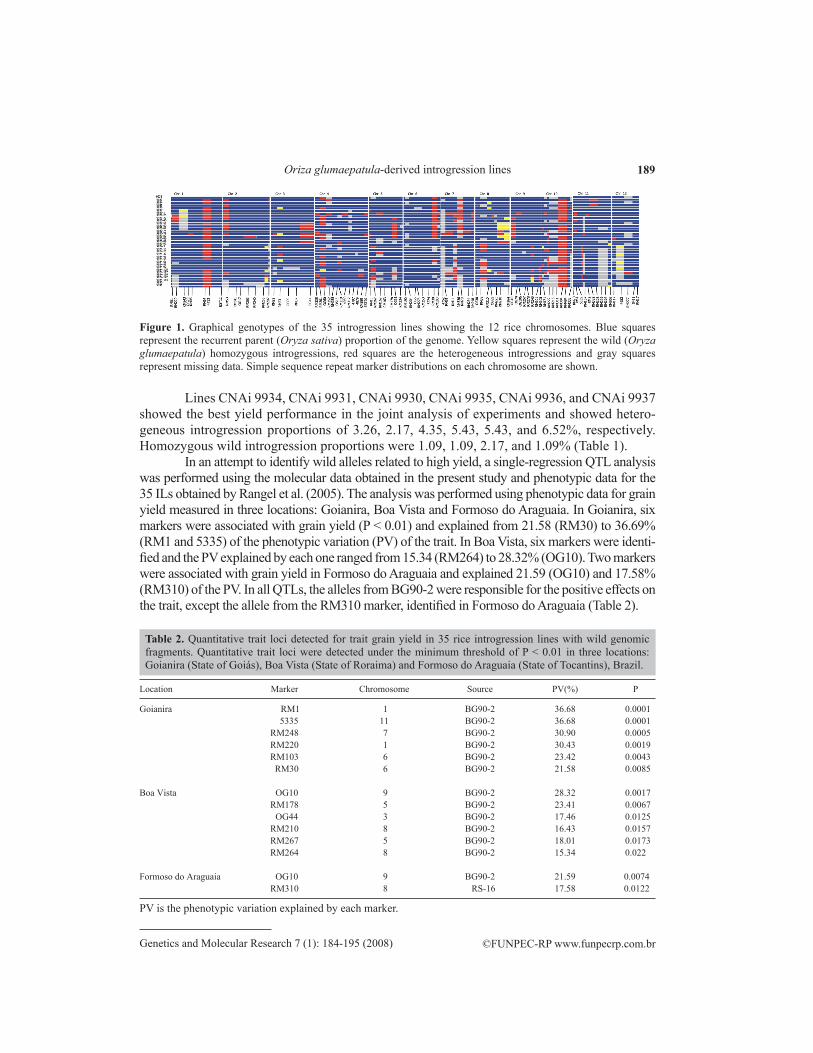
Supp
lem
enta
ry t
able
1. M
icro
sate
llite
mar
kers
use
d fo
r the
mol
ecul
ar c
hara
cter
izat
ion
of th
e 35
intro
gres
sion
line
s.
Con
tinue
d on
nex
t pag
e
194
©FUNPEC-RP www.funpecrp.com.brGenetics and Molecular Research 7 (1): 184-195 (2008)
P.N. Rangel et al.M
arke
r C
hrom
osom
e Po
sitio
n Fo
rwar
d se
quen
ce
Rev
erse
sequ
ence
A
nnea
ling
Fluo
resc
ence
R
efer
ence
tem
pera
ture
(°C
)
RM
169
5 5
7.9
tggc
tggc
tccg
tggg
tagc
tg
tccc
gttg
ccgt
tcat
ccct
cc
56
Fam
w
ww
.gra
men
e.or
gR
M16
3 5
82.
4 at
ccat
gtgc
gcct
ttatg
agga
cg
ctac
ctcc
ttcac
ttact
agt
56
- w
ww
.gra
men
e.or
gR
M17
8 5
118.
8 tc
gcgt
gaaa
gata
agcg
gcgc
ga
tcac
cgttc
cctc
cgcc
tgc
56
Hex
w
ww
.gra
men
e.or
gO
G61
5
123.
6 gc
atgc
tgat
gact
gaag
g ga
aacg
aacg
gatg
gaca
56
Fa
m
Bro
ndan
i et a
l., 2
001
RM
334
5 14
1.8
gttc
agtg
ttcag
tgcc
acc
gact
ttgat
ctttg
gtgg
acg
56
Fam
w
ww
.gra
men
e.or
gR
M19
0 6
7
.4
ctttg
tcta
tctc
aaga
cac
ttgca
gatg
ttcttc
ctga
tg
56
Fam
w
ww
.gra
men
e.or
gR
M20
4 6
16.
4 gt
gact
gact
tggt
cata
ggg
gcta
gcca
tgct
ctcg
tacc
56
H
ex
ww
w.g
ram
ene.
org
OG
5
6 3
9.3
ttcat
acttt
tcat
agaa
accg
tc
caat
gtgt
cttg
tcta
atag
56
-
Bro
ndan
i et a
l., 2
001
RM
276
6 4
0.3
ctca
acgt
tgac
acct
cgtg
tc
ctcc
atcg
agca
gtat
ca
56
Hex
w
ww
.gra
men
e.or
gR
M25
3 6
51.
3 tc
cttc
aaga
gtgc
aaaa
cc
gcat
tgtc
atgt
cgaa
gcc
56
Hex
w
ww
.gra
men
e.or
g52
74
6 10
1.2
ctcg
acct
ccat
ggcg
aact
at
tgca
gacg
ctcg
gaga
gg
48
- R
ange
l et a
l., 2
007
RM
30
6 12
5.4
ggtta
ggca
tcgt
cacg
g tc
acct
cacc
acac
gaca
cg
56
Hex
w
ww
.gra
men
e.or
gR
M10
3 6
143.
7 ct
tcca
attc
aggc
cggc
tggc
cg
ccac
agct
gacc
atgc
atgc
56
Fa
m
ww
w.g
ram
ene.
org
4752
7
0
.1
tcct
gacc
atct
caac
ctgc
gc
cgga
gaga
tgat
cgag
ta
50
- R
ange
l et a
l., 2
007
RM
51
7
1.0
tc
tcga
ttcaa
tgtc
ctcg
g ct
acgt
catc
atcg
tcttc
cc
56
Fam
w
ww
.gra
men
e.or
gR
M11
7
33.
7 tc
tcct
cttc
cccc
gatc
at
agcg
ggcg
aggc
ttag
56
Fam
w
ww
.gra
men
e.or
gR
M33
6 7
61.
0 ct
taca
gaga
aacg
gcat
cg
gctg
gtttg
tttca
ggttc
g 56
H
ex
ww
w.g
ram
ene.
org
RM
70
7 6
4.6
gtgg
acttc
atttc
aact
cg
gatg
tata
agat
agtc
cc
56
Fam
w
ww
.gra
men
e.or
gR
M23
4 7
104.
8 ac
agta
tcca
aggc
cctg
g ca
cgtg
agac
aaag
acgg
ag
56
Hex
w
ww
.gra
men
e.or
gR
M24
8 7
126.
5 tc
cttg
tgaa
atct
ggtc
cc
gtag
ccta
gcat
ggtg
catg
56
H
ex
ww
w.g
ram
ene.
org
OS3
0 8
0
.1
56
- A
kagi
et a
l., 1
996
RM
38
8
33.1
ac
gagc
tctc
gatc
agcc
ta
tcgg
tctc
catg
tccc
ac
56
Hex
w
ww
.gra
men
e.or
gR
M31
0 8
57
.0
ccaa
aaca
tttaa
aata
tcat
g gc
ttgttg
gtca
ttacc
attc
56
H
ex
ww
w.g
ram
ene.
org
OG
85
8
63.9
ct
ttcttg
taat
aggg
g ag
actc
acga
gaac
agat
50
-
Bro
ndan
i et a
l., 2
001
RM
223
8
77.1
ga
gtga
gcttg
ggct
gaaa
c ga
aggc
aagt
cttg
gcac
tg
56
Hex
w
ww
.gra
men
e.or
gR
M21
0 8
86
.9
tcac
attc
ggtg
gcat
tg
cgag
gatg
gttg
ttcac
ttg
56
Fam
w
ww
.gra
men
e.or
gR
M26
4 8
128.
6 gt
tgcg
tcct
actg
ctac
ttc
gatc
cgtg
tcga
tgat
tagc
56
Fa
m
ww
w.g
ram
ene.
org
OG
10
9
1.1
tg
gtga
atac
aatc
tacc
aat
tgat
tttat
ttttg
tgct
aaag
52
H
ex
Bro
ndan
i et a
l., 2
001
OG
74
9 3
7.3
ttgcc
atca
ctta
gcca
cagt
c gc
gtaa
atgc
ccgg
agg
56
- B
rond
ani e
t al.,
200
1O
G10
6 9
43.
8 gg
ccgt
gtca
ccat
cttc
tcta
gg
ggat
ctga
catg
gcat
atga
56
Fa
m
Bro
ndan
i et a
l., 2
001
RM
257
9 7
0.9
cagt
tccg
agca
agag
tact
c gg
atcg
gacg
tggc
atat
g 56
Fa
m
ww
w.g
ram
ene.
org
RM
278
9 7
7.5
gtag
tgag
ccta
acaa
taat
c tc
aact
cagc
atct
ctgt
cc
56
Hex
w
ww
.gra
men
e.or
gR
M24
5 9
96.
0 at
gccg
ccag
tgaa
tagc
ct
gaga
atcc
aatta
tctg
ggg
56
- w
ww
.gra
men
e.or
gR
M20
1 9
111.
2 ct
cgttt
atta
ccta
cagt
acc
ctac
ctcc
tttct
agac
cgat
a 56
-
ww
w.g
ram
ene.
org
RM
205
9 11
4.7
ctgg
ttctg
tatg
ggag
cag
ctgg
ccct
tcac
gtttc
agtg
56
H
ex
ww
w.g
ram
ene.
org
RM
171
10
0
.1
aacg
cgag
gaca
cgta
ctta
c ac
gaga
tacg
tacg
ccttt
g 56
Fa
m
ww
w.g
ram
ene.
org
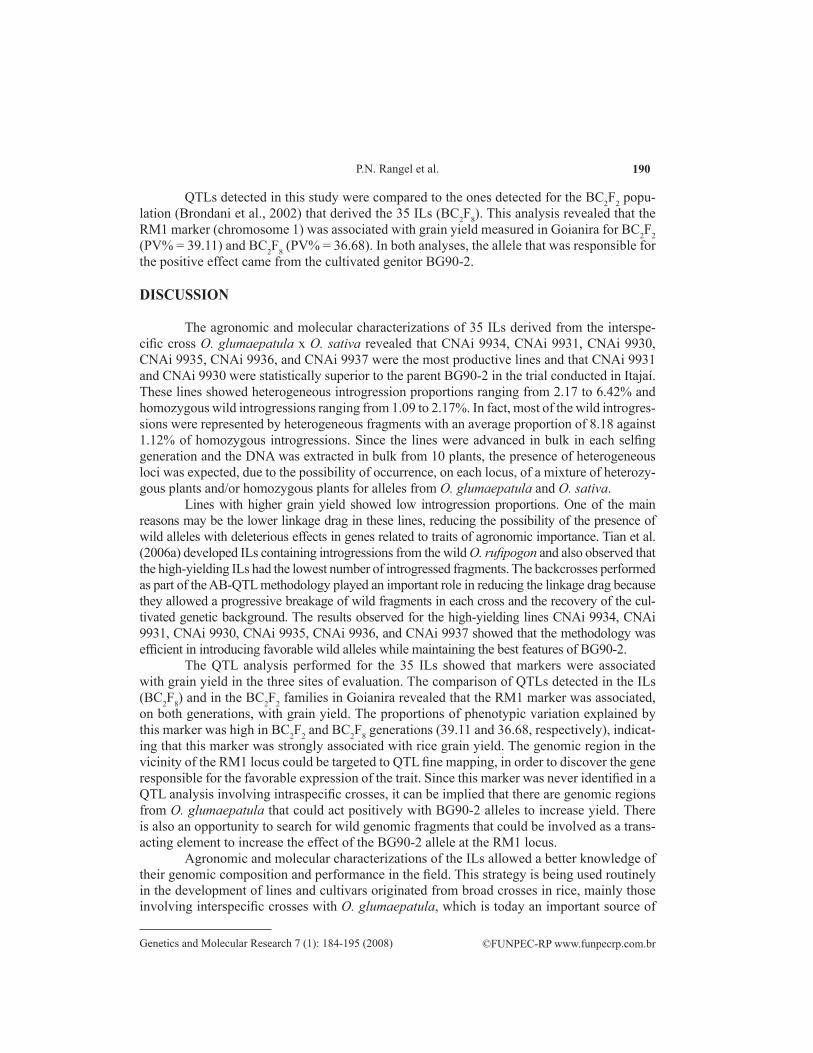
Supp
lem
enta
ry t
able
1. C
ontin
ued.
Con
tinue
d on
nex
t pag
e
195
©FUNPEC-RP www.funpecrp.com.brGenetics and Molecular Research 7 (1): 184-195 (2008)
Oriza glumaepatula-derived introgression lines
Mar
ker
Chr
omos
ome
Posi
tion
Forw
ard
sequ
ence
R
ever
se se
quen
ce
Ann
ealin
g Fl
uore
scen
ce
Ref
eren
ce
te
mpe
ratu
re (°
C)
RM
222
10
11.
3 ct
taaa
tggg
ccac
atgc
g ca
aagc
ttccg
gcca
aaag
56
Fa
m
ww
w.g
ram
ene.
org
RM
216
10
17.
6 gc
atgg
ccga
tggt
aaag
tg
tata
aaac
caca
cggc
ca
56
Hex
w
ww
.gra
men
e.or
gR
M31
1 10
2
5.2
tggt
agta
tagg
tact
aaac
at
tcct
atac
acat
acaa
acat
ac
56
Hex
w
ww
.gra
men
e.or
gR
M30
4 10
7
3.0
tcaa
accg
gcac
atat
aaga
c ga
tagg
gagc
tgaa
ggag
atg
56
Hex
w
ww
.gra
men
e.or
gR
M48
4 10
7
9.0
tctc
cctc
ctca
ccat
tgtc
tg
ctgc
cctc
tctc
tctc
tc
56
Hex
w
ww
.gra
men
e.or
gR
M33
3 10
9
1.7
gtac
gact
acga
gtgt
cacc
aa
gtct
tcgc
gatc
actc
gc
56
Hex
w
ww
.gra
men
e.or
gR
M20
11
0.1
at
cttg
tccc
tgca
ggtc
at
gaaa
caga
ggca
cattt
cattg
56
-
ww
w.g
ram
ene.
org
RM
4
11
1
.0
ttgac
gagg
tcag
cact
gac
aggg
tgta
tccg
actc
atcg
56
-
ww
w.g
ram
ene.
org
5335
11
2.0
tta
cggc
agct
aggc
aaga
g gt
cgag
tgga
gcac
aagg
aa
52
- R
ange
l et a
l., 2
007
RM
167
11
20.
4 ga
tcca
gcgt
gagg
aaca
cgt
agtc
cgac
caca
aggt
gcgt
tgtc
56
-
ww
w.g
ram
ene.
org
RM
2
11
23.
9 ac
gtgt
cacc
gcttc
ctc
atgt
ccgg
gatc
tcat
cg
56
- w
ww
.gra
men
e.or
gR
M33
2 11
2
7.9
gcga
aggc
gaag
gtga
ag
catg
agtg
atct
cact
cacc
c 56
H
ex
ww
w.g
ram
ene.
org
RM
202
11
34.
8 ca
gattg
gaga
tgaa
gtcc
tcc
ccag
caag
catg
tcaa
tgta
56
-
ww
w.g
ram
ene.
org
RM
229
11
51.
1 ca
ctca
cacg
aacg
actg
ac
cgca
ggttc
ttgtg
aaat
gt
56
Hex
w
ww
.gra
men
e.or
gR
M22
4 11
8
3.4
atcg
atcg
atct
tcac
gagg
tg
ctat
aaaa
ggca
ttcgg
g 56
H
ex
ww
w.g
ram
ene.
org
RM
206
11
102.
9 cc
catg
cgttt
aact
attc
t cg
ttcca
tcga
tccg
tatg
g 56
Fa
m
ww
w.g
ram
ene.
org
RM
117
12
0
.2
cgat
ccat
tcct
gctg
ctcg
cg
cgcc
ccca
tgca
tgag
aaga
cg
56
Fam
w
ww
.gra
men
e.or
g46
53
12
32.
3 ct
cgga
caag
catg
atct
aa
ccga
tgca
gatc
agag
52
Fa
m
Ran
gel e
t al.,
200
7 R
M27
7 12
5
7.2
cggt
caaa
tcat
cacc
tgac
ca
aggc
ttgca
aggg
aag
56
Fam
w
ww
.gra
men
e.or
g54
11
12
102.
0 gg
tattg
tcgg
tgttc
agg
gtga
aggc
tgta
ccat
cca
52
- R
ange
l et a
l., 2
007
RM
17
12
105.
3 tg
ccct
gtta
ttttc
ttctc
tc
ggtg
atcc
tttcc
cattt
ca
56
- w
ww
.gra
men
e.or
g
Supp
lem
enta
ry t
able
1. C
ontin
ued.
Fam
(6-c
arbo
xyflu
ores
cein
) and
Hex
(hex
achl
oro-
6-ca
rbox
yfluo
resc
ein)
are
fluo
resc
ent-l
abel
ed m
arke
rs.


