
Optimizing ECF Bleaching Technologies with a Poor
Man’s O
Lucian A. LuciaT. J. Dyer, D. Johnston, A.J. Ragauskas
Institute of Paper Science and Technology

Oxygen Delignification
0
50
100
150
200Million
Tons
1983 1986 1994 2000
Chemical Usage of North American Bleach Plants
Chlorine Chlorine Dioxide O Delign.
Improved environmental and operating cost performance

O Delignification: Background
0
100
200
300
400
500
600
700
Cita
tions
1965
-7019
70-75
1975
-8019
80-85
1985
-9019
90-95
1995
-99
Literature• 1960/70s
– basic engineering & chemistry• 1980/early 90s
– process parameters, energy, environmental, pretreatments, fundamental chemistry, pulp properties
• Late 1990’s – yield, selectivity, process
parameters, lignin/carbohydrate chemistry, catalysts

Oxygen DelignificationIncreased interest in one and two-stage oxygen delignification
38394041424344454647484950
0 10 20 30 40 50 60
Pulp
Yiel
d, %
.
30 ECF
30 (O)40 (OO)
50 (OO)
Kraft
KAPPA
DEopD
DEopD
Yield and Operating Benefits

An Alternative Approach
• Mini-O– Removes less lignin– Less capital– Easily retrofitted
• Enhanced Mini-O– Greater lignin removal– Multiple stages– H2O2 and/or ClO2

Mill Application• McKenzie
– Cook to normal target• Reduce lignin with O2
– Sodium hydroxide instead of oxidized white liquor
• Low AOX pulps– No production loss– No recovery bottleneck– 25% delignification

Recent Studies• Chakar, et al.
– Compared O systems
• O, OO, mini-O
– Split the caustic charge in a (E+O)D(E+O)
– Delignification • Lowest for mini-O
– 13-25%, depending on caustic addition
BS
NaOH: 1
.5%
NaOH:2.
5%
NaOH:3.
5%
OO
O(E+O)D((E+O)
(E+O)
0
5
10
15
20
25
30
Kap
pa #

Recent Studies• Chakar, et al.
– Viscosities• O vs. (E+O)D(E+O)
– Same delignification at 3.5% as O at 1.5%
• Improved viscosity
Low Kap
pa BS
L-1.5%
L-2.5%
L-3.5%
BS
OOO(E+O)D(E+O)
0
5
10
15
20
25
30
Vis
cosi
ty/c
P

Recent Studies• Chakar, et al
– Does not mimic actual bleach plant conditions
– Need to investigate impact of interstagewashing and carryover on mini-O system

(E+O)(E+O+P)
(E+O)D(E+O)* Delignification Results
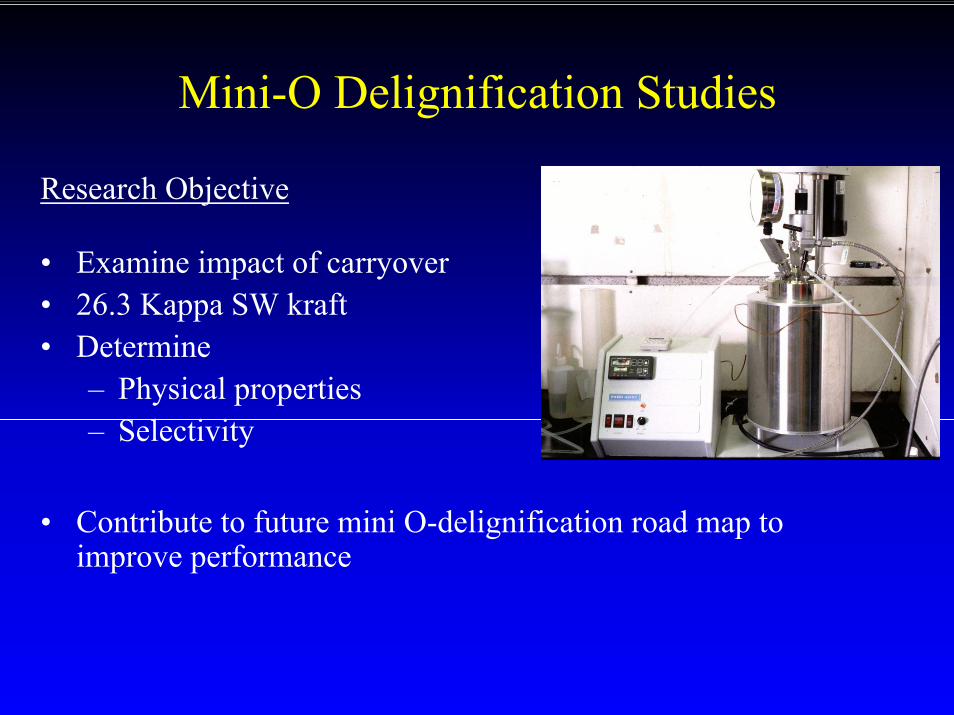
Mini-O Delignification Studies
Research Objective
• Examine impact of carryover• 26.3 Kappa SW kraft• Determine
– Physical properties– Selectivity
• Contribute to future mini O-delignification road map to improve performance

Mini-O Delignification: Experimental Design
Bleaching Sequences
• (E+O)(E+O)• D(E+O)• (E+O)D(E+O)• D(E+O)(E+O)
BL Carryover
• No carryover• 2 kg/ton• 10 kg/ton

Experimental Conditions
7080/70/801.25/0/1.2590/0/90(E+O)D(E+O)
3070--D0.05, 0.20
20801.2590(E+O)
Time/min.Temp./oC% NaOHO-Press./psiStage
10% consistency
MgSO4: 0.10%

Impact of Carryover
• Carryover decreases delignification
• Increased levels– Decreased
response
• Splitting (E+O)– Improved
response
D0.20(E
+O)(E+O)
(E+O
)D0.2
0(E+O)
D0.20(E
+O)
D0.05(E
+O)(E+O)
(E+O
)D0.0
5(E+O)
D0.05(E
+O)(E
+O)(E
+O)
10 kg/ton2 kg/ton
no carryover30
40
50
60
70
80
90
100
% D
elig
nific
atio
n
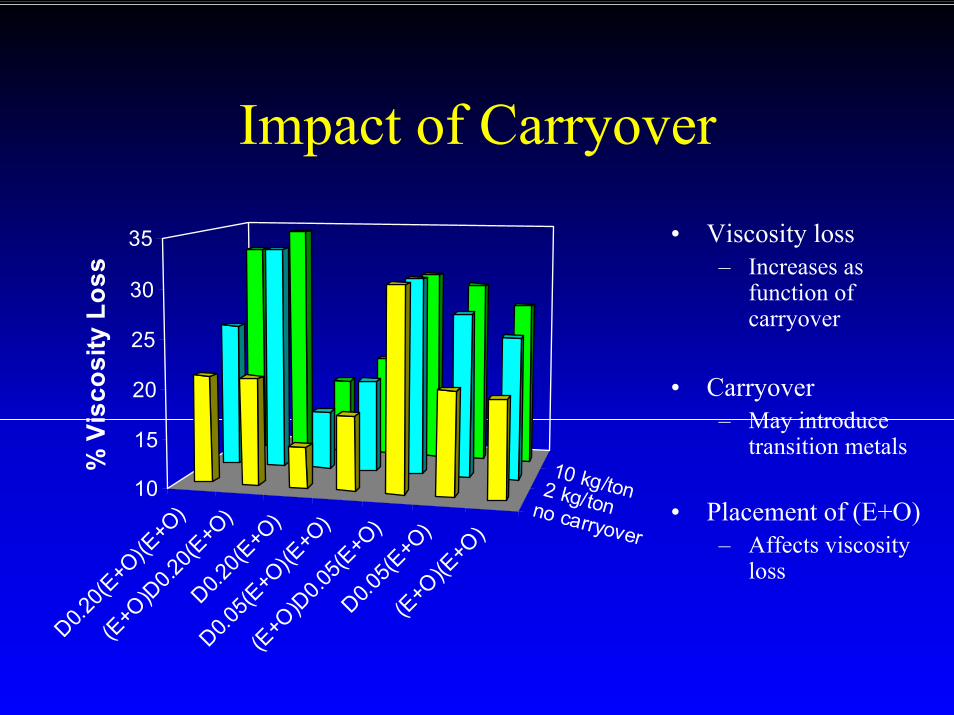
Impact of Carryover
• Viscosity loss– Increases as
function of carryover
• Carryover– May introduce
transition metals
• Placement of (E+O)– Affects viscosity
loss
D0.20(E
+O)(E
+O)
(E+O
)D0.2
0(E+O
)D0.2
0(E+O
)
D0.05(E
+O)(E
+O)
(E+O
)D0.0
5(E+O
)D0.0
5(E+O
)(E
+O)(E
+O)
no carryover
2 kg/ton
10 kg/ton10
15
20
25
30
35
% V
isco
sity
Los
s

Impact of Carryover
• Selectivity– Decreases as
function of carryover
• Carryover– May introduce
transition metals
• Placement of (E+O)– Affects
selectivity
D0.20(E+O
)(E+O
)
(E+O)D
0.20(E+O
)D0.20(E
+O)
D0.05(E+O
)(E+O
)
(E+O)D
0.05(E+O
)D0.05(E
+O)
(E+O)(E
+O)
10 kg/ton
2 kg/ton
no carryover0123456
Sele
ctiv
ity

Mini-O with H2O2 Studies
Research Objective
• Examine impact of carryover• Three SW kraft pulps
– 26.3 Kappa pre-O2
– 24.3 Kappa pre-O2
– 8.9 Kappa post-O2
• Determine – Physical properties– Selectivity
• Contribute to future mini O-delignification road map to minimize capital and enhance performance

Mini-O with H2O2 Delignification: Experimental Design
Bleaching Sequences
• O• D(E+O)• D(E+O+P)• (E+O)*D(E+O)*• D(E+O)*(E+O)*
Pulps
• Pre-Oxygen– 26.3 kappa
• Pre-Oxygen– 24.2 kappa
• Post-Oxygen– 8.9 kappa

Experimental Conditions
20801.2590(E+O+P)
7080/70/801.25/0/1.2590/0/90(E+O)*D(E+O)*
3070--D0.05, 0.20
20801.2590(E+O)
Time/min.Temp./oC% NaOHO-Press./psiStage
10% consistency BL carryover: 10 kg/ton
H2O2 : 0.5% MgSO4: 0.10%

Mini-O Reinforced with H2O2• Carryover at 10
kg/ton– Decreased
response
• Pre-O2 vs. Post-O2– Decreased
response in post-O2
• Delig. Response– Proportional to
H2O2
• (EO)*D0.05(EO)*
D0.20(E
OP)D0.2
0(EO)
(EOP)D
0.05(E
OP)
(EOP)D
0.05(E
O)
(EO)D
0.05(E
OP)
(EO)D
0.05(E
O)D0.0
5(EOP)
D0.05(E
O)
O
post-O2 w ith c/opre-O2 w ith c/opre-O2
20
30
40
50
60
70
80
90
100
% D
elig
nific
atio
n

Mini-O Reinforced with H2O2
• Carryover at 10 kg/ton– Generally
decreases viscosity loss
• Pre-O2 vs. Post-O2– Greater loss for
pre-O2 pulp
• Increased H2O2– Increased
viscosity loss
D0.20(E
OP)D0.2
0(EO)
(EOP)D
0.05(E
OP)
(EOP)D
0.05(E
O)
(EO)D
0.05(E
OP)
(EO)D
0.05(E
O)D0.0
5(EOP)
D0.05(E
O)
O
post-O2 w ith c/opre-O2 w ith c/o
pre-O25
10
15
20
25
30
35
% V
isco
sity
Los
s
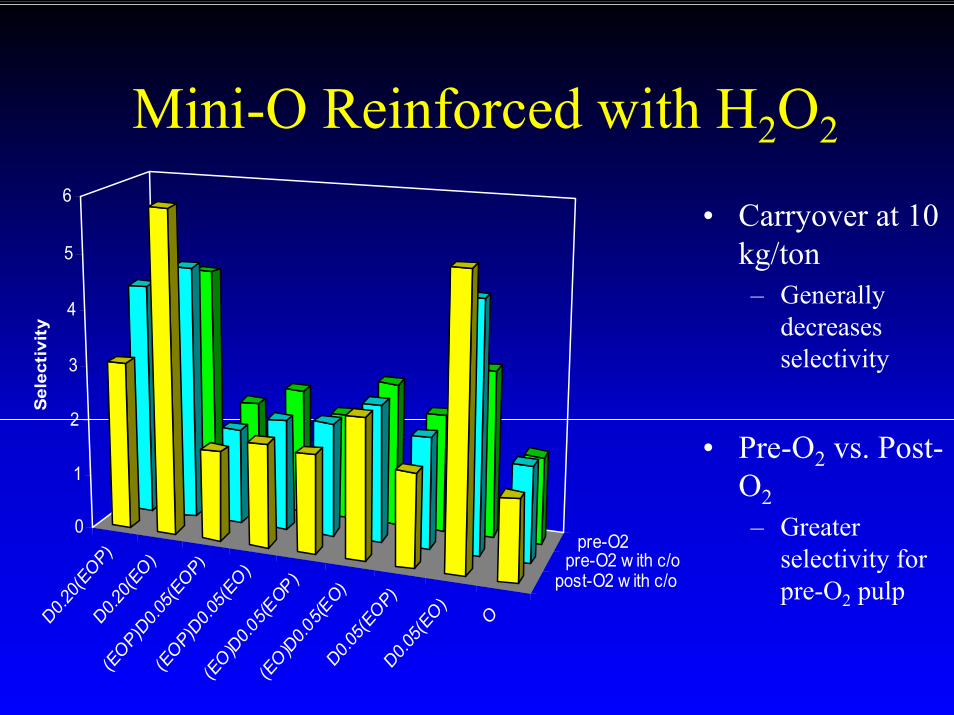
Mini-O Reinforced with H2O2
• Carryover at 10 kg/ton– Generally
decreases selectivity
• Pre-O2 vs. Post-O2– Greater
selectivity for pre-O2 pulp
D0.20(
EOP)D0.2
0(EO)
(EOP)D
0.05(E
OP)
(EOP)D
0.05(E
O)
(EO)D
0.05(E
OP)(E
O)D0.0
5(EO)
D0.05(E
OP)D0.0
5(EO)
O
post-O2 w ith c/opre-O2 w ith c/o
pre-O20
1
2
3
4
5
6
Sel
ecti
vity

Mini-O Reinforced with H2O2
• Carryover at 10 kg/ton– Generally
decreases brightness response
• (EO) vs. (EOP)– Exiting
bleaching stage
D0.20(E
OP)D0.2
0(EO)
(EOP)D
0.05(E
OP)
(EOP)D
0.05(E
O)
(EO)D
0.05(E
OP)
(EO)D
0.05(E
O)D0.0
5(EOP)
D0.05(E
O)
O
post-O2 w ith c/opre-O2 w ith c/o
pre-O20
20
40
60
80
100
120
140
160
180
% B
right
ness
Gai
n

Conclusions

Mini-O Delignification:Implications
• Superior performance with pre-O2 pulps when compared to post-O2pulps
• Benefits of enhanced poor man’s O
• H2O2 in last stage of (EO)*D(EO)*– Increased bleaching
performance
• Promising technology

IPST Member CompaniesU.S. Department of Energy
Cooperative Agreement DE-FC07-00ID13870


