European Journal of Food Science and Technology
Vol.5, No.4, pp.35-46, September 2017
___Published by European Centre for Research Training and Development UK (www.eajournals.org)
35 ISSN 2056-5798(Print), ISSN 2056-5801(online)
OPTIMIZATION OF SCREW PRESS EXTRACTION OF CITRILLUS LANATUS
SEED OIL AND PHYSICOCHEMICAL CHARACTERIZATION
Guédé, S. S.1,2, Soro, Y. R.1, Kouamé, A. F.2 and Brou, K.2
1Institut de Gestion Agropastoral, Université Peleforo Gon Coulibaly, BP 1328 Korhogo,
Côte d’Ivoire. 2Département des Sciences et Technologie des Aliments, Université Nangui Abrogoua, 02
BP 801 Abidjan 02, Côte d’Ivoire.
ABSTRACT: The aim of this study was to optimize the extraction of C. lanatus seed oil using
a screw press. Response surface methodology (RSM) was employed to describe the effects of
pressing temperature and restriction diameter on oil yield and residual oil content using a
Doehlert design. The seed oil extracted was characterized to determine its quality. Results
showed that the experimental data were adequately fitted into the second-order polynomial
model. The pressing temperature and restriction diameter had a significant effect on the screw
press performance. The optimum conditions within the experimental domain were the pressing
temperature of 92 °C and restriction diameter close to 4 mm. Under these conditions, the oil
yield was 38.79%. The colour of clarified oil was light yellow. Its physical and chemical
properties come up to the required standard for edible oil. Therefore, C. lanatus seed oil
extracted by screw press could have important applications in human nutrition.
KEYWORDS: Citrullus Lanatus, Seed Oil, Screw Press, Oil Yield, Optimization.
INTRODUCTION
Citrullus lanatus (Thunb.) Matsum. & Nakai is one of the most widespread and
commercialized oleaginous cucurbits in Côte d'Ivoire (Zoro Bi et al., 2006). C. lanatus
varieties, mainly grown for oilseeds, are generally found in West Africa (Guner and Wehner,
2004). They are mainly grown in savannah regions, in pre-forest regions, and are well adapted
to low input production systems. In West Africa, C. lanatus seeds are usually transformed into
a paste that is used only to make a sauce called "pistachio sauce" (Zoro Bi et al., 2006).
However, some studies suggested that C. lanatus seeds are rich in oil which contains a large
amount of linoleic acid, an essential fatty acid (Gbogouri et al., 2011; Olaofe et al., 2012; Raziq
et al., 2012). Therefore, the C. lanatus seed is a source of high quality edible oil.
This polyunsaturated oil has a high sensitivity to oxidation (Loukou et al., 2013). It therefore
requires special extraction conditions. The edible vegetable oil is conventionally extracted
using a mechanical press or chemical solvent. Although the solvent extraction gives high oil
yield, the oil is not free of solvent residues (Smassel, 2013). Moreover, the high temperature
level alters the polyunsaturated oil quality (Liauw, 2008). Faced with the challenge of food
safety, the mechanical pressing is a promising alternative to solvent extraction. The main
reason is that mechanical pressing, carried out at a relatively low temperature and without
solvent, contributes to preserving the oil quality (Soetaredjo et al., 2008; Uquiche et al., 2008).
Currently, the screw press is mainly used in oil mills, the use of hydraulic presses is limited to
a certain type of raw materials (cocoa, olives). For this reason, the screw press extraction was
chosen as a reference method.
European Journal of Food Science and Technology
Vol.5, No.4, pp.35-46, September 2017
___Published by European Centre for Research Training and Development UK (www.eajournals.org)
36 ISSN 2056-5798(Print), ISSN 2056-5801(online)
This mechanical pressing process must be optimized to increase the oil yield. According to
Ferchau (2000), the screw press performance can be affected by many factors including
pressing temperature and restriction diameter. According to Jacobsen and Backer (1986),
pressing efficiency is mainly defined by pressing capacity, oil flow, oil yield and/or residual
oil content in the oilcake. To optimize a process by locating the optimum set of experimental
conditions, then one must resort to designs for second-order models (response surface designs),
which employ more than two factor levels to allow fitting of a full quadratic polynomial. A
very useful experimental design for second-order models is the uniform shell design proposed
by Doehlert (1970). Doehlert designs are easily applied to optimize variables (Nechar et al.,
1995, Massart et al., 2003) and offer advantages in relation to central composite (Box and
Wilson, 1951) and Box-Behnken (Box and Benhken, 1960) designs. They need fewer
experiments, which are more efficient and can move through the experimental domain.
Multivariate designs, which allow the simultaneous study of several control variables, are faster
to implement and more cost-effective than traditional univariate approaches (Montgomery,
1997; Neto et al., 2001).
Ultimately, C. lanatus seed oil is of high quality, but it has a high sensitivity to oxidation. The
mechanical pressing can preserve the quality of this oil, but it often gives a low oil yield. So,
how to optimize this process to maximize his oil yield? To date, no research has been reported
on optimization of screw press extraction of C. lanatus seed oil. In this work, response surface
methodology (RSM) is applied to investigate the effects of pressing temperature and restriction
diameter on the residual oil content and C. lanatus seed oil yield using screw press extraction.
MATERIALS AND METHODS
Materials and Chemicals
C. lanatus seeds were collected in May 2015 from farmers in the Dikodougou department
(latitude 9°04'03.3"N, longitude 5°46'20.0"W) located in northern of Côte d'Ivoire. The seeds
were sorted, soaked in lukewarm water for 15 min and then dehulled manually. The kernels
were washed with tap water, dried in an oven (UFB 400, Memmert, Schwabach, Germany) at
60 °C for 2 h and then packed in black plastic bags. All chemicals and reagents used for this
work were of analytical grades.
Experimental Design
The two-factor Doehlert (1970) design was used to optimize screw press extraction of C.
lanatus seed oil. The independent variables selected were pressing temperature and restriction
diameter. Factor levels were defined on the basis of preliminary experimental results as
follows:
- pressing temperature: center point 60 °C, step of variation 20 °C;
- restriction diameter: center point 6 mm, step of variation 2 mm.
The coded and uncoded levels of the independent variables are listed in Table 1.
The number of experiments required (N) was given by N = k2 + k + 1, where k is the number
of variables. For two variables, seven (7) experiments were necessary. The experiments were
performed in duplicate in order to evaluate the experimental error. All experiments were carried
European Journal of Food Science and Technology
Vol.5, No.4, pp.35-46, September 2017
___Published by European Centre for Research Training and Development UK (www.eajournals.org)
37 ISSN 2056-5798(Print), ISSN 2056-5801(online)
out in randomized order to minimize the effect of unexplained variability in the observed
responses due to extraneous factors. Table 2 shows the order of execution, variables conditions
and observed responses.
Table 1. Variables and levels for the Doehlert design
Variable Symbol levels
Coded value Xi -1 -0.866 -0.5 0 +0.5 +0.866 +1 Pressing Temperature
(°C)
T 20 40 60 80 100
Restriction diameter
(mm)
D 4 6 8
Note. The black cells mean that there are no uncoded values corresponding to the coded values
for the variable.
Screw Press Extraction
The oil extraction was carried out using a Komet screw press (CA 59 G, IBG Monforts
Oekotec, Mönchengladbach, Germany) according to the method described by Ferchau (2000).
The pressing temperature was between 20 and 100 °C, which were reached by attaching an
electrical resistance-heating ring, coupled to a Störk-Tronic thermoregulator (Störk, Stuttgart,
Germany), around the press barrel. The minimum and maximum restriction diameter used were
4 and 8 mm, respectively. The screw speed was set at 20 rpm. For all tests, extraction was
carried out on kernels 500 ± 5 g. The extracted oils and residual oilcakes were suitably
packaged and stored in the refrigerator at 4 °C for further processing and analysis.
Determination of experimental responses
The experimental responses were oil yield (OY) and residual oil content (RO). The oil yield
was evaluated as the ratio of the weight of the extracted seed oil to the weight of the C. lanatus
oilseed introduced into the press. The residual oil content was determined on the oilcake
according to the AOCS (2009) method using a Soxhlet extractor (behrostest R104 T-SK, Behr
Labor-Technik, Düsseldorf, Germany). Oil yield and residual oil content were expressed as
percentage (g oil/100 g seed or oilcake).
Statistical Analysis of Data
Extraction experiments of C. lanatus seed oil were repeated twice. The mean values ± standard
deviations were reported for all observed responses. A second-order polynomial regression
model was used to express Y as a function of the independent variables as follows:
(1)
where Y represents the response variables, β0 is a constant, βi, βii and βij are the linear, quadratic
and interactive coefficients, respectively. Xi and Xj are the levels of the independent variables.
Statistica software version 7.1 (Statsoft, 2005) was used for multiple regression analysis,
analysis of variance (ANOVA), canonical analysis in the response surface regression (RSREG)
procedure. The analysis includes the Fisher’s test (overall model significance), its associated
probability P(F) and determination coefficient R2 which measures the fit goodness of
regression model. It also includes the t-value for the estimated coefficients and associated
probabilities. Response surface and contour plots were developed using the fitted quadratic
Y = β0+∑ β
iXi +∑ β
iiXi2 +∑∑ β
ijXiXj

European Journal of Food Science and Technology
Vol.5, No.4, pp.35-46, September 2017
___Published by European Centre for Research Training and Development UK (www.eajournals.org)
38 ISSN 2056-5798(Print), ISSN 2056-5801(online)
polynomial equation obtained from RSREG analysis. The test of statistical significance was
based on the total error criteria with a confidence level of 95.0%.
Oil Clarification and Amount of Matter in Crude Oil
The extracted oil was weighed, put into 50 ml tubes, and then centrifuged (Z 300 K, Hermle
Labortechnik, Wehingen, Germany) at 6,000 rpm and 25 °C for 15 min. The supernatant
clarified oil was carefully recovered and stored in the refrigerator at 4 °C for further
physicochemical analyzes. The precipitated solids were washed with n-hexane, dried and
weighed. Solid content was expressed as percentage (g solids/100 g extract (oil + solid)).
Physicochemical Analysis of Oil
The clarified oil was subjected to physicochemical characterization. The colour and state of the
oil at 25 °C were noted by visual inspection, while the specific gravity was determined by the
method of IUPAC (1979). The refractive index was determined at 25 °C using a refractometer
(AR200, Leica Microsystems, New York, USA). The viscosity was determined at 40 °C using
a viscosimetric tube (AFNOR, 1986). The acid, peroxide, iodine and saponification values
were determined according to the official method (AOAC, 1997). The unsaponifiable matter
content was determined following IUPAC (1979) protocol. The carotenoid and total phenol
contents were determined according to the colorimetric methods described by Zoué et al.
(2012) using a UV-Visible spectrophotometer (V-530, Jasco International, Tokyo, Japan).
Each oil sample was analyzed in triplicate. The mean values ± standard deviations were
reported for all results.
RESULTS AND DISCUSSION
Analysis of Experimental Results
The experimental responses and suspended solid contents obtained from all the experiments
are listed in Table 2.
Table 2. Experimental design, experimental responses and suspended solids content
Test Coded values Uncoded values Observed responses SS (%) X1 X2 T (°C) D (mm) OY (%) RO (%)
1 +1 0 100 6 35.07 ± 0.20 16.60 ± 0.18 8.33 ± 0.02
2 +0.5 +0.866 80 8 33.98 ± 0.03 17.60 ± 0.03 8.20 ± 0.01
3 -0.5 +0.866 40 8 29.62 ± 0.35 21.37 ± 0.29 8.14 ± 0.18
4 -1 0 20 6 24.16 ± 0.77 25.62 ± 0.57 9.73 ± 0.25
5 -0.5 -0.866 40 4 32.47 ± 0.44 18.94 ± 0.39 6.47 ± 0.10
6 +0.5 -0.866 80 4 38.27 ± 0.07 13.52 ± 0.07 6.53 ± 0.12
7 0 0 60 6 32.63 ± 0.17 18.80 ± 0.15 8.37 ± 0.32
Note. All tests were performed in duplicate and the mean values ± standard deviations are
reported. T: pressing temperature (°C); D: restriction diameter (mm); X1 and X2: coded values
of T and D, respectively; OY: oil yield (%); RO: residual oil content (%), SS: suspended solids
content (%).
European Journal of Food Science and Technology
Vol.5, No.4, pp.35-46, September 2017
___Published by European Centre for Research Training and Development UK (www.eajournals.org)
39 ISSN 2056-5798(Print), ISSN 2056-5801(online)
The oil yield varied between 24.16 ± 0.77% and 38.27 ± 0.07%. These values were significantly
better than those generally obtained by artisanal extraction, which rarely exceeds 3% of the
weight of the fruit (Charrouf, 2002). Indeed, the artisanal extraction, which consists in grinding
the seeds, mixing the paste obtained, with addition of water, and pressing it manually, causes
a lot of losses of matter. However, these oil yields were significantly lower than those of solvent
extraction, which is the most widely used method for extracting vegetable oils. In this
extraction method, the apolar organic solvent, which has a very high affinity with the oil,
removes almost all the oil contained in the matrix (Smassel, 2013).
Press extraction did not remove all the oil from the seeds. The residual oil content oscillated
between 13.52 ± 0.07% and 25.62 ± 0.57%. These values were lower than those recorded in
neem seed oilcakes (Azadirachta indica A.Juss [Meliaceae]), 27.8 and 28.7% (Nitièma-
Yefanova et al., 2012). These authors obtained the oilcake using a hydraulic press. This
difference in results could therefore be explained by the type of machine used, but also by the
type of seed and the operating conditions.
The crude oil was more or less brown, turbid, and contained suspended solids. The suspended
solid contents ranged from 6.47 ± 0.10% to 9.73 ± 0.25%. Charrouf (2002) presented similar
values (5% and 8%) for crude argan oil. This oil had also been extracted by a screw press of
German origin. These results revealed that the press used in this study gave a crude oil with
little suspended solid and easy to clarify. This press seems to be adequate for experimental
work in the laboratory.
Analysis of the Model
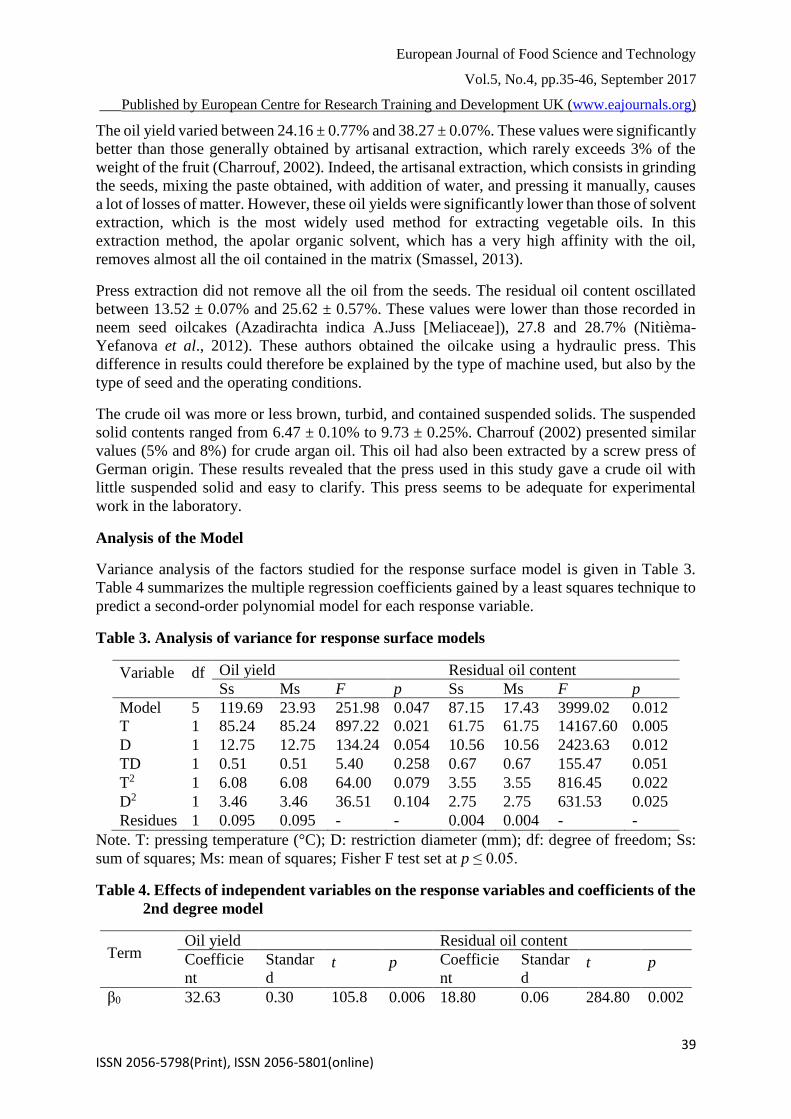
Variance analysis of the factors studied for the response surface model is given in Table 3.
Table 4 summarizes the multiple regression coefficients gained by a least squares technique to
predict a second-order polynomial model for each response variable.
Table 3. Analysis of variance for response surface models
Variable df Oil yield Residual oil content
Ss Ms F p Ss Ms F p
Model 5 119.69 23.93 251.98 0.047 87.15 17.43 3999.02 0.012
T 1 85.24 85.24 897.22 0.021 61.75 61.75 14167.60 0.005
D 1 12.75 12.75 134.24 0.054 10.56 10.56 2423.63 0.012
TD 1 0.51 0.51 5.40 0.258 0.67 0.67 155.47 0.051
T2 1 6.08 6.08 64.00 0.079 3.55 3.55 816.45 0.022
D2 1 3.46 3.46 36.51 0.104 2.75 2.75 631.53 0.025
Residues 1 0.095 0.095 - - 0.004 0.004 - -
Note. T: pressing temperature (°C); D: restriction diameter (mm); df: degree of freedom; Ss:
sum of squares; Ms: mean of squares; Fisher F test set at p ≤ 0.05.
Table 4. Effects of independent variables on the response variables and coefficients of the
2nd degree model
Term Oil yield Residual oil content
Coefficie
nt
Standar
d
deviati
on
t p Coefficie
nt
Standar
d
deviati
on
t p
β0 32.63 0.30 105.8
6
0.006 18.80 0.06 284.80 0.002
European Journal of Food Science and Technology
Vol.5, No.4, pp.35-46, September 2017
___Published by European Centre for Research Training and Development UK (www.eajournals.org)
40 ISSN 2056-5798(Print), ISSN 2056-5801(online)
T (β1) 5.33 0.17 29.95 0.021 -4.53 0.03 -
119.02
0.005
D (β2) -2.06 0.17 -11.58 0.054 1.87 0.03 49.23 0.012
T*D (β12) -0.82 0.35 -2.32 0.258 0.95 0.07 12.46 0.050
T2 (β11) -3.02 0.37 -8.00 0.079 2.31 0.08 28.57 0.022
D2 (β22) 2.28 0.37 6.04 0.104 -2.03 0.08 -25.13 0.025
R2 99.96 % 99.99 %
adjusted
R2
99.52 % 99.97 %
Note. T: pressing temperature; D: restriction diameter; OY: oil yield; RO: residual oil content;
R2: coefficient of determination; student t test set at p ≤ 0.05.
The statistical analysis showed that the regression models for the response variables were
significant (P <0.05). The pressing temperature had significant effect (P <0.05) on the oil yield
and residual oil content. The effect of restriction diameter was significant (P <0.05) only on
residual oil content.
For the oil yield, examination of these coefficients with the t-test indicated that linear term of
pressing temperature was the only significant term (P <0.05). For residual oil content, linear
and quadratic terms of pressing temperature and restriction diameter were significant (P <0.05).
Moreover, for the two response variables, interaction was not significant (P > 0.05) within the
experimental domain. Therefore, these results suggest that linear effect of the pressing
temperature may be the primary determining factor affecting the oil yield. However, the linear
and quadratic effects of the independent variables were the main factors affecting the residual
oil content.
For each response variable, the second-order polynomial equation in Eq. (1) can be written as
follows with coefficient:
(2)
(3)
where T and D represent the coded values of pressing temperature and restriction diameter,
respectively; OY and RO are the oil yield (%) and residual oil content (%), respectively. For
the good fit of a model, the coefficient of determination (R2) should be at least 80% (Guan and
Yao, 2008). In this case, the adjusted R2 were 99.52% and 99.97% for oil yield and residual oil
content, respectively. This means that the regression models for the response variables were
satisfactory, which adequately fits with the experimental results.
Analysis of the Stationary Point and Determination of the Optimum Conditions
To determine the nature of the stationary points, canonical analysis was performed on the
second-order polynomial models after calculation of the stationary points coordinates. The
stationary points coordinates, their corresponding experimental values and the canonical
equations coefficients are presented in Table 5.
OY = 32.63 + 5.33 × T − 2.06 × D − 0.82 × T × D − 3.02 × T2 + 2.28 × D2
RO = 18.80 − 4.53 × T + 1.87 × D + 0.95 × T × D + 2.31 × T2 − 2.03 × D2

European Journal of Food Science and Technology
Vol.5, No.4, pp.35-46, September 2017
___Published by European Centre for Research Training and Development UK (www.eajournals.org)
41 ISSN 2056-5798(Print), ISSN 2056-5801(online)
Table 5. Results of the canonical analysis
Stationary points Corresponding values Coefficients obtained
Coordinate OY RO Factor OY RO OY RO
Xs1 0.80 0.84 T (°C) 92.03 93.85 λ1 9.25 2.36
Xs2 0.59 0.66 D (mm) 7.38 7.52 λ2 -12.21 -2.08
Ds 0.99 1.07 Responses 34.15 17.50
Note. Ds: distance from the stationary point to the center of the domain; Xs1 and Xs2:
coordinates of the stationary point; T: pressing temperature; D: restriction diameter; OY: oil
yield; RO: residual oil content; λ1 and λ2: coefficients of the canonical equation.
The coded coordinate of the stationary point was (0.8, 0.59) for the oil yield and (0.84; 0.66)
for the residual oil content. It was converted to non-coded coordinate (92.03, 7.38) for the oil
yield and (93.85; 7.52) for the residual oil content. At the stationary point, the predicted values
of oil yield and residual oil were 34.15% and 17.50%, respectively. Results showed that all the
stationary points were within the experimental domain because their distances to the domain
center were all less than or equal to 1. The canonical forms of the equations demonstrating the
nature of the response surfaces were:
(4)
(5)
where YOY and YRO represent canonical equations of oil yield and residual oil content,
respectively; ω1 and ω2 are the axes of the response surface. The algebraic signs of the canonical
equations coefficients are opposite; the stationary points are, in fact, saddle points. A saddle
point is defined as the stationary point of a response surface which presents the maximum
response for the levels of some variables and simultaneously the minimum response for the
levels of other variables of the analytical system studied (Ferreira et al., 2004).
A three-dimensional response surface graph and a two-dimensional contour plot were
generated for each response variable using the linear, quadratic and interaction terms in the
second order polynomial model. The use of response surface graph and contour plot made
possible to visualize and determine the optimum conditions of the screw press extraction. It
was possible to follow the evolution of the independent variables and their influence on the
response variables.
YOY = 34.15 + 9.25 × ω12 − 12.21 × ω2
2
YRO = 17.50 + 2.36 × ω12 − 2.08 × ω2
2
European Journal of Food Science and Technology
Vol.5, No.4, pp.35-46, September 2017
___Published by European Centre for Research Training and Development UK (www.eajournals.org)
42 ISSN 2056-5798(Print), ISSN 2056-5801(online)
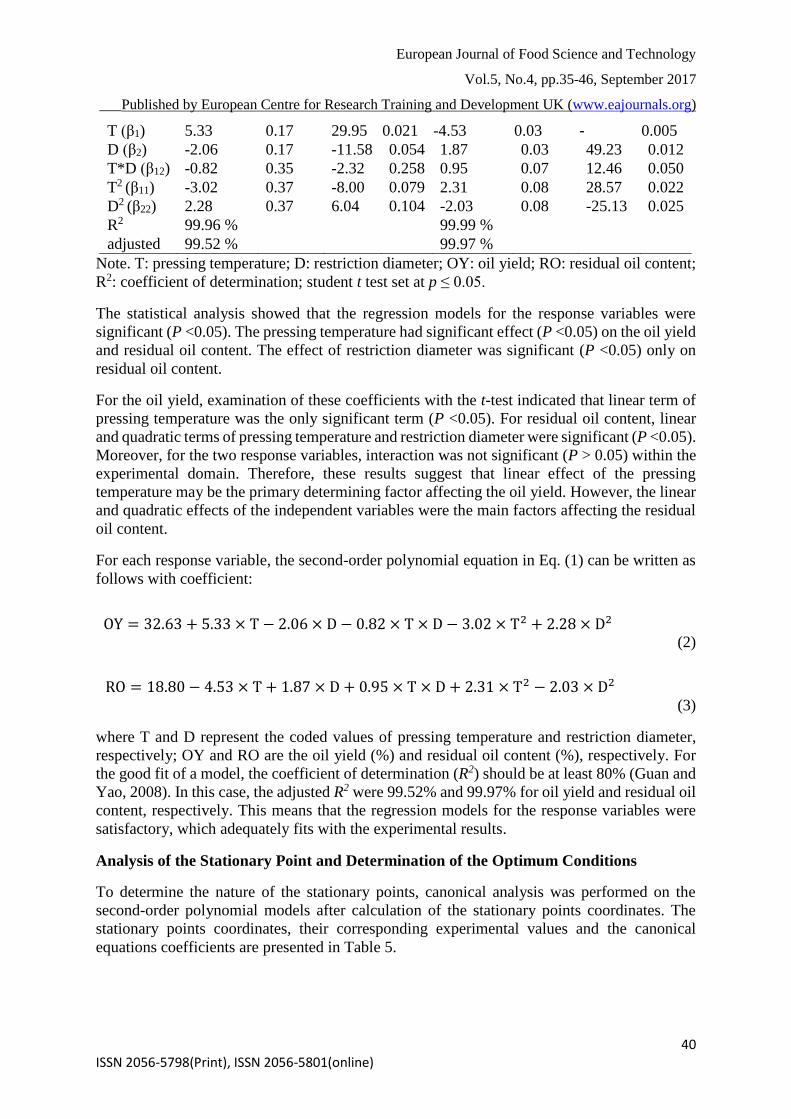
Fig. 1. Response surface and contour plots for the effect of pressing temperature and
restriction diameter on the oil yield.
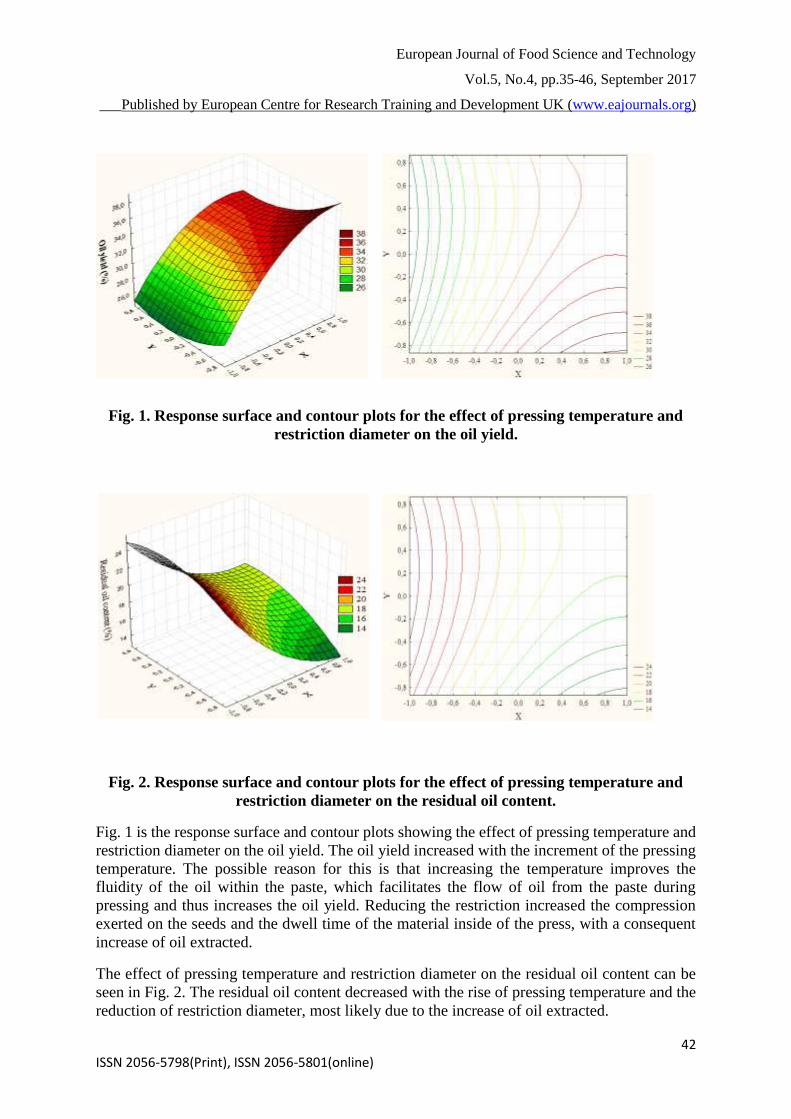
Fig. 2. Response surface and contour plots for the effect of pressing temperature and
restriction diameter on the residual oil content.
Fig. 1 is the response surface and contour plots showing the effect of pressing temperature and
restriction diameter on the oil yield. The oil yield increased with the increment of the pressing
temperature. The possible reason for this is that increasing the temperature improves the
fluidity of the oil within the paste, which facilitates the flow of oil from the paste during
pressing and thus increases the oil yield. Reducing the restriction increased the compression
exerted on the seeds and the dwell time of the material inside of the press, with a consequent
increase of oil extracted.
The effect of pressing temperature and restriction diameter on the residual oil content can be
seen in Fig. 2. The residual oil content decreased with the rise of pressing temperature and the
reduction of restriction diameter, most likely due to the increase of oil extracted.
European Journal of Food Science and Technology
Vol.5, No.4, pp.35-46, September 2017
___Published by European Centre for Research Training and Development UK (www.eajournals.org)
43 ISSN 2056-5798(Print), ISSN 2056-5801(online)
The screw press extraction conditions would be considered optimum if the oil yield reached
maximum values. The canonical analysis showed that the stationary point of the response
surface relative to the oil yield is a saddle point. In this case, the stationary point is not the
optimum point. Then, optimization was carried out by visualizing the contour plots for the oil
yield (Fig. 1). The optimum point represents the combination of extraction parameters that
would give the maximum oil yield. According to these plots, the coded coordinate of maximum
point for the oil yield was (0.8, -0.83) and corresponded to the uncoded coordinate (92 °C, 4.0
mm) according to the transforming equation of coded value. At the optimum point, the
maximum predicted value of the oil yield was 38.79%. That is to say, when pressing
temperature was 92 °C and restriction diameter was 4.0 mm, the predicted value of oil yield
reached maximum value 38.79%. These results are distinctly different from those of Martínez
et al. (2012) who studied the optimization of the chia seeds pressing (Salvia hispanica L.) using
the same type of press. This difference in results would be due to the type of seed material,
type of experimental design used or the parameters taken into account.
Physical and chemical properties of oil extracted by screw press
Table 6. Physical and chemical properties of C. lanatus seed oil extracted under
conditions of optimum point.
Parameters Mean values
Physical properties
Colour/State à 25 °C Light
yellow/Liquid Refractive index at 25 °C 1.47 ± 0.00
Specific gravity at 25 °C 0.92 ± 0.01
Viscosity at 40 °C (mPas) 53.63 ± 0.16
Chemical properties
Acid value (mg KOH/g oil) 1.10 ± 0.08
Saponification value (mg KOH/g
oil)
198.46 ± 0.95
Iodine value (g I2/100 g) 123.38 ± 1.38
Peroxide value (meq O2/Kg oil) 0.60 ± 0.01
Total phenol (mg/100 g oil) 6.66 ± 0.30
Unsaponifiable matter (%) 0.80 ± 0.01
Carotenoid (mg/100 g oil) 94.61 ± 5.57
Note. All tests were performed in triplicate and the mean values ± standard deviations are
reported.
Physical and chemical properties of the C. lanatus seed oil extracted under conditions of
optimum point are shown in Table 6. At 25 °C, the C. lanatus seed oil was liquid, light yellow
in colour with refractive index of 1.47 ± 00. Observations on the colour and the refractive index
of the oil agreed with previous published report for seed oil extracted using hexane (N’guetta
et al., 2015). The specific gravity was 0.92 ± 0.01 and the viscosity, which is a measure of the
resistance of oil to shear, was 53.63 ± 0.16 mPas. These values are within the range earlier
reported for most conventional oilseeds (Codex Alimentarius, 1999).
The low acid value (1.10 ± 0.08 mg KOH/g oil) showed that C. lanatus seed oil is not only
edible but could also have a good resistance to hydrolysis. A high saponification value of
198.46 ± 0.95 (mg KOH/g oil) was obtained for the oil, indicating high concentration of
triglycerides. The iodine value was high (123.38 ± 1.38 g I2/100 g oil), which showed the oil

European Journal of Food Science and Technology
Vol.5, No.4, pp.35-46, September 2017
___Published by European Centre for Research Training and Development UK (www.eajournals.org)
44 ISSN 2056-5798(Print), ISSN 2056-5801(online)
contained a substantial level of unsaturation. The peroxide value was 0.60 ± 0.01 meq O2/Kg
oil. The value is lower relatively because oxidization could be avoided during the process of
screw press extraction. The combination of high iodine value and low peroxide value indicated
the C. lanatus seed oil could be stored for a long period without deterioration. These also
demonstrated the oil possessed the desirable qualities of edible oils. The total phenol content
was 6.66 ± 0.30 mg/100 g oil. The C. lanatus seed oil is a less important source of phenols than
olive oil with a mean content of 20 mg/100 g oil (Gunstone, 2002). However, this compound
with an antioxidant value was more abundant in C. lanatus seed oil than in pumpkin seed oil
(3.9 ± 2.6 mg/100 g oil) (Andjelkovic et al., 2010). The unsaponifiable content was 0.80 ±
0.01%. This value was higher than those reported for other edible oils such as cotton (0.52%),
peanut (0.33%) and palm kernel (0.22%) oils (Kapseu and Parmentier, 1997). This lipid
fraction is a good source of minor compounds with bio-functional properties. The carotenoid
content was 94.61 ± 5.57 mg/100 g oil. Carotenoids are substances of the unsaponifiable
fraction with antioxidant properties. From the above results, the C. lanatus seed oil extracted
using screw press can be used as edible oil and as an industrial feedstock.
CONCLUSION
Results showed that the second-order polynomial model is sufficient to describe and predict
the response variables of oil yield and residual oil content using the pressing temperature and
the restriction diameter as independent variables. The linear term of the pressing temperature
greatly affects the oil yield. The linear and quadratic terms of the pressing temperature and the
restriction diameter have a significant effect on the residual oil content. However, the
interaction is not significant within the experimental domain. The method of graphic
optimization, adopted to find the best extraction condition, predicts that the optimum extraction
parameters within the experimental domain are: pressing temperature of 92 ° C and restriction
diameter of 4 mm. Under such conditions, the oil yield is 38.79%. The colour of the C. lanatus
seed oil extracted by screw press is light yellow. Its physical and chemical properties come up
to the required standard for edible oil. Therefore, this seed oil would have a good prospect of
upgrading in human food.
REFERENCES
AFNOR (1986) The French standards collection, fats, oleaginous seeds and by-products, In
Agence Française de Normalisation, 4th edition, Paris.
Andjelkovic, M., Camp, J. V., Trawka, A. and Verhe, R. (2010) Phenolic compounds and some
quality parameters of pumpkin seed oil, European Journal of Lipid Science and
Technology, 112, 208-217.
AOAC (1997) Official methods of analysis, In Association of Official Analytical Chemists, 15th
edition, Washington D.C.
AOCS (2009) Methods and recommended practices of the American Oil Chemist’s Society,
USA.
Box, G. E. P. and Benhken, D. W. (1960) Some New Three Level Designs for the Study of
Quantitative Variables, Technometrics, 2(4), 455-475.
Box, J. and Wilson, W. (1951) Central composites design, Journal of the Royal Statistics
society, 13(1), 1-35.

European Journal of Food Science and Technology
Vol.5, No.4, pp.35-46, September 2017
___Published by European Centre for Research Training and Development UK (www.eajournals.org)
45 ISSN 2056-5798(Print), ISSN 2056-5801(online)
Charrouf, Z. (2002) Valorisation de l’arganier : Résultats et perspectives, In Actes du 5e
Colloque Produits naturels d’origine végétale (Québec 7-9 août 2001), Collin G. &
Garneau F.-X., Chicoutimi, Québec, pp. 261-270.
Codex Alimentarius (1999) Codex Alimentarius Standards for Fats and Oils from Vegetable
Sources, Section2, Codex Alimentarius Standards for Named Vegetable oils, Codex
Alimentarius – Stan 210.
Doehlert, D. H. (1970) Uniform Shell design, Applied Statistics, 19, 231-239.
Ferchau, E. (2000) Equipment for decentralised cold pressing of oilseeds. Retrieved from
http://www.folkecenter.net/mediafiles/folkecenter/pdf/dk/efdcpos_ef.pdf
Ferreira, C. L. S., dos Santos, L. N. W., Quintella, M. C., Neto, B. B. and Bosque-Sendra, M.
J. (2004) Doehlert matrix: a chemometric tool for analytical chemistry—review, Talanta,
63, 1061-1067.
Gbogouri, G. A., Brou, K., Linder, M., Tehrany, E. A., Gnakri, D. and Zoro Bi, I. A. (2011)
Comparative study of physicochemical and thermal properties of the seed oils of three
cucurbit species, International Journal of Biological and Chemical Sciences, 5(3), 1165-
1177.
Guan, X. and Yao, H. (2008) Optimization of viscozyme l-assisted extraction of oat bran protein
using response surface methodology, Food Chemistry, 106(1), 345-51.
Guner, N. and Wehner, T. C. (2004) The genes of watermelon, HortScience, 39(6), 1175-1182.
Gunstone, D. F. (2002) Vegetable oils in food technology: composition, properties and uses.
Blackwell Ed, London, p. 337.
IUPAC (1979) Standard methods for the analysis of oils, fats and derivatives, In International
Union of Pure and Applied Chemistry, 6th edition, Pergamon, Oxford.
Jacobsen, L. A. and Backer, L. F. (1986) Recovery of sunflower oil with a small screw expeller,
Energy in Agriculture, 5, 199-209.
Kapseu, C. and Parmentier, M. (1997) Fatty acid composition of some vegetable oils from
Cameroon, Sciences des Aliments, 17, 325-331.
Liauw, M. Y., Natan, F. A., Widiyanti, P., Ikasari, D., Indraswati, N. and Soetaredjo, F. E. (2008)
Extraction of neem oil (Azadirachta indica A. Juss) using n-hexane and ethanol: studies
of oil quality, kinetic and thermodynamic, ARPN Journal of Engineering and Applied
Sciences, 3(3), 49-54.
Loukou, A. L., Lognay, G., Baudoin, J.-P., Kouame, L. P. and Zoro Bi, I. A. (2013) Effects of
fruit maturity on oxidative stability of lagenaria siceraria (Molina) standl. Seed oil
extracted with hexane, Journal of Food Biochemistry, 37(4), 475-484.
Martínez, L. M., Marín, A. M., Faller, S. M. C., Revol, J., Penci, C. M. and Ribotta, D. P. (2012)
Chia (Salvia hispanica L.) oil extraction: Study of processing parameters, LWT – Food
Science and Technology, 47, 78-82.
Massart, D. L., Vandeginste, B. G. M., Buydens, L. M. C., de Jong, S., Lewi, P. J. and Smeyers-
Verbeke, J. (2003) Handbook of Chemometrics and Qualimetrics, Part A, Elsevier,
Amsterdam.
Montgomery, D. C. (1997) The 2k factorial design, In Design and analysis of experiments, 4th
edition. (Ed., Montgomery, D. C.) John Wiley and Sons, Inc., New York, USA, pp. 290-
353.
N’guetta, N. A. M., Digbeu, D. Y., Binaté, S., Kouadio, N E. J. P., Dabonné, S. and Dué, A. E.
(2015) Fatty Acid Composition and Physicochemical Properties of Four Varieties of
Citrullus lanatus Seed Oils Cultivated in Côte d’Ivoire, British Biotechnology Journal,
5(3), 140-147.
Nechar, M., Molina, M. F., Cuadros Rodriguez, L. and Bosque-Sendra, J. M. (1995) The
application of Doehlert designs in the optimization of experimental variables in solid
European Journal of Food Science and Technology
Vol.5, No.4, pp.35-46, September 2017
___Published by European Centre for Research Training and Development UK (www.eajournals.org)
46 ISSN 2056-5798(Print), ISSN 2056-5801(online)
phase spectrophotometry, Analytica Chimica Acta, 316(2), 185-193.
Neto, B. B., Scarminio, I. S. and Bruns, R. E. (2001) Como Fazer Experimentos: Pesquisa e
Desenvolvimento na Ciência e na Indústria, Editora da Unicamp, S. Paulo, Brasil, p. 83.
Nitièma-Yefanova, S., Son, G., Yé, S., Nébié, C. H. R. and Bonzi-Coulibaly, Y. (2012)
Optimisation des paramètres d’extraction à froid de l’huile d’Azadirachta indica A. Juss
et effets sur quelques caractéristiques chimiques de l’huile extraite, Biotechnologie,
Agronomie, Société et Environnement, 16(4), 423-428.
Olaofe, O., Ogungbenle, H. N., Akhadelor, B. E., Idris, A. O., Omojola, O. V., Omotehinse, O.
T. and Ogunbodede, O. A. (2012) Physicochemical and fatty acids composition of oils
from some legume seeds, International Journal of Biology, Pharmacy and Allied Sciences,
1(3), 355-363.
Raziq, S., Anwar, F., Mahmood, Z., Shahid, A. S. and Nadeem, R. (2012) Characterization of
seed oils from different varieties of watermelon [Citrullus lanatus (Thunb.)] from
Pakistan, Grasas y aceites, 63(4), 365-372.
Smassel, A. (2013) Mise en valeur des huiles de tournesol. Master en Sciences et Techniques,
Université Kasdi-Marbah Ouargla, Ouargla, Algérie, p. 67.
Soetaredjo, F. E., Budijanto, G. M., Prasetyo, R. I. and Indraswati, N. (2008) Effects of pre-
treatment condition on the yield and quality of neem oil obtained by mechanical pressing,
ARPN Journal of Engineering and Applied Sciences, 3(5), 45-49.
StatSoft (2005). Statistica for Windows [7.1]. Computer Program. Tulsa, OK, (USA): StatSoft,
Inc.
Uquiche, E., Jeréz, M. and Ortiz, J. (2008) Effect of pre-treatment with microwaves on
mechanical extraction yield and quality of vegetable oil from Chilean hazelnuts (Gevuina
avellana Mol), Innovative Food Science and Emerging Technologies, 9(4), 495-500.
Zoro Bi, I. A., Koffi, K. K., Djè, Y., Malice, M. and Baudoin, J.-P. (2006) Indigenous Cucurbits
of Côte d’Ivoire: a Review of their Genetic Resources, Sciences & Nature, 3(1), 1-9.
Zoué, T. L., Bédikou, E. M., Gonnety, T. J., Faulet, M. B. and Niamké, L. S. (2012) Two Novel
Non-Conventional Seed Oil Extracts with Antioxidant and Antimicrobial Activities,
Tropical Journal of Pharmaceutical Research, 13(3), 469-475.


