
Online Voltage Optimization of the PowerDistribution System
Hasala Dharmawardena, Student Member, IEEE ∗Ganesh K. Venayagamoorthy, Senior Member, IEEE ∗ †
∗Real-Time Power and Intelligent System Laboratory
Clemson University, South Carolina, USA†School of Engineering, University of KwaZulu-Natal, Durban, South Africa
[email protected] and [email protected]
Abstract—The power distribution is facing increasing voltagecontrol problems due to the increasing penetration of intermittentdistributed energy sources. This study describes a method forvoltage optimization of a power distribution system that facesthis challenge. The study depends on the digital twin conceptto create a continually updated optimizer that uses the currentload measurements to provide optimum reactive power injectionset points to the smart inverters operating on the active nodes.This method can be applied to control a distribution system inan unknown and dynamic environment. The results for a basicnetwork show that system voltage can be significantly optimizedby using the proposed method.
Index Terms—Neural Networks, Optimization Voltage Control,Particle Swarm Optimization, Power Distribution System.
I. INTRODUCTION
The amount of Distributed Energy Resources (DERs) con-
nected to the distribution system are expected to rise at
a increasing rate [1] resulting in increasing level of fast
voltage fluctuations. Unfortunately, the underlying distribution
infrastructure is not expected to change at a pace fast enough
to cope with this increase in generation, and help from the
base infrastructure to counter the expected power quality
degradation is expected to be minimal.
Both current experiences as well as the results from simu-
lations for future scenarios [2] show that a significant amount
of DERs will have to be curtailed if the system is operated
using the current state of the art technology, which is defined
in IEEE 1547 standard [3].
Even a small distribution grid of a few MVA capacity can
have hundreds of nodes with fast varying loads. Additionally,
if the DERs are Photovoltaics (PV) based, then there will be
significant changes in the system loading occurring in a second
time scale. Due to the large number of nodes and the fast
paced changes it is practically impossible to apply traditional
static optimization techniques to control the voltage of the
power distribution system. On the other hand, the local volt
var control (VVC), which is the state of the art, cannot provide
This study is supported by the National Science Foundation (NSF) of theUnited States, under grants IIP #1312260, #1408141 and #1638321, and theDuke Energy Distinguished Professorship Endowment Fund. Any opinions,findings and conclusions or recommendations expressed in this material arethose of author(s) and do not necessarily reflect the views of National ScienceFoundation and Duke Energy.
control over the system. In some scenarios VVC could even
cause degradation of the system voltage.
Whereas the voltage could potentially degrade with increas-
ing penetration of DER, the voltage quality required to reliably
operate the loads are increasing, as a result of the increasing
penetration of power electronics in the demand side. Therefore,
decreasing voltage quality in the distribution system can have
severe ramifications.
It is crucial to find a solution that can modulate the
voltage to achieve a high voltage quality in a system which
has increasing DER penetration [4], [5], [6], [7]. There are
solutions presented in literature that solve this problem both in
centralized as well as distributed fashion. However, the models
used for the analysis are balanced, decoupled and linearized
models, that do not reflect the unbalanced and fast changing
nature of the distribution system.
The method presented in this paper is data-driven, which
means that a physics based model is not required. Additionally,
it has online optimization capability that helps to operate
the same voltage controls even when the system undergoes
significant structural changes. Therefore, it provides a robust
and efficient framework to solve the voltage control problem
in the distribution grid.
II. STATE OF THE ART
The current state of the art of voltage control in the
distribution grid is detailed in the IEEE 1547 standard. It
is a local voltage control method [8] where the reactive
power injection is used to control the local voltage to a given
bandwidth of control provided to the controller (as a Q-V
curve as shown in Fig. 1). Field performance has shown
that this is a very effective method when there is significant
impedance between the two active nodes. It is also more
reliable since it does not rely on external controllers or depend
on communication channels. However, the future distribution
grid is bound to have an abundance of local generation in
nodes that are electrically close to each other. Additionally, it
was proven in [9] that this method is not the optimum solution.
According to [9], for optimum voltage control, communication
is a necessary requirement.
In the bulk grid voltage control is carried in real time by
leveraging the inherent reactive power control capabilities of
Authorized licensed use limited to: CLEMSON UNIVERSITY. Downloaded on December 30,2020 at 21:31:18 UTC from IEEE Xplore. Restrictions apply.

the PV buses. The voltage compliance and system security is
ensured by carrying out feed forward optimization based on
forecasted system load and generation. However, due to the
large number of nodes associated with the distribution grid,
coupled with the difficulty to forecast distribution system loads
at scale makes this approach infeasible to be applied to the
distribution system.
The other option for voltage control is to use commu-
nication. Many research studies in the past have looked at
this problem and used communication to improve voltage
control in the distribution system [9], [10]. However, most
of these studies use models that are balanced and use a
decoupled linearized power flow approach. Physics based
models require three phase unbalanced modeling supported
by many parameters that are not realistic to be approximated
or calculated. Therefore, using a physics based model and
applying traditional optimization techniques is not a practical
solution to the voltage control in the distribution grid. This is
the reason as to why we propose a data driven optimization
and control technique for voltage control in the distribution
grid.
0.5 1 1.5Voltage (pu)
-1.5
-1
-0.5
0
0.5
1
1.5
Avai
labl
e re
activ
e po
wer
(pu)
X: 0.95Y: 1
X: 1.05Y: -1
Capacitive operation
Inductive operation
Fig. 1. State of the art for local voltage control [11].
III. PROBLEM STATEMENT
Consider the below system g that models the power flow
manifold, M, in the power distribution system.
x(k) = g(x(k), y(k), u(k)) (1)
Where, x is the state vector described by (2), y is the
independent variable vector described by (3), n is the number
of nodes, and u is the control vector described by (4).
x :=
[|V |δ
]∈ R
2n (2)
y :=
[P
Q
]∈ R
2n (3)
u :=[QInverter
]∈ R
m (4)
The function to be optimized, the utility function, U , is the
sum of mean squared voltages of the system nodes and is
shown below in (5).
U(x) =n∑
i=1
0.5(|Vi| − |V0|)2 (5)
The objective is to find the reactive power injections, u,
such that U is minimized under the constraints C.
minimizex∈M
U
subject to x ∈ C(6)
We assume that the future distribution grid is populated by
either actual or virtual passive nodes that have a reasonable
internet connection (10Mbps), a voltage and load measurement
that can measure and transmit voltage and load measurements
at at least 1 Hz (could be a Micro PMU [12]). A typical
distribution node can include a combination of storage, re-
active power loads, active power loads and generation. The
most common generation source is Photovoltaics (PV). As
shown in [13] PV response time is, at maximum 100 ms and if
we estimate another 100 ms for measurement, communication
and computation, then the total time lag from measurement to
actuation is in the range of 200 ms. This is very fast when
compared to the fastest process in the distribution system,
which is the change in PV generation. All these assumptions
are reasonable for a residential neighborhood. An example
active node, H1, that shows the component level structure is
given in Fig. 2.
Fig. 2. A complete active node of the system.
IV. METHODOLOGY
In this section the proposed method for voltage control with
its constraints and requirements are explained in detail. In this
preliminary stage an OpenDSS [14] model of a system is used
to represent the actual system. Therefore, data captured by the
Authorized licensed use limited to: CLEMSON UNIVERSITY. Downloaded on December 30,2020 at 21:31:18 UTC from IEEE Xplore. Restrictions apply.

simulator is assumed to be an accurate representation of the
response and performance of the system in real world.
A. Voltage Control FrameworkThe proposed framework shown in Fig. 3 consists of two
main components, a digital twin of the system and an op-
timizer. The digital twin uses a feedforward neural network
(Multi Layer Perceptron (MLP)) as its computational engine.
Data captured from the measuring systems encompassing a
reasonable period of time is used to tune the digital twin. A
tuned twin can accurately estimate the system voltages based
on the power injections from across the distribution system.
Based on infrastructure limitations as well as regulatory limi-
tations, application of this type of method could be constrained
to a limited area; for example, a neighborhood of around 100
houses is a reasonable and realistic scenario. Note that the
presented framework uses the resources that already exist in
the active nodes to operate optimally across the distribution
network.
Fig. 3. The proposed framework for voltage control.
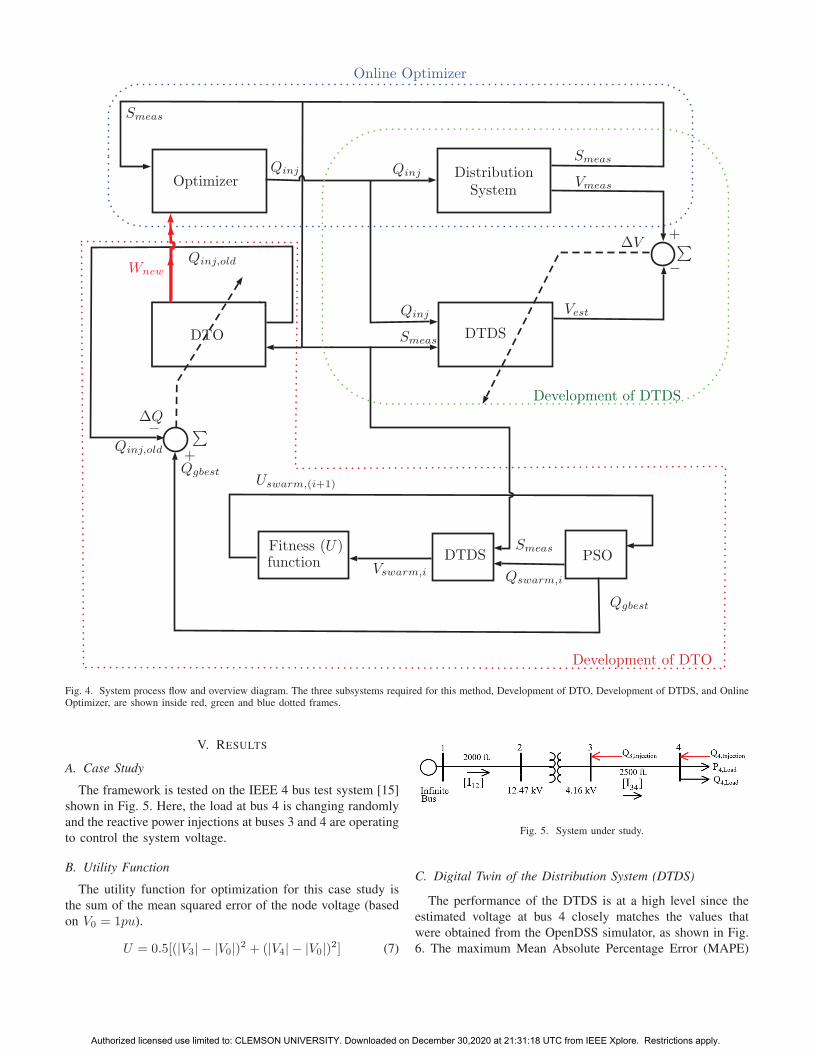
B. Development of Digital Twin of the Distribution SystemThe development of digital twin of the distribution system
(DTDS) is shown in Fig. 4. It uses the gathered data from the
measurements over a time period of minimum 24 hours to train
the neural network. The digital twin estimates node voltages,
Vest, based on load measurements at each node, Smeas, and
reactive power injection, Qinj by the smart inverters at the
n active nodes in the system. The DTDS is tuned to ensure
that the difference between estimated and measured voltages
(ΔV ) is minimized. When the DTDS is tuned the algorithm
leads to a new tuning cycle of the optimizer.1) Tuning: When implementing in a real system the digital
twin will be created based on historical data captured from
the measurement system. However, since we use a simulator
of the distribution system to generate the data, we initialize
and train the digital twin by applying random values for the
independent variables, within the given upper and lower limits
and use that to generate a dataset that emulates the system
response. This dataset is then used to train the digital twin.
The final output of the trained model estimator is shown in
Fig. 4. Here S¯= P +Qj and V
¯= |V |∠δ. This is a 3×36×6
MLP network that has 3 inputs, 6 outputs and 36 neurons in
the hidden layer.
C. Voltage Control in Operation
The normal operation, which is an online optimization is
shown in the Online Optimizer block in Fig. 4. The optimizer
uses the measured power of the system nodes to generate
reactive power injection values at active nodes.
D. Re-tuning Online Optimizer
When the voltage estimate by the digital twin of the system
shows significant deviation from the measured voltage, the
optimization system is re-trained based on the process flow
shown in the Development of DTDS block in Fig. 4. This
necessitates retraining of the optimizer shown in the Develop-
ment of DTO block of Fig. 4.
In this process Particle Swarm Optimization (PSO) algo-
rithm generates a swarm of possible optimum reactive power
injections, Qswarm,i, which is moved through the solution
space iterating till convergence. For each iteration, PSO gen-
erates a better swarm of solutions ,Qswarm,i. The measured
apparent power and Qswarm,i is used to find the swarm of
system voltage vectors, Vswarm,i. This is used by the Fitness
function (U ) to evaluate the fitness of the swarm. The swarm of
fitness values are then used by the PSO algorithm to generate
a new set of solutions.
In the next stage the Qinj is compared against Qbest and
the resulting different ΔQ is used to update the weights of
the digital twin of the optimizer (DTO). The DTO uses Smeas
and Qinj to tune its weights. The Optimizer is then updated
by replacing its existing weights with the new tuned weights,
Wnew. This brings the system back to optimal operation.
The optimizer uses the digital twin to find the optimum
reactive power set points across the full range of passive
nodes by applying the particle swarm optimization algorithm
as shown in the ’Development of DTO’ block of Fig. 4. The
generated Qgbest) dataset will consist of measured loads and
corresponding optimum reactive power injection calculated
by PSO for a dataset that spans at least one day of system
operation.
This dataset is then used to train the optimizer, which is
also another feed forward neural network structured as a Multi
Layer Perceptron. The first step is to tune the digital twin to
reflect the new input output relationship of the system. The
second step is to replace the old digital twin in the PSO loop
in the optimizer with the new digital twin of the system. Then
the optimizer re-tuning is triggered. In this step PSO runs to
generate a data set of load apparent power and corresponding
optimum reactive power injection. Next, this generated dataset
is used to retrain the optimizer. Finally, the retrained optimizer
replaces the old optimizer and the system returns back to
optimal operation.
The estimator also requires to be re-tuned when the esti-
mator changes, since the optimization uses the digital twin to
generate the training data-set for the optimizer.
In normal operation, the framework relaxes to the set up
shown in Fig. 3.
Authorized licensed use limited to: CLEMSON UNIVERSITY. Downloaded on December 30,2020 at 21:31:18 UTC from IEEE Xplore. Restrictions apply.
DistributionSystem
Optimizer
+
−
Online Optimizer
Development of DTDS
Smeas
Smeas
QinjQinj
Qinj
Smeas
Vest
Vmeas
ΔV
DTO
Development of DTO
+
−ΔQ
Qinj,old
DTDS
Vswarm,i Qswarm,i
PSOFitness (U)
Qgbest
DTDS
Qinj,old
QgbestUswarm,(i+1)
function
Wnew
Smeas
∑
∑
Fig. 4. System process flow and overview diagram. The three subsystems required for this method, Development of DTO, Development of DTDS, and OnlineOptimizer, are shown inside red, green and blue dotted frames.
V. RESULTS
A. Case Study
The framework is tested on the IEEE 4 bus test system [15]
shown in Fig. 5. Here, the load at bus 4 is changing randomly
and the reactive power injections at buses 3 and 4 are operating
to control the system voltage.
B. Utility Function
The utility function for optimization for this case study is
the sum of the mean squared error of the node voltage (based
on V0 = 1pu).
U = 0.5[(|V3| − |V0|)2 + (|V4| − |V0|)2] (7)
Fig. 5. System under study.
C. Digital Twin of the Distribution System (DTDS)
The performance of the DTDS is at a high level since the
estimated voltage at bus 4 closely matches the values that
were obtained from the OpenDSS simulator, as shown in Fig.
6. The maximum Mean Absolute Percentage Error (MAPE)
Authorized licensed use limited to: CLEMSON UNIVERSITY. Downloaded on December 30,2020 at 21:31:18 UTC from IEEE Xplore. Restrictions apply.

that is observed is less than 0.6%.
D. Digital Twin of the Optimizer (DTO)
The PSO output is shown in Fig. 7. These results show that
PSO can find the control vector to optimize voltages at both
bus 3 and 4, successfully satisfying the optimization objective
defined in (7).
The system performance when operated with a tuned DTO
is given in Fig. 8. The results are for a 1000 second dataset
in which the loads have large variations across their full
operating range. This shows that both buses have significant
improvement in voltage quality and that smart inverters at both
bus 3 and 4 contribute in a coordinated manner to improve
system voltage in varying operating conditions. The voltage
quality improvement can be clearly observed by comparing
the utility before and after this method was applied.
E. Discussion
The results of this study show that system performance can
be enhanced by using the proposed voltage control framework.
If local voltage control is applied there will be degradement
of performance because the two injections will be adversely
affecting each other. That is because the largest impact on the
U (which is a function of V3 and V4) is by the remote end
voltage, which is the weakest bus in the system. This provides
the basis for why a coordinated voltage control scheme will be
of greater value to ensure better overall voltage control. The
voltage at each bus is still maintained between the required
limits, but using coordinated control the voltage at Bus 4 is
brought from over-limit to within the standard of +/-3% . It
is clear that without this strategy (by only using local control)
the overall system voltage quality is deficient.
We assume zero delay between measurement, computation
and action. For a system with above solar irradiation based
variation, simulations show that even a 1 second (1 step) delay,
does not impact the system operation. This is because the
changes observed in the independent variable (Solar Irradi-
ation) changes in a slow and smooth way when measured in
a second basis.
VI. CONCLUSION
The framework proposed in this study can successfully
optimize in a non real-time simulation environment for a small
power system. The next stage of this study will look at a real
time simulation, since a big challenge in this domain is the
requirement to ensure that the computation time required for
the control method stays within reasonable bounds. This will
assist to generate and implement control actions before the
system operating state changes significantly. Additionally, the
case study will need to be expanded to reflect a more realistic
power distribution system with respect to size and topology
as well as load and generation dynamics.
REFERENCES
[1] J. St John, “Distributed energy poised for explosive growth on the USgrid,” Greentech Media, 2018.
[2] Z. K. Pecenak, J. Kleissl, and V. R. Disfani, “Smart inverter impactson california distribution feeders with increasing pv penetration: A casestudy,” in 2017 IEEE Power & Energy Society General Meeting. IEEE,2017, pp. 1–5.
[3] I. L. S. M. Daley PE DGCP and I. M. Houser PE, “Assessment ofder interconnection installation for conformance with IEEE std 1547,”Assessment of DER Interconnection Installation for Conformance withIEEE Std 1547, pp. 1–18, Feb. 2018.
[4] Y. P. Agalgaonkar, B. C. Pal, and R. A. Jabr, “Distribution voltagecontrol considering the impact of pv generation on tap changers andautonomous regulators,” IEEE Transactions on Power Systems, vol. 29,no. 1, pp. 182–192, 2013.
[5] A. R. Malekpour and A. Pahwa, “Reactive power and voltage controlin distribution systems with photovoltaic generation,” in 2012 NorthAmerican Power Symposium (NAPS). IEEE, 2012, pp. 1–6.
[6] A. R. Malekpour, A. Pahwa, and S. Das, “Inverter-based var control inlow voltage distribution systems with rooftop solar pv,” in 2013 NorthAmerican Power Symposium (NAPS). IEEE, 2013, pp. 1–5.
[7] A. R. Malekpour, A. Pahwa, and B. Natarajan, “Distributed volt/varcontrol in unbalanced distribution systems with distributed generation,”in 2014 IEEE Symposium on Computational Intelligence Applicationsin Smart Grid (CIASG). IEEE, 2014, pp. 1–6.
[8] M. Farivar, L. Chen, and S. Low, “Equilibrium and dynamics of localvoltage control in distribution systems,” in Proc. 52nd IEEE Conf.Decision and Control, Dec. 2013, pp. 4329–4334.
[9] G. Cavraro, S. Bolognani, R. Carli, and S. Zampieri, “The value ofcommunication in the voltage regulation problem,” in Proc. IEEE 55thConf. Decision and Control (CDC), Dec. 2016, pp. 5781–5786.
[10] S. Bolognani, R. Carli, G. Cavraro, and S. Zampieri, “Distributedreactive power feedback control for voltage regulation and loss mini-mization,” IEEE Transactions on Automatic Control, vol. 60, no. 4, pp.966–981, Apr. 2015.
[11] J. Smith, “Modeling high-penetration pv for distribution interconnectionstudies,” Electric Power Research Institute, Tech. Rep, 2013.
[12] Y. Sun, X. Chen, S. Yang, K. J. Tseng, G. Amaratunga et al., “Micropmu based monitoring system for active distribution networks,” in 2017IEEE 12th International Conference on Power Electronics and DriveSystems (PEDS). IEEE, 2017, pp. 518–522.
[13] V. Gevorgian and B. O’Neill, “Demonstration of active power controlsby utility-scale pv power plant in an island grid: Preprint,” 2 2017.
[14] R. C. Dugan, “Reference guide: The open distribution system simulator(opendss),” Electric Power Research Institute, Inc, vol. 7, 2012.
[15] W. H. Kersting, “Radial distribution test feeders,” in 2001 IEEE PowerEngineering Society Winter Meeting. Conference Proceedings (Cat.No.01CH37194), vol. 2, 2001, pp. 908–912 vol.2.
[16] Y. Del Valle, G. K. Venayagamoorthy, S. Mohagheghi, J.-C. Hernandez,and R. G. Harley, “Particle swarm optimization: basic concepts, variantsand applications in power systems,” IEEE Transactions on evolutionarycomputation, vol. 12, no. 2, pp. 171–195, 2008.
Authorized licensed use limited to: CLEMSON UNIVERSITY. Downloaded on December 30,2020 at 21:31:18 UTC from IEEE Xplore. Restrictions apply.

0 10 20 30 40 50 60 70 80 90 100Time (s)
0.95
1
1.05
Volta
ge (p
u)
V4 estimateV4 actual
0 10 20 30 40 50 60 70 80 90 100Time (s)
-0.6
-0.4
-0.2
0
0.2
MAP
E (%
)
Fig. 6. DTDS Validation: The top plot compares voltage estimation from the digital twin with the actual values for bus 4 over a period of 100 seconds. Thebottom figure shows the MAPE values for the same dataset.
Fig. 7. PSO results [16]: The top 4 plots compare the system performance with and without optimization. The bottom plots compare the Utility before andafter applying the optimization.
Authorized licensed use limited to: CLEMSON UNIVERSITY. Downloaded on December 30,2020 at 21:31:18 UTC from IEEE Xplore. Restrictions apply.

0 200 400 600 800 1000Time (s)
0.98
1
1.02
Bus
3 vo
ltage
(pu) V3 before
V3 after
0 200 400 600 800 1000Time (s)
0.9
1
1.1
Bus
4 vo
ltage
(pu) V before
V after
0 200 400 600 800 1000Time (s)
-0.2
0
0.2
Q3 (p
u)
Q3 injection
0 200 400 600 800 1000Time (s)
-0.2
0
0.2
Q4 (p
u)Q4 injection
0 200 400 600 800 1000Time (s)
0
1
2
3
Une
w
10-5
0 200 400 600 800 1000Time (s)
0
1
2
3
Uol
d
10-3
Fig. 8. Optimization results operating under proposed method: The top 2 plots compare the voltage performance of bus 3 and 4, before and after optimization.The middle 2 plots show the variation of reactive power injection of bus 3 and 4 when participating in voltage control. The bottom plots compare the utilityand function after and before applying voltage optimization over a period of 1000 seconds.
Authorized licensed use limited to: CLEMSON UNIVERSITY. Downloaded on December 30,2020 at 21:31:18 UTC from IEEE Xplore. Restrictions apply.


