On the Dependence of Winter Precipitation Types on Temperature,Precipitation Rate, and Associated Features
JULIE M. THERIAULT,* RONALD E. STEWART,1 AND WILLIAM HENSON
McGill University, Montreal, Quebec, Canada
(Manuscript received 10 June 2009, in final form 31 December 2009)
ABSTRACT
The phase of precipitation formed within the atmosphere is highly dependent on the vertical temperature
profile through which it falls. In particular, several precipitation types can form in an environment with
a melting layer aloft and a refreezing layer below. These precipitation types include freezing rain, ice pellets,
wet snow, and slush. To examine the formation of such precipitation, a bulk microphysics scheme was used to
compare the characteristics of the hydrometeors produced by the model and observed by a research aircraft
flight during the 1998 ice storm near Montreal, Canada. The model reproduced several of the observed key
precipitation characteristics. Sensitivity tests on the precipitation types formed during the ice storm were also
performed. These tests utilized temperature profiles produced by the North American Regional Reanalysis.
The results show that small variations (60.58C) in the temperature profiles as well as in the precipitation rate
can have major impacts on the types of precipitation formed at the surface. These results impose strong
requirements on the accuracy needed by prediction models.
1. Introduction
Precipitation produced within winter storms can be in
the form of snow (s), ice pellets (ip), and freezing rain
(zr) as well as particles composed of both liquid and ice
such as wet snow (ws). This precipitation can lead to
hazardous surface conditions. For instance, precipitation
consisting of liquid water falling through subfreezing
temperatures can lead to icing on structures possibly
with severe consequences. The 1998 ice storm in Mon-
treal, Canada, is one such example and was one of the
most catastrophic weather events in Canadian history
(Henson et al. 2007).
The various types of winter precipitation are com-
monly observed along a warm front where a tempera-
ture inversion is often formed. They are summarized in
Table 1. This environment consists of a melting layer
aloft (T . 08C) and a refreezing layer (T , 08C) below.
When snow falls through the melting layer, it begins to
melt and eventually reaches the lower refreezing layer
as either wet snow, slush (sl), or rain (r). Slush refers to
snow that has almost completely melted and has col-
lapsed down to a smaller size but still contains some ice
(Theriault et al. 2006). In contrast, wet snow has melted
somewhat but has not collapsed. The precise type of
precipitation reaching the bottom of the melting layer
(defined here as the critical level) has a major impact on
the type of precipitation formed within the refreezing
layer. For instance, if slush reaches the critical level it
will refreeze partially into a particle composed of an ice
shell and liquid core, also called a liquid core pellet (lcp;
Theriault and Stewart 2010), and depending on the tem-
perature profile, it may refreeze completely into ice pel-
lets before reaching the surface.
Interactions among particle types can also affect the
precipitation types occurring at the surface. For instance,
the collection of ice crystals (i) by a supercooled drop at
subfreezing temperatures will initiate the freezing of the
drop, and act to form an ice pellet as suggested by Hogan
(1985).
Despite the increasing understanding of winter precipi-
tation, accurate prediction is still difficult. This difficulty
* Current affiliation: National Center for Atmospheric Re-
search, Boulder, Colorado.1 Current affiliation: Department of Environment and Geog-
raphy, University of Manitoba, Winnipeg, Manitoba, Canada.
Corresponding author address: Julie M. Theriault, Department
of Atmospheric and Oceanic Sciences, 805 Sherbrooke West,
McGill University, Montreal, QC H3A 2K6, Canada.
E-mail: [email protected]
JULY 2010 T H E R I A U L T E T A L . 1429
DOI: 10.1175/2010JAMC2321.1
� 2010 American Meteorological Society
arises, in part, because of the strong dependence on en-
vironmental conditions: temperature, moisture, and ver-
tical and horizontal motion, as well as cloud condensation
and ice nuclei distribution. Statistical techniques have
been developed to predict various types of winter pre-
cipitation (e.g., Derouin 1973; Cantin and Bachand 1993;
Bourgouin 2000). However, these methods omit impor-
tant factors such as particle size distribution and back-
ground wind fields. They also do not allow for mixed
phase precipitation alone or in combination with other
types. In contrast, a mixture of precipitation types is of-
ten reported. For example, it is very common to observe
a mixture of ice pellets and freezing rain. Sometimes
these precipitation types are observed with ice crystals
(Crawford and Stewart 1995).
Given the importance of determining the precise type
of precipitation formed within the atmosphere and reach-
ing the surface during winter storms, the goal of this paper
is to study the formation of precipitation types within
various temperature profiles and assess their sensitivity
to changes in these profiles and the precipitation rate.
To accomplish this, a bulk microphysics scheme devel-
oped to study winter precipitation (Theriault and Stewart
2010) coupled with a one-dimensional kinematic cloud
model will be utilized. This scheme includes partial melt-
ing of snowflakes and the refreezing of mixed phase par-
ticles. The precipitation type characteristics will be studied
using in-flight measurements during the 1998 ice storm
(Cober et al. 2001). Furthermore, the scheme will be used
as a tool to investigate the sensitivity of the precipitation
types to the temperature profile and the precipitation rate
during this event.
Note that the goal of this study is not to simulate the
storm’s features but to study the microphysical details
of the formation of winter precipitation types, including
their sensitivity to the temperature and other fields.
This paper is organized as follows: section 2 describes
the experimental design. An investigation of the char-
acteristics of the precipitation types formed during the
1998 ice storm over Mirabel, an airport north of Mon-
treal, is carried out and compared with in-flight mea-
surements in section 3. Section 4 discusses the results of
the sensitivity experiments of precipitation types to the
temperature profile and precipitation rate. Concluding
remarks are presented in section 5.
2. Experimental design
The various precipitation types formed within winter
storms are studied using a bulk microphysics scheme
(Theriault and Stewart 2010). Many precipitation cate-
gories have been added to the parameterizations used
by Milbrandt and Yau (2005b). The bulk microphysics
scheme includes five ice hydrometeor categories—ice
crystals, snow, refrozen wet snow (rws), and two ice
pellet categories (ipA and ipB); two liquid hydrometeor
categories—rain and cloud droplets (c); and one semi-
melted category—slush. In addition, the scheme descrip-
tion also includes more precipitation categories that change
depending on whether the temperature is above or below
08C. For instance, supercooled rain (sr) and liquid core
pellets are, respectively, rain and slush at temperatures
below 08C and wet snow is snow when the wet-bulb
temperature is above 08C. Freezing rain will be used to
TABLE 1. Definitions of the hydrometeor categories simulated by the scheme.
Hydrometeor Symbol Definition
Raina r Precipitation in the form of liquid water drops that have diameters .0.5 mm, or,
if widely scattered, the drops may be smaller
Freezing raina zr Rain that falls in liquid form but freezes upon impact to form a coating of glaze
upon the ground and on exposed objects
Supercooled raina sr Liquid precipitation at temperatures below freezing
Snowa s Precipitation composed of white or translucent ice crystals, chiefly in complex branch
hexagonal form and often agglomerated into snowflakes
Ice pelletsa ipA and ipB A type of precipitation consisting of transparent or translucent pellets of ice,
#5 mm in diameter
Wet snowa ws Snow that contains a great deal of liquid water
Refrozen wet snowb rws Refrozen wet snowflake
Slushb sl Precipitation composed of a mixture of liquid and ice in which the original snowflake’s
shape is not discernable
Ice crystalsa i Pristine ice crystals
Cloud dropletsc c Small nonsedimenting water droplets
Liquid core pelletsd lcp Liquid core pellets: partially refrozen drop with an ice shell and liquid water within it
a From Glickman (2000).b From Theriault et al. (2006).c From Milbrandt and Yau (2005b).d From Theriault and Stewart (2007).
1430 J O U R N A L O F A P P L I E D M E T E O R O L O G Y A N D C L I M A T O L O G Y VOLUME 49

refer to supercooled rain reaching the surface at sub-
freezing temperatures.
The evolution of the precipitation categories falling
through a melting layer and a lower refreezing layer is
summarized in Fig. 1. When snow reaches the melting
layer it is called wet snow even if it is the same prog-
nostic variable. It is assumed that the smallest snow-
flakes melt completely before the largest ones. Based on
that assumption, wet snow melts partially into slush and
slush melts completely into rain when falling through
the melting layer.
The type of precipitation reaching the surface largely
depends on the liquid fraction of the melting precipi-
tation at the critical height (Fig. 1). For instance, if wet
snow reaches the critical height, it will begin to refreeze
into refrozen wet snow. On the other hand, if slush reaches
the critical height, it is transformed into liquid core pellets.
Depending on the temperature and depth of the re-
freezing layer, the liquid core pellets will refreeze par-
tially or completely into ice pellets (ipA) before reaching
the surface.
Finally, when falling in the refreezing layer, rain be-
comes supercooled rain. If ice crystals are locally pro-
duced in the refreezing layer, they may interact with
supercooled rain to form ice pellets (called ipB). The
difference between the two categories of ice pellets is
their formation mechanism. One is formed by refreezing
semi-melted particles (ipA) and the other one is formed
by contact between supercooled rain and pristine ice
crystals or ice nucleation (ipB).
The microphysics scheme is coupled to a one-
dimensional kinematic cloud model that has been de-
scribed in Theriault and Stewart (2007). It has also been
used in Milbrandt and Yau (2005a) and Theriault et al.
(2006). The model is initialized with vertical profiles of
temperature (T) and dewpoint temperature (Td). There
are 151 vertical levels evenly spaced (with respect to
height) over an air column 3.5 km deep, and hydrostatic
balance is assumed.
3. Winter precipitation–type characteristics
Precipitation characteristics and their formation mech-
anisms are investigated and compared with in-flight data
collected during the 1998 ice storm. Many flights were
made during this storm (Cober et al. 2001). However,
only one was made through a melting and a refreezing
layer within 25 km of Mirabel Airport where surface
observations are available (www.climate.weatheroffice.
ec.gc.ca).
a. In-flight data and method
Data from flight 008 of the third Canadian Freezing
Drizzle Experiment (CFDE III) are used for this study
(Cober et al. 2001). A mixture of ice pellets and freezing
FIG. 1. Schematic diagram of the evolution of precipitation types when falling through the
melting layer and the refreezing layer below it. The critical height is indicated as well as the
temperature of the atmospheric layers. The solid line is the ground level. The solid arrows
between precipitation types category indicate a change of prognostic variables. The dashed
arrows indicate that the name of the precipitation changes but they are the same prognostic
variables.
JULY 2010 T H E R I A U L T E T A L . 1431
rain was observed at Mirabel during the flight (Henson
et al. 2007). The aircraft used was the National Research
Council Convair 580 (Cober et al. 1995; Isaac et al. 2001)
and the data collected include liquid water measure-
ments, aerosol, precipitation, and cloud droplet spectra
as well as the rate of icing.
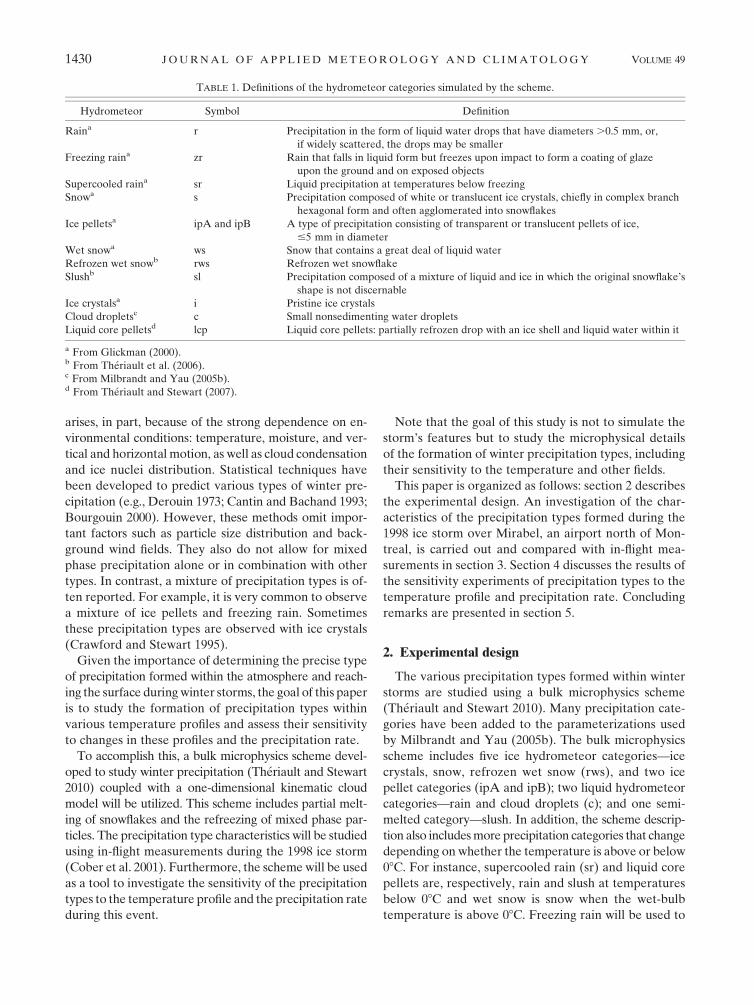
Images of the particles were obtained with three dif-
ferent probes. These probes are the 2D-C, 2D-P, and
2D-G, each measuring different ranges of particle sizes.
Figure 2 shows an example of the images obtained with
the 2D-C probe (Cober et al. 2001) at four different
levels. The width of each strip is 0.8 mm.
The particles are classified by their shape as being
either circular (CI) or irregular (IR). In general, the cir-
cular particles are assumed to be liquid drops or ice pel-
lets, and the irregular particles to be ice crystals or snow.
The four strips of particle images shown in Fig. 2 were
obtained at four different times during the flight corre-
sponding to various heights of interest. For example,
Fig. 2a shows particles present above the melting layer
and they are mainly irregular particles (ice crystals and
snowflakes), whereas Fig. 2c shows particles at the crit-
ical level and they are mainly spherical. Based on such
images, the concentration of particles is computed at
each level. The computation considers all the particles
entirely recorded and those extrapolated from partial
recordings.
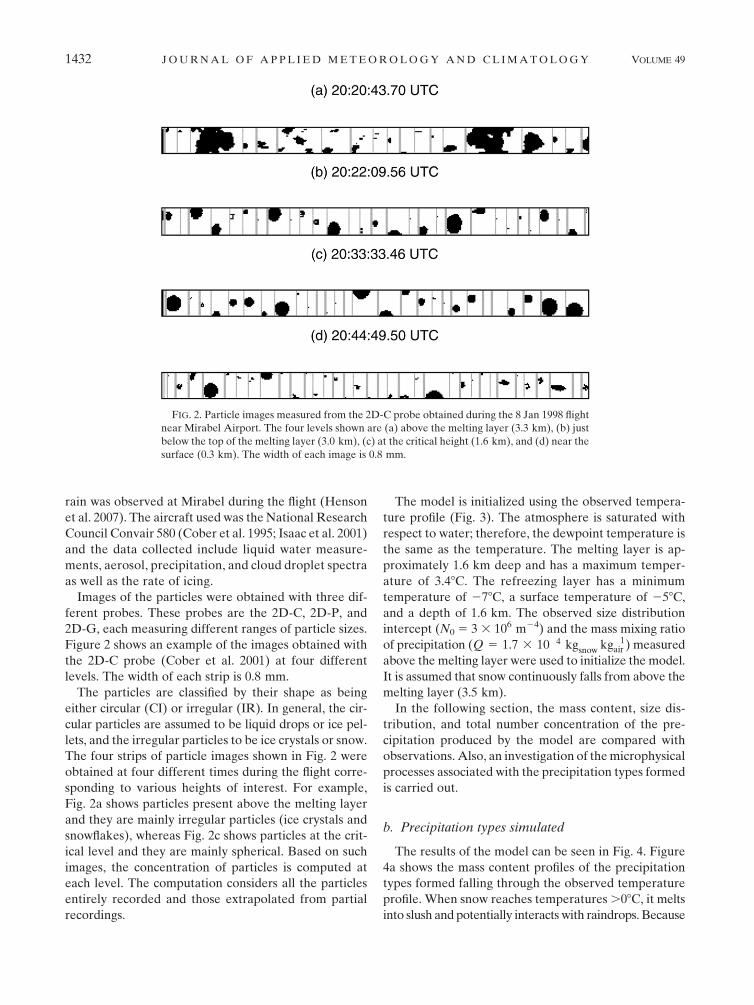
The model is initialized using the observed tempera-
ture profile (Fig. 3). The atmosphere is saturated with
respect to water; therefore, the dewpoint temperature is
the same as the temperature. The melting layer is ap-
proximately 1.6 km deep and has a maximum temper-
ature of 3.48C. The refreezing layer has a minimum
temperature of 278C, a surface temperature of 258C,
and a depth of 1.6 km. The observed size distribution
intercept (N0 5 3 3 106 m24) and the mass mixing ratio
of precipitation (Q 5 1.7 3 10�4 kgsnow
kg�1air ) measured
above the melting layer were used to initialize the model.
It is assumed that snow continuously falls from above the
melting layer (3.5 km).
In the following section, the mass content, size dis-
tribution, and total number concentration of the pre-
cipitation produced by the model are compared with
observations. Also, an investigation of the microphysical
processes associated with the precipitation types formed
is carried out.
b. Precipitation types simulated
The results of the model can be seen in Fig. 4. Figure
4a shows the mass content profiles of the precipitation
types formed falling through the observed temperature
profile. When snow reaches temperatures .08C, it melts
into slush and potentially interacts with raindrops. Because
FIG. 2. Particle images measured from the 2D-C probe obtained during the 8 Jan 1998 flight
near Mirabel Airport. The four levels shown are (a) above the melting layer (3.3 km), (b) just
below the top of the melting layer (3.0 km), (c) at the critical height (1.6 km), and (d) near the
surface (0.3 km). The width of each image is 0.8 mm.
1432 J O U R N A L O F A P P L I E D M E T E O R O L O G Y A N D C L I M A T O L O G Y VOLUME 49
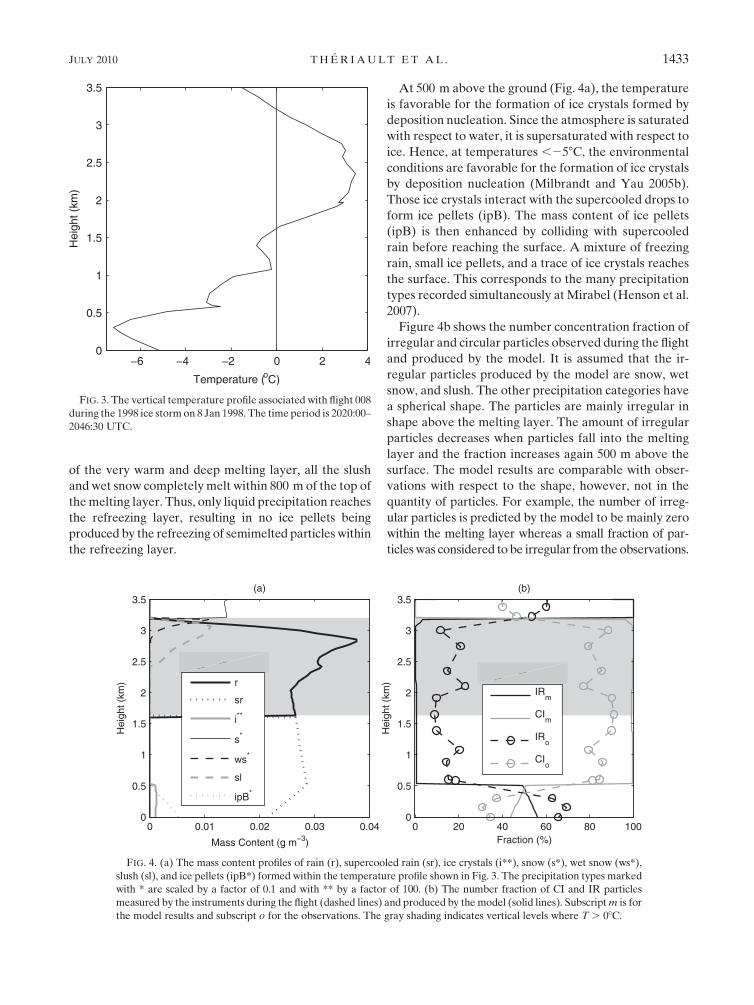
of the very warm and deep melting layer, all the slush
and wet snow completely melt within 800 m of the top of
the melting layer. Thus, only liquid precipitation reaches
the refreezing layer, resulting in no ice pellets being
produced by the refreezing of semimelted particles within
the refreezing layer.
At 500 m above the ground (Fig. 4a), the temperature
is favorable for the formation of ice crystals formed by
deposition nucleation. Since the atmosphere is saturated
with respect to water, it is supersaturated with respect to
ice. Hence, at temperatures ,258C, the environmental
conditions are favorable for the formation of ice crystals
by deposition nucleation (Milbrandt and Yau 2005b).
Those ice crystals interact with the supercooled drops to
form ice pellets (ipB). The mass content of ice pellets
(ipB) is then enhanced by colliding with supercooled
rain before reaching the surface. A mixture of freezing
rain, small ice pellets, and a trace of ice crystals reaches
the surface. This corresponds to the many precipitation
types recorded simultaneously at Mirabel (Henson et al.
2007).
Figure 4b shows the number concentration fraction of
irregular and circular particles observed during the flight
and produced by the model. It is assumed that the ir-
regular particles produced by the model are snow, wet
snow, and slush. The other precipitation categories have
a spherical shape. The particles are mainly irregular in
shape above the melting layer. The amount of irregular
particles decreases when particles fall into the melting
layer and the fraction increases again 500 m above the
surface. The model results are comparable with obser-
vations with respect to the shape, however, not in the
quantity of particles. For example, the number of irreg-
ular particles is predicted by the model to be mainly zero
within the melting layer whereas a small fraction of par-
ticles was considered to be irregular from the observations.
FIG. 3. The vertical temperature profile associated with flight 008
during the 1998 ice storm on 8 Jan 1998. The time period is 2020:00–
2046:30 UTC.
FIG. 4. (a) The mass content profiles of rain (r), supercooled rain (sr), ice crystals (i**), snow (s*), wet snow (ws*),
slush (sl), and ice pellets (ipB*) formed within the temperature profile shown in Fig. 3. The precipitation types marked
with * are scaled by a factor of 0.1 and with ** by a factor of 100. (b) The number fraction of CI and IR particles
measured by the instruments during the flight (dashed lines) and produced by the model (solid lines). Subscript m is for
the model results and subscript o for the observations. The gray shading indicates vertical levels where T . 08C.
JULY 2010 T H E R I A U L T E T A L . 1433

The melting layer is too deep and warm to allow parti-
cles to survive without melting completely.
The model results may also be compared with the
particle images shown in Fig. 2. Above the melting layer,
at 3.3 km, snow is mainly produced by the model and it
agrees with the irregular particles shown in Fig. 4b. Just
below the top of the melting layer (3.0 km), a mixture of
wet snow, rain, and slush is produced by the model, and
a mixture of both circular and irregular particles is ob-
served. At the critical height (1.6 km)—the bottom of
the melting layer—mainly circular particles are observed
and this is comparable with the model results in Fig. 4a.
Finally, at 0.3 km above the surface, a mixture of both
irregular and circular particles is evident in the image.
The observed irregular particles could be the pristine ice
crystals produced locally by deposition nucleation. Also,
the circular particles could be supercooled drops or ice
pellets produced by the collision of supercooled drops
and ice crystals. The model results produced a mixture
of ice crystals, supercooled drops, and ice pellets (ipB)
near the surface.
c. Precipitation size distribution
The size distribution of the precipitation types produced
within the observed temperature profile is compared
with observations. Figure 5 shows the size distribution
FIG. 5. The size distribution of IR and CI particles measured during flight 008 compared with model results: (a)
above the melting layer (3.3 km), (b) at the top of the melting layer (3.0 km), (c) at the critical level (1.6 km), and (d)
near the surface (0.3 km). The data are 30-s averages. Shown are the real physical diameters of the precipitation types
except for snow and wet snow, which show the dimension of the major axis.
1434 J O U R N A L O F A P P L I E D M E T E O R O L O G Y A N D C L I M A T O L O G Y VOLUME 49

of irregular and circular particles compared with each
type of precipitation formed. The four levels shown are
the same as those in Fig. 2.
Figure 5a shows the size distribution of snowflakes ini-
tialized above the melting layer. It is comparable with the
total observed spectrum of particles. The observed circu-
lar particles measured could possibly be small ice crystals.
Below the top of the melting layer (3.0 km), a mixture
of slush, rain, and wet snow is produced by the model
and their size distributions are shown in Fig. 5b. The size
spectrum of rain is mainly comparable to the observed
smaller size spectra diameters. Next, the slush size dis-
tribution is between the rain size spectra and the wet
snow size spectra. It matches the irregular and circular
particles observed and the wet snowflakes match the
larger irregular particles concentration.
Many irregular particles smaller than slush are ob-
served but not produced by the model. This is a model
limitation because a truncated inverse exponential size
distribution is assumed in the microphysics parameter-
ization. Those irregular particles could be the result of
large slush particles and/or wet snow that have broken
while melting.
Furthermore, there is a gap between the slush and wet
snow size distribution in Fig. 5b. This gap is explained by
the instantaneous change of density when wet snow-
flakes collapse into slush because the real diameters are
shown as opposed to the liquid water equivalent diameter.
The parameterization of melting snow assumes that when
wet snow melts into slush its density will vary signifi-
cantly. Thus, the observed irregular particles with di-
ameters (or the dimension of the major axis) within the
gap could either be slush with a density lower than as-
sumed in the scheme or wet snow with a density higher
than assumed in the scheme. It should also be noted that
no gap would exist between slush and wet snow thresh-
old diameters if liquid water equivalent diameters would
be shown instead of the actual physical diameters.
Figure 5c compares the size distribution obtained by
the model and the size distribution of circular and ir-
regular particles at the critical height. Because of the
warm and deep melting layer, only rain should reach the
critical height. The slope simulated by the model is com-
parable with the observations; however, the intercept of
the size distribution is underpredicted. Some large ir-
regular particles are observed and are not reproduced by
the model. It is possible that the larger irregular particles
are large rain drops distorted from spheres by friction as
they fall. The particle analysis software may not recog-
nize the distorted spheres as drops.
At 0.3 km (Fig. 5d), the size distribution produced by
the model is also underpredicted by less than one order
of magnitude. However, the slopes of the freezing rain
and ice crystal distributions match the measured values.
Theoretically, circular particles are supercooled rain and
small ice pellets whereas irregular particles are ice crystals.
d. Summary
Overall, key aspects of the precipitation type evolu-
tion within a vertical profile in the Mirabel area during
the 1998 ice storm have been accounted for. Many of the
precipitation characteristics observed during the flight
have been reproduced by the model. The observational
limitations, as well as the model assumptions, act to limit
detailed comparisons between numerical results and ob-
servations at both large and small sizes.
In terms of observational limitations, the analysis of
particle images taken during the flight is at times very
difficult. For instance, very small irregular particles could
look circular on an image and be, in reality, ice crystals.
Also, there are some limitations with measuring the size
of very large snowflakes. For example, they can break up
upon contact with the measuring probes.
In terms of model limitations, there are at least two
issues. First, no cloud droplets are produced in these
simulations and this has an impact on the lack of small
particles at the bottom of the refreezing layer. This could
also have an impact on the formation of other pre-
cipitation types within the refreezing layer. No vertical
motion was utilized and so there was no ongoing means
of producing droplets by this mechanism. From the ob-
servations, high concentrations of cloud droplets are
present near the surface (;205 cm23 at 400 m) and the
presence of cloud droplets could lead to more accretion
between ice crystals and an increase of ice pellets (ipB).
Furthermore, it could also trigger another formation
mechanism of ice pellets by the Hallett–Mossop sec-
ondary ice multiplication (Hallett and Mossop 1974).
The interaction of ice pellets by contact nucleation and
cloud droplets could lead to the formation of ice crystals
and thus, a larger amount of small ice pellets. Second, the
assumption that the exponential form of the size distribu-
tion is truncated by threshold diameters as for slush and
wet snow is also a limitation. This produces a gap between
the size of, for instance, wet snow and slush. Also, it can
lead to limitations when modeling smaller and larger par-
ticle sizes of an evolving distribution of precipitation types.
4. Sensitivity study
The sensitivity of the precipitation types with respect
to the vertical temperature profile is now examined. The
experiments are conducted using the data observed dur-
ing the 1998 ice storm in the Montreal area. Milton and
Bourque (1999) divided the event into two critical icing
periods. The first is between 2300 UTC 5 January and
JULY 2010 T H E R I A U L T E T A L . 1435
1300 UTC 6 January 1998 and the second is between
2300 UTC 7 January and 2300 UTC 9 January 1998. This
study will focus on the second icing period, as several
types of precipitation as well as combinations of types
were observed in Montreal.
North American Regional Reanalysis (NARR) prod-
ucts are used as a guide to analyze the sensitivity of the
precipitation types formed during the second icing pe-
riod to the background environmental conditions. NARR
is an assimilated operational dataset archived every 3 h
with a 32-km gridspacing. The data are archived from
1978 to present. Further information is given in Mesinger
et al. (2006). The surface observations were obtained
from the National Climate Data and Information Ar-
chive. The hourly surface precipitation types observed
at the Pierre Elliott Trudeau Airport (Montreal) during
the second icing period were freezing rain only, a mix-
ture of freezing rain and ice pellets, or ice pellets only.
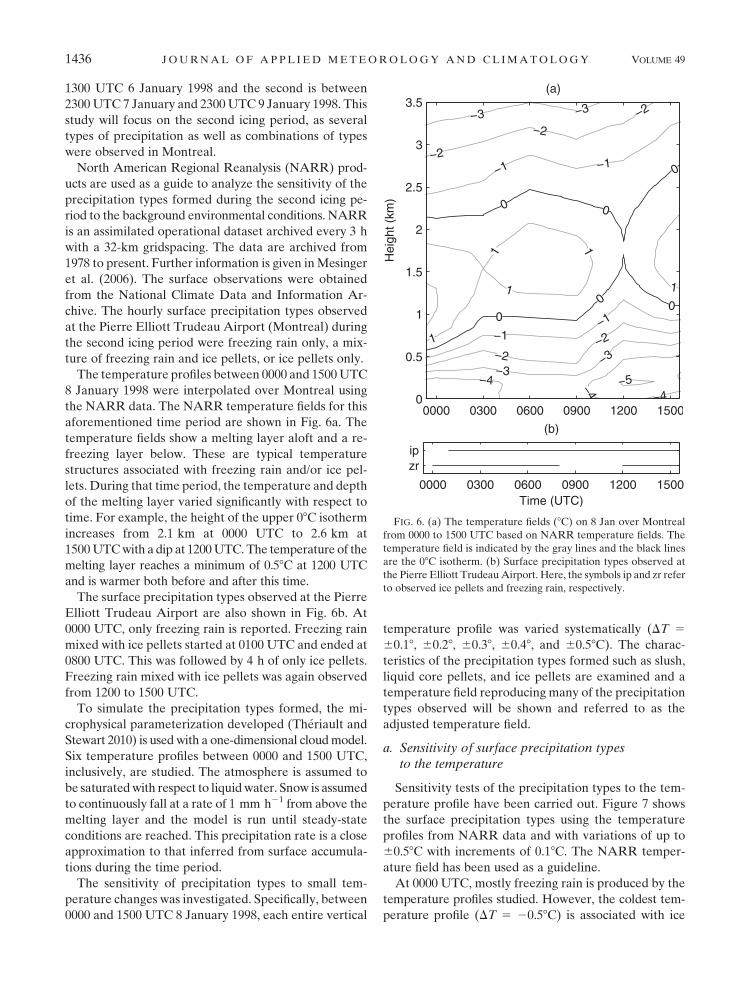
The temperature profiles between 0000 and 1500 UTC
8 January 1998 were interpolated over Montreal using
the NARR data. The NARR temperature fields for this
aforementioned time period are shown in Fig. 6a. The
temperature fields show a melting layer aloft and a re-
freezing layer below. These are typical temperature
structures associated with freezing rain and/or ice pel-
lets. During that time period, the temperature and depth
of the melting layer varied significantly with respect to
time. For example, the height of the upper 08C isotherm
increases from 2.1 km at 0000 UTC to 2.6 km at
1500 UTC with a dip at 1200 UTC. The temperature of the
melting layer reaches a minimum of 0.58C at 1200 UTC
and is warmer both before and after this time.
The surface precipitation types observed at the Pierre
Elliott Trudeau Airport are also shown in Fig. 6b. At
0000 UTC, only freezing rain is reported. Freezing rain
mixed with ice pellets started at 0100 UTC and ended at
0800 UTC. This was followed by 4 h of only ice pellets.
Freezing rain mixed with ice pellets was again observed
from 1200 to 1500 UTC.
To simulate the precipitation types formed, the mi-
crophysical parameterization developed (Theriault and
Stewart 2010) is used with a one-dimensional cloud model.
Six temperature profiles between 0000 and 1500 UTC,
inclusively, are studied. The atmosphere is assumed to
be saturated with respect to liquid water. Snow is assumed
to continuously fall at a rate of 1 mm h21 from above the
melting layer and the model is run until steady-state
conditions are reached. This precipitation rate is a close
approximation to that inferred from surface accumula-
tions during the time period.
The sensitivity of precipitation types to small tem-
perature changes was investigated. Specifically, between
0000 and 1500 UTC 8 January 1998, each entire vertical
temperature profile was varied systematically (DT 5
60.18, 60.28, 60.38, 60.48, and 60.58C). The charac-
teristics of the precipitation types formed such as slush,
liquid core pellets, and ice pellets are examined and a
temperature field reproducing many of the precipitation
types observed will be shown and referred to as the
adjusted temperature field.
a. Sensitivity of surface precipitation typesto the temperature
Sensitivity tests of the precipitation types to the tem-
perature profile have been carried out. Figure 7 shows
the surface precipitation types using the temperature
profiles from NARR data and with variations of up to
60.58C with increments of 0.18C. The NARR temper-
ature field has been used as a guideline.
At 0000 UTC, mostly freezing rain is produced by the
temperature profiles studied. However, the coldest tem-
perature profile (DT 5 20.58C) is associated with ice
FIG. 6. (a) The temperature fields (8C) on 8 Jan over Montreal
from 0000 to 1500 UTC based on NARR temperature fields. The
temperature field is indicated by the gray lines and the black lines
are the 08C isotherm. (b) Surface precipitation types observed at
the Pierre Elliott Trudeau Airport. Here, the symbols ip and zr refer
to observed ice pellets and freezing rain, respectively.
1436 J O U R N A L O F A P P L I E D M E T E O R O L O G Y A N D C L I M A T O L O G Y VOLUME 49
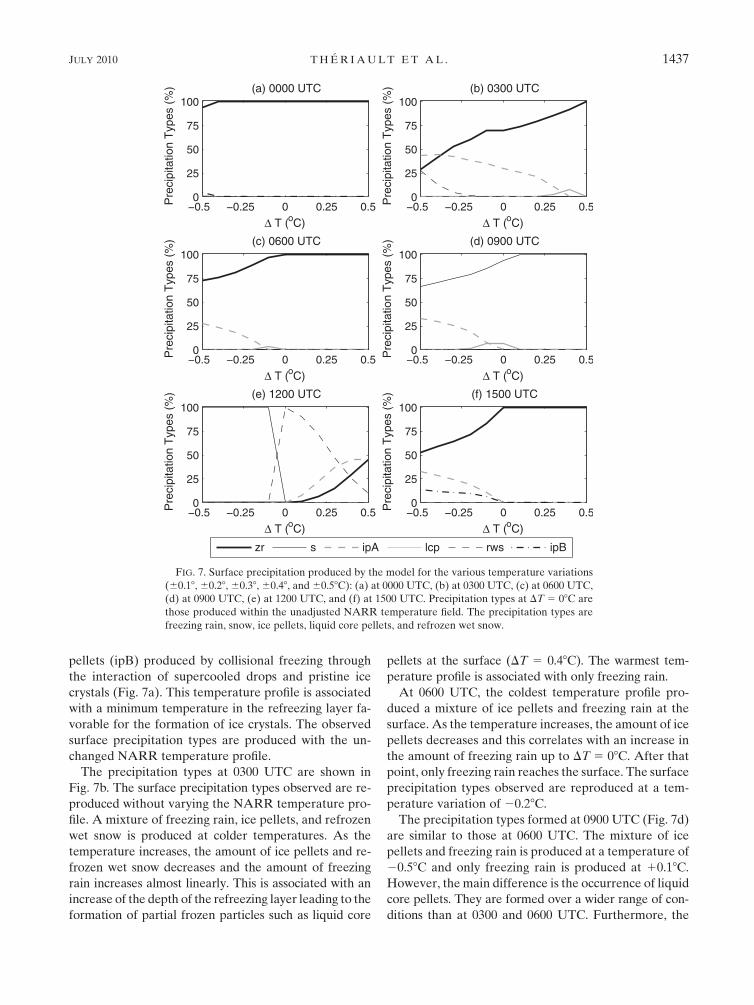
pellets (ipB) produced by collisional freezing through
the interaction of supercooled drops and pristine ice
crystals (Fig. 7a). This temperature profile is associated
with a minimum temperature in the refreezing layer fa-
vorable for the formation of ice crystals. The observed
surface precipitation types are produced with the un-
changed NARR temperature profile.
The precipitation types at 0300 UTC are shown in
Fig. 7b. The surface precipitation types observed are re-
produced without varying the NARR temperature pro-
file. A mixture of freezing rain, ice pellets, and refrozen
wet snow is produced at colder temperatures. As the
temperature increases, the amount of ice pellets and re-
frozen wet snow decreases and the amount of freezing
rain increases almost linearly. This is associated with an
increase of the depth of the refreezing layer leading to the
formation of partial frozen particles such as liquid core
pellets at the surface (DT 5 0.48C). The warmest tem-
perature profile is associated with only freezing rain.
At 0600 UTC, the coldest temperature profile pro-
duced a mixture of ice pellets and freezing rain at the
surface. As the temperature increases, the amount of ice
pellets decreases and this correlates with an increase in
the amount of freezing rain up to DT 5 08C. After that
point, only freezing rain reaches the surface. The surface
precipitation types observed are reproduced at a tem-
perature variation of 20.28C.
The precipitation types formed at 0900 UTC (Fig. 7d)
are similar to those at 0600 UTC. The mixture of ice
pellets and freezing rain is produced at a temperature of
20.58C and only freezing rain is produced at 10.18C.
However, the main difference is the occurrence of liquid
core pellets. They are formed over a wider range of con-
ditions than at 0300 and 0600 UTC. Furthermore, the
FIG. 7. Surface precipitation produced by the model for the various temperature variations
(60.18, 60.28, 60.38, 60.48, and 60.58C): (a) at 0000 UTC, (b) at 0300 UTC, (c) at 0600 UTC,
(d) at 0900 UTC, (e) at 1200 UTC, and (f) at 1500 UTC. Precipitation types at DT 5 08C are
those produced within the unadjusted NARR temperature field. The precipitation types are
freezing rain, snow, ice pellets, liquid core pellets, and refrozen wet snow.
JULY 2010 T H E R I A U L T E T A L . 1437
observed precipitation type is not exactly reproduced
within the variations of the temperature profile. The re-
sults show that a decrease of 0.58C produced the maxi-
mum amount of ice pellets. However, this is assuming an
initial precipitation rate of only 1 mm h21. A sensitivity
test varying the initial precipitation rate is conducted in
section 4b.
Several precipitation types are associated with the
temperature variation at 1200 UTC (Fig. 7e). They vary
from snow for a colder temperature profile to refrozen
wet snow at DT 5 08C. As the temperature increases,
refrozen wet snow is mixed with ice pellets and at DT 5
0.58C freezing rain is mixed with refrozen wet snow and
ice pellets. The temperature variation of 0.28C produced
exactly the same combination of freezing rain and ice
pellets observed assuming that refrozen wet snow is ob-
served as ice pellets.
Finally, at 1500 UTC (Fig. 7f), three different types of
precipitation are formed within the various temperature
profiles. A mixture of freezing rain and ice pellets (ipA
and ipB) is produced within the coldest temperature
profile. As the temperature increases, the precipitation
types change into freezing rain only at DT 5 08C. The
surface precipitation types observed are reproduced by
a temperature variation of 0.18C.
The majority of the surface precipitation types reported
during the second icing period of the 1998 ice storm was
reproduced by using the NARR temperature profiles as
a guide, with a variation of 60.58C (Table 2). Based on
those results, a vertical temperature profile time series
that reproduced most of the precipitation types observed
between 0000 and 1500 UTC 8 January 1998 in the
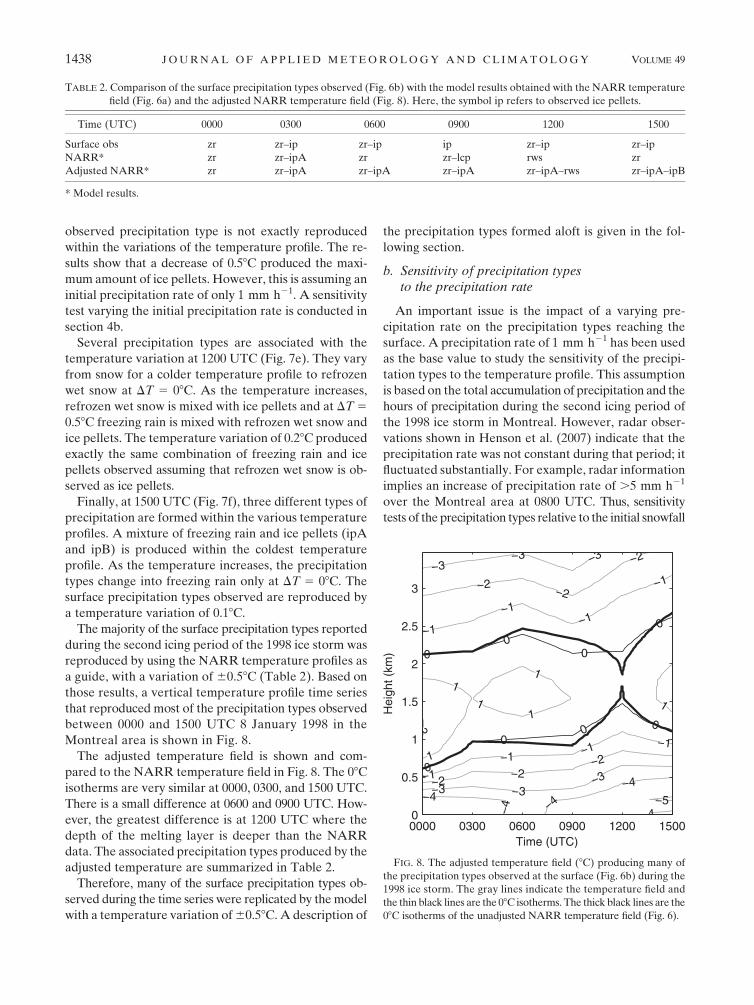
Montreal area is shown in Fig. 8.
The adjusted temperature field is shown and com-
pared to the NARR temperature field in Fig. 8. The 08C
isotherms are very similar at 0000, 0300, and 1500 UTC.
There is a small difference at 0600 and 0900 UTC. How-
ever, the greatest difference is at 1200 UTC where the
depth of the melting layer is deeper than the NARR
data. The associated precipitation types produced by the
adjusted temperature are summarized in Table 2.
Therefore, many of the surface precipitation types ob-
served during the time series were replicated by the model
with a temperature variation of 60.58C. A description of
the precipitation types formed aloft is given in the fol-
lowing section.
b. Sensitivity of precipitation typesto the precipitation rate
An important issue is the impact of a varying pre-
cipitation rate on the precipitation types reaching the
surface. A precipitation rate of 1 mm h21 has been used
as the base value to study the sensitivity of the precipi-
tation types to the temperature profile. This assumption
is based on the total accumulation of precipitation and the
hours of precipitation during the second icing period of
the 1998 ice storm in Montreal. However, radar obser-
vations shown in Henson et al. (2007) indicate that the
precipitation rate was not constant during that period; it
fluctuated substantially. For example, radar information
implies an increase of precipitation rate of .5 mm h21
over the Montreal area at 0800 UTC. Thus, sensitivity
tests of the precipitation types relative to the initial snowfall
TABLE 2. Comparison of the surface precipitation types observed (Fig. 6b) with the model results obtained with the NARR temperature
field (Fig. 6a) and the adjusted NARR temperature field (Fig. 8). Here, the symbol ip refers to observed ice pellets.
Time (UTC) 0000 0300 0600 0900 1200 1500
Surface obs zr zr–ip zr–ip ip zr–ip zr–ip
NARR* zr zr–ipA zr zr–lcp rws zr
Adjusted NARR* zr zr–ipA zr–ipA zr–ipA zr–ipA–rws zr–ipA–ipB
* Model results.
FIG. 8. The adjusted temperature field (8C) producing many of
the precipitation types observed at the surface (Fig. 6b) during the
1998 ice storm. The gray lines indicate the temperature field and
the thin black lines are the 08C isotherms. The thick black lines are the
08C isotherms of the unadjusted NARR temperature field (Fig. 6).
1438 J O U R N A L O F A P P L I E D M E T E O R O L O G Y A N D C L I M A T O L O G Y VOLUME 49
rate are carried out here using the temperature profile at
0900 UTC (Fig. 6).
The precipitation types formed from the initial snow-
fall rate depend also on the snow size distribution. The
snow size distribution is assumed to follow an inverse
exponential function defined as
Ns(D
s) 5 N
0sexp(�l
sD
s), (1)
where N0s is the intercept, ls is the slope parameter of
the size distribution, and Ds is the dimension of the snow-
flake’s major axis. Some studies (Sekhon and Srivastava
1970; Brandes et al. 2007) have investigated the varia-
tion of the intercept parameter with both temperature
and precipitation rate. In this initial study, it is assumed
that the intercept of the size distribution, N0s, depends
only on the temperature and does not vary with the pre-
cipitation rate as in Cox (1988). An increase of the mass
of snow initialized aloft, keeping the intercept constant,
decreases the slope and produces larger snowflakes. Four
initial snowfall rates, 1, 2, 5, and 10 mm h21, have been
studied. Only three temperature profiles have been stud-
ied in this section and they are DT 5 08C and DT 5
60.58C.
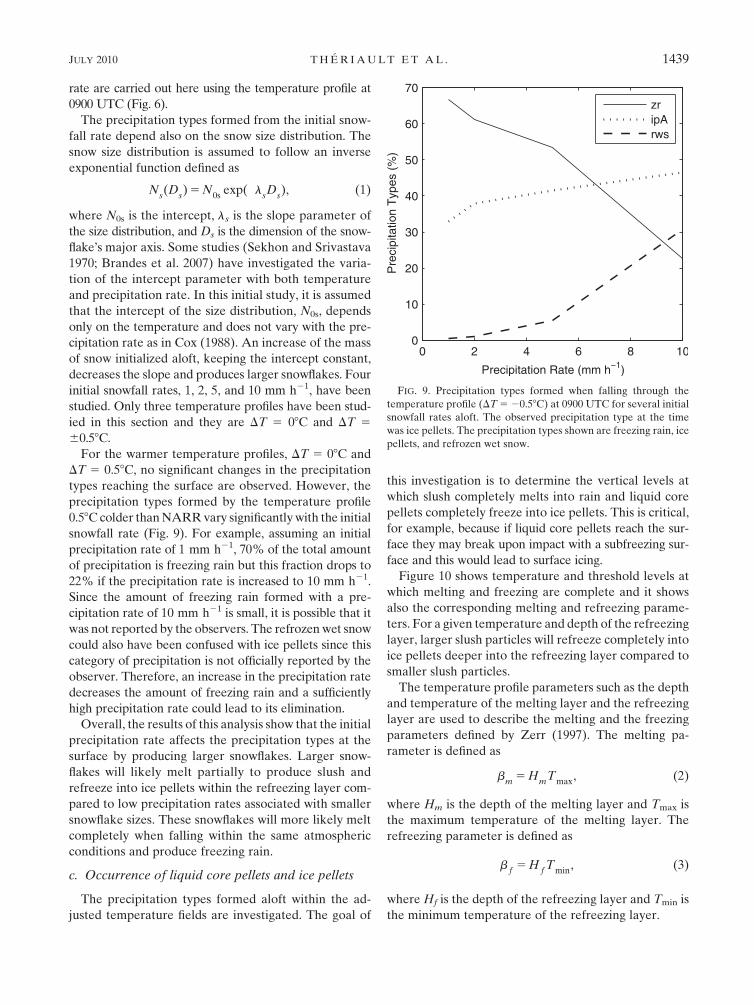
For the warmer temperature profiles, DT 5 08C and
DT 5 0.58C, no significant changes in the precipitation
types reaching the surface are observed. However, the
precipitation types formed by the temperature profile
0.58C colder than NARR vary significantly with the initial
snowfall rate (Fig. 9). For example, assuming an initial
precipitation rate of 1 mm h21, 70% of the total amount
of precipitation is freezing rain but this fraction drops to
22% if the precipitation rate is increased to 10 mm h21.
Since the amount of freezing rain formed with a pre-
cipitation rate of 10 mm h21 is small, it is possible that it
was not reported by the observers. The refrozen wet snow
could also have been confused with ice pellets since this
category of precipitation is not officially reported by the
observer. Therefore, an increase in the precipitation rate
decreases the amount of freezing rain and a sufficiently
high precipitation rate could lead to its elimination.
Overall, the results of this analysis show that the initial
precipitation rate affects the precipitation types at the
surface by producing larger snowflakes. Larger snow-
flakes will likely melt partially to produce slush and
refreeze into ice pellets within the refreezing layer com-
pared to low precipitation rates associated with smaller
snowflake sizes. These snowflakes will more likely melt
completely when falling within the same atmospheric
conditions and produce freezing rain.
c. Occurrence of liquid core pellets and ice pellets
The precipitation types formed aloft within the ad-
justed temperature fields are investigated. The goal of
this investigation is to determine the vertical levels at
which slush completely melts into rain and liquid core
pellets completely freeze into ice pellets. This is critical,
for example, because if liquid core pellets reach the sur-
face they may break upon impact with a subfreezing sur-
face and this would lead to surface icing.
Figure 10 shows temperature and threshold levels at
which melting and freezing are complete and it shows
also the corresponding melting and refreezing parame-
ters. For a given temperature and depth of the refreezing
layer, larger slush particles will refreeze completely into
ice pellets deeper into the refreezing layer compared to
smaller slush particles.
The temperature profile parameters such as the depth
and temperature of the melting layer and the refreezing
layer are used to describe the melting and the freezing
parameters defined by Zerr (1997). The melting pa-
rameter is defined as
bm
5 Hm
Tmax
, (2)
where Hm is the depth of the melting layer and Tmax is
the maximum temperature of the melting layer. The
refreezing parameter is defined as
bf5 H
fT
min, (3)
where Hf is the depth of the refreezing layer and Tmin is
the minimum temperature of the refreezing layer.
FIG. 9. Precipitation types formed when falling through the
temperature profile (DT 5 20.58C) at 0900 UTC for several initial
snowfall rates aloft. The observed precipitation type at the time
was ice pellets. The precipitation types shown are freezing rain, ice
pellets, and refrozen wet snow.
JULY 2010 T H E R I A U L T E T A L . 1439
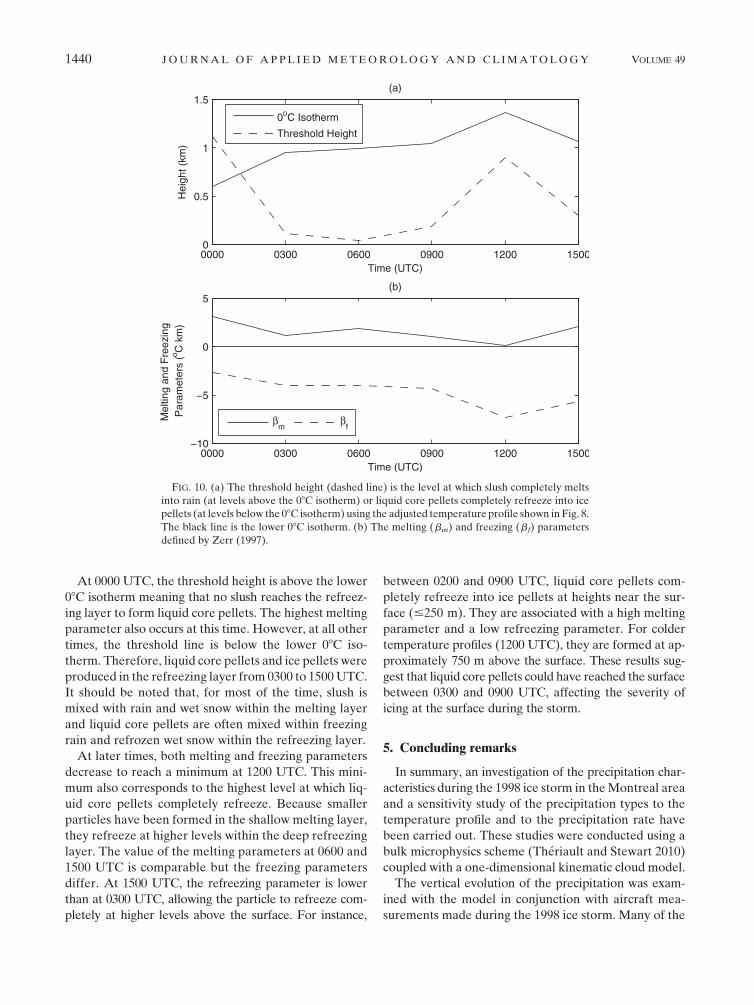
At 0000 UTC, the threshold height is above the lower
08C isotherm meaning that no slush reaches the refreez-
ing layer to form liquid core pellets. The highest melting
parameter also occurs at this time. However, at all other
times, the threshold line is below the lower 08C iso-
therm. Therefore, liquid core pellets and ice pellets were
produced in the refreezing layer from 0300 to 1500 UTC.
It should be noted that, for most of the time, slush is
mixed with rain and wet snow within the melting layer
and liquid core pellets are often mixed within freezing
rain and refrozen wet snow within the refreezing layer.
At later times, both melting and freezing parameters
decrease to reach a minimum at 1200 UTC. This mini-
mum also corresponds to the highest level at which liq-
uid core pellets completely refreeze. Because smaller
particles have been formed in the shallow melting layer,
they refreeze at higher levels within the deep refreezing
layer. The value of the melting parameters at 0600 and
1500 UTC is comparable but the freezing parameters
differ. At 1500 UTC, the refreezing parameter is lower
than at 0300 UTC, allowing the particle to refreeze com-
pletely at higher levels above the surface. For instance,
between 0200 and 0900 UTC, liquid core pellets com-
pletely refreeze into ice pellets at heights near the sur-
face (#250 m). They are associated with a high melting
parameter and a low refreezing parameter. For colder
temperature profiles (1200 UTC), they are formed at ap-
proximately 750 m above the surface. These results sug-
gest that liquid core pellets could have reached the surface
between 0300 and 0900 UTC, affecting the severity of
icing at the surface during the storm.
5. Concluding remarks
In summary, an investigation of the precipitation char-
acteristics during the 1998 ice storm in the Montreal area
and a sensitivity study of the precipitation types to the
temperature profile and to the precipitation rate have
been carried out. These studies were conducted using a
bulk microphysics scheme (Theriault and Stewart 2010)
coupled with a one-dimensional kinematic cloud model.
The vertical evolution of the precipitation was exam-
ined with the model in conjunction with aircraft mea-
surements made during the 1998 ice storm. Many of the
FIG. 10. (a) The threshold height (dashed line) is the level at which slush completely melts
into rain (at levels above the 08C isotherm) or liquid core pellets completely refreeze into ice
pellets (at levels below the 08C isotherm) using the adjusted temperature profile shown in Fig. 8.
The black line is the lower 08C isotherm. (b) The melting ( bm) and freezing ( bf) parameters
defined by Zerr (1997).
1440 J O U R N A L O F A P P L I E D M E T E O R O L O G Y A N D C L I M A T O L O G Y VOLUME 49
precipitation type characteristics observed during the
flight were reproduced by the model with some limita-
tions. This analysis shows that the microphysical pro-
cesses forming the various precipitation types are complex.
For example, melting of wet snow and slush occurred
within the melting layer. In contrast, ice nucleation and
collisional freezing of supercooled drops with ice crys-
tals occurred within the refreezing layer.
The model also has limitations. For instance, the model
did not include cloud droplet formation through the ver-
tical ascent of air. If this factor had been considered, the
initial formation of ice pellets may have led to more ice
crystals being formed through the Hallett–Mossop pro-
cess (Hallett and Mossop 1974). These ice crystals in turn
would have collided with supercooled drops and accel-
erated the formation of ice pellets. It should be noted
that microphysical feedbacks have not been considered
in this study as the aim was to examine the precipitation
types formed within prescribed observed vertical tem-
perature and humidity profiles.
The sensitivity of surface precipitation types to the
vertical profile of temperature was addressed with the
model using the North American Regional Reanalysis
data as a guide for the temperature fields. The selected
time period for the study was during one of the major
icing periods within the 1998 ice storm. It was shown that,
assuming a precipitation rate of 1 mm h21, a tempera-
ture difference in the profile of only 0.58C would have
an important impact on the precipitation types formed
during this catastrophic event. For instance, at 0300 UTC
8 January 1998 a mixture of freezing rain and liquid
core pellets was produced at the surface. If the tem-
perature of this profile were increased by only 0.58C,
only freezing rain would have reached the surface. On
the other hand, a decrease of temperature by 0.58C
changes the precipitation types to a mixture of freezing
rain and ice pellets. Thus, this major event may have been
much less catastrophic if the temperature was only 0.58C
colder.
This sensitivity study also considered the effects of the
initial snowfall rate on surface precipitation types. It was
demonstrated that, within the same temperature profile,
different precipitation rates lead to different types of
precipitation. For instance, in one temperature profile
studied, the total amount of freezing rain is decreased by
a factor of 3 assuming a precipitation rate of 10 mm h21
rather than a precipitation rate of 1 mm h21. In these
calculations, it is assumed that the increase in precipi-
tation rate is associated with an increase in the concen-
tration of large snowflakes, which do not melt as easily in
the melting layer and are more likely to freeze before
reaching the surface. Furthermore, an increase of the
snowflake concentration could cool the temperature
profile until an isothermal layer is formed through the
latent heating of cooling.
Collectively, this analysis illustrates the challenge of
correctly predicting surface precipitation types. Numer-
ous processes can influence the phase and features of
precipitation, including ice multiplication. Such processes
depend critically on, for instance, temperature, relative
humidity, and precipitation size distribution. As well,
small changes in temperature and significant precipita-
tion rate can lead to major variations in the types of
precipitation at the surface.
The sensitivity studies further suggest that liquid core
pellets may have reached the surface during the 1998 ice
storm. These have not been reported by observers but, if
so, this may also have affected the ensuing icing at the
surface. If the shell of such particles cracks, the liquid
would have frozen onto structures. With their attached
ice shell, the nature of the icing would probably be dif-
ferent (rougher) than that caused by freezing rain alone.
The occurrence of liquid core pellets was examined in
relation to the energy available in the melting and re-
freezing layers as indicated by the melting and refreez-
ing parameters. The results show that a high melting
parameter is associated with liquid core pellets refreez-
ing lower in the refreezing layer than those associated
with a low melting parameter. On the other hand, the
refreezing parameter gives an indication of the level at
which the liquid core pellets completely refreeze into ice
pellets. For instance, larger liquid core pellets, associ-
ated with a higher melting parameter, refreeze at a lower
level of the atmosphere than smaller liquid core pellets
for the same refreezing parameter. These parameters
give an indication of the phase and size of precipitation
particles reaching the surface.
Overall, this study has illustrated that, when the tem-
perature is near 08C, forecasting precipitation types re-
quires high precision in the prediction of the temperature
profile and, at times, the precipitation rate. Further-
more, some microphysical processes can occur in the
subfreezing region if key thresholds are reached and
these may also affect the types of precipitation reach-
ing the surface. Such conditions imply that accurately
predicting precipitation types is a major challenge for
operational models.
Acknowledgments. We thank the Natural Sciences
and Engineering Research Council of Canada (NSERC),
Environment Canada, and the Institute for Catastrophic
Lost Reduction (ICLR) for the financial support needed
to accomplish this work. We also thank Georges Isaac for
providing us in-flight data collected during the third Ca-
nadian Freezing Drizzle Experiment. One author (JMT)
JULY 2010 T H E R I A U L T E T A L . 1441
also thanks NSERC, Environment Canada, and McGill
University for postgraduate scholarships.
REFERENCES
Bourgouin, P., 2000: A method to determine precipitation types.
Wea. Forecasting, 15, 583–592.
Brandes, E. A., K. Ikeda, G. Zhang, M. Schonhuber, and
R. M. Rasmussen, 2007: A statistical and physical description
of hydrometeor distributions in Colorado snowstorms using
a video disdrometer. J. Appl. Meteor. Climatol., 46, 634–650.
Cantin, A., and D. Bachand, 1993: Synoptic pattern recognition
and partial thickness technique as a tool for precipitation types
forecasting associated with a winter storm. Tech. Note 93n-
002, Centre Meteorologique du Quebec, 9 pp.
Cober, C. G., G. A. Isaac, and J. W. Strapp, 1995: Aircraft icing
measurements in East Coast winter storms. J. Appl. Meteor.,
34, 88–100.
——, ——, and ——, 2001: Characterizations of aircraft icing en-
vironments that include supercooled large drops. J. Appl. Me-
teor., 40, 1984–2002.
Cox, G. P., 1988: Modelling precipitation in frontal rainbands.
Quart. J. Roy. Meteor. Soc., 114, 115–127.
Crawford, R. W., and R. E. Stewart, 1995: Precipitation type
characteristics at the surface in winter storms. Cold Reg. Sci.
Technol., 23, 215–229.
Derouin, R., 1973: Experimental forecast of freezing level(s), con-
ditional precipitation type, surface temperature, and 50-meter
wind, produced by the planetary boundary layer (pbl) model.
NOAA Tech. Procedures Bull. 101, 8 pp.
Glickman, T., Ed., 2000: Glossary of Meteorology. 2nd ed. Amer.
Meteor. Soc., 855 pp.
Hallett, J., and S. C. Mossop, 1974: Production of secondary ice
particles during the riming process. Nature, 249, 26–28.
Henson, W., R. E. Stewart, and B. Kochtubajda, 2007: On the
precipitation and related features of the 1998 ice storm in
Montreal area. Atmos. Res., 83, 36–54.
Hogan, A. W., 1985: Is sleet a contact nucleation phenomenon?
Proc. Eastern Snow Conf., Montreal, QC, Canada, Eastern
Snow Conference, 292–294.
Isaac, G. A., S. Cober, J. Strapp, A. Korolev, A. Tremblay, and
D. Marcotte, 2001: Recent Canadian research on aircraft in-
flight icing. Can. Aeronaut. Space J., 47, 213–221.
Mesinger, F., and Coauthors, 2006: North American Regional Re-
analysis. Bull. Amer. Meteor. Soc., 87, 343–360.
Milbrandt, J. A., and M. K. Yau, 2005a: A multimoment bulk mi-
crophysics parameterization. Part I: Analysis of the role of the
spectral shape parameter. J. Atmos. Sci., 62, 3051–3064.
——, and ——, 2005b: A multimoment bulk microphysics param-
eterization. Part II: A proposed three-moment closure and
scheme description. J. Atmos. Sci., 62, 3065–3081.
Milton, J., and A. Bourque, 1999: A climatological account of the
January 1998 Ice Storm in Quebec. Tech. Rep., Atmospheric
Sciences and Environmental Issues Division, Environment
Canada, Quebec Region, 87 pp.
Sekhon, R. S., and R. C. Srivastava, 1970: Snow size spectra radar
reflectivity. J. Atmos. Sci., 27, 299–307.
Theriault, J. M., and R. E. Stewart, 2007: On the effect of vertical
air velocity on winter precipitation types. Nat. Hazards Earth
Syst. Sci., 7, 231–242.
——, and ——, 2010: A parameterization of the microphysical
processes forming many types of winter precipitation. J. At-
mos. Sci., 67, 1492–1508.
——, ——, J. A. Milbrandt, and M. K. Yau, 2006: On the simulation
of winter precipitation types. J. Geophys. Res., 111, D18202,
doi:10.1029/2005JD006665.
Zerr, R. J., 1997: Freezing rain: An observational and theoretical
study. J. Appl. Meteor., 36, 1647–1661.
1442 J O U R N A L O F A P P L I E D M E T E O R O L O G Y A N D C L I M A T O L O G Y VOLUME 49


