OECD GLOBAL FORUM ON ENVIRONMENT
Focusing on
SUSTAINABLE MATERIALS MANAGEMENT
25-27 October 2010, Mechelen, Belgium
25-27 October 2010, Mechelen, Belgium
Material Case Study 3:
Wood Fibres
Working Document
OECD Environment Directorate, OECD, 2010
2
NOTE FROM THE SECRETARIAT
In addition to aluminium, critical metals and plastics, wood fibres have been identified as priority
materials for which sustainable management throughout their lifecycle would be accompanied by
significant environmental, social and economic benefits. The objective of this case study on wood fibres is
to analyse the environmental impacts of wood fibres throughout their lifecycle and identify the best
practices for their sustainable management.
This case study will be presented at the OECD Global Forum on Sustainable Materials
Management to be held in Belgium from 25 to 27 October 2010 and, together with the other three case
studies, will serve as a basis for the discussions of Session 1 on Good SMM Practices in Priority
Materials.
This report has been made by a consultancy company, ICF International, Washington DC, USA.
The main authors were: Mr. Adam Brundage, Mr. Christopher Evans, Ms. Deanna Lizas and Mr. Randy
Freed.
This report is work in progress. The opinions expressed in this paper are the sole responsibility of
the author(s) and do not necessarily reflect those of the OECD or the governments of its member countries.
This project was made possible through voluntary contributions from Canada, Finland, Japan,
Spain and Switzerland.
3
TABLE OF CONTENTS
TABLE OF CONTENTS ................................................................................................................................ 3
LIST OF TABLES .......................................................................................................................................... 5
LIST OF FIGURES ......................................................................................................................................... 6
EXECUTIVE SUMMARY ............................................................................................................................. 7
Background .................................................................................................................................................. 7 Objectives .................................................................................................................................................... 7 Results .......................................................................................................................................................... 7 Conclusions .................................................................................................................................................. 8
RÉSUMÉ ....................................................................................................................................................... 10
Contexte ..................................................................................................................................................... 10 Objectif ...................................................................................................................................................... 10 Résultats ..................................................................................................................................................... 10 Conclusions ................................................................................................................................................ 11
GLOSSARY OF ACRONYMS .................................................................................................................... 13
1. INTRODUCTION .................................................................................................................................. 14
2. SCOPE AND OBJECTIVES ................................................................................................................. 16
2.1 Geographic Boundaries ................................................................................................................... 16 2.2 Material Types ................................................................................................................................ 16 2.3 Life-cycle Boundaries ..................................................................................................................... 16 2.4 Waste Management Options ........................................................................................................... 16 2.5 Environmental Impacts ................................................................................................................... 16 2.6 Social and Economic Impacts ......................................................................................................... 17 2.7 Objectives........................................................................................................................................ 17
3. OVERVIEW........................................................................................................................................... 18
3.1 Physical Aspects ............................................................................................................................. 18 3.2 Economic Aspects ........................................................................................................................... 23 3.3 Environmental Aspects ................................................................................................................... 26
4. LIFE-CYCLE ENVIRONMENTAL IMPACTS OF WOOD FIBRES ................................................. 30
4.1 Harvesting, Pulping and Papermaking ............................................................................................ 30 4.1.1 Harvesting .................................................................................................................................. 30 4.1.2 Pulping ....................................................................................................................................... 30 4.1.3 Papermaking .............................................................................................................................. 34
4.2 Transportation ................................................................................................................................. 39 4.3 End-of-life ....................................................................................................................................... 41 4.4 Summary ......................................................................................................................................... 44
4
5. BEST PRACTICES FOR SUSTAINABLE MANAGEMENT OF WOOD FIBRES ........................... 46
5.1 Harvesting ....................................................................................................................................... 47 5.2 Pulping ............................................................................................................................................ 49
5.2.1. Energy Use and GHG Emission Reduction Opportunities .................................................... 49 5.2.2. Chemical Pulping Energy and Water Use Reduction Opportunities ..................................... 51 5.2.3. Energy and Water Use Reduction Opportunities in Mechanical Pulping ............................. 54 5.2.4. Water Use Reduction Opportunities ...................................................................................... 55
5.3 Papermaking.................................................................................................................................... 56 5.4 Transportation ................................................................................................................................. 57
5.4.1 Decreased Transportation Distances for Wood Fibre to Pulp and Paper Mills ......................... 57 5.4.2 Increased Use of Rail versus Truck for Transportation Mode and/or increased Truck Fuel
Efficiency ............................................................................................................................................... 58 5.4.3 Supply Chain Optimisation ....................................................................................................... 58
5.5 End-of-life ....................................................................................................................................... 58
6. DRIVERS AND BARRIERS TO SUSTAINABLE MANAGEMENT OF WOOD FIBRES .............. 61
6.1 Technical Drivers and Barriers ....................................................................................................... 61 6.2 Economic Drivers and Barriers ....................................................................................................... 63 6.3 Social Drivers and Barriers ............................................................................................................. 67 6.4 Assessment of Impacts of Technical, Economic and Social Drivers and Barriers on Best
Management Practices ............................................................................................................................... 70
7. CONCLUSIONS .................................................................................................................................... 76
7.1 Trends ............................................................................................................................................. 76 7.2 Opportunities ................................................................................................................................... 76 7.3 Key Barriers to SMM ...................................................................................................................... 79
REFERENCES .............................................................................................................................................. 80
5
LIST OF TABLES
Table 3.1: Pulp for paper trade as of 2003 .................................................................................................. 24 Table 3.2: Paper and paperboard trade as of 2003 ...................................................................................... 25 Table 3.3: Recovered paper trade as of 2003 .............................................................................................. 25 Table 3.4: Global GHG emissions from harvesting for the pulp and paper industry,
pulping and paper manufacturing, relative to direct and indirect emissions from the entire
forest products industry ....................................................................................................................... 27
Table 3.5: Typical Water Use (mean effluent flow) per tonne of final product .......................................... 28 Table 4.1: Major sources of total energy consumption in chemical pulping ............................................... 32 Table 4.2: Ratio of process heat consumption to electricity consumption for different pulp
and paper mills .................................................................................................................................... 33 Table 4.3: Energy use for pulp from recovered paper ................................................................................. 34 Table 4.4: GHG emissions estimates for the manufacturing of different paper types made
from virgin pulp and recovered fibre pulp ........................................................................................... 36 Table 4.5: GHG-intensity of fuels ............................................................................................................... 37 Table 4.6: Releases to water from chemical (kraft) pulping and sources of water use ............................... 38 Table 4.7: Releases to water and water use across various pulp and papermaking processes,
European mills ..................................................................................................................................... 39 Table 4.8: Fuel efficiency and carbon emission factors for transport modes .............................................. 40 Table 4.9: Trade flow for major trade routes for pulp, paper and recovered paper ..................................... 41 Table 4.10: Net GHG emissions via waste management pathways based on U.S.-specific
data (tonnes CO2e/tonne) ..................................................................................................................... 42 Table 4.11: Net energy via alternative waste management pathways based on U.S.-specific
data (GJ/tonne) .................................................................................................................................... 42 Table 4.12: GHG emissions via waste management options based on European data ............................... 42 Table 4.13: Summary of environmental impacts for pulp, papermaking and transportation
across different paper types and regions .............................................................................................. 44 Table 4.14: Summary of environmental impacts for end-of-life management of pulp and
paper products across Europe and North America .............................................................................. 45 Table 5.1: Summary of technologies and management practices that contribute to SMM ......................... 46 Table 5.2: Certified forest area by scheme and region as of December 2006 (million hectares) ................ 48 Table 5.3: Potential practices for reducing energy use, GHG emissions and water use
during chemical pulping ...................................................................................................................... 51 Table 5.4: Potential practices for reducing energy use, GHG emissions and water use
during mechanical pulping .................................................................................................................. 56 Table 5.5: Sample of potential practices for reducing energy use, GHG emissions and
water use during papermaking ............................................................................................................. 57 Table 6.1: Average overall net recycling system costs................................................................................ 66 Table 6.2: Summary of specific drivers/barriers as they affect best management practices
in the wood fibres industry .................................................................................................................. 71

6
LIST OF FIGURES
Figure 3.1: Life-cycle diagram of the entire paper system from manufacture to end-of-life ...................... 19 Figure 3.2: World paper production and application as of 2004 ................................................................. 20 Figure 3.3: End use application of world‘s paper in 2004 ........................................................................... 22 Figure 3.4: Paper recovery rates in selected countries as of 2007 ............................................................... 23 Figure 3.5: Main trade flows of wood products as of 2003 ......................................................................... 24 Figure 3.6: Sources of imported recovered paper fibre to China as of 2006 (tonnes) ................................. 26 Figure 4.1: Total energy use for sulphite and kraft pulping processes in current U.S. mills,
and energy use using BAT .................................................................................................................. 31 Figure 4.2: Total energy use in kraft pulping process, modern European mills .......................................... 32 Figure 4.3: Total energy use in mechanical pulping process, current and BAT at U.S. mills ..................... 33 Figure 4.4: Total energy use in the papermaking process, current and BAT at U.S. mills. ........................ 35 Figure 4.5: Total energy use in the papermaking process, modern non-integrated European mills............ 35 Figure 5.1: Certified forest area for select countries ................................................................................... 49 Figure 6.1: Energy efficiency (electricity and heat combined) of pulp and paper industries
in 2003, for various countries, versus the average industrial electricity price between
1999 and 2003. The amount of chemical and mechanical pulp produced in each
country is denoted by the size of each circle. ...................................................................................... 64

7
EXECUTIVE SUMMARY
Background
This study seeks to identify opportunities for sustainable materials management (SMM) of wood
fibres (i.e. pulp and paper products). The pulp and paper industry is a key sector in the global economy
with substantial opportunities to reduce energy use, greenhouse gas (GHG) emissions and water use
throughout the fibre product life-cycle.
The report first provides an overview of the important physical, economic and environmental aspects
of the life-cycle of fibre products. Next, it describes energy use, GHG emissions and water use across the
fibre life-cycle including harvesting, pulping, papermaking, transportation and end-of-life in order to
identify where environmental impacts are the largest. The study focuses on mechanical and chemical pulps
that include kraft, newsprint, coated and uncoated paper, tissue and specialty paper, boxboard and
paperboard. It considers recycling, combustion with energy recovery and landfilling as primary options for
end-of-life management. Life-cycle data are compiled from North American and European sources.
The study identifies technologies and management practices that could reduce environmental impacts
across the wood fibre life-cycle in order to evaluate where substantial opportunities exist for SMM. It also
discusses key drivers of SMM within the fibres industry that promote key management practices and
technologies and barriers to SMM that impede their implementation.
Objectives
This case study intends to offer policy makers an improved understanding of i) current state of the
life-cycle of wood fibres, with a focus on associated environmental impacts and consideration of economic
and social issues; ii) most promising SMM practices at different life-cycle stages of fibre products; iii) key
practices and life-cycle stages that could reduce environmental impacts across the wood fibre life-cycle;
and (iv) drivers and barriers that facilitate or hamper the rate at which SMM practices are adopted.
Results
The report finds that reductions in energy use on the order of 20 to 30% could be achieved in
conventional pulp mills with existing technologies. Chemical and thermo-mechanical pulp mills offer the
greatest potential for energy savings. Paper drying is the most energy-intensive process across the life-
cycle, consuming 15 to 25% of total energy.
Chemical pulping can be roughly twice as water-intensive as mechanical pulping. Reductions in water
use on the order of 25 to 50% are possible in conventional mills using technologies such as dry debarking,
partial or full closure of certain water loops, washing system improvements and elemental chlorine-free
(ECF) or enzymatic bleaching.
Increased and more efficient use of biomass energy—considered to have zero net GHG emissions if
sourced from sustainably managed forests—can mitigate GHG emissions. Sustainable forest management
practices and certification are essential to ensuring that biomass fuels remain carbon neutral.

8
The transportation component of the life-cycle is a relatively small contributor to energy use, GHG
emissions and water use. Nonetheless, opportunities exist, such as optimization of supply chains in order to
reduce distances, coupled with improvement in the efficiency of transportation.
At end-of-life, recycling paper products saves 7 to 19 GJ of energy per tonne of paper recycled and
results in GHG emission reductions relative to the virgin manufacture of paper. Focusing on improving
recovered paper collection efficiency, reducing the rates of contamination and developing new
technologies and pulping processes can enable even greater efficiencies in the utilization of recovered
paper.
Although overall energy use is lower in recycling paper, GHG emissions from the manufacturing
stage can be larger due to the fossil energy used in recycled mills compared to the low- or zero-carbon
biomass energy used in virgin paper production. Even so, the GHG reductions from avoided fibre
landfilling more than outweigh the additional GHG emissions from recycled paper manufacture and the
overall GHG profile for recycling paper could be even more beneficial if biomass and other non-fossil fuel
sources are used in the manufacture of recycled paper.
Combustion facilities in OECD countries normally employ energy recovery systems, so fibre discards
sent to these facilities can produce electricity for the grid, potentially displacing fossil electricity
generation.
Pulp and paper discards and residues that are sent to landfills generate GHG emissions in the form of
methane and represent a significant portion of the GHG emissions associated with the pulp and paper life-
cycle. Therefore, it is most important to divert paper which has high methane generation potential from
disposal in landfills.
Finally, across the entire life-cycle, source reduction of paper – in practices such as lightweighting
packaging, double-sided printing and copying and paper re-use – offers a comprehensive approach to
reducing the size of the environmental footprint.
Conclusions
The wood fibre products industry is a heavy manufacturing sector in terms of consumption of natural
resources and energy. Paper and paperboard consumption is expected to increase, particularly in emerging
markets such as China and India, so this industry has the potential to increase the size of its already large
environmental footprint.
The study finds that technical, economic, social and political barriers exist that impede adoption of
technologies and practices that contribute to SMM. Technical barriers include slow rates of capital
turnover, while high capital costs and volatility in energy and recovered paper prices are key economic
barriers. Social and political barriers facing the industry involve gaps in information sharing, a lack of
resources to promote SMM opportunities and weak enforcement of regulated practices as well as current
insufficiency of policies that require SMM.
At the same time, important opportunities are available for reducing energy use, GHG emissions and
water use across the entire fibre life-cycle. From a carbon management perspective, the wood fibre
industry actively manages larger carbon stocks and greater annual carbon throughput than any other
industries except oil & gas, organic chemicals, coal, electric power and agriculture. Excluding agriculture,
pulp and paper sector is unique among industries in terms of its management of substantial quantities of
biogenic carbon. Ultimately, the GHG emissions profile of the pulp and paper industry is dictated by i) the
management practices at forests from which biomass is utilised (i.e. whether they are sustainably managed

9
or not); ii) the GHG-intensity of other fuels use to generate process heat and electricity; and iii) the
management of fibre products at end-of-life.
Given the increased attention on reducing energy use, GHG emissions and water use globally and
considering that OECD member countries produce and consume the majority of the world‘s paper, the
opportunities for SMM of wood fibres outlined in this study represent key elements in OECD‘s portfolio of
options to support its member countries in developing and implementing such SMM goals.
10
RÉSUMÉ
Contexte
Cette étude vise à identifier les opportunités de gestion durable des matières (GDM) dans le secteur
mettant en œuvre des fibres de bois (c‘est-à-dire des pâtes à papier et papiers). L‘industrie des pâtes et
papiers est un secteur clé de l‘économie mondiale, qui offre des gisements importants de réduction de la
consommation d‘énergie, des émissions de gaz à effet de serre (GES) et de la consommation d‘eau, tout au
long du cycle de vie des fibres.
Le rapport présente tout d‘abord un aperçu général des principaux aspects physiques, économiques et
environnementaux du cycle de vie des produits à base de fibres. Il décrit ensuite la consommation
d‘énergie, les émissions de GES et la consommation d‘eau tout au long du cycle de vie de ces produits –
récolte, mise en pâte, fabrication du papier, transport et fin du cycle de vie – de façon à identifier les étapes
du cycle où les impacts environnementaux sont les plus importants. L‘étude est axée sur les pâtes
mécaniques et chimiques qui comprennent le papier kraft, le papier journal, le papier couché et non
couché, le papier-mouchoir et le papier pour usages spéciaux, et le carton. Le recyclage, l‘incinération avec
valorisation énergétique et la mise en décharge sont les principales solutions examinées pour la gestion des
produits en fin de vie. Les données relatives au cycle de vie sont compilées à partir de sources nord-
américaines et européennes.
Pour évaluer où se trouvent les possibilités importantes de GDM, cette étude recense les technologies
et les pratiques de gestion de nature à réduire les impacts environnementaux tout au long du cycle de vie
des fibres de bois. Elle examine aussi les principaux éléments moteurs qui, dans l‘industrie mettant en
œuvre les fibres, encouragent les pratiques et technologies clés pour la gestion durable des matières, ainsi
que les obstacles qui en freinent l‘application.
Objectif
Cette étude de cas a pour objectif de permettre aux décideurs de mieux cerner i) la situation actuelle
concernant le cycle de vie des fibres de bois, et plus particulièrement ses impacts environnementaux ainsi
que les aspects économiques et sociaux qui lui sont associés ; ii) les pratiques de GDM les plus
prometteuses aux différentes étapes du cycle de vie des produits à base de fibres ; iii) les pratiques clés et
les étapes du cycle de vie permettant de réduire les impacts environnementaux tout au long de la durée de
vie des fibres de bois; et (iv) les moteurs et obstacles qui accélèrent ou freinent le rythme d‘adoption des
pratiques de GDM.
Résultats
Il ressort de l‘étude que les usines productrices de pâtes mécaniques peuvent réduire leur
consommation d‘énergie de 20 à 30 % avec les technologies existantes. Mais ce sont les usines de pâtes
chimiques et thermomécaniques qui offrent le gisement d‘économies d‘énergie le plus important. Le
séchage du papier est le processus le plus énergivore du cycle de vie, puisqu‘il consomme entre 15 et 25 %
de l‘énergie totale.
La fabrication des pâtes chimiques peut consommer près de deux fois plus d‘eau que celle des pâtes
mécaniques. Des réductions de l‘ordre de 25 à 50 % de la consommation d‘eau sont possibles dans les
usines classiques en recourant à des techniques comme l‘écorçage à sec, à la fermeture partielle ou totale
de certains circuits d‘eau, à l‘amélioration des systèmes de lavage, et au blanchiment sans chlore
élémentaire (SCE) ou au blanchiment enzymatique.
11
Les émissions de GES peuvent être atténuées par une utilisation accrue et plus rationnelle de l‘énergie
de la biomasse – considérée comme sans émissions nettes de GES si elle est issue de forêts faisant l‘objet
d‘une gestion durable. Les pratiques de gestion durable des forêts et leur certification sont indispensables
pour garantir que les combustibles issus de la biomasse restent neutres en carbone.
L‘étape « transports » du cycle de vie représente une part relativement faible de la consommation
d‘énergie, des émissions de GES et de la consommation d‘eau. Néanmoins, il existe des gisements
d‘économies, notamment en optimisant les chaînes d‘approvisionnement pour réduire les distances et en
améliorant l‘efficacité des transports.
A la fin du cycle de vie, le recyclage des produits à base de papier permet d‘économiser entre 7 et 19
GJ d‘énergie par tonne de papier recyclé et de réduire les émissions de GES par rapport aux fibres neuves.
L‘utilisation des papiers récupérés peut être rendue encore plus efficace en optimisant la collecte des vieux
papiers, en réduisant les taux de contamination, et en développant de nouvelles technologies et de
nouveaux procédés de fabrication de la pâte.
Même si la consommation globale d‘énergie est plus faible pour le papier recyclé, les émissions de
GES produites au stade de sa fabrication sont plus importantes car les usines mettant en œuvre des fibres
de récupération utilisent de l‘énergie fossile, alors que les usines utilisant des fibres neuves consomment de
l‘énergie de la biomasse sans émissions nettes de GES ou à émissions faibles. Pourtant, même dans ces
conditions, les réductions de GES résultant de la non-mise en décharge font plus que compenser les
émissions supplémentaires de GES provenant de la fabrication de papier recyclé. En outre, le profil global
des émissions de GES du papier recyclé pourrait être encore amélioré en utilisant de la biomasse et
d‘autres sources de combustibles non fossiles pour le fabriquer.
Les installations d‘incinération des pays de l‘OCDE étant généralement équipées de systèmes de
valorisation énergétique, les rebuts de fibres envoyés dans ces installations permettent de produire pour le
réseau public une électricité qui pourrait remplacer l‘électricité d‘origine fossile.
Les rebuts et résidus de pâtes et papiers qui sont mis en décharge émettent du méthane et, de ce fait,
représentent une part importante des émissions de GES associées au cycle de vie des pâtes et papiers. Il est
donc indispensable d‘éviter la mise en décharge de papiers dont le potentiel de production de méthane est
élevé.
Enfin, sur l‘ensemble du cycle de vie, la réduction à la source des papiers – sous forme d‘emballages
légers, d‘impressions et de photocopies recto-verso et de papier recyclé – constitue une solution globale de
réduction de l‘empreinte écologique.
Conclusions
Le secteur des produits à base de fibres de bois est une industrie manufacturière lourde en termes de
consommation de ressources naturelles et d‘énergie. La consommation de papiers et de cartons étant
appelée à augmenter, en particulier dans les marchés émergents de la Chine et de l‘Inde, ce secteur risque
d‘accroître encore son empreinte écologique qui est déjà importante.
Cette étude fait apparaître qu‘il existe des obstacles techniques, économiques, sociaux et politiques
qui freinent l‘adoption de technologies et de pratiques contribuant à la GDM. Parmi les obstacles
techniques figure la lenteur du renouvellement des équipements, tandis que les obstacles économiques
comprennent notamment le niveau élevé des coûts d‘équipements et la volatilité des prix de l‘énergie et
des papiers récupérés. S‘agissant des obstacles sociaux et politiques, l‘industrie est confrontée, entre autres,
à un déficit d‘échange d‘informations, à un manque de ressources pour promouvoir les possibilités de
12
GDM et à une mise en œuvre peu rigoureuse des pratiques réglementées, ainsi qu‘à un nombre insuffisant
de mesures prescrivant une gestion durable des matières.
Parallèlement, il existe d‘importants gisements de réduction de la consommation d‘énergie, des
émissions de GES et de la consommation d‘eau dans l‘ensemble du cycle de vie des fibres. S‘agissant du
carbone, le secteur mettant en œuvre des fibres de bois gère activement des stocks de carbone plus élevés
et une production annuelle de carbone plus importante que toute autre industrie, à l‘exception des secteurs
du pétrole et du gaz, de la chimie organique, du charbon, de l‘électricité et de l‘agriculture. Hormis le
secteur agricole, l‘industrie des pâtes et papiers est sans équivalent pour ce qui est de sa gestion de
quantités importantes de carbone d‘origine biologique. Enfin, le profil des émissions de GES du secteur
des pâtes et papiers est fonction i) des pratiques de gestion des forêts dont on utilise la biomasse (c‘est-à-
dire de leur gestion durable ou non) ; ii) de l‘intensité en GES des autres combustibles utilisés pour
produire de la chaleur industrielle et de l‘électricité ; et iii) de la gestion des produits à base de fibres de
bois à la fin de leur cycle de vie.
Compte tenu de l‘attention accrue portée à la réduction de la consommation d‘énergie, des émissions
de GES et de la consommation d‘eau à l‘échelle mondiale, et étant donné que les pays membres de
l‘OCDE produisent et consomment la majeure partie du papier mondial, les possibilités de GDM dans le
secteur des produits à base de fibres de bois, présentées dans cette étude, constituent des éléments clés de
la panoplie d‘options envisageables par l‘OCDE pour aider ses pays membres à définir et mettre en œuvre
des objectifs de gestion durable des matières.
13
GLOSSARY OF ACRONYMS
Adt Air-dry tonne
AF&PA American Forest & Paper Association
BAT Best available technologies
BMP Best management practices
CCS Carbon capture and sequestration
CEPI Confederation of European Paper Industries
CHP Combined heat and power
CO2e Carbon dioxide equivalent
CSA Canadian Standard Association
CTMP Chemo-thermo-mechanical pulp
EC European Commission
ECF Elemental chlorine-free
EDF Environmental Defense Fund
EMS European Modular System
EPA U.S. Environmental Protection Agency
ERP Enterprise Resource Planning
ETC European Topic Centre
FAO Food and Agricultural Organisation
FPAC Forest Products Association of Canada
FSC Forest Stewardship Council
GHG Greenhouse gas
GJ Gigajoule
ICFPA International Council of Forest and Paper Associations
IEA International Energy Agency
IPCC Intergovernmental Panel on Climate Change
IPST Institute of Paper Science and Technology
MJ Megajoule
MtCO2e Megatonnes of carbon dioxide equivalent
N Nitrogen
NCASI National Council for Air and Stream Improvement
OECD Organisation for Economic Co-operation and Development
P Phosphorous
PEFC Programme for the Endorsement of Forest Certification
REACH
Registration, Evaluation, Authorisation and Restriction of Chemical
Substances
SFI Sustainable Forestry Initiative
SFM Sustainable forest management
SMM Sustainable materials management
TCF Total chlorine-free
TMP Thermo-mechanical pulp
UNCED United Nations Conference on Environment & Development
VDP Verband Deutscher Papierfabrikin
WBSCD World Business Council for Sustainable Development
WRAP Waste & Resources Action Programme

14
1. INTRODUCTION
1. The global pulp and paper industry is one of the most important sectors of the global economy,
employing approximately 13 million people across nearly 200 nations and providing a wide range of
essential products used in communications, packaging, sanitation and construction (ICFPA, 2007). Almost
400 million tonnes of paper are produced and consumed annually worldwide (CEPI, 2007a). The average
global citizen alone consumes roughly 58 kg of paper per year with the Organisation for Economic Co-
operation and Development (OECD) member countries consuming even considerably more per capita
(VDP, 2008a). In 2000 the gross value added by the forest sector (including wood industries, pulp and
paper) contributed to 1.2% of the global gross domestic product (FAO, 2005).
2. The market for paper and board is projected to grow globally at 2.3% per year to 2030, with
particularly rapid increases in developing and emerging economies (OECD, 2008). Most likely, the growth
of the market for paper and paperboard in emerging economies (particularly in Southeast Asia) will change
the current pattern of trade flows described earlier in this report.
3. Currently, the confluence of slow global economic growth and high capital costs has lowered
profitability within the pulp and paper sector. The sector is also vulnerable to a weakening demand for
printing and publishing, which the continued rise of electronic media may affect. Alternative materials for
packaging, such as plastic, steel and aluminium create other challenges for the pulp and paper sector.
4. The importance of this industry is characterised by its intensive use of energy and natural
resources in the production and distribution of its many products. The pulp and paper industry is the fourth
largest industrial consumer of energy representing 5.7% of global industrial energy use (IEA 2006).
Unique characteristics of the pulp and paper industry are that it generates roughly 50% of its own energy
needs through biomass fuel use (IEA, 2006), it produces products from renewable raw materials and these
products can be readily recycled. This industry and its products are responsible for nearly 600 million
tonnes of carbon dioxide-equivalent (CO2-e) emissions per year (NCASI, 2007a). This accounts for
approximately 2% of global CO2 emissions (IPCC, 2007).1
5. Given the industry‘s size and economies‘ dependence on it for livelihood and products, combined
with the industry‘s reliance and impact on vast natural resources and the climate, it is an excellent
candidate for review in the context of Sustainable Materials Management (SMM). Considering that OECD
member countries produce and consume the majority of the world‘s paper, the purpose of this report is to
explore and identify the most promising opportunities for Sustainable Materials Management (SMM) of
wood fibres (i.e. pulp and paper products) for OECD member countries.
6. At the first OECD workshop on SMM in 2005, a working definition was developed for SMM.
The working definition states that ―SMM is an approach to promote sustainable materials use, integrating
1 In this report, unless otherwise indicated, statistics on greenhouse gas emissions are given in accord with the
accounting conventions used by the Intergovernmental Panel on Climate Change. Thus, the CO2 emissions
associated with burning biomass fuel from sustainably harvested sources do not ―count‖ as anthropogenic greenhouse
gas emissions. Unless otherwise stated, wood fibre products are assumed to originate from sustainable forestry (i.e.
forest growth is in balance with harvesting and decomposition).
15
actions targeted at reducing negative environmental impacts and preserving natural capital throughout the
life-cycle of materials, taking into account economic efficiency and social equity‖ (OECD, 2005).
7. The main objective of the second workshop held in 2008 was to identify possible barriers and
challenges when developing SMM strategies and policies and explore what role the OECD can play in
supporting this process. Conclusions were then drawn on how to increase awareness of SMM and on how
the OECD can assist its member countries to develop SMM policies, while accounting for economic
efficiency and social equity.
8. This report is one of a series of case studies that examine the role of SMM in different material
industries including aluminium, critical metals, wood fibres and plastics. These case studies will provide
input to OECD‘s Global Forum on SMM to be held in October 2010.
9. This case study focuses on wood fibres for the following reasons:
1. Opportunities exist to reduce energy use, GHG emissions and water use throughout the wood
fibre product life-cycle especially considering unique issues such as carbon sequestration in
managed forests and fibre products, the extensive use of biomass and forest wastes as an energy
source and the importance of end-of-life waste management;
2. Wood fibre products form a significant fraction of the waste stream, contributing to over 30% of
generated waste in OECD countries and therefore fibre products have a significant impact on the
environment and the economy in general; and
3. Wood fibre products constitute a renewable resource with a stable, established market.
10. Section 2 of the report establishes the scope of this case study. Section 3 provides an overview of
the wood fibre life-cycle including international trade and the general production process. Section 4
provides detailed description of energy use, GHG emissions and water use across the fibre life-cycle.
Section 5 discusses the specific SMM practices that offer a significant opportunity to realise
environmental, economic and/or social benefits in the management of fibres. Section 6 identifies the
drivers that can promote these practices and the barriers that may impede their implementation. Finally,
Section 7 provides trends in pulp and paper markets and concludes key opportunities and technical,
economic and political barriers for intervention in order to promote SMM of wood fibres.

16
2. SCOPE AND OBJECTIVES
11. This section outlines the scope and objectives of this case study.
2.1 Geographic Boundaries
12. The investigation of the pulp and paper life-cycle, including environmental impacts, is limited
geographically to OECD member countries. Life-cycle data collected for the assessment come from North
American and European sources. To investigate the international flows of fibres, the report focuses on
major trade flows based on the import and export of pulp, paper and recovered paper.
2.2 Material Types
13. Due to nomenclature variations from different sources, it is difficult to compare and delineate
between distinct paper types. Although detailed data on specific paper types are compiled by various
countries and companies, this information is inconsistent in its taxonomy of paper types, or, in many cases,
not publicly available. Therefore, this case study focuses on the broader range of paper types made from
both mechanical and chemical pulp including kraft, newsprint, coated and uncoated paper, tissue and
specialty paper, boxboard and paperboard.
2.3 Life-cycle Boundaries
14. The life-cycle stages of wood fibre products considered in this report include: i) raw material
harvesting, pulping and paper production; ii) transportation associated with raw material input and delivery
to end-use markets; and iii) end-of-life. Printing, publishing and conversion processes—such as folding
boxes and cartons—were not included. The use phase of fibre products is not considered by this study
given that the environmental, economic and social impacts during that stage are relatively minor and the
opportunities for SMM practices are primarily within the manufacturing stages and at end-of-life.
2.4 Waste Management Options
15. This report considers recycling, combustion with energy recovery (or waste-to-energy
incineration) and landfilling (without landfill gas capture and with landfill gas capture for energy
production) as the primary options for end-of-life management of fibre products. Composting was not
included in the study, as it is not currently a common option for management of fibre products at their end-
of-life.
2.5 Environmental Impacts
16. This study uses a literature survey of sources relevant to the manufacturing, transport and
disposal of fibre products to evaluate the life-cycle environmental impacts. Though the wood fibre product
life-cycle involves all kinds of environmental impacts, the study focuses on the areas where impacts are the
most significant in terms of resource consumption and emissions: energy use, greenhouse gas (GHG)
emissions and water use. Good SMM practices in pulp and paper making plants may thus have a positive
influence on climate change, water pollution and resource consumption. Other impacts include local air
pollution and smog formation from the combustion of fuels for energy, human toxicity, ecotoxicity and
17
ozone depletion. In general, there is less readily-available life-cycle data on these impact categories. Also,
in the context of the wood fibres life-cycle, these impacts were judged to be secondary given the fact that
the pulp and paper industry is energy intensive, manages large stocks of carbon and consumes significant
quantities of water during bleaching and papermaking.
2.6 Social and Economic Impacts
17. The social and economic impacts of SMM in the pulp and paper industry are considered briefly
in this assessment, although not as rigorously as the environmental impacts due to limited availability or
access to information. Certain social impacts, however, such as job creation and employment benefits,
have been studied in detail. The social and economic drivers and barriers of achieving best management
practices (BMPs) to enhance SMM in the pulp and paper industry are discussed.
2.7 Objectives
18. The main objective of this case study is to offer policy makers an improved understanding of i)
current state of the life-cycle of wood fibres and their environmental, economic and social impacts; ii) most
promising SMM practices at different life-cycle stages of fibre products; iii) key practices and life-cycle
stages on which OECD member states can focus to promote environmental, economic and social benefits
through SMM practices; and iv) drivers and barriers that facilitate or hamper the rate at which SMM
practices are adopted in the fibre industry.
18
3. OVERVIEW
19. This section provides an overview of the important physical, economic and environmental
aspects of the life-cycle of fibre products. It first summarises the physical flows of wood resources, pulp
and fibre products, including information on regional and international flows of pulp, paper and recovered
paper resources. To the extent that information is available, economic flows from the global trade of forest
products and recycled fibres are also summarised. The impacts of these economic issues on the trade of
paper, the effects on recycling and waste flows and environmental issues are briefly discussed to set the
context for the next section.
3.1 Physical Aspects
20. In order to produce paper products, the manufacturing process consists of extracting cellulose
fibres from trees into relatively thin, homogenous end products through various stages including pulping,
bleaching and papermaking. As a result, the wood fibre products industry is a heavy manufacturing sector,
especially in the consumption of natural resources. Globally, the consumption of coniferous and non-
coniferous based industrial round wood (which comprises pulpwood, veneer logs, chips, particles and
wood residues) for wood and wood products amounts to roughly 1,592 million m3 (FAO, 2005). The world
consumes about 900 million tonnes of wood each year for wood-based commodities.2 In Europe alone,
roughly 120 million tonnes of wood resources were consumed for pulp and paper production in 2007
(CEPI, 2007a).
21. In terms of paper production processes, experts indicate that individual paper mills are highly
variable, even mills that produce the same paper type (IEA, 2007). No standardised paper mill exists and
thus comparisons across mills or paper types should be interpreted cautiously. However, recognizing that
the wood fibre industry, particularly the pulp and paper industry, is complex, there are general stages
involved in the production of paper beginning with raw material harvesting. The following figure
represents a schematic of the overall life-cycle stages of the paper system including end-of-life
(Figure 3.1).
2 Assuming an average density of 0.575 tonnes/m
3.

19
Figure 3.1: Life-cycle diagram of the entire paper system from manufacture to end-of-life Source: (ETC, 2004)
22. The main raw material for producing paper is wood, with the preferred variety generally being
coniferous wood due to its longer fibres. The vast majority (95%) of pulp is produced using wood as a raw
material base. Non-wood raw materials such as certain crops (flax or hemp) and agricultural residues (like
sugar cane bagasse) make up the remainder of raw materials used for pulp production (EDF, 1995a).The
wood comes primarily from forest thinning operations. Importantly, wood chips from the sawmill industry
are used as ingredients in the pulping process.

20
23. The three major categories of underlying ―feedstock‖ for paper manufacture are wood pulp, non-
wood pulp and recovered paper pulp. The processes to generate pulp primarily involve mechanical
pulping, chemical pulping and recovered paper pulping (mostly a mechanical process) (Figure 3.2).
Figure 3.2: World paper production and application as of 2004 Source: (IEA, 2007)
24. Mechanical pulping is a process in which cellulose fibres are physically separated from the wood
raw material. The global production of mechanical pulp represents roughly 20% of total wood pulp,
although Canada alone represents more than one-third of global mechanical wood pulp production (IEA,
2007). First, the debarked logs are ground down using stone cutters into fibres 1-4 mm long and mixed
with hot water. The ratio of short and long fibres determines the pulp quality. The pulp is subsequently
screened and refined with the addition of mostly wood chips. Depending on the ultimate type of paper
being created, at this stage, the pulp may be bleached. Within the refining process, additional industry
developments have allowed for a more efficient process of breaking down and refining wood into fibres.
With the thermo-mechanical refining process (TMP), pre-steaming the wood chips allows for lignin
removal and easier transition into longer fibres. In the chemo-thermo-mechanical (CTMP) refining
process, chemicals are introduced that ensure lignin removal, again translating into higher proportion of
long fibre production. The material efficiency of mechanical pulp is superior to chemical pulp. Its final
yield is roughly 90-95 kg of pulp produced from 100 kg of wood material (VDP, 2008b).
25. Chemical pulping, also known as kraft pulping, is a process in which the wood fibres are isolated
by removing the surrounding lignin in the wood raw material. The global production of chemical pulp
represents over 70% of total wood pulp with the United States alone generating more than one-third of the
world‘s chemical wood pulp (IEA, 2007). Wood is broken down into wood chips and heated with water
and chemicals to ensure a breakdown of the lignin and a smooth transition of the wood chips into long
fibres. After this step, the pulp is refined and thickened and at this stage sometimes bleached. Compared to

21
mechanical pulping, chemical pulp is higher quality since most of the fibres are longer and more uniform
in length. Other chemical pulps (such as higher grade chemical pulps) are produced for special product
types. The chemical pulp yield is significantly less than mechanical pulping (only 50 kg of pulp produced
from 100 kg of wood material). This is because the kraft processes extract the lignin present in the wood
raw material.
26. Due to the sheer volume of recovered paper pulp (compared to virgin wood pulp), recovered
paper pulp has its own separate process although it is primarily a mechanically based pulping process. The
usability of recovered paper in the recycling process is determined by the amount of contaminants present,
the strength of the recovered paper fibres and the capacity to recycle specific paper types (EDF, 1995a).
Depending on the feedstock and desired end product, the two general categories include 1) strictly
mechanical processes without de-inking to produce various types of paperboard; and 2) a combined
mechanical/chemical process that includes de-inking to produce paper types such as newsprint and copy
paper (ETC, 2004).
27. The initial step is collection, sorting and storage of recovered paper which separates out any non-
paper substances (ETC, 2004). Subsequently, the recovered paper is separated into its fibre constituents in
a large pulping machine known as a hydrapulper (EDF, 1995a). Contaminants are removed via this type of
screening. Once the recovered paper pulp has been thoroughly de-contaminated, the paper is then sent to a
de-inking plant for ink removal. Although the de-inking step uses mostly mechanically-based processes
such as centrifuges and kneading units to remove ink from recovered pulp, a minority of de-inking plants
use special chemicals for ink removal (EDF, 1995a).
28. After pulping, the next phase of the paper life-cycle is paper production. Although there are
subtle differences in the equipment used between paper mills depending on the various paper types,
generally there are four similar stages to paper production including stock preparation, papermaking,
coating/laminating and finishing (VDP, 2008b).
29. In the stock preparation stage, pulp is introduced into the papermaking plant as a combination of
chemical pulp, mechanical pulp and/or recovered paper. Water is added to dissolve the pulp further into
single fibre form and chemicals are added to improve the consistency of the fibre/water slurry. The most
important ―filling agents‖ include kaolin clay and chalk; these are added to reinforce the chemical
durability and brightness of the pulp. Next is the papermaking stage, which serves the basic function of
pressing the fibre stock into sheets. Within this stage, the fibre/water mixture is first laid out onto wire
meshes to drain out the water. Subsequently, the paper web is further drained via mechanical pressing, then
dried and smoothed using various rollers. Finally, the paper (containing only 5-7% water) is wound onto a
steel shaft for further coating using various colouring pigments and/or strengthened using binding sealants.
As the last step before packaging, the paper is cut into smaller rolls using a reel cutter.
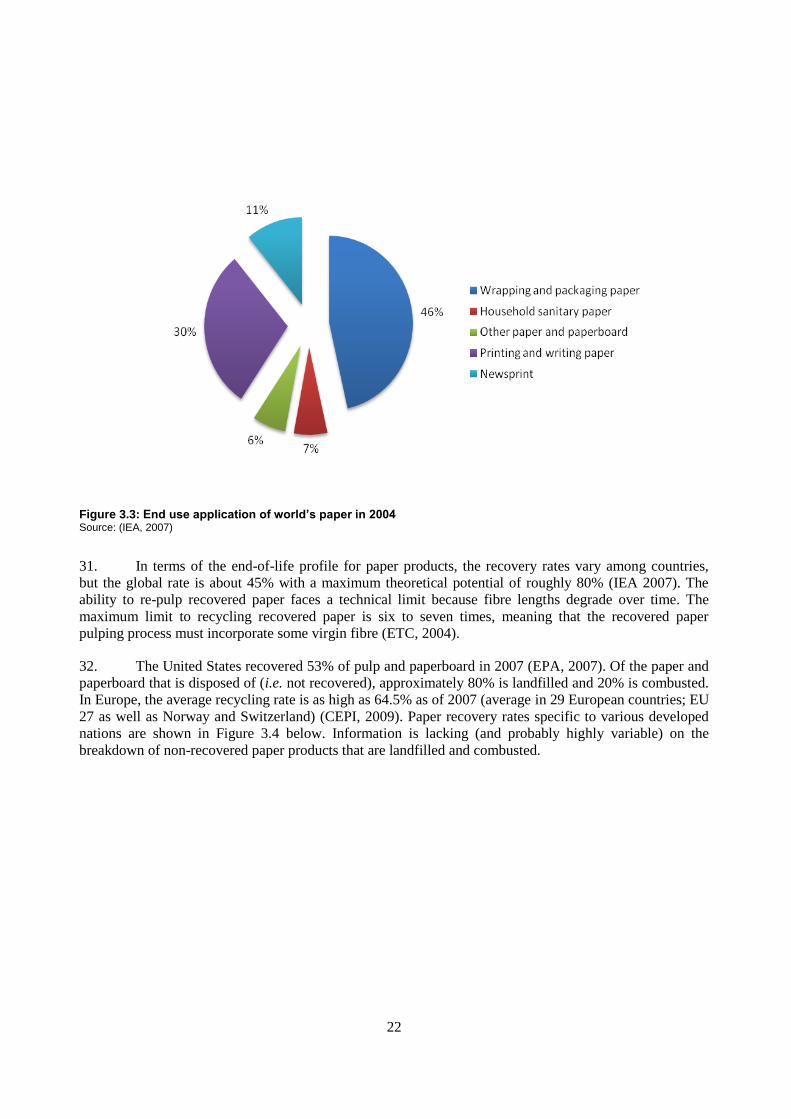
30. Paper then makes its way into various end uses. As depicted in Figure 3.3 below, the majority of
the world‘s paper is utilised for packaging, followed by printing and newsprint (IEA, 2007).
22
Figure 3.3: End use application of world’s paper in 2004 Source: (IEA, 2007)
31. In terms of the end-of-life profile for paper products, the recovery rates vary among countries,
but the global rate is about 45% with a maximum theoretical potential of roughly 80% (IEA 2007). The
ability to re-pulp recovered paper faces a technical limit because fibre lengths degrade over time. The
maximum limit to recycling recovered paper is six to seven times, meaning that the recovered paper
pulping process must incorporate some virgin fibre (ETC, 2004).
32. The United States recovered 53% of pulp and paperboard in 2007 (EPA, 2007). Of the paper and
paperboard that is disposed of (i.e. not recovered), approximately 80% is landfilled and 20% is combusted.
In Europe, the average recycling rate is as high as 64.5% as of 2007 (average in 29 European countries; EU
27 as well as Norway and Switzerland) (CEPI, 2009). Paper recovery rates specific to various developed
nations are shown in Figure 3.4 below. Information is lacking (and probably highly variable) on the
breakdown of non-recovered paper products that are landfilled and combusted.

23
Figure 3.4: Paper recovery rates in selected countries as of 2007 Source: (WBCSD, 2007)
33. Part of the reason for the high rate of recycling in Europe compared to that of North America is
that the European paper industry adopted a voluntary commitment to achieve 66% recycling rate in the
European region by 2010. This commitment (the "European Paper Recycling Declaration") includes not
only a recycling rate target but provides guidance to fourteen industry sectors along the paper value chain
to ensure higher recyclability of paper at the end-of-life (CEPI, 2006). Also, the European Union mandated
under the Directive on Packaging and Packaging Waste (94/62/EC) that no later than 31 December 2008
the minimum recycling target for paper and board shall be 60 % by weight.
3.2 Economic Aspects
34. The pulp and paper industry provides almost 130 billion € (USD 175 billion) in gross value
added to the global economy (FAO, 2005). The relatively large manufacturing output of the wood products
industry (accounting for roughly 1.2% of global GDP in the year 2000) translates into a parallel
relationship between economic output and paper production and demand in many countries (FAO, 2005).
In communities that are mostly dependent on the forest products industry, global economic downturns
dictate economic stress (FPAC, 2007b).
35. A holistic picture of the global trade flow (in terms of dollars of trade) shows the flow of wood
products in 2003 (FAO, 2003). It is clear that most of the traded wood products (by economic value) are
travelling from Europe and North America into China (Figure 3.5).
36. Regional consumption patterns indicate that demand for pulp and paper in OECD countries is
driven by paper needs for printing and writing, whereas in non-OECD countries pulp and paper
consumption is driven by other paper types including paperboard. It is expected that as global per capita
income rises, the demand for printing, writing and specialty paper will also increase, although these
products will face competition from the emergence of electronic media (IEA, 2007, p. 180; OECD, 2008).

24
Figure 3.5: Main trade flows of wood products as of 2003 Source: (FAO, 2005)
37. There are three main flows involved in the global pulp and paper industry that illustrate a
snapshot of the pulp and paper trade. In terms of pulp use in the production of paper, Canada and the
United States dominate the export market accounting for almost half (42%) of total global pulp exports. On
the import side, China and the United States receive much of the pulp, roughly 16% and 15%, respectively,
of world total pulp imports (Table 3.1).
Table 3.1: Pulp for paper trade as of 2003
Exports Imports
million tonnes % million tonnes %
Canada 11.4 29 China 6.5 16
United States 5.1 13 United States 6.1 15
Sweden 3.3 9 Germany 4.2 11
Brazil 2.6 7 Italy 3.4 9
Finland 2.4 6 Republic of Korea 2.4 6
Indonesia 2.4 6 Japan 2.3 6
Chile 2.1 5 France 2.1 5
Russian Federation 1.8 5 United Kingdom 1.5 4
Portugal 1.0 2 Netherlands 1.0 3
Spain 0.8 2 Belgium 0.9 2
Others 5.9 15 Others 8.9 23
World Total 38.7 100 World Total 39.5 100
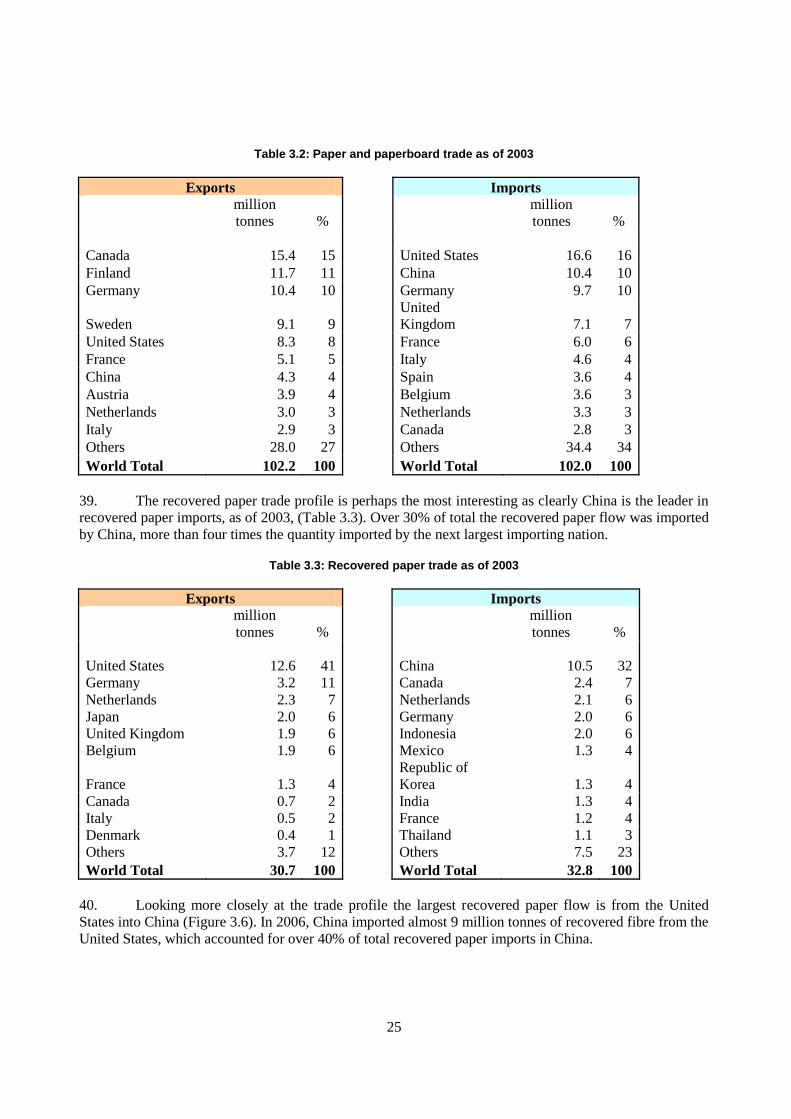
38. A similar profile exists in the export and import of finished paper and paperboard but note that
there are some interesting differences with countries like Finland and Germany being larger exporters of
finished paper and paperboard as compared to pulp (Table 3.2).
25
Table 3.2: Paper and paperboard trade as of 2003
Exports Imports
million
tonnes %
million
tonnes %
Canada 15.4 15 United States 16.6 16
Finland 11.7 11 China 10.4 10
Germany 10.4 10 Germany 9.7 10
Sweden 9.1 9
United
Kingdom 7.1 7
United States 8.3 8 France 6.0 6
France 5.1 5 Italy 4.6 4
China 4.3 4 Spain 3.6 4
Austria 3.9 4 Belgium 3.6 3
Netherlands 3.0 3 Netherlands 3.3 3
Italy 2.9 3 Canada 2.8 3
Others 28.0 27 Others 34.4 34
World Total 102.2 100 World Total 102.0 100
39. The recovered paper trade profile is perhaps the most interesting as clearly China is the leader in
recovered paper imports, as of 2003, (Table 3.3). Over 30% of total the recovered paper flow was imported
by China, more than four times the quantity imported by the next largest importing nation.
Table 3.3: Recovered paper trade as of 2003
Exports Imports
million
tonnes %
million
tonnes %
United States 12.6 41 China 10.5 32
Germany 3.2 11 Canada 2.4 7
Netherlands 2.3 7 Netherlands 2.1 6
Japan 2.0 6 Germany 2.0 6
United Kingdom 1.9 6 Indonesia 2.0 6
Belgium 1.9 6 Mexico 1.3 4
France 1.3 4
Republic of
Korea 1.3 4
Canada 0.7 2 India 1.3 4
Italy 0.5 2 France 1.2 4
Denmark 0.4 1 Thailand 1.1 3
Others 3.7 12 Others 7.5 23
World Total 30.7 100 World Total 32.8 100
40. Looking more closely at the trade profile the largest recovered paper flow is from the United
States into China (Figure 3.6). In 2006, China imported almost 9 million tonnes of recovered fibre from the
United States, which accounted for over 40% of total recovered paper imports in China.

26
Figure 3.6: Sources of imported recovered paper fibre to China as of 2006 (tonnes) Source: (Potter 2008)
41. Other important flows of recovered paper include Europe to China, Japan to China and within the
European countries (Ervasti, 2008).The flow of exports out of and imports into Europe alone includes over
4 million tonnes exported to other EU States and 10 million tonnes exported to China (Potter, 2008). Not
surprisingly, the effect of increased imports of recovered paper has allowed China‘s recovered paper
utilisation rate to increase from 38% in 1997 to 51% in 2004 (IEA, 2007).
3.3 Environmental Aspects
42. According to the IEA, the pulp and paper industry is the fourth largest industrial consumer of
energy representing 5.7% of global industrial energy use (IEA, 2006). A large fraction of the energy
consumed within the pulp and paper industry is supplied by the combustion of fossil fuels either directly or
in the form of fossil fuel-based electricity (WBCSD, 2007). On a global level, it is estimated that the pulp
and paper industry‘s direct emissions (i.e. manufacture-related) of GHGs associated with fossil fuel
combustion total 240 million tonnes of carbon dioxide equivalent (CO2e) per year. Another 25 million
tonnes CO2e are associated with other wood products. Indirect emissions associated with electricity
generation (140 million tonnes of CO2e), transportation (40 million tonnes of CO2e) and end-of-life
methane emissions from landfills (150 million tonnes of CO2e) contribute a total of approximately 330
million tonnes of CO2e (NCASI, 2007a). European data suggest that GHG emissions from the pulp and
paper industry in Europe amounted to roughly 40 million tonnes of CO2e in 2006 (CEPI, 2007a). In the
United States, corresponding direct and indirect GHG emissions were roughly 94 and 120 million tonnes
CO2e in 2004 (NCASI, 2008).
43. Although a significant amount of energy consumption is derived from the combustion of fossil
fuels, a unique characteristic of the pulp and paper industry is that it generates roughly 50% of its own
energy needs through biomass fuel use (IEA, 2006). GHG emissions from the combustion of biomass is
considered biogenic and provided that the biomass is harvested on a sustainable basis (i.e. biomass growth
= harvest + decomposition), it is not counted in the accounting for carbon emissions according to the

27
Intergovernmental Panel on Climate Change (IPCC). The assumption is that if consumption is done on a
sustainable basis, the CO2 emitted from burning biomass will not alter the total atmospheric CO2 profile.
44. The National Council for Air and Stream Improvement (NCASI), a non-profit environmental
research organisation that focuses on analyzing the North American forest products industry, recently
assessed the GHG and carbon profile of the global forest products industry. The results of the assessment
are summarised in Table 3.4. Direct emissions from fuel consumption at mills, mill waste management and
secondary manufacturing operations account for roughly one-third of direct and indirect emissions from
the forest products industry (which includes pulp, paper and wood products). Indirect emissions from
electricity generation, harvesting operations and transportation account for another 25%. In total, the pulp
and paper industry represents roughly half of direct and indirect GHG emissions from the forest products
industry (NCASI, 2007a). The emissions profile assumes the consumption of biomass-derived fuel
combustion to be biogenic and sustainable and thus is not counted below.
Table 3.4: Global GHG emissions from harvesting for the pulp and paper industry, pulping and paper
manufacturing, relative to direct and indirect emissions from the entire forest products industry
Type of
Emissions Description
Emissions
(million
tonnes CO2e /
yr)
Uncertainty % of Total
Emissions
Direct
Emissions
Fuel consumption in pulp
and paper mills 205 + / - 15% 35%
Management of mill wastes 20 + / - 25% 3%
Secondary manufacturing
operations (e.g., printing)1
12 + / - 50% 2%
Indirect
Emissions
Electricity purchases by
pulp and paper mills 140 + / - 25% 24%
Electricity purchases by
secondary manufacturing
operations (e.g., printing)3
13 + / 50% 2%
Harvest and transport
emissions from the pulp and
paper value chain
40 + / - 50% 7%
Methane emissions from
paper products in landfills at
end-of-life
150 + / - 50% 26%
Total direct and indirect emissions from
pulp and paper industry (not including
other forest products)
580 + / - 50% 100%
Source: (NCASI, 2007a)
45. Direct and indirect GHG emissions do not provide a complete picture of the GHG implications of
the pulp and paper industry. Because the wood utilised by the pulp and paper industry represents a carbon
pool, the use of these materials for fuel and for fibre products has two important implications:
3 Note that these emissions include emissions from both the pulp and paper and wood products industries.
28
1. Carbon storage in products (use phase and end-of-life). Fibre products are made of wood and
depending on how products are treated at end-of-life, the carbon they contain may be stored (i.e.
embedded in the product), or it may be released into the atmosphere. Releases as methane are
included in the NCASI tally, but releases as CO2 are not. And to the extent that carbon is
permanently (or nearly permanently) removed from the rapidly cycling carbon pool by disposal in
landfills, this process can result in long-term carbon storage. For more details on the GHG
implications of end-of-life carbon storage and GHG emissions, please see Section 4.
2. Forest carbon sequestration. At equilibrium, the carbon cycle between the forests and the
atmosphere is such that the growth of trees in forests is equal to tree removals plus tree
decomposition. If harvested trees are replanted and allowed to grow to the same age, the CO2
released by burning this wood for fuel can be considered GHG-neutral. That is, the amount of CO2
emitted by burning the harvested wood is equal to the amount of CO2 that will be absorbed and
sequestered by the tree planted in its place. Using wood as a GHG-neutral fuel source therefore
offsets GHG emissions that would have otherwise been produced from burning fossil-fuels, such as
coal or natural gas. Similarly, using the wood sourced from sustainably managed forests would
provide additional forest carbon sequestration. Alternatively, if tree harvesting and decomposition
are greater than growth, utilizing biomass would generate net emissions.
46. In its Global Carbon Footprint report, NCASI did not separate avoided emissions or carbon
storage in the pulp and paper industry from other forest products and there is large uncertainty associated
with these estimates. The report did find, however, that direct and indirect GHG emissions from the entire
forest product sector were largely offset by sequestration and carbon storage in forest products (NCASI,
2007a).
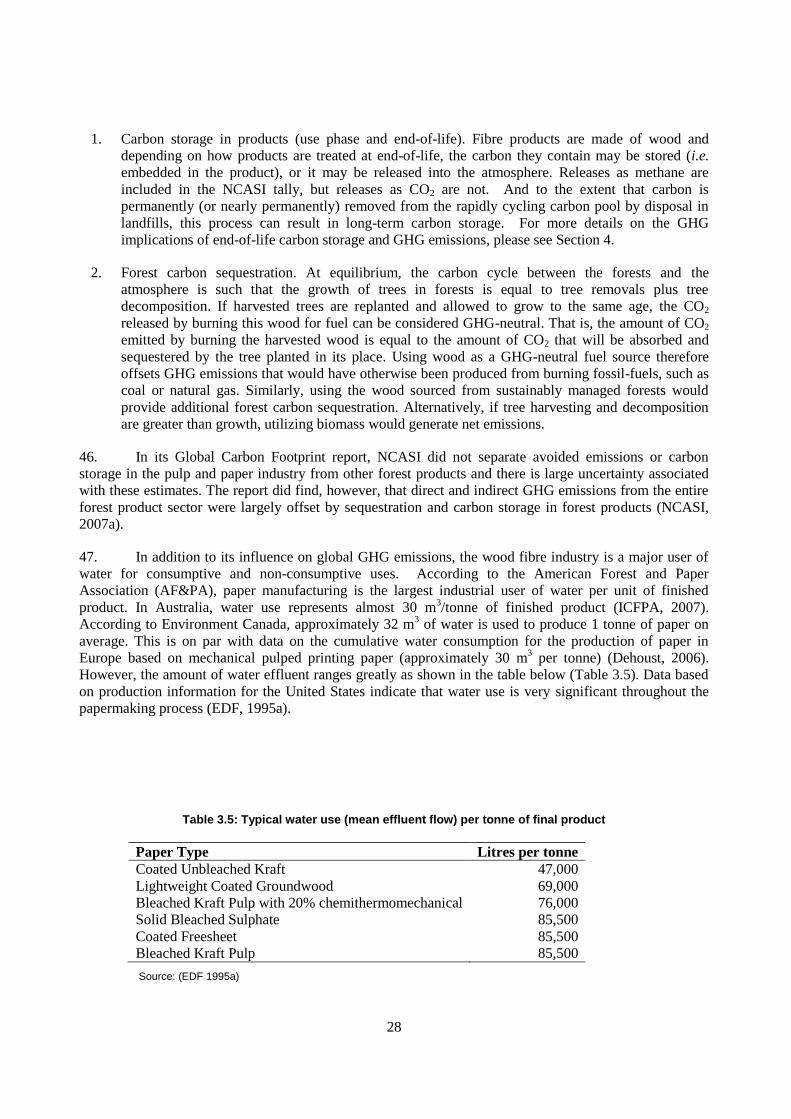
47. In addition to its influence on global GHG emissions, the wood fibre industry is a major user of
water for consumptive and non-consumptive uses. According to the American Forest and Paper
Association (AF&PA), paper manufacturing is the largest industrial user of water per unit of finished
product. In Australia, water use represents almost 30 m3/tonne of finished product (ICFPA, 2007).
According to Environment Canada, approximately 32 m3 of water is used to produce 1 tonne of paper on
average. This is on par with data on the cumulative water consumption for the production of paper in
Europe based on mechanical pulped printing paper (approximately 30 m3 per tonne) (Dehoust, 2006).
However, the amount of water effluent ranges greatly as shown in the table below (Table 3.5). Data based
on production information for the United States indicate that water use is very significant throughout the
papermaking process (EDF, 1995a).
Table 3.5: Typical water use (mean effluent flow) per tonne of final product
Paper Type Litres per tonne
Coated Unbleached Kraft 47,000
Lightweight Coated Groundwood 69,000
Bleached Kraft Pulp with 20% chemithermomechanical 76,000
Solid Bleached Sulphate 85,500
Coated Freesheet 85,500
Bleached Kraft Pulp 85,500
Source: (EDF 1995a)
29
48. Global production of final paper products is around 350 million tonnes (IEA, 2007). Using the
conservative water consumption value of roughly 32 m3 per tonne, global water use for the pulp and paper
industry is at least 11 billion m3 per year.
49. Overall, the pulp and paper industry is a large consumer of energy and natural resources, which
results in an impressive amount of productive capacity. The industry is complex but provides necessary
and fundamental products for consumption and use. In addition to the consumption of resources (energy,
water and wood), the production process results in significant environmental impacts, mainly GHG
emissions and water releases. Other impacts include local air pollution and smog formation from the
combustion of fuels for energy, human toxicity, ecotoxicity and ozone depletion. In general, there is less
readily-available life-cycle data on these impact categories and, therefore, the following sections present
the life-cycle implications of pulp and paper production with special attention to energy, water use and
GHG emissions.
30
4. LIFE-CYCLE ENVIRONMENTAL IMPACTS OF WOOD FIBRES
50. This section presents environmental impacts of energy use, greenhouse gas (GHG) emissions and
water use across the life-cycle of wood fibres. The primary stages in the fibre life-cycle include: wood
harvesting, pulping, papermaking, transportation and end-of-life management. This section summarises
general ranges of energy use, GHG emissions and water use for harvesting, pulping, papermaking and
transportation life-cycle stages based on review of European and North American literature sources.4
4.1 Harvesting, Pulping and Papermaking
51. This section discusses the environmental impacts within the following stages of the fibre life-
cycle:
Harvesting of lumber from forests for pulp and paper manufacture;
Wood preparation and pulping (including cooking, washing, evaporation, chemical preparation,
bleaching and drying); and
Papermaking (includes refining, screening, stock pumping, forming, pressing, drying and
optional processes such as calendering and coating).
4.1.1 Harvesting
52. Harvesting involves the felling of trees, preparing them for transport and transportation via ship,
rail or truck. If wood is harvested upstream of the mill site, logs may also be transported by floating the
logs to the mill site (EC, 2001, p. 18). Energy use, GHG emissions and water use from harvesting are small
relative to the rest of the fibre life-cycle. Only 2% of the total energy consumed to produce paper is
consumed at the harvesting stage, including transportation (Dahlbo et al., 2005, Appendix 8, p. 113).
4.1.2 Pulping
53. Wood pulping accounts for a larger part of environmental impacts. Energy use, GHG emissions
and water use depend upon a number of complex factors, including:
The pulping process. There are large differences in both the amount and the mix of energy
consumed—and the associated GHG emissions produced—from chemical, mechanical and
recovered paper pulping.
The type of paper produced. Energy use, GHG emissions and water use will depend upon:
whether pulp is bleached or non-bleached; paper characteristics such as strength, freeness,
brightness and texture; and the processes involved in papermaking, such as sizing, coating,
calendering and dyeing.
Plant-specific characteristics. Facility parameters that can have an effect are numerous and
include the age of the equipment used in the facility, the operating point of the facility and how
equipment is operated and maintained.
4 The European source (EC, 2001) includes information on select modernised mills whereas the North American
source (Jacobs & IPST, 2006) is dependent on industry average data survey information.

31
Regional factors. The location of the plant can influence the mix of fuels used to produce the
electricity supplier to the plants and market dynamics including the distances to markets for
paper, which can reduce opportunities for integrating pulp and paper mills (IEA, 2007, p. 202).
54. The processes that consume the largest share of energy in chemical pulping are shown in Figure
4.1 and Figure 4.2. These include wood preparation, cooking, evaporation, chemical preparation, bleaching
and oxygen delignification and pulp drying for transport if the pulp mill is not integrated with a
papermaking facility. These figures combine both electricity and process heat energy consumption, but
they do not include energy losses associated with electricity generation or boilers (i.e., powerhouse losses).
55. Figure 4.1 provides information on average energy use in current U.S. pulp mills versus energy
use using best available technologies (BAT). Figure 4.2 shows energy use that is representative of
retrofitted and modernised mills in Europe, which employ some level of BAT. Depending on paper type,
the average energy consumption for conventional non-integrated U.S. mills is roughly 15-18 GJ per air-dry
tonne (GJ/Adt)5 and 12-16 GJ/Adt under BAT. In modern European integrated mills, energy use is roughly
8 – 9 GJ/Adt for kraft pulp, while energy use in non-integrated mills is around 13 GJ/Adt.
Current U.S. mills
0
2
4
6
8
10
12
14
16
18
20
Sulphite,
bleached
Kraft,
unbleached
Kraft, bleached,
softwood
Kraft, bleached,
hardwood
To
tal e
ne
rgy u
se
(G
J / a
ir-d
ry m
etr
ic to
n)
BAT at U.S. mills
0
2
4
6
8
10
12
14
16
18
20
Sulphite,
bleached
Kraft, unbleached Kraft, bleached,
softwood
Kraft, bleached,
hardwood
Figure 4.1: Total energy use for sulphite and kraft pulping processes in current U.S. mills and energy use using BAT Source: (Jacobs & IPST, 2006)
5 Throughout this report, an air-dry tonne is assumed to refer one tonne of dry pulp with 10% moisture content.
32
0
2
4
6
8
10
12
14
16
Kraft, unbleached, integrated Kraft, bleached, integrated Kraft, bleached, non-
integrated
Tota
l energ
y u
se (
GJ /
air-d
ry m
etr
ic t
on)
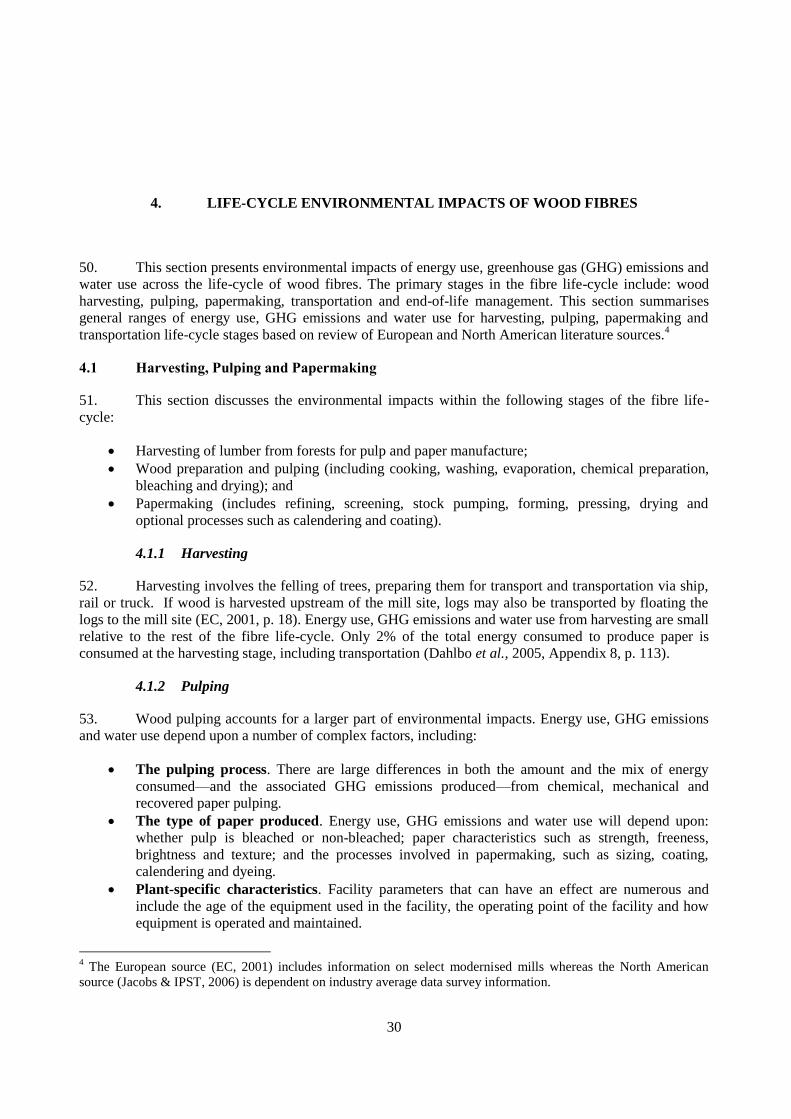
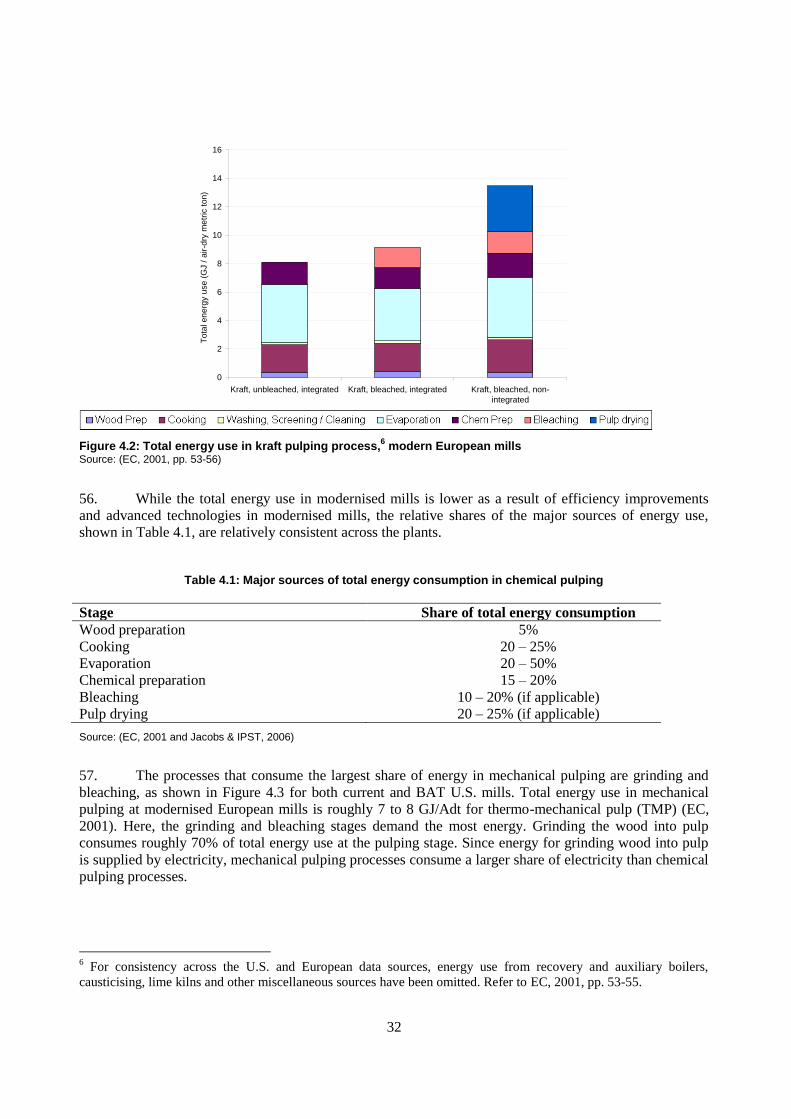
Figure 4.2: Total energy use in kraft pulping process,6 modern European mills
Source: (EC, 2001, pp. 53-56)
56. While the total energy use in modernised mills is lower as a result of efficiency improvements
and advanced technologies in modernised mills, the relative shares of the major sources of energy use,
shown in Table 4.1, are relatively consistent across the plants.
Table 4.1: Major sources of total energy consumption in chemical pulping
Stage Share of total energy consumption
Wood preparation 5%
Cooking 20 – 25%
Evaporation 20 – 50%
Chemical preparation 15 – 20%
Bleaching 10 – 20% (if applicable)
Pulp drying 20 – 25% (if applicable)
Source: (EC, 2001 and Jacobs & IPST, 2006)
57. The processes that consume the largest share of energy in mechanical pulping are grinding and
bleaching, as shown in Figure 4.3 for both current and BAT U.S. mills. Total energy use in mechanical
pulping at modernised European mills is roughly 7 to 8 GJ/Adt for thermo-mechanical pulp (TMP) (EC,
2001). Here, the grinding and bleaching stages demand the most energy. Grinding the wood into pulp
consumes roughly 70% of total energy use at the pulping stage. Since energy for grinding wood into pulp
is supplied by electricity, mechanical pulping processes consume a larger share of electricity than chemical
pulping processes.
6 For consistency across the U.S. and European data sources, energy use from recovery and auxiliary boilers,
causticising, lime kilns and other miscellaneous sources have been omitted. Refer to EC, 2001, pp. 53-55.
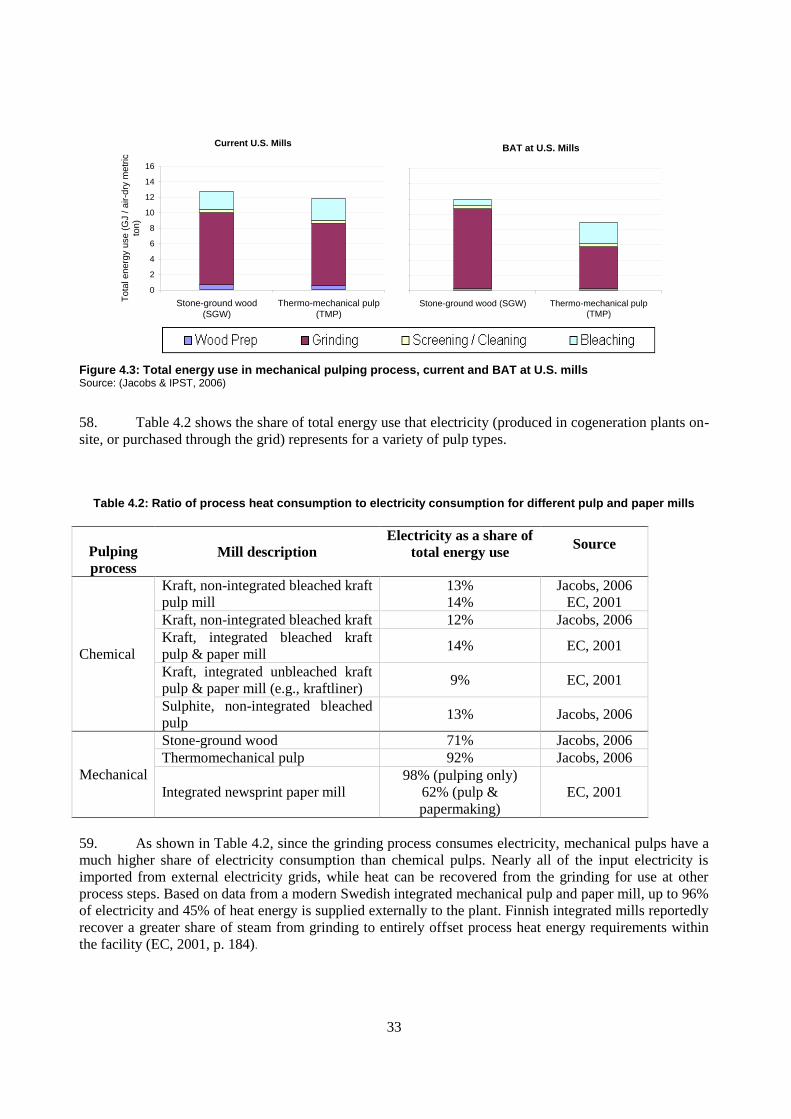
33
Current U.S. Mills
0
2
4
6
8
10
12
14
16
Stone-ground wood
(SGW)
Thermo-mechanical pulp
(TMP)
To
tal e
ne
rgy u
se
(G
J /
air-d
ry m
etr
ic
ton
)
BAT at U.S. Mills
0
2
4
6
8
10
12
14
16
Stone-ground wood (SGW) Thermo-mechanical pulp
(TMP)
Figure 4.3: Total energy use in mechanical pulping process, current and BAT at U.S. mills Source: (Jacobs & IPST, 2006)
58. Table 4.2 shows the share of total energy use that electricity (produced in cogeneration plants on-
site, or purchased through the grid) represents for a variety of pulp types.
Table 4.2: Ratio of process heat consumption to electricity consumption for different pulp and paper mills
Pulping
process Mill description
Electricity as a share of
total energy use Source
Chemical
Kraft, non-integrated bleached kraft
pulp mill
13% Jacobs, 2006
14% EC, 2001
Kraft, non-integrated bleached kraft 12% Jacobs, 2006
Kraft, integrated bleached kraft
pulp & paper mill 14% EC, 2001
Kraft, integrated unbleached kraft
pulp & paper mill (e.g., kraftliner) 9% EC, 2001
Sulphite, non-integrated bleached
pulp 13% Jacobs, 2006
Mechanical
Stone-ground wood 71% Jacobs, 2006
Thermomechanical pulp 92% Jacobs, 2006
Integrated newsprint paper mill
98% (pulping only)
62% (pulp &
papermaking)
EC, 2001
59. As shown in Table 4.2, since the grinding process consumes electricity, mechanical pulps have a
much higher share of electricity consumption than chemical pulps. Nearly all of the input electricity is
imported from external electricity grids, while heat can be recovered from the grinding for use at other
process steps. Based on data from a modern Swedish integrated mechanical pulp and paper mill, up to 96%
of electricity and 45% of heat energy is supplied externally to the plant. Finnish integrated mills reportedly
recover a greater share of steam from grinding to entirely offset process heat energy requirements within
the facility (EC, 2001, p. 184).
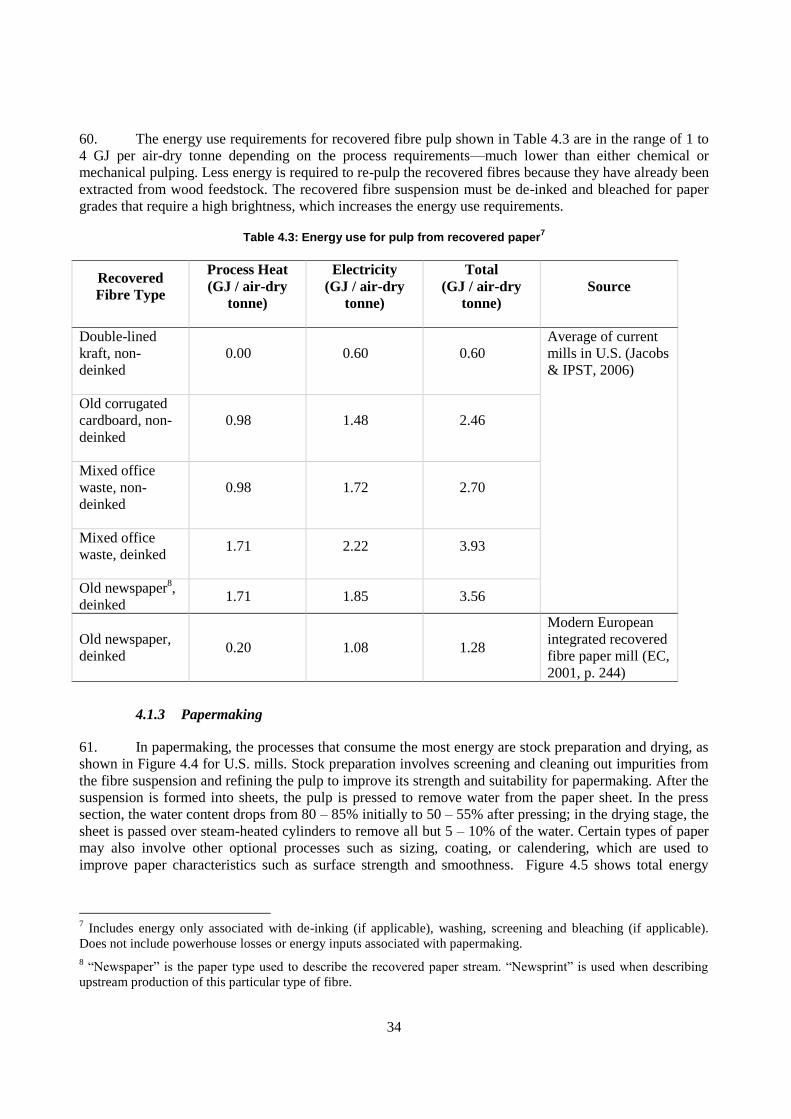
34
60. The energy use requirements for recovered fibre pulp shown in Table 4.3 are in the range of 1 to
4 GJ per air-dry tonne depending on the process requirements—much lower than either chemical or
mechanical pulping. Less energy is required to re-pulp the recovered fibres because they have already been
extracted from wood feedstock. The recovered fibre suspension must be de-inked and bleached for paper
grades that require a high brightness, which increases the energy use requirements.
Table 4.3: Energy use for pulp from recovered paper7
Recovered
Fibre Type
Process Heat
(GJ / air-dry
tonne)
Electricity
(GJ / air-dry
tonne)
Total
(GJ / air-dry
tonne)
Source
Double-lined
kraft, non-
deinked
0.00 0.60 0.60
Average of current
mills in U.S. (Jacobs
& IPST, 2006)
Old corrugated
cardboard, non-
deinked
0.98 1.48 2.46
Mixed office
waste, non-
deinked
0.98 1.72 2.70
Mixed office
waste, deinked 1.71 2.22 3.93
Old newspaper8,
deinked 1.71 1.85 3.56
Old newspaper,
deinked 0.20 1.08 1.28
Modern European
integrated recovered
fibre paper mill (EC,
2001, p. 244)
4.1.3 Papermaking
61. In papermaking, the processes that consume the most energy are stock preparation and drying, as
shown in Figure 4.4 for U.S. mills. Stock preparation involves screening and cleaning out impurities from
the fibre suspension and refining the pulp to improve its strength and suitability for papermaking. After the
suspension is formed into sheets, the pulp is pressed to remove water from the paper sheet. In the press
section, the water content drops from 80 – 85% initially to 50 – 55% after pressing; in the drying stage, the
sheet is passed over steam-heated cylinders to remove all but 5 – 10% of the water. Certain types of paper
may also involve other optional processes such as sizing, coating, or calendering, which are used to
improve paper characteristics such as surface strength and smoothness. Figure 4.5 shows total energy
7 Includes energy only associated with de-inking (if applicable), washing, screening and bleaching (if applicable).
Does not include powerhouse losses or energy inputs associated with papermaking.
8 ―Newspaper‖ is the paper type used to describe the recovered paper stream. ―Newsprint‖ is used when describing
upstream production of this particular type of fibre.
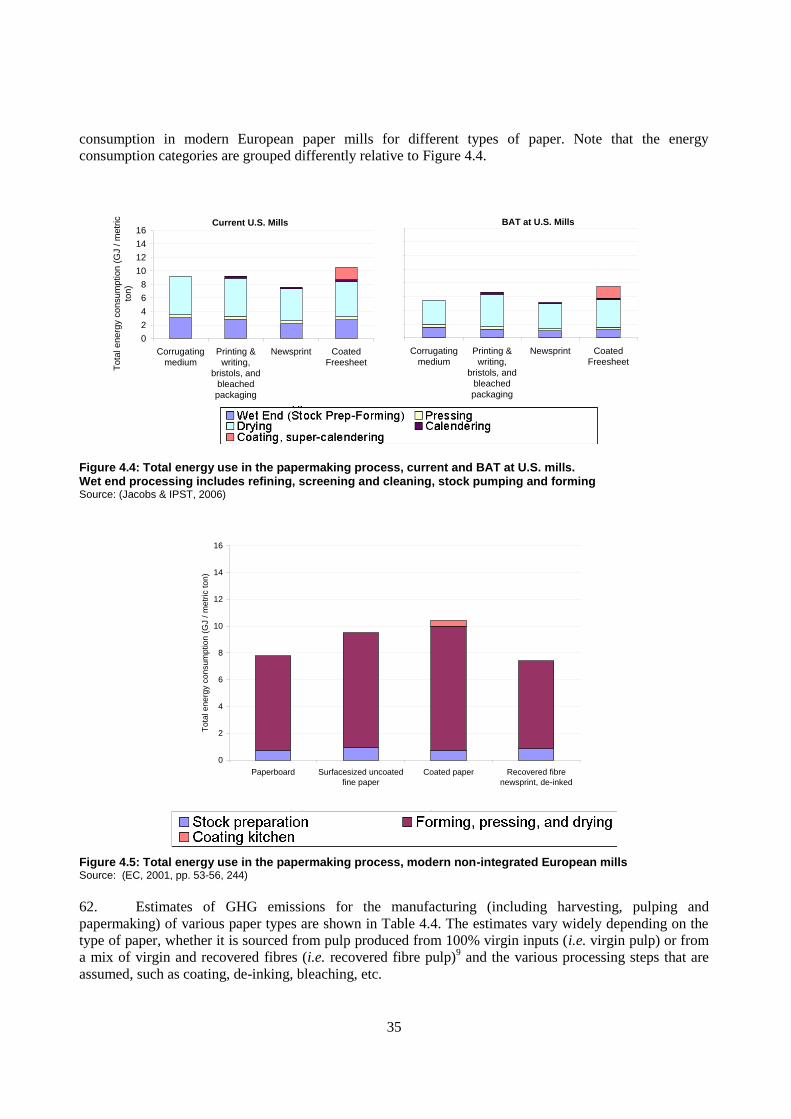
35
consumption in modern European paper mills for different types of paper. Note that the energy
consumption categories are grouped differently relative to Figure 4.4.
Current U.S. Mills
0
2
4
6
8
10
12
14
16
Corrugating
medium
Printing &
writing,
bristols, and
bleached
packaging
Newsprint Coated
Freesheet
To
tal e
ne
rgy c
on
su
mp
tio
n (
GJ /
me
tric
ton
)
BAT at U.S. Mills
0
2
4
6
8
10
12
14
16
Corrugating
medium
Printing &
writing,
bristols, and
bleached
packaging
Newsprint Coated
Freesheet
Figure 4.4: Total energy use in the papermaking process, current and BAT at U.S. mills. Wet end processing includes refining, screening and cleaning, stock pumping and forming Source: (Jacobs & IPST, 2006)
0
2
4
6
8
10
12
14
16
Paperboard Surfacesized uncoated
fine paper
Coated paper Recovered fibre
newsprint, de-inked
To
tal energ
y c
on
sum
ption (
GJ /
me
tric
ton)
Figure 4.5: Total energy use in the papermaking process, modern non-integrated European mills Source: (EC, 2001, pp. 53-56, 244)
62. Estimates of GHG emissions for the manufacturing (including harvesting, pulping and
papermaking) of various paper types are shown in Table 4.4. The estimates vary widely depending on the
type of paper, whether it is sourced from pulp produced from 100% virgin inputs (i.e. virgin pulp) or from
a mix of virgin and recovered fibres (i.e. recovered fibre pulp)9 and the various processing steps that are
assumed, such as coating, de-inking, bleaching, etc.
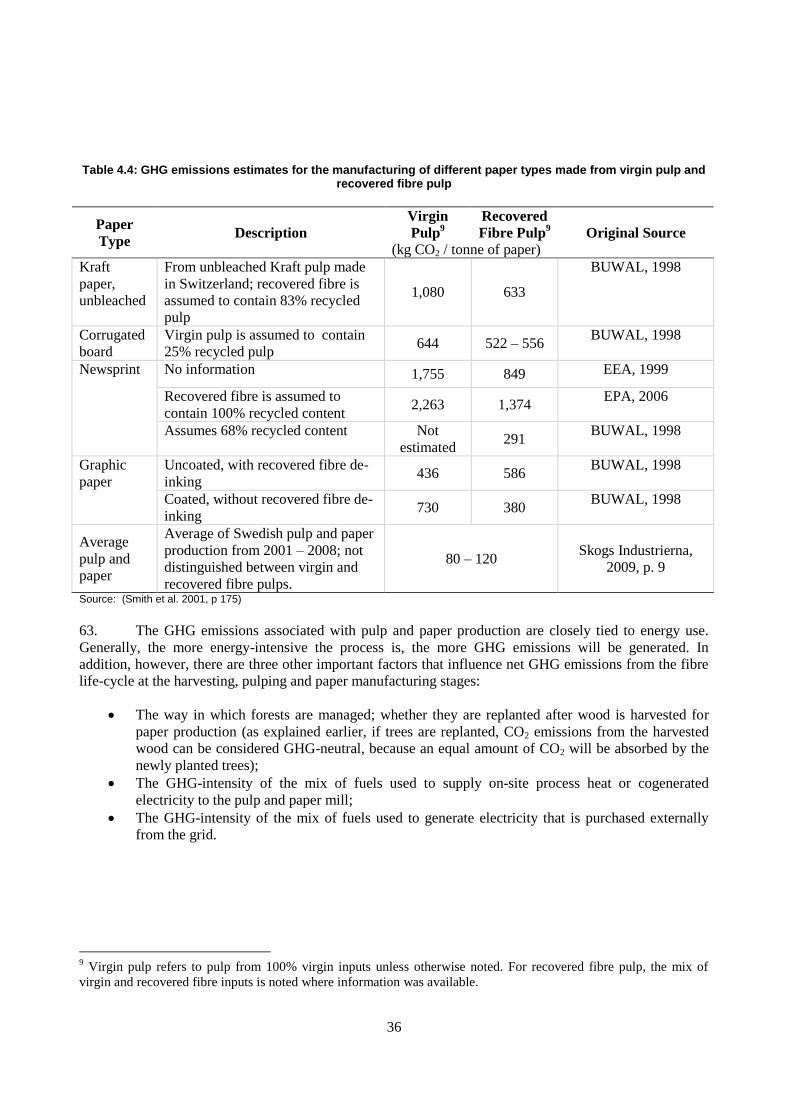
36
Table 4.4: GHG emissions estimates for the manufacturing of different paper types made from virgin pulp and recovered fibre pulp
Paper
Type Description
Virgin
Pulp9
Recovered
Fibre Pulp9 Original Source
(kg CO2 / tonne of paper)
Kraft
paper,
unbleached
From unbleached Kraft pulp made
in Switzerland; recovered fibre is
assumed to contain 83% recycled
pulp
1,080 633
BUWAL, 1998
Corrugated
board
Virgin pulp is assumed to contain
25% recycled pulp 644 522 – 556
BUWAL, 1998
Newsprint No information 1,755 849 EEA, 1999
Recovered fibre is assumed to
contain 100% recycled content 2,263 1,374
EPA, 2006
Assumes 68% recycled content Not
estimated 291
BUWAL, 1998
Graphic
paper
Uncoated, with recovered fibre de-
inking 436 586
BUWAL, 1998
Coated, without recovered fibre de-
inking 730 380
BUWAL, 1998
Average
pulp and
paper
Average of Swedish pulp and paper
production from 2001 – 2008; not
distinguished between virgin and
recovered fibre pulps.
80 – 120 Skogs Industrierna,
2009, p. 9
Source: (Smith et al. 2001, p 175)
63. The GHG emissions associated with pulp and paper production are closely tied to energy use.
Generally, the more energy-intensive the process is, the more GHG emissions will be generated. In
addition, however, there are three other important factors that influence net GHG emissions from the fibre
life-cycle at the harvesting, pulping and paper manufacturing stages:
The way in which forests are managed; whether they are replanted after wood is harvested for
paper production (as explained earlier, if trees are replanted, CO2 emissions from the harvested
wood can be considered GHG-neutral, because an equal amount of CO2 will be absorbed by the
newly planted trees);
The GHG-intensity of the mix of fuels used to supply on-site process heat or cogenerated
electricity to the pulp and paper mill;
The GHG-intensity of the mix of fuels used to generate electricity that is purchased externally
from the grid.
9 Virgin pulp refers to pulp from 100% virgin inputs unless otherwise noted. For recovered fibre pulp, the mix of
virgin and recovered fibre inputs is noted where information was available.

37
Table 4.5: GHG-intensity of fuels
Fuel Type Description
GHG-intensity (kg CO2-equivalent / GJ)
CO2 CH4 N2O Total kgCO2e
/ GJ
Fossil fuels -- 55 – 125 0.006 – 21 0.009 – 2 55 – 127
Biomass Sustainably
harvested 0 0.02 – 0.9 0.3 – 2.7 0.3 – 3.6
Coal
All types including
anthracite,
bituminous, sub-
bituminous, lignite
and coke.
91 to 108 0.24 0.45 92 to 108
Electricity,
at point of
generation
U.S. average10
167 0.08 0.77 168
Finland, average11
56 1.17 0.47 57
Fuel Oil Distillate and
Residual Fuel Oil 69 to 75 0.07 0.17 70-75
Natural Gas Natural Gas 50 0.02 0.03 50
Pulping
liquors
Without replanting
harvested wood 25 0.05 0.5 26
Sustainably
harvested 0 0.05 0.5 0.6
Wood
Waste
Without replanting
harvested wood 98 0.6 1.2 98-99
Sustainably
harvested 0 0.6 1.2 1
Source: (NCASI 2007a, p. 3; EPA 2008, Tables A1, B1, B2)
64. As shown in Table 4.5, the GHG emissions generated by different fuel types vary widely. GHG
emissions from firing pulping liquors from non-sustainably harvested wood feedstocks are roughly one-
quarter that of combusting coal and half of the emissions produced by burning natural gas. In OECD
countries, most pulping liquor emissions are sustainably harvested—that is, the CO2 emissions from
combustion are offset by planting and re-growing additional trees—and thus CO2 emissions can be
considered zero, resulting in a very low GHG-intensity fuel.
65. In terms of water use, the major types of emissions to water from pulp mills include (EC 2001, p.
32):
Oxygen-consuming organic substances (measured as chemical oxygen demand [COD] and
biochemical oxygen demand [BOD]);
Organically-bound chlorine compounds (measured as adsorbable organically bound halogens
[AOX]);
10
eGRID2007 version 1.1, updated January 2008. Available at: http://www.epa.gov/cleanenergy/energy-
resources/egrid/index.html.
11 Dahlbo et al., 2005, Table 5.5, p. 108.
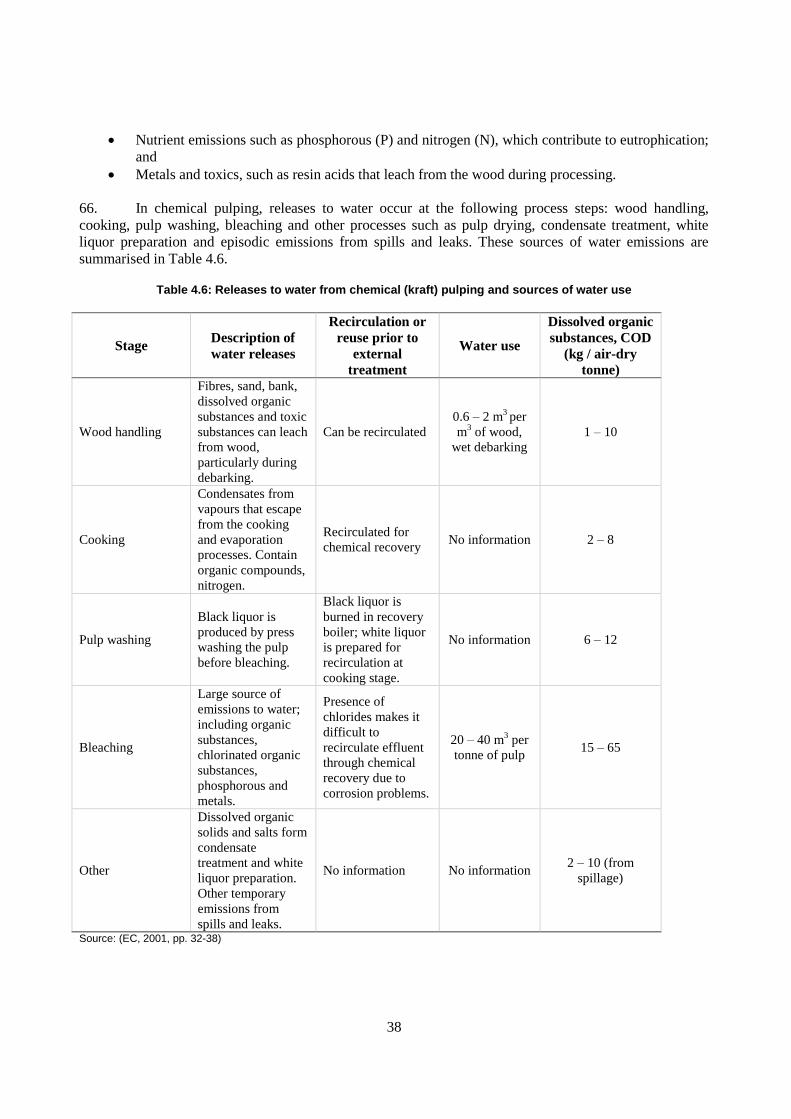
38
Nutrient emissions such as phosphorous (P) and nitrogen (N), which contribute to eutrophication;
and
Metals and toxics, such as resin acids that leach from the wood during processing.
66. In chemical pulping, releases to water occur at the following process steps: wood handling,
cooking, pulp washing, bleaching and other processes such as pulp drying, condensate treatment, white
liquor preparation and episodic emissions from spills and leaks. These sources of water emissions are
summarised in Table 4.6.
Table 4.6: Releases to water from chemical (kraft) pulping and sources of water use
Stage Description of
water releases
Recirculation or
reuse prior to
external
treatment
Water use
Dissolved organic
substances, COD
(kg / air-dry
tonne)
Wood handling
Fibres, sand, bank,
dissolved organic
substances and toxic
substances can leach
from wood,
particularly during
debarking.
Can be recirculated
0.6 – 2 m3 per
m3 of wood,
wet debarking
1 – 10
Cooking
Condensates from
vapours that escape
from the cooking
and evaporation
processes. Contain
organic compounds,
nitrogen.
Recirculated for
chemical recovery No information 2 – 8
Pulp washing
Black liquor is
produced by press
washing the pulp
before bleaching.
Black liquor is
burned in recovery
boiler; white liquor
is prepared for
recirculation at
cooking stage.
No information 6 – 12
Bleaching
Large source of
emissions to water;
including organic
substances,
chlorinated organic
substances,
phosphorous and
metals.
Presence of
chlorides makes it
difficult to
recirculate effluent
through chemical
recovery due to
corrosion problems.
20 – 40 m3 per
tonne of pulp 15 – 65
Other
Dissolved organic
solids and salts form
condensate
treatment and white
liquor preparation.
Other temporary
emissions from
spills and leaks.
No information No information 2 – 10 (from
spillage)
Source: (EC, 2001, pp. 32-38)
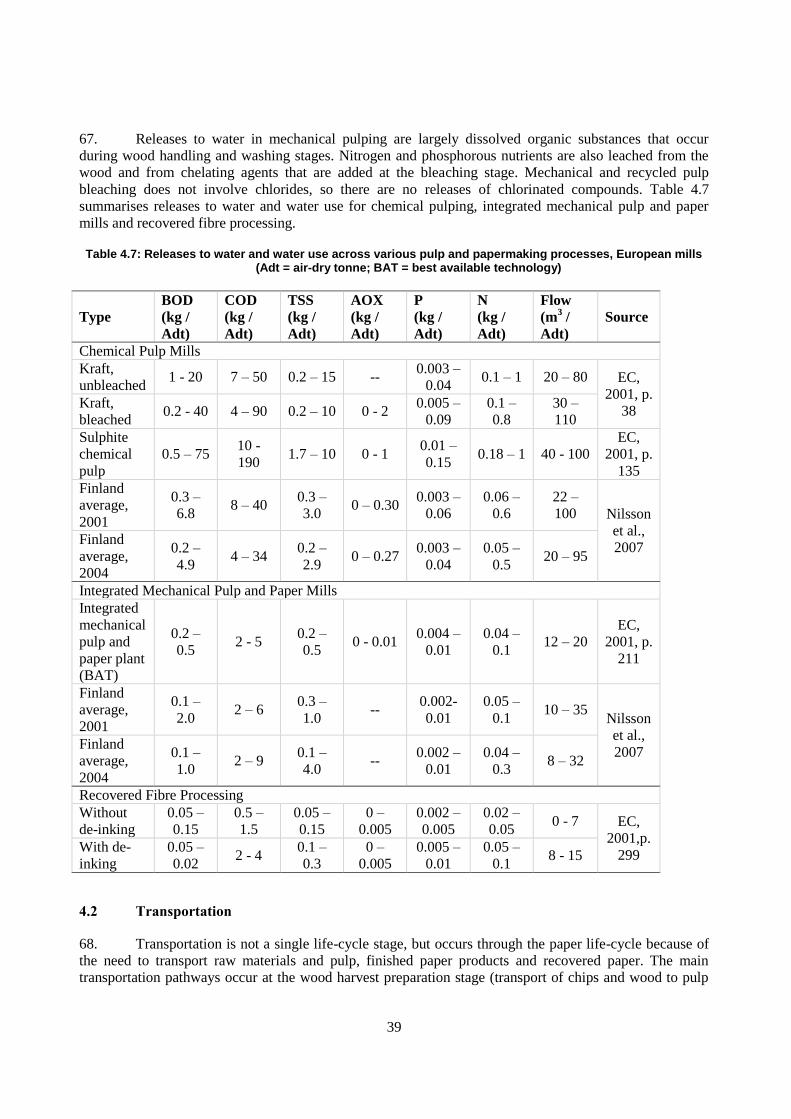
39
67. Releases to water in mechanical pulping are largely dissolved organic substances that occur
during wood handling and washing stages. Nitrogen and phosphorous nutrients are also leached from the
wood and from chelating agents that are added at the bleaching stage. Mechanical and recycled pulp
bleaching does not involve chlorides, so there are no releases of chlorinated compounds. Table 4.7
summarises releases to water and water use for chemical pulping, integrated mechanical pulp and paper
mills and recovered fibre processing.
Table 4.7: Releases to water and water use across various pulp and papermaking processes, European mills (Adt = air-dry tonne; BAT = best available technology)
Type
BOD
(kg /
Adt)
COD
(kg /
Adt)
TSS
(kg /
Adt)
AOX
(kg /
Adt)
P
(kg /
Adt)
N
(kg /
Adt)
Flow
(m3 /
Adt)
Source
Chemical Pulp Mills
Kraft,
unbleached 1 - 20 7 – 50 0.2 – 15 --
0.003 –
0.04 0.1 – 1 20 – 80 EC,
2001, p.
38 Kraft,
bleached 0.2 - 40 4 – 90 0.2 – 10 0 - 2
0.005 –
0.09
0.1 –
0.8
30 –
110
Sulphite
chemical
pulp
0.5 – 75 10 -
190 1.7 – 10 0 - 1
0.01 –
0.15 0.18 – 1 40 - 100
EC,
2001, p.
135
Finland
average,
2001
0.3 –
6.8 8 – 40
0.3 –
3.0 0 – 0.30
0.003 –
0.06
0.06 –
0.6
22 –
100 Nilsson
et al.,
2007 Finland
average,
2004
0.2 –
4.9 4 – 34
0.2 –
2.9 0 – 0.27
0.003 –
0.04
0.05 –
0.5 20 – 95
Integrated Mechanical Pulp and Paper Mills
Integrated
mechanical
pulp and
paper plant
(BAT)
0.2 –
0.5 2 - 5
0.2 –
0.5 0 - 0.01
0.004 –
0.01
0.04 –
0.1 12 – 20
EC,
2001, p.
211
Finland
average,
2001
0.1 –
2.0 2 – 6
0.3 –
1.0 --
0.002-
0.01
0.05 –
0.1 10 – 35
Nilsson
et al.,
2007 Finland
average,
2004
0.1 –
1.0 2 – 9
0.1 –
4.0 --
0.002 –
0.01
0.04 –
0.3 8 – 32
Recovered Fibre Processing
Without
de-inking
0.05 –
0.15
0.5 –
1.5
0.05 –
0.15
0 –
0.005
0.002 –
0.005
0.02 –
0.05 0 - 7 EC,
2001,p.
299 With de-
inking
0.05 –
0.02 2 - 4
0.1 –
0.3
0 –
0.005
0.005 –
0.01
0.05 –
0.1 8 - 15
4.2 Transportation
68. Transportation is not a single life-cycle stage, but occurs through the paper life-cycle because of
the need to transport raw materials and pulp, finished paper products and recovered paper. The main
transportation pathways occur at the wood harvest preparation stage (transport of chips and wood to pulp
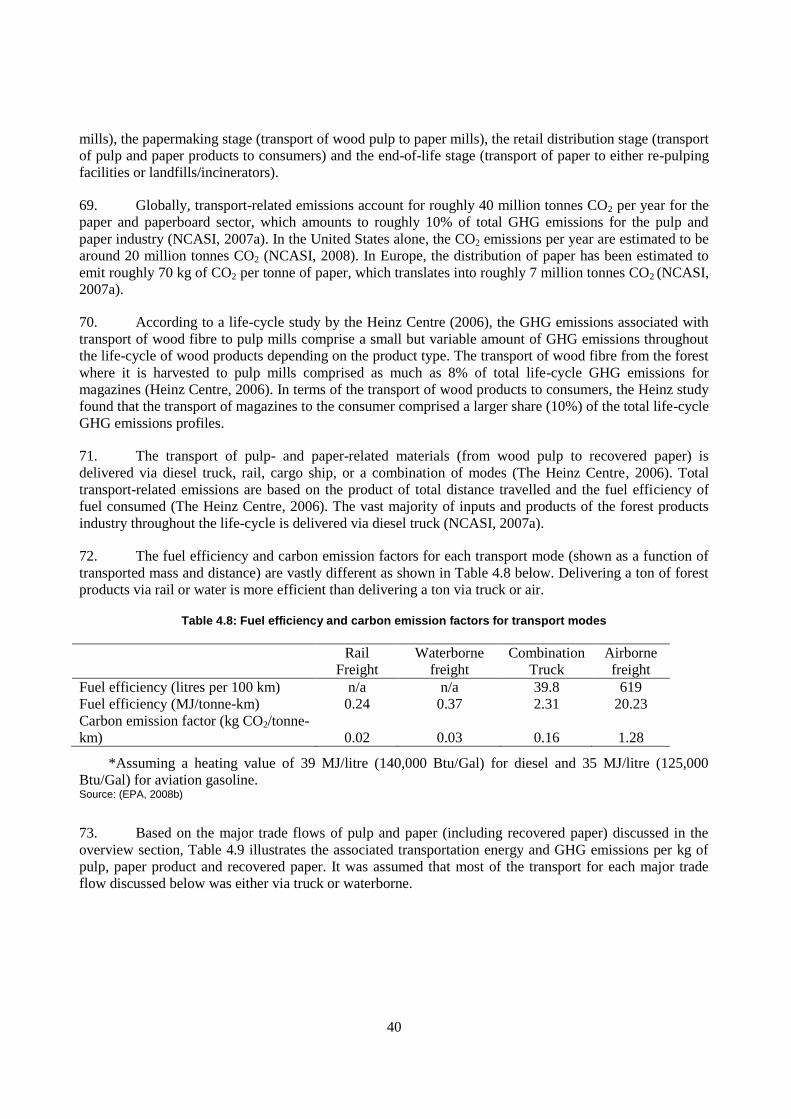
40
mills), the papermaking stage (transport of wood pulp to paper mills), the retail distribution stage (transport
of pulp and paper products to consumers) and the end-of-life stage (transport of paper to either re-pulping
facilities or landfills/incinerators).
69. Globally, transport-related emissions account for roughly 40 million tonnes CO2 per year for the
paper and paperboard sector, which amounts to roughly 10% of total GHG emissions for the pulp and
paper industry (NCASI, 2007a). In the United States alone, the CO2 emissions per year are estimated to be
around 20 million tonnes CO2 (NCASI, 2008). In Europe, the distribution of paper has been estimated to
emit roughly 70 kg of CO2 per tonne of paper, which translates into roughly 7 million tonnes CO2 (NCASI,
2007a).
70. According to a life-cycle study by the Heinz Centre (2006), the GHG emissions associated with
transport of wood fibre to pulp mills comprise a small but variable amount of GHG emissions throughout
the life-cycle of wood products depending on the product type. The transport of wood fibre from the forest
where it is harvested to pulp mills comprised as much as 8% of total life-cycle GHG emissions for
magazines (Heinz Centre, 2006). In terms of the transport of wood products to consumers, the Heinz study
found that the transport of magazines to the consumer comprised a larger share (10%) of the total life-cycle
GHG emissions profiles.
71. The transport of pulp- and paper-related materials (from wood pulp to recovered paper) is
delivered via diesel truck, rail, cargo ship, or a combination of modes (The Heinz Centre, 2006). Total
transport-related emissions are based on the product of total distance travelled and the fuel efficiency of
fuel consumed (The Heinz Centre, 2006). The vast majority of inputs and products of the forest products
industry throughout the life-cycle is delivered via diesel truck (NCASI, 2007a).
72. The fuel efficiency and carbon emission factors for each transport mode (shown as a function of
transported mass and distance) are vastly different as shown in Table 4.8 below. Delivering a ton of forest
products via rail or water is more efficient than delivering a ton via truck or air.
Table 4.8: Fuel efficiency and carbon emission factors for transport modes
Rail
Freight
Waterborne
freight
Combination
Truck
Airborne
freight
Fuel efficiency (litres per 100 km) n/a n/a 39.8 619
Fuel efficiency (MJ/tonne-km) 0.24 0.37 2.31 20.23
Carbon emission factor (kg CO2/tonne-
km) 0.02 0.03 0.16 1.28
*Assuming a heating value of 39 MJ/litre (140,000 Btu/Gal) for diesel and 35 MJ/litre (125,000
Btu/Gal) for aviation gasoline. Source: (EPA, 2008b)
73. Based on the major trade flows of pulp and paper (including recovered paper) discussed in the
overview section, Table 4.9 illustrates the associated transportation energy and GHG emissions per kg of
pulp, paper product and recovered paper. It was assumed that most of the transport for each major trade
flow discussed below was either via truck or waterborne.
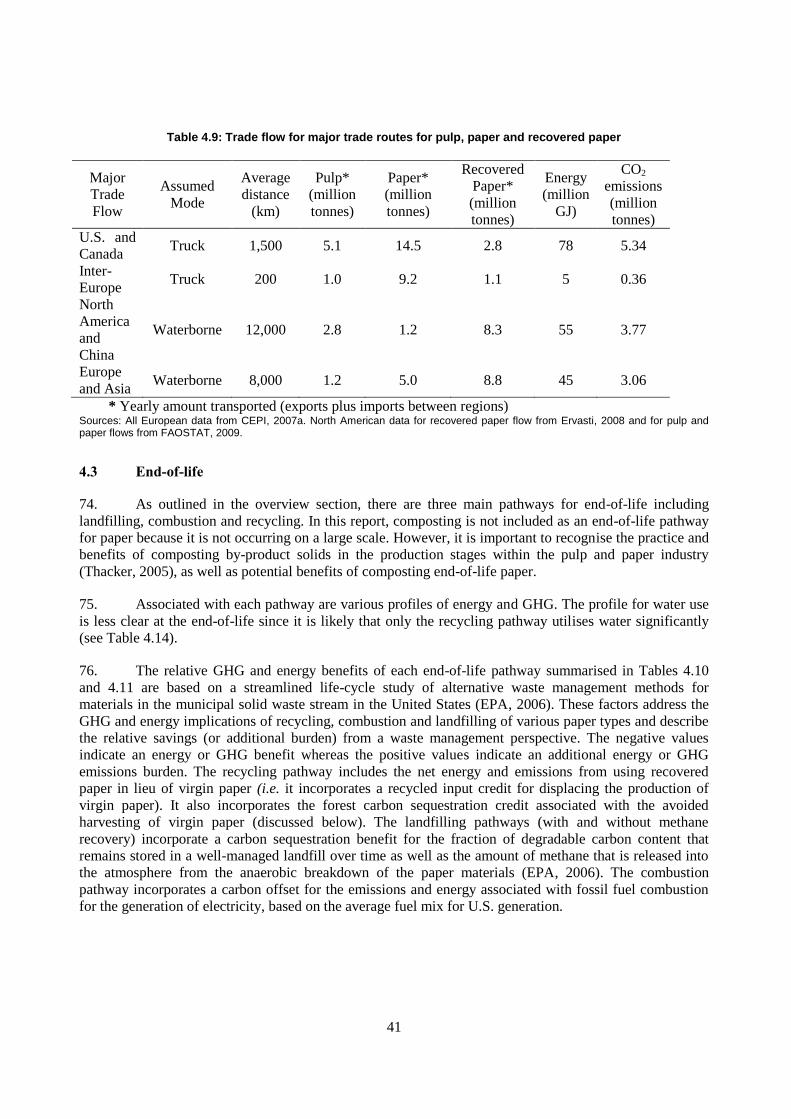
41
Table 4.9: Trade flow for major trade routes for pulp, paper and recovered paper
Major
Trade
Flow
Assumed
Mode
Average
distance
(km)
Pulp*
(million
tonnes)
Paper*
(million
tonnes)
Recovered
Paper*
(million
tonnes)
Energy
(million
GJ)
CO2
emissions
(million
tonnes)
U.S. and
Canada Truck 1,500 5.1 14.5 2.8 78 5.34
Inter-
Europe Truck 200 1.0 9.2 1.1 5 0.36
North
America
and
China
Waterborne 12,000 2.8 1.2 8.3 55 3.77
Europe
and Asia Waterborne 8,000 1.2 5.0 8.8 45 3.06
* Yearly amount transported (exports plus imports between regions) Sources: All European data from CEPI, 2007a. North American data for recovered paper flow from Ervasti, 2008 and for pulp and paper flows from FAOSTAT, 2009.
4.3 End-of-life
74. As outlined in the overview section, there are three main pathways for end-of-life including
landfilling, combustion and recycling. In this report, composting is not included as an end-of-life pathway
for paper because it is not occurring on a large scale. However, it is important to recognise the practice and
benefits of composting by-product solids in the production stages within the pulp and paper industry
(Thacker, 2005), as well as potential benefits of composting end-of-life paper.
75. Associated with each pathway are various profiles of energy and GHG. The profile for water use
is less clear at the end-of-life since it is likely that only the recycling pathway utilises water significantly
(see Table 4.14).
76. The relative GHG and energy benefits of each end-of-life pathway summarised in Tables 4.10
and 4.11 are based on a streamlined life-cycle study of alternative waste management methods for
materials in the municipal solid waste stream in the United States (EPA, 2006). These factors address the
GHG and energy implications of recycling, combustion and landfilling of various paper types and describe
the relative savings (or additional burden) from a waste management perspective. The negative values
indicate an energy or GHG benefit whereas the positive values indicate an additional energy or GHG
emissions burden. The recycling pathway includes the net energy and emissions from using recovered
paper in lieu of virgin paper (i.e. it incorporates a recycled input credit for displacing the production of
virgin paper). It also incorporates the forest carbon sequestration credit associated with the avoided
harvesting of virgin paper (discussed below). The landfilling pathways (with and without methane
recovery) incorporate a carbon sequestration benefit for the fraction of degradable carbon content that
remains stored in a well-managed landfill over time as well as the amount of methane that is released into
the atmosphere from the anaerobic breakdown of the paper materials (EPA, 2006). The combustion
pathway incorporates a carbon offset for the emissions and energy associated with fossil fuel combustion
for the generation of electricity, based on the average fuel mix for U.S. generation.
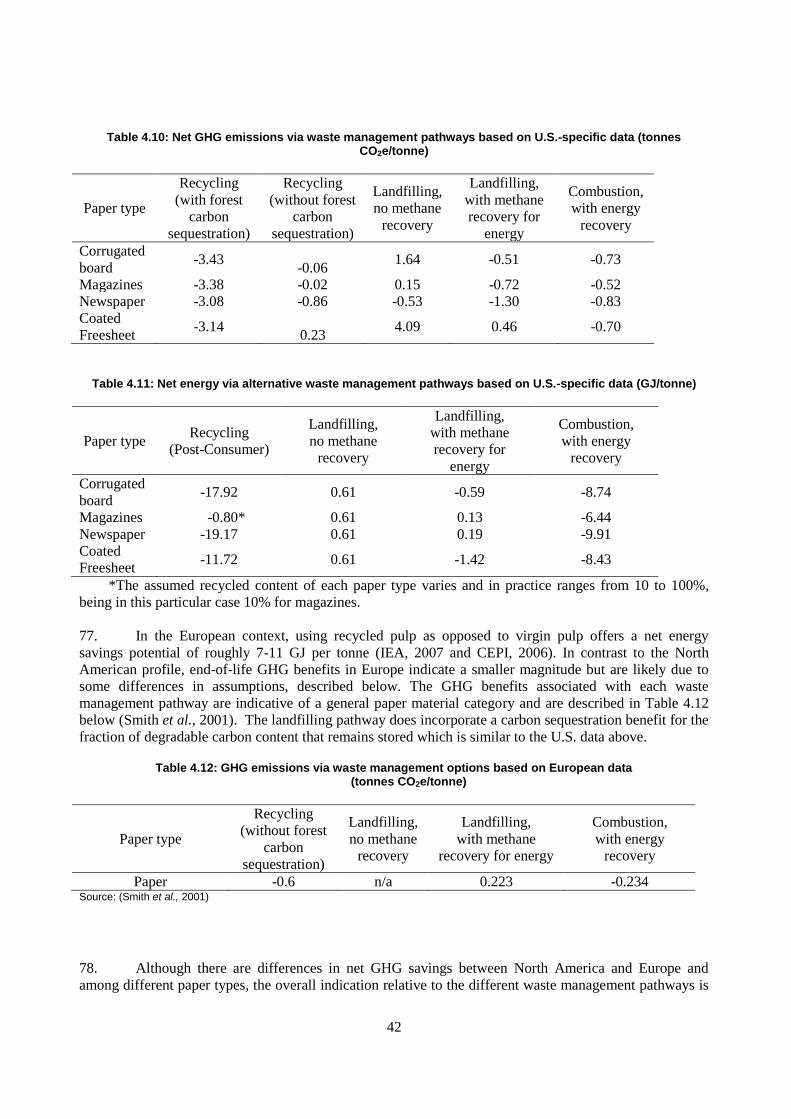
42
Table 4.10: Net GHG emissions via waste management pathways based on U.S.-specific data (tonnes CO2e/tonne)
Paper type
Recycling
(with forest
carbon
sequestration)
Recycling
(without forest
carbon
sequestration)
Landfilling,
no methane
recovery
Landfilling,
with methane
recovery for
energy
Combustion,
with energy
recovery
Corrugated
board -3.43
-0.06 1.64 -0.51 -0.73
Magazines -3.38 -0.02 0.15 -0.72 -0.52
Newspaper -3.08 -0.86 -0.53 -1.30 -0.83
Coated
Freesheet -3.14
0.23 4.09 0.46 -0.70
Table 4.11: Net energy via alternative waste management pathways based on U.S.-specific data (GJ/tonne)
Paper type Recycling
(Post-Consumer)
Landfilling,
no methane
recovery
Landfilling,
with methane
recovery for
energy
Combustion,
with energy
recovery
Corrugated
board -17.92 0.61 -0.59 -8.74
Magazines -0.80* 0.61 0.13 -6.44
Newspaper -19.17 0.61 0.19 -9.91
Coated
Freesheet -11.72 0.61 -1.42 -8.43
*The assumed recycled content of each paper type varies and in practice ranges from 10 to 100%,
being in this particular case 10% for magazines.
77. In the European context, using recycled pulp as opposed to virgin pulp offers a net energy
savings potential of roughly 7-11 GJ per tonne (IEA, 2007 and CEPI, 2006). In contrast to the North
American profile, end-of-life GHG benefits in Europe indicate a smaller magnitude but are likely due to
some differences in assumptions, described below. The GHG benefits associated with each waste
management pathway are indicative of a general paper material category and are described in Table 4.12
below (Smith et al., 2001). The landfilling pathway does incorporate a carbon sequestration benefit for the
fraction of degradable carbon content that remains stored which is similar to the U.S. data above.
Table 4.12: GHG emissions via waste management options based on European data (tonnes CO2e/tonne)
Paper type
Recycling
(without forest
carbon
sequestration)
Landfilling,
no methane
recovery
Landfilling,
with methane
recovery for energy
Combustion,
with energy
recovery
Paper -0.6 n/a 0.223 -0.234 Source: (Smith et al., 2001)
78. Although there are differences in net GHG savings between North America and Europe and
among different paper types, the overall indication relative to the different waste management pathways is
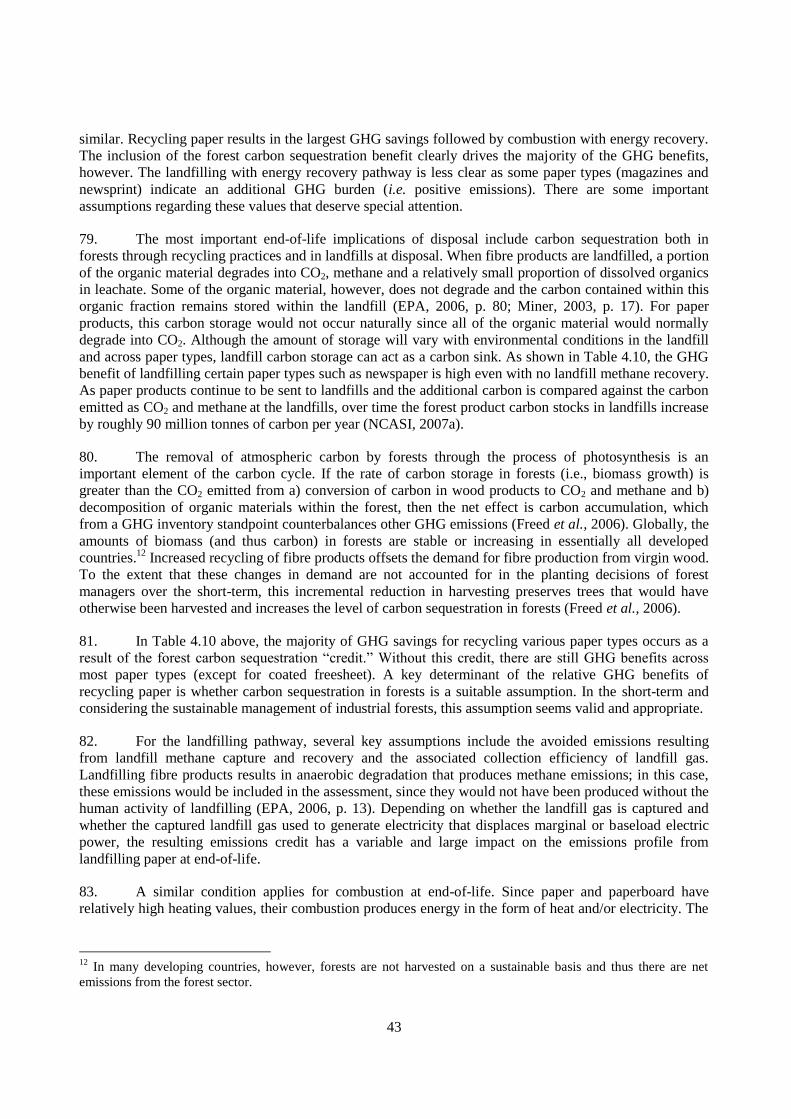
43
similar. Recycling paper results in the largest GHG savings followed by combustion with energy recovery.
The inclusion of the forest carbon sequestration benefit clearly drives the majority of the GHG benefits,
however. The landfilling with energy recovery pathway is less clear as some paper types (magazines and
newsprint) indicate an additional GHG burden (i.e. positive emissions). There are some important
assumptions regarding these values that deserve special attention.
79. The most important end-of-life implications of disposal include carbon sequestration both in
forests through recycling practices and in landfills at disposal. When fibre products are landfilled, a portion
of the organic material degrades into CO2, methane and a relatively small proportion of dissolved organics
in leachate. Some of the organic material, however, does not degrade and the carbon contained within this
organic fraction remains stored within the landfill (EPA, 2006, p. 80; Miner, 2003, p. 17). For paper
products, this carbon storage would not occur naturally since all of the organic material would normally
degrade into CO2. Although the amount of storage will vary with environmental conditions in the landfill
and across paper types, landfill carbon storage can act as a carbon sink. As shown in Table 4.10, the GHG
benefit of landfilling certain paper types such as newspaper is high even with no landfill methane recovery.
As paper products continue to be sent to landfills and the additional carbon is compared against the carbon
emitted as CO2 and methane at the landfills, over time the forest product carbon stocks in landfills increase
by roughly 90 million tonnes of carbon per year (NCASI, 2007a).
80. The removal of atmospheric carbon by forests through the process of photosynthesis is an
important element of the carbon cycle. If the rate of carbon storage in forests (i.e., biomass growth) is
greater than the CO2 emitted from a) conversion of carbon in wood products to CO2 and methane and b)
decomposition of organic materials within the forest, then the net effect is carbon accumulation, which
from a GHG inventory standpoint counterbalances other GHG emissions (Freed et al., 2006). Globally, the
amounts of biomass (and thus carbon) in forests are stable or increasing in essentially all developed
countries.12
Increased recycling of fibre products offsets the demand for fibre production from virgin wood.
To the extent that these changes in demand are not accounted for in the planting decisions of forest
managers over the short-term, this incremental reduction in harvesting preserves trees that would have
otherwise been harvested and increases the level of carbon sequestration in forests (Freed et al., 2006).
81. In Table 4.10 above, the majority of GHG savings for recycling various paper types occurs as a
result of the forest carbon sequestration ―credit.‖ Without this credit, there are still GHG benefits across
most paper types (except for coated freesheet). A key determinant of the relative GHG benefits of
recycling paper is whether carbon sequestration in forests is a suitable assumption. In the short-term and
considering the sustainable management of industrial forests, this assumption seems valid and appropriate.
82. For the landfilling pathway, several key assumptions include the avoided emissions resulting
from landfill methane capture and recovery and the associated collection efficiency of landfill gas.
Landfilling fibre products results in anaerobic degradation that produces methane emissions; in this case,
these emissions would be included in the assessment, since they would not have been produced without the
human activity of landfilling (EPA, 2006, p. 13). Depending on whether the landfill gas is captured and
whether the captured landfill gas used to generate electricity that displaces marginal or baseload electric
power, the resulting emissions credit has a variable and large impact on the emissions profile from
landfilling paper at end-of-life.
83. A similar condition applies for combustion at end-of-life. Since paper and paperboard have
relatively high heating values, their combustion produces energy in the form of heat and/or electricity. The
12
In many developing countries, however, forests are not harvested on a sustainable basis and thus there are net
emissions from the forest sector.

44
displacement of grid-generated electricity is a key assumption in assessing the GHG benefits of
combustion as an end-of-life pathway (EPA, 2006, p. 7).
4.4 Summary
84. Tables 4.13 and 4.14 provide a summary of energy use, GHG emissions and water use across the
fibre life-cycle. The information in Table 4.13 shows that the pulping stage either via chemical or
mechanical processes and the papermaking stage use the most energy across the life-cycle. Chemical
pulping uses more energy and water than mechanical pulping per tonne of paper. The GHG emissions are
dependent upon the fuel mix used to provide electricity and process heat for pulping and papermaking.
Although emissions are correlated with energy use, the variability of GHG emissions from fuels used in the
pulp and papermaking industry makes it difficult to estimate GHG emissions in general for each life-cycle
stage across paper types and regions.
Table 4.13: Summary of environmental impacts for pulp, papermaking and transportation across different paper types and regions
Life-cycle stage Energy use* GHG emissions Water use
(GJ /
tonne)
(% of
total)
(tonnes CO2e /
tonne) (m
3 / tonne)
Wood harvesting and preparation 1 3 – 5% -- 0.6 – 2.0
Pulping
Chemical pulp
Pulping (includes cooking,
washing, evaporation,
chemical preparation)
7 – 11 30 – 35% -- 15 – 20**
Bleaching 2 – 3 10% -- 20 – 40
Mechanical pulp
Pulping (includes grinding,
screening) 8 – 9 30 – 40% --
5 – 50
Bleaching 1 – 3 5 – 10% --
Pulp drying (for non-integrated
pulp mills) 2 – 3 5 – 10% -- n/a
Papermaking (including stock
prep, forming, pressing and
drying)
8 – 11 30 – 40% -- 5 – 50
Transportation 3 15% -- negligible
Total (not including end-of-life)
Chemical pulping 23 – 32 n/a 0.08 to 2
20 – 110
Mechanical pulping 21 – 30 n/a 10 – 50
* Energy use estimates do not include powerhouse losses from converting fuel inputs into energy.
Boiler efficiencies can vary from roughly 60 to 90%.
-- Not estimated due to variability in fuel mix.
**Estimated value. Sources: (Jacobs & IPST, 2006, EC, 2001and EDF,1995a)
85. Table 4.14 below summarises energy, GHG emissions and water use for the various end-of-life
management pathways discussed in more detail in Section 4.3.

45
Table 4.14: Summary of environmental impacts for end-of-life management of pulp and paper products across Europe and North America
Energy use
(GJ / tonne)
GHG emissions
(MtCO2e / tonne)
Water use
(m3 / tonne)
Recycling including forest
carbon sequestration -19 to -7 -3 to -0.6 0 to 15
Combustion with energy
recovery -10 to -6 -0.8 to -0.2 Negligible
Landfilling with methane
recovery -1.4 to 0.2 -1.3 to 0.2 Negligible
Landfilling without methane
recovery 0.6 -0.5 to 4 Negligible
Note: negative values indicate savings
Sources: (EC, 2001 and EPA, 2006)

46
5. BEST PRACTICES FOR SUSTAINABLE MANAGEMENT OF WOOD FIBRES
86. This section identifies some of the most significant technologies and management practices that
could further reduce environmental impacts across the wood fibre life-cycle, taking into account economic
and social impacts. The goal of this section is to identify, within the limits of available data and across the
various dimensions of sustainability: i) which management methods and technologies would make a
difference (and whether that difference is quantifiable); ii) for which processes and products; and iii) across
which life-cycle stage(s).
87. The technologies and management practices summarised in this section were identified through a
review of numerous literature sources and consultation with experts.13
The following table highlights the
practices according to life-cycle stages; each stage is discussed in further detail in the sub-sections that
follow. Although this is not an exhaustive list, it is meant to outline general strategies to promote SMM in
the pulp and paper industry and to highlight the relative potential impact of these practices on energy use,
GHG emissions and water use.
Table 5.1: Summary of technologies and management practices that contribute to SMM
Environmental
Impact14
Description of Possible Practices or Technologies Potential Impact
Harvesting
Reduce energy
use and / or
GHG emissions
Forest certification through sustainable forest
management
High; sustainably managed
forests are potential large
carbon sinks in the short-term
Wood sawing advances
Wood reconstitution and pressing technology advances
Low but beneficial
Pulping
Reduce energy
use and / or
GHG emissions
Power (heat and electricity) generation improvements:
o Combined heat and power
o Integration of chemical, mechanical and
recycled pulp mills
o Black liquor gasification (currently at a
developmental stage, applicable to chemical
pulping)
Switching to less GHG-intensive fuels; wood waste
recovery and reuse
Carbon capture and sequestration (currently at a
research stage)
Digester modernisation (chemical pulping)
Evaporator modernisation (chemical pulping)
Pressurised groundwood grinding; exhaust steam
25 to 30% reduction in total
energy use, relative to
conventional mills,
depending upon type of
pulping process, age of plant
and location of plant
13
The valuable contribution of the following experts is greatly appreciated: Agneta Melin, Ambiolex Miljöstrategi
AB; Ilpo Ervasti, Pöyry Consulting; Reid Miner, National Council for Air and Stream Improvement (NCASI); Jori
Ringman, Confederation of European Paper Industries (CEPI); and Michael Suhr, European Commission – DG Joint
Research Centre.
14 The environmental impacts of interest in this study are explained in the scope section. This is not a comprehensive
list, but reflects the information that was available in the literature.
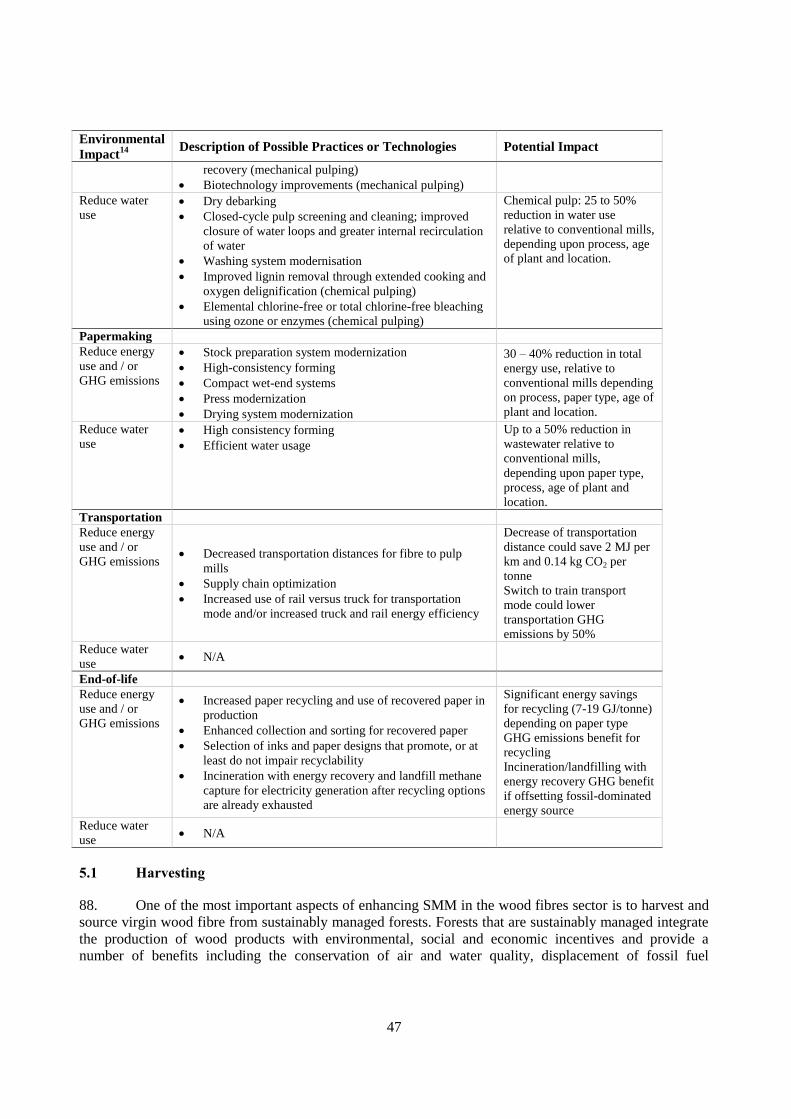
47
Environmental
Impact14
Description of Possible Practices or Technologies Potential Impact
recovery (mechanical pulping)
Biotechnology improvements (mechanical pulping)
Reduce water
use Dry debarking
Closed-cycle pulp screening and cleaning; improved
closure of water loops and greater internal recirculation
of water
Washing system modernisation
Improved lignin removal through extended cooking and
oxygen delignification (chemical pulping)
Elemental chlorine-free or total chlorine-free bleaching
using ozone or enzymes (chemical pulping)
Chemical pulp: 25 to 50%
reduction in water use
relative to conventional mills,
depending upon process, age
of plant and location.
Papermaking
Reduce energy
use and / or
GHG emissions
Stock preparation system modernization
High-consistency forming
Compact wet-end systems
Press modernization
Drying system modernization
30 – 40% reduction in total
energy use, relative to
conventional mills depending
on process, paper type, age of
plant and location.
Reduce water
use High consistency forming
Efficient water usage
Up to a 50% reduction in
wastewater relative to
conventional mills,
depending upon paper type,
process, age of plant and
location.
Transportation
Reduce energy
use and / or
GHG emissions Decreased transportation distances for fibre to pulp
mills
Supply chain optimization
Increased use of rail versus truck for transportation
mode and/or increased truck and rail energy efficiency
Decrease of transportation
distance could save 2 MJ per
km and 0.14 kg CO2 per
tonne
Switch to train transport
mode could lower
transportation GHG
emissions by 50%
Reduce water
use N/A
End-of-life
Reduce energy
use and / or
GHG emissions
Increased paper recycling and use of recovered paper in
production
Enhanced collection and sorting for recovered paper
Selection of inks and paper designs that promote, or at
least do not impair recyclability
Incineration with energy recovery and landfill methane
capture for electricity generation after recycling options
are already exhausted
Significant energy savings
for recycling (7-19 GJ/tonne)
depending on paper type
GHG emissions benefit for
recycling
Incineration/landfilling with
energy recovery GHG benefit
if offsetting fossil-dominated
energy source
Reduce water
use N/A
5.1 Harvesting
88. One of the most important aspects of enhancing SMM in the wood fibres sector is to harvest and
source virgin wood fibre from sustainably managed forests. Forests that are sustainably managed integrate
the production of wood products with environmental, social and economic incentives and provide a
number of benefits including the conservation of air and water quality, displacement of fossil fuel
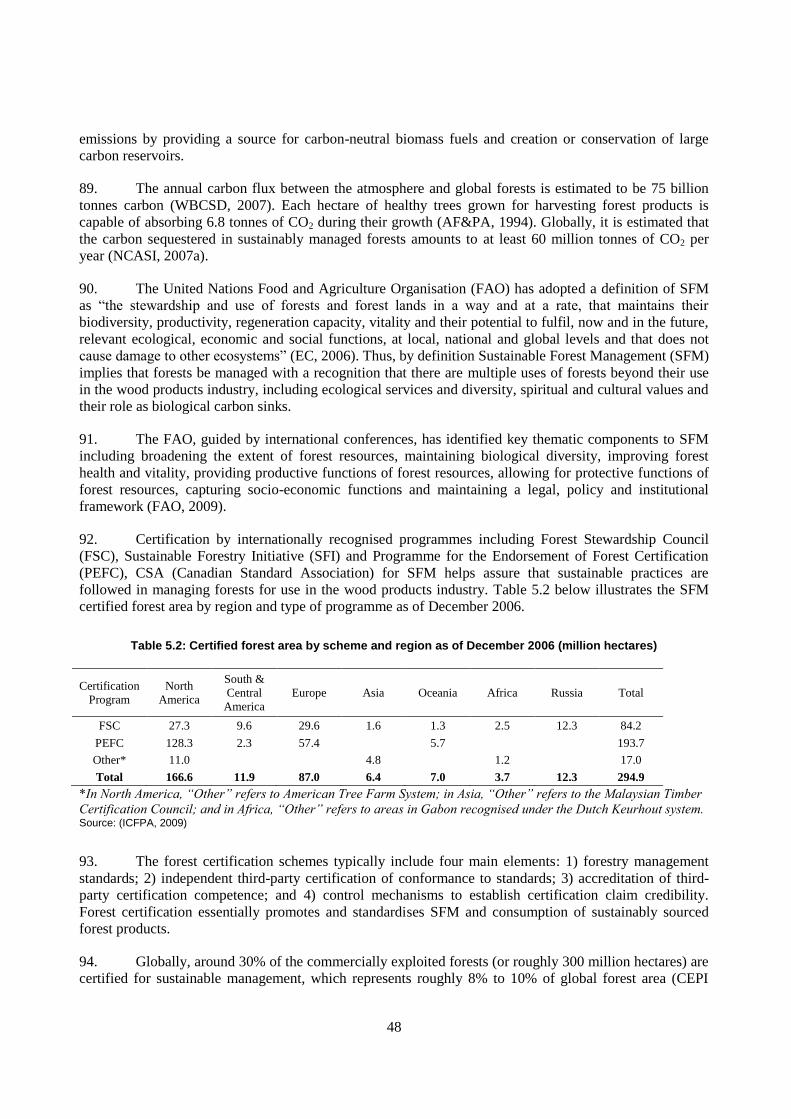
48
emissions by providing a source for carbon-neutral biomass fuels and creation or conservation of large
carbon reservoirs.
89. The annual carbon flux between the atmosphere and global forests is estimated to be 75 billion
tonnes carbon (WBCSD, 2007). Each hectare of healthy trees grown for harvesting forest products is
capable of absorbing 6.8 tonnes of CO2 during their growth (AF&PA, 1994). Globally, it is estimated that
the carbon sequestered in sustainably managed forests amounts to at least 60 million tonnes of CO2 per
year (NCASI, 2007a).
90. The United Nations Food and Agriculture Organisation (FAO) has adopted a definition of SFM
as ―the stewardship and use of forests and forest lands in a way and at a rate, that maintains their
biodiversity, productivity, regeneration capacity, vitality and their potential to fulfil, now and in the future,
relevant ecological, economic and social functions, at local, national and global levels and that does not
cause damage to other ecosystems‖ (EC, 2006). Thus, by definition Sustainable Forest Management (SFM)
implies that forests be managed with a recognition that there are multiple uses of forests beyond their use
in the wood products industry, including ecological services and diversity, spiritual and cultural values and
their role as biological carbon sinks.
91. The FAO, guided by international conferences, has identified key thematic components to SFM
including broadening the extent of forest resources, maintaining biological diversity, improving forest
health and vitality, providing productive functions of forest resources, allowing for protective functions of
forest resources, capturing socio-economic functions and maintaining a legal, policy and institutional
framework (FAO, 2009).
92. Certification by internationally recognised programmes including Forest Stewardship Council
(FSC), Sustainable Forestry Initiative (SFI) and Programme for the Endorsement of Forest Certification
(PEFC), CSA (Canadian Standard Association) for SFM helps assure that sustainable practices are
followed in managing forests for use in the wood products industry. Table 5.2 below illustrates the SFM
certified forest area by region and type of programme as of December 2006.
Table 5.2: Certified forest area by scheme and region as of December 2006 (million hectares)
Certification
Program
North
America
South &
Central
America
Europe Asia Oceania Africa Russia Total
FSC 27.3 9.6 29.6 1.6 1.3 2.5 12.3 84.2
PEFC 128.3 2.3 57.4 5.7 193.7
Other* 11.0 4.8 1.2 17.0
Total 166.6 11.9 87.0 6.4 7.0 3.7 12.3 294.9
*In North America, “Other” refers to American Tree Farm System; in Asia, “Other” refers to the Malaysian Timber
Certification Council; and in Africa, “Other” refers to areas in Gabon recognised under the Dutch Keurhout system. Source: (ICFPA, 2009)
93. The forest certification schemes typically include four main elements: 1) forestry management
standards; 2) independent third-party certification of conformance to standards; 3) accreditation of third-
party certification competence; and 4) control mechanisms to establish certification claim credibility.
Forest certification essentially promotes and standardises SFM and consumption of sustainably sourced
forest products.
94. Globally, around 30% of the commercially exploited forests (or roughly 300 million hectares) are
certified for sustainable management, which represents roughly 8% to 10% of global forest area (CEPI

49
2009). As shown in Figure 5.1 below, Canada is clearly the leader in forest certification accounting for 124
million hectares or 40% of the total amount of certified forest in the world (FPAC, 2007a).
Figure 5.1: Certified forest area for select countries (millions of hectares as of December 2006) Source: FPAC, 2007a
95. The potential is great to increase the area of forests that are sustainably managed. The
International Council of Forest and Paper Associations (ICFPA) has recently prioritised the support of an
increase in the certification of SFM (ICFPA, 2005). Continued international collaboration and discussion
on promoting and certifying SFM is an important initiative for the pulp and paper industry.
5.2 Pulping
96. The pulping stage of the fibre life-cycle is a major contributor to energy use, GHG emissions and
water use. There are considerable opportunities for reducing these environmental impacts at this stage.
5.2.1. Energy Use and GHG Emission Reduction Opportunities
97. There are important opportunities for reducing energy use and GHG emissions by: 1) power
generation improvements via efficiency gains of boilers and electricity generators at pulp mills; 2)
reducing the GHG-intensity of fuels used in pulp mills; and 3) capturing and sequestering carbon. In
addition, within the pulping and bleaching processes, existing technologies and process improvements
could improve energy efficiency in a conventional pulp mill from 5 to 30% on average, depending upon a
mill‘s process, age and location (Jacobs & IPST, 2006).

50
Power generation improvements
Three examples of technologies for improving the efficiency of boilers and electricity generators in
pulp and paper mills include: 1) combined heat and power (CHP) systems; 2) integration of pulp
and paper mills; and 3) the potential for commercial-scale development of black liquor gasification
(IEA, 2007; Jacobs & IPST, 2006).
1. Combined heat and power: CHP involves the on-site cogeneration of electricity and steam
for use in pulp and papermaking (or other industrial) processes. When CHP is used to
replace stand-alone electricity or heat production at low efficiencies, large improvements in
energy efficiency are possible. The IEA estimates that CHP typically results in efficiency
savings of 10 to 20% in pulp and paper mills and that more than 50% of CHP used in the
pulp and paper industry is produced from combustion of black liquor in recovery boilers
(IEA, 2007, pp. 196, 197). An additional opportunity is to use gas turbine cogeneration
systems for CHP. Depending on the system configuration, total gas turbine system
efficiencies can reach as high as 95%—much higher than the efficiencies achieved by
conventional boilers using steam turbine generators for electricity cogeneration (Upton,
2001, p. 47).
2. Integration of mechanical, chemical and recycled pulp mills: Integration of pulp and
paper mills, where possible, can also realise a large reduction in energy use across pulping
and papermaking processes. Integration eliminates the necessity for drying pulp before the
papermaking process and enables greater opportunities for waste heat recovery
opportunities between the two plants. Through these opportunities, integrated pulp and
paper mills can achieve efficiency gains between 10 and 50% relative to non-integrated
mills (EC, 2001, pp. 52-56; IEA, 2007, p. 189).
3. Gasification of black liquor and pulping chemicals (chemical pulping): Black liquor
gasification is a developmental-scale technology that has a significant potential to improve
the efficiency of on-site heat and power generation if established on a commercial-scale.
Currently, black liquor is typically fired in Tomlinson recovery boilers at relatively low
efficiencies due to the high water content of black liquor and the low boiler operating
pressures. Pressurised gasifiers could offer a safer, more efficient alternative that would
produce a clean-burning syngas which could be used in highly-efficient gas turbine systems
(Jacobs & IPST, 2006, pp. 48, 65). Using current gasification technologies, the IEA
estimates that a typical non-integrated kraft pulp plant could produce 220 – 335 kWh
excess electricity per tonne of pulp, improving electric efficiency by 10% for the same
level of steam efficiency. Gasification is currently in use on a demonstration scale, but
further research is required to improve operational reliability and integration with gas
turbine technologies (IEA, 2008, pp. 506-507).
Switching to less GHG-intensive fuels
A second category of opportunities involve switching to fuels that emit less GHGs. The pulp and
paper industry already supplies a large amount of its own energy from biomass resources, which is
considered GHG-neutral if sourced from sustainably managed forests. To the extent that electricity
and fossil fuels are still purchased from external sources, however, effective utilisation of biomass
and switching to low-GHG fuels such as natural gas can contribute to GHG reductions.
Opportunities for increasing recovery and use of wood wastes are also beneficial for reducing GHG
emissions. As an example, from 1980 to 2008, the Swedish pulp and paper industry increased
biofuel use by 70% while reducing oil consumption by two-thirds; this has helped achieve a 40%
reduction in fossil CO2 emissions since 1990, while pulp and paper production has increased
(Skogs Industrierna, 2009, pp. 26, 30).

51
Carbon capture and sequestration
A third opportunity involves capturing CO2 emissions from fuel combustion and sequestering these
emissions in underground storage reservoirs. Carbon capture and sequestration (CCS) technology is
unlikely to be deployed on a commercial scale in the near term, but sizeable reductions in GHG
emissions might be realised over the long-term. By 2050, the IEA estimates that CCS could reduce
global emissions from black liquor combustion by 200 million tonnes of CO2 under aggressive
GHG-reduction policies (IEA, 2008, p. 508). It is conceivable that, from the standpoint of net
carbon flux, the pulp and paper industry could actually remove CO2 from the atmosphere via the
extensive use of CCS and continued combustion of sustainably sourced biomass (NCASI, 2009).
5.2.2. Chemical Pulping Energy and Water Use Reduction Opportunities
98. Within the specific steps of the pulping process, there are many opportunities to reduce energy
and water use across all the major sources of consumption that were outlined in Section 4.1. Examples of
practices that can be applied along different stages of the chemical pulping process are given in Figure 3.4
and described below, roughly in the order of the different process steps.
Table 5.3: Potential practices for reducing energy use, GHG emissions and water use during chemical pulping
Process Step Practice Category Description of Benefit Source
Wood
preparation Dry debarking
Energy,
GHG
emissions
and water
use
Debarking is done without water;
water is used only for log washing
after debarking and for de-icing
logs in cold climates. Reduces toxic
emissions leaching from wood into
water; can reduce water use by 80%
at debarking stage. Lower moisture
content in the waste sent to hog fuel
boilers, which improves boiler
efficiency.
EC, 2001, p. 61
Cooking Digester
modernisation
Energy use,
GHG
emissions
Digesting consumes 20 – 25% of
energy used for pulping and
bleaching; efficiency improvements
in modern digesters can halve the
steam required for cooking, relative
to conventional batch digesters.
Jacobs & IPST,
2006, p. 45
Screening
and washing
Closed
screening of
unbleached pulp
Water use
Closing the screening water loop
eliminates discharges from the
screening plant. Organic
compounds can be recovered and
combusted in the recovery boiler.
EC, 2001, p. 65
Screening
and washing
Recirculate
clean
condensate from
evaporators
Energy use,
GHG
emissions
Recirculating clean condensate
from the evaporators minimises
shower water use, which reduces
energy use requirements at the
evaporation stage.
EC, 2001, p. 61
Efficient
washing Water use
Modern washing systems can halve
the amount of organic pollutants
carried over into the bleaching
stage, which reduces chemical use
and effluent discharges in the
bleach plant.
EC, 2001, p. 77

52
Process Step Practice Category Description of Benefit Source
Evaporation Evaporator
modernization
Energy use,
GHG
emissions
Evaporation consumes 20 – 50% of
energy use during pulping and
bleaching. Modern evaporators can
reduce energy use by 10 – 15%
relative to conventional systems.
Jacobs & IPST,
2006, p. 48.
Additional
lignin
removal
Extended
delignification
and oxygen
delignification
Water use
Extended delignification increases
the rate of lignin removal in the
cooking process. Oxygen
delignification occurs between pulp
washing stages and exposes the
pulp to oxygen at elevated
temperatures. Lowering the lignin
content of chemical pulps reduces
bleaching chemical requirements.
Increased lignin recovery can de-
bottleneck the recovery boiler when
pulp production at a mill is
increased.
EC, 2001, p.
65-68
Jacobs & IPST,
2006, p. 46
Bleaching
Elemental
chlorine-free or
total chlorine-
free bleaching
Water use
Bleaching without elemental
chlorine can reduce the presence of
molecular chlorine by nearly an
order of magnitude. Chlorine-free
bleaching eliminates discharges of
organically-bound chlorine
compounds and corrosion issues,
which makes it easier to reduce
discharges from the bleach plant by
recirculating water to the chemical
recovery plant.
Zhi Fu et al.,
2005
Enzymatic
bleaching
Energy use,
GHG
emissions
and water
use
Pre-treating unbleached pulp with
enzymes can facilitate lignin
removal and reduce the need for
bleaching chemicals (i.e., bleach
boosting). Can reduce energy use
and GHG emissions associated with
producing bleaching chemicals by
7% relative to conventional
bleaching.
Skals et al.,
2008
Mild acidic
hydrolysis
Energy use,
GHG
emissions
and water
use
Hexenuronic acids in the
unbleached pulp can be removed by
treating the pulp with a mild acidic
stage just prior to bleaching.
Removing these acids reduces the
consumption of bleaching
chemicals required for the same
level of paper brightness.
Nilsson et al.
2007, p. 19
Use of
secondary heat
in bleaching
Energy use,
GHG
emissions
Pre-heating chlorine dioxide in
elemental chlorine-free (ECF)
bleaching can reduce steam demand
at the bleaching plant, reducing
energy use.
Jacobs & IPST,
2006, p. 46

53
Dry debarking During wood preparation, the logs received at the pulp mill can be debarked dry, instead of in large
pools of water. This practice can reduce the volume of water consumed during wood preparation by
5 – 10 m3/air-dry tonne and can also improve the efficiency of hog fuel boilers that burn the bark
and wood residues from wood preparation by reducing the moisture of these fuels. Emission levels
from dissolved organic compounds, nutrients and toxic resin acids that leach from wood into the
water are also reduced with dry debarking (EC, 2001, p. 61).
Digester modernisation (chemical pulping)
In the cooking stage where wood chips are converted into fibres, efficiency improvements in
modern batch or continuous digesters can achieve substantial reductions in energy use relative to
conventional systems. A U.S. Department of Energy study estimated that modernised digesters
consume half of the 4 GJ/air-dry tonne of pulp required from steam in conventional batch digesters
(Jacobs & IPST, 2006, p. 45). Since cooking accounts for roughly 20 to 25% of total energy use
from pulping and bleaching, improving the efficiency of older systems is a significant area for
reducing energy consumption.
Closed-cycle pulp screening and cleaning
After cooking, effluent water discharges can be reduced or eliminated by closing, or re-circulating,
the water loop used to screen knots and shives (wood fragments) from the unbleached pulp (i.e.,
brown stock). In a closed screening loop, organic compounds in the water are recovered and sent to
the recovery boiler, water is reused in the process and the screening plant does not discharge
effluent (EC, 2001, p. 65).
Washing system modernisation Efficiency improvements in pulp washing can also yield important energy and water use benefits.
Since evaporation of the black liquor extracted from the washing process is the one of the largest
sources of energy consumption during pulping and bleaching, reducing the amount of washing
water can also have an important effect on reducing energy use (Jacobs & IPST 2006, p. 45). At the
same time, washing is important since the fraction of black liquor that remains in the pulp after
washing consumes chemicals in the bleaching stage and increases overall emissions to water.
Efficient washing systems can halve the amount of pollutants that are carried over into the
bleaching stage (EC, 2001, p. 77).
Evaporator modernisation Opportunities to reduce energy use in the evaporation plant are very important, since this step is the
largest source of energy consumption in the pulping and bleaching process. The evaporator uses
steam to evaporate water from black liquor retrieved after washing until the fraction of liquor solids
is high enough for firing in a recovery boiler. Multiple evaporative stages can be used to improve
the efficiency of steam utilisation. Compared to a 4-stage system that consumes 670 kJ/kg of water
evaporated, a 7-stage evaporator consumes 42% less energy. Vapour re-compression evaporative
units can also be used to raise the liquor solids fraction with waste steam before the evaporator
(Jacobs & IPST, 2006, pp. 47, 48).
Improved lignin removal through extended cooking and oxygen delignification (chemical
pulping)
Chemical consumption and effluent discharges in the bleach plant can also be reduced by removing
a greater share of the lignin from unbleached pulp. At the cooking stage, this can be done through
extended cooking in either batch or continuous digesters. After cooking, oxygen delignification can
be performed between washing steps. Under oxygen delignification, the unbleached pulp is
54
exposed to oxygen at elevated temperatures to remove as much of the remaining lignin as possible.
Oxygen delignification can achieve a delignification efficiency of 40 to 60% (EC, 2001, p. 66).
Elemental chlorine free (ECF) or total chlorine free (TCF) bleaching using ozone or enzymes
(chemical pulping)
The bleaching stage of chemical pulping is the largest source of water use and water emissions.
Chlorine-based bleaching chemicals result in emissions of organically-bound chloride compounds.
These compounds create corrosion problems that make it difficult to circulate effluent from
bleaching through the chemical recovery plant; as a result, effluent is typically discharged to
external wastewater treatment. Elemental chlorine-free (ECF) bleaching uses chloride dioxide
instead of elemental chloride to reduce the formation of molecular chlorine by nearly an order of
magnitude, which in turn lowers the emission of organically-bound chloride compounds to water.
Total chlorine-free (TCF) bleaching uses other chemicals, such as peroxide, to bleach the pulp,
eliminating chlorine from the process entirely (EC, 2001; Zhi Fu et al., 2005).
Alongside ECF and TCF bleaching, ozone is typically added as a bleaching step. Exposing the pulp
to ozone in the bleaching process lowers the amount of chlorine dioxide required for ECF
bleaching and it facilitates the peroxide TCF bleaching process (EC, 2001, p. 68). Unbleached pulp
can also be treated with special enzymes in a ―bleach boosting‖ step that facilitates the removal of
lignin and reduces the need for bleaching chemicals. A recent study by Skals et al. (2008) found
that the use of a xylanase enzyme in bleach boosting can reduce the GHG emissions from
producing bleaching chemicals by 7%. The authors did not quantify the reduction in chlorine
compound emissions to water, but asserted that enzyme pretreatment provides important
environmental benefits. . Similar to ―bleach boosting‖, the partial substitution of ECF by enzyme
bleaching was studied by Zhi Fu et al. (2005) who found that enzyme bleaching significantly
improved environmental performance, particularly when the enzyme mediator is manufactured on-
site.
5.2.3. Energy and Water Use Reduction Opportunities in Mechanical Pulping
99. With respect to mechanical pulping, the largest source of energy is in the form of electricity
consumption from grinding the wood into fibres. During this process, 90% of the electrical energy input is
converted into heat through friction (IEA, 2007, p. 182). Opportunities for reducing energy and water use
for mechanical pulping are summarised in Table 5.4 below.
Pressurised groundwood grinding
In conventional groundwood pulping, logs are forced against rotating stones with a hydraulic ram.
During grinding, water is used to wash and cool the stone. By pressurising the conventional
groundwood process, higher water temperatures can improve fibre separation by softening the
lignin bonds. Steam removed from the pressurised vessel can also be recovered for secondary heat.
Recover exhaust steam from thermomechanical pulping
In thermomechanical (TMP) pulping, chips are ground between steel discs in refiners. Exhaust
steam from refiners can be recovered and used to heat water or to produce clean steam for other
processes. Installing pressurised refiners maximises opportunities for heat recovery. Recovered
heat from the refiners can offset energy inputs for paper drying or stock heating in integrated pulp
and paper mills (Upton, 2001, p. 118).
100. Biotechnology-related techniques such as the development of biochemically modified fibres, the
use of enzymes and membranes, using starch and synthetic polymers and the use of genomics to maximise
fibre quality could also aid in increasing the efficiency in the mechanical pulping process (CFIC, 2006).

55
5.2.4. Water Use Reduction Opportunities
101. Similar opportunities exist for mechanical pulping plants to improve washing efficiency and to
close or recirculate water loops in order to avoid discharging organic pollutants and nutrients.
Chemithermomechanical (CTMP) pulps commonly use an activated sludge treatment to reduce discharges
of organic pollutants. In situations where a high level of treatment is necessary, or where existing water
resources are scarce, it may be possible to evaporate some or all of the contaminated wastewater and
incinerate the remaining solids for energy recovery (EC, 2001, pp. 195-197).

56
Table 5.4: Potential practices for reducing energy use, GHG emissions and water use during mechanical
pulping
(TMP = thermomechanical pulping; CTMP = chemithermomechanical pulping) Process Step Practice Category Description of Benefit Source
Wood
preparation Dry debarking
Energy, GHG
emissions, and
water use
See dry debarking in Figure 34. EC, 2001 p. 61
Grinding
Replace
conventional
groundwood
grinding with
pressurised
groundwood
grinding;
biotechnology-
related
improvements
Energy use, GHG
emissions
Can improve the quality of
pulp produced, or reduce the
amount of energy required per
tonne of pulp. Improves
opportunities for exhaust steam
recovery.
Upton, 2001 p.
123
Recover exhaust
steam from
TMP pulping
Energy use, GHG
emissions
Overall, efficiency
improvements in TMP pulping
could reduce energy use by
one-third relative to
conventional TMP pulping.
Jacobs & IPST,
2006
Screening
and washing
Efficient
washing Water use
Can improve the amount of
organic pollutants removed
from pulp for the same amount
of water consumption.
EC, 2001, pp.
191-197
Screening
and washing
(con.)
Close,
recirculate water
loops
Water use
Can improve the efficiency of
water use while lowering
effluent discharges.
EC, 2001, pp.
191-197
Wastewater
treatment
Evaporate
wastewater from
CTMP process
Water use
Where water resources are
limited, can reduce or eliminate
water discharges by
evaporating some or all of
contaminated wastewater and
incinerating the remaining
waste solids for energy
recovery.
EC, 2001
5.3 Papermaking
102. Large amounts of energy are required in the papermaking process, primarily for drying the paper
once it has been formed from pulp. Any reduction in water use during stock preparation, forming and
pressing can result in important energy savings during the drying stage. The IEA estimates that 25 to 30%
of total energy use across the pulp and paper industry is consumed by pulp drying and that opportunities
exist for a 20 to 30% improvement in energy efficiency (IEA, 2008, p. 507). Examples of some of the
many practices for reducing energy use, GHG emissions and water use across the papermaking process are
shown in Table 5.5.

57
Table 5.5: Sample of potential practices for reducing energy use, GHG emissions and water use during papermaking
Process Step Practice Category Description of Benefit Source
Stock
Preparation
Cleaning and
screening
improvements
Energy use,
GHG
emissions
Improvements in screening can
reduce sheet breaks and can
eliminate need for centrifugal
cleaners.
Jacobs & IPST,
2006, p. 50
Refining
improvements
Energy use,
GHG
emissions
Hybrid conical refiners can provide
high maintenance and refining
efficiencies and can reduce refining
energy consumption by 40 to 70%.
Generally, best practice refining
techniques can result in energy
savings of approximately 20%
relative to conventional processes.
Jacobs & IPST,
2006, p. 50
EC, 2001, p.
394
Stock
Preparation
(con.)
Compact wet-
end systems
Energy use,
GHG
emissions
Compact wet-end systems can realise
lower pumping, agitation
requirements. Also allows a shorter
time for changing grades which
reduces stock loss and overall energy
use. Can reduce energy consumption
by 25% in certain cases.
Jacobs & IPST,
2006, p. 50
Forming
High-
consistency
forming
Water use,
energy use,
GHG
emissions
Can achieve consistencies of 4% to
potentially 8 or 10%, relative to 0.5
to 1% in traditional paper machines.
Reduces water use and yields a
reduction in energy required to dry
the paper after forming.
Jacobs & IPST,
2006, pp. 63-64
Pressing &
drying
Press and drying
system
modernization
Water use,
energy use,
GHG
emissions
Improved removal of water through
pressing can greatly increase drying
efficiency. General rule of thumb is a
1% improvement in press
consistency equals a 4%
improvement in drying efficiency.
Use of shoe presses (or wide-nip
presses) can achieve a 20 – 30%
improvement in drying efficiency.
EC, 2001, p.
390; Jacobs &
IPST, 2006, p.
51.
5.4 Transportation
103. As discussed in the Section 4, transportation is an important component of the pulp and paper
industry allowing for the movement of raw materials, finished goods and recovered fibre. There are three
main transportation pathways that should be considered as a means to reduce energy and associated GHG
emissions within the paper life-cycle.
5.4.1 Decreased Transportation Distances for Wood Fibre to Pulp and Paper Mills
104. The first is a strategy to decrease transportation distance from the wood fibre to mills (note that
this strategy does not apply to situations where timber is rafted to riverside mills from upstream forests; in
such situations, where transportation-related emissions are limited to skidding the wood to the river and
guiding the lumber rafts downstream with tugs, emissions are only weakly related to distance to the mill).
Clearly, paper mills that are located closer to harvested forests will require less transport and therefore less
58
energy and associated GHG emissions. This strategy is in some ways an ancillary benefit to the
overarching best management practice of the integration of pulp and paper mills to achieve greater energy
efficiency across the life-cycle (discussed in Section 5.2). However, an important trade-off to consider is
the relative proximity of the consumer market for finished pulp and paper products. Transportation-related
energy and associated GHG emissions could be somewhat larger at this stage of the pulp and paper life-
cycle. Locating papermaking facilities near demand centres makes sense both economically and from a
GHG reduction standpoint since this will minimise transportation distances of wood fibre to pulp and paper
mills. However, market demand fluctuations could complicate the strategic placement of papermaking
facilities.
5.4.2 Increased Use of Rail versus Truck for Transportation Mode and/or increased Truck Fuel Efficiency
105. In concert with minimising transport distance, another important best management practice is
using more efficient transportation modes (i.e., use of rail vs. truck) throughout the pulp and paper life-
cycle. Both in terms of energy and GHG emissions, the use of rail as a transport mode of choice would
greatly reduce environmental impacts. Theoretically, using rail to transport pulp and paper materials (either
upstream as raw material input or downstream as finished product) rather than truck transport could reduce
energy use by approximately 2 MJ per km and GHG emissions by 0.14 kg CO2 per tonne of material based
on the relative fuel efficiency. Practically, the Heinz study found that the GHG emissions from transport of
raw wood materials to mills using rail is roughly half as compared to similar transportation distances using
truck (The Heinz Centre, 2006).
5.4.3 Supply Chain Optimisation
106. The efficient transport of materials via an optimised pulp and paper supply chain system can
reduce energy consumption and GHG emissions. Information systems, such as Enterprise Resource
Planning (ERP) systems are becoming increasingly important in optimising pulp and paper supply chains
and enabling more efficient routing of materials across the fibre life-cycle (Carlsson et al., 2006). In
Europe, longer and larger trucks (up to 44 tonnes carrying capacity) and flexible systems, such as the
European Modular System (EMS), are currently under discussion (CEPI, 2009). The adoption of these
systems would decrease the number of freight journeys and subsequently reduce energy use and the
associated GHG emissions from transport.
5.5 End-of-life
107. Considering the assumptions and issues discussed in Section 4, the recovery and recycling of
paper is considered a best management practice towards achieving enhanced SMM. A recent metastudy of
LCA studies on the recycling and disposal of paper and cardboard concluded that less environmental and
energy impacts occur via recycling than either landfilling or incineration (ETC, 2004).
108. Generally speaking, more energy is consumed in virgin paper production (and subsequent
disposal via landfilling or incineration) than recycling (ETC, 2004). Other meta-analyses have also shown
that using recycled fibre as opposed to virgin fibre has a lower energy use profile than either landfilling or
incineration (The Heinz Center, 2006). When compared to the virgin paper manufacturing process, the
recycling process is less integrated and has additional energy requirements for generating pulp (such as de-
inking and decontamination), but the overall energy profile indicates large savings as opposed to virgin
paper production (IEA, 2007). In other words, the energy that otherwise would have been used in raw
material harvesting and virgin pulp production is saved via recycling. In the North American context, the
energy savings associated with recycling paper at the end-of-life far outweigh both landfilling and
combustion with energy recovery. As shown in Table 4.11 in Section 4, the energy savings for recycling
59
paper range from 12-19 GJ per tonne (except for magazines). Factoring in the diversion of paper to a
landfill without methane recovery would add almost another 1 GJ to avoid the energy associated with
transport and equipment use at the landfill.
109. In the European context, using recycled pulp as opposed to virgin pulp offers a net energy
savings potential of roughly 7-11 GJ per tonne (IEA, 2007 and CEPI, 2006). The IEA Energy
Technologies Perspectives 2008 notes that ―between 10 and 20 GJ/t can be saved per tonne of paper
recycled, depending on type of pulp and the efficiency of the pulp production it replaces‖. Although there
is a range of absolute energy savings across different regions and studies, there is a clear indication that
recycling paper saves energy.
110. Depending on key assumptions such whether forest or landfill carbon storage are considered and
variations in the fuel mix associated with the production of virgin versus recycled content fibre, a
comparison of GHG emissions from recycling versus disposal via landfilling or combustion is less clear.
Generally, the majority of the energy consumed in virgin fibre paper production is derived from biomass,
which is considered biogenic and sustainable. Such emissions are not included in the accounting of total
GHG emissions consistent with guidance from the Intergovernmental Panel on Climate Change (IPCC) for
developing national GHG inventories. In contrast, in the production of paper from recovered fibre (i.e. the
paper recycling process), the majority of energy is derived from fossil fuels (for electricity and/or direct
use) (ETC 2004). The relative GHG benefit of recycling as opposed to virgin paper production is largely
dependent on the underlying fuel mix associated with the production of the various paper types. As
discussed in Section 4, the forest carbon sequestration benefit of incremental reduction in harvesting via
recycling also greatly determines the net GHG benefit (EPA, 2006).
111. Finally, carbon storage in landfills, particularly for mechanically pulped papers such as
newspaper, also affects the GHG landfilling benefit for certain paper types (see Table 4.10). Noting these
key assumptions, there can be significant GHG benefits from paper recycling. In the United States the
range is roughly 2 – 4 tonnes CO2e/tonne compared to landfilling with methane recovery for energy and 2
– 3 tonnes CO2/tonne compared to combustion with energy recovery. In Europe, the range is almost 1
tonne CO2e/tonne compared to landfilling with methane recovery for energy and less than 0.5 tonnes
CO2e/tonne compared to combustion (EPA, 2006; Smith et al., 2001).
112. Also, it is important to note that the electricity grid fuel mix differs greatly across regions. In the
United States, the electricity grid mix is more carbon-intensive because of a heavy reliance on fossil fuels,
particularly coal (almost 50% of electricity is generated using coal) (EIA, 2007). In Europe, the fuel mix is
less carbon-intensive (less than 30% of electricity generated in Europe is from coal) (EC, 2009). Therefore,
the avoided emissions credit for combustion with energy recovery and landfilling with energy recovery
will differ greatly depending on the regional fuel mix. Generally, regions with heavy reliance on carbon-
intensive fuels for electricity generation are the ones where avoiding these emissions shows the greatest
GHG benefit.
113. The marginal benefits from recycling versus landfilling and incineration need to be weighed
against the additional GHG burden of transport to and from long distance recycling facilities (e.g. to
China), where most of the recovered paper global trade flow is occurring (see Section 3). As mentioned in
Section 4, the largest trade flows for recovered paper occur as exports from North America and Europe to
China. Even though the distance is large between the generation and reprocessing of recovered paper, the
transportation mode is via ship, which on a per tonne basis has a relatively small energy and GHG
emission impact. A recent study conducted in England to assess the relative benefits of shipping recovered
paper to China found that the additional transportation-related impacts did not change the conclusion that
recycling of paper has a lower GHG emissions impact as opposed to virgin production. The absolute
transport emissions of recovered paper to China from England comprised only 10% of the median savings
60
from recycling (WRAP, 2008a). Ultimately, there is a benefit from recycling (i.e. avoided emissions from
harvesting and pulping virgin paper) regardless of location (Potter, 2008).
114. Within the context of an increased focus on recycling as an end-of-life best management practice,
there is increased incentive to utilise inks and adhesives that do not impair recyclability (CEPI 2009). It is
equally important to improve collection and sorting of recovered paper through specific collection schemes
(source segregated or multi-stream as opposed to co-mingled or single stream as discussed in Section 6)
allowing for an increase in the use of recovered materials in products that require increasing performance
and quality (AF&PA, 1994 and CEPI, 2009).
115. Paper cannot be recycled indefinitely and recovered paper does not normally have the same
quality and functionality as virgin paper (ETC, 2004). Therefore, sustainably sourced virgin fibre will
continue to play an integral role in the manufacture of paper. However, there is large potential to increase
the global paper recycling rate to a theoretical maximum estimated at 81% (IEA, 2007). For the remaining
fibre stream bound for disposal, combustion with energy recovery is the preferable fate since paper and
paperboard have relatively high heating values and their combustion produces energy which can displace
utility-generated electricity. Finally, although the landfill disposal of fibre types that generate more
methane as compared to the carbon that remains stored in the landfill (see Table 4.10) should be avoided,
there is still potential for landfill methane capture and energy generation to displace utility-generated
electricity. Most likely, methane emissions from paper products in landfills will continue to be reduced
over time as recovery rates increase (NCASI, 2007a).
116. Finally, it should be recognised that source reduction of paper in practices such as lightweighting
packaging, double-sided printing and copying and paper reuse are important aspects of the paper life-cycle
and will ultimately prevent the harvesting, production and the necessity to dispose and manage paper at the
end-of-life. Options to re-use paper can be implemented across a wide-variety of applications (e.g. scratch
writing pads, animal bedding liners, packaging fillers, etc.) as well as the options for source reduction (e.g.
electronic communication, reduced packaging, re-usable grocery bags, etc.).

61
6. DRIVERS AND BARRIERS TO SUSTAINABLE MANAGEMENT OF WOOD FIBRES
117. This section discusses key drivers and barriers to Sustainable Materials Management (SMM) in
the wood fibres industry. Based on the promising technologies and management practices identified in
Section 5, the factors that can lead to their adoption or are likely to slow or impede their implementation
are examined.
118. This section uses three broad categories to define key drivers and barriers that influence SMM for
wood fibres products:
Technical, or physical drivers and barriers;
Economic, or market-based drivers and barriers; and
Social and policy-based drivers and barriers.
119. For each category, the drivers and barriers are discussed in Sections 6.1, 6.2 and 6.3 through
examples from the best management practices and technologies that were summarised in Section 5. We use
these major drivers and barriers to broadly assess the technical, economic and social impacts of best
management practices and technologies in Section 6.4.
6.1 Technical Drivers and Barriers
120. Technology can be a powerful lever for achieving the best management practices (described in
Section 5) of reduced energy use, GHG emissions and water use across the fibres life-cycle. However, it is
also important to acknowledge practical realities and technological limitations. Three specific ways in
which technologies drive improved environmental performance include the following:
1. Incremental upgrades and improvements in existing or retiring equipment and processes, over
time, add up to achieve significant improvements in environmental performance at similar—or
better—levels of reliability, safety, cost and product quality.
2. New technologies that are realised at a commercial scale in pulp and paper mills can contribute to
step-changes in environmental performance, enabling new capabilities that were previously
unavailable.
3. Technologies can enable synergies with one another, resulting in additional reductions in
environmental impacts.
121. An example of an SMM opportunity that is being promoted by these technology-based drivers is
increased and efficient use of biomass resources as fuel within the pulp and paper industry. Although the
three drivers outlined above are not the only factors that influence this practice, they play a central role in
increasing the effectiveness and extent of biomass utilisation. For example, pulp and paper mills have
achieved substantial efficiency improvements in the use of biomass and other fuels. The IEA estimates that
the global pulp and paper sector has increased the energy efficiency of its heat consumption by roughly
10% on average from 1990 to 2003 and that a significant potential exists for further improvement using
currently-available technologies (IEA, 2007, p. 192). Alongside these incremental improvements, black
liquor gasification, while still at a developmental stage, could realise a sizeable improvement in the
efficiency of black liquor combustion if becoming viable at a commercial scale. The IEA estimates that
between 2030 and 2050 with a financial investment of USD 300 per tonne of pulp, black liquor
62
gasification could reduce energy consumption at pulp mills globally by 15-23% (IEA, 2008, p. 507).
Finally, deployment of black liquor gasification could in turn facilitate carbon capture technologies and
enable greater use of highly-efficient gas turbine CHP systems.
122. At the same time, technologies and practices that improve environmental performance must be
applied in a way that is consistent with technical and operational characteristics of pulp and paper mills. In
some cases, the timeframes, trade-offs and operational requirements that plant operators face may limit the
opportunities to implement specific technologies or improve certain aspects of environmental performance.
These considerations include the following:
1. Slow rates of capital turnover limit the opportunities available for reducing energy and water use
in the short term. New technologies that replace or change existing equipment in many cases
must follow maintenance, expansion or turnover cycles, which can be on the order of years to
decades.
2. Trade-offs exist among opportunities to reduce energy use, GHG emissions, water use and other
environmental impacts from pulp and paper mills. Pulp and paper mill operators must optimise
among multiple criteria including, such as operational reliability, product quality, health and
safety, energy efficiency, water efficiency, air emissions, solid waste generation
3. Decisions made to reduce environmental impacts within one area or phase of the fibre life-cycle
may limit opportunities in other areas or phases.
123. First, the capital investment required to build and maintain pulp and paper facilities is high. Once
operational, equipment life-time can be long: the average chemical pulp mill has a design lifetime of 25
years or more (WBCSD, 2007, p. 8). Early retirement of capital stock can be expensive and difficult and
long lead-times may be required to implement changes in facility designs and processes. Due to the
complex and extremely energy-intensive capital equipment employed in the pulp and paper industry, there
are noticeable cycles in building capacity and the transition to better technologies in order to meet
increasing demand. The cycles for the entire industry are related to the demand cycle, with profitable
periods providing the resources to build capacity later. Capacity-building cycles for major renovations and
technology transitions from planning through construction have a period of roughly five years (EDF,
1995b).
124. In general, older equipment is less advanced and less efficient than new equipment. To the extent
possible, increasing the rate of capital stock turnover can speed the adoption of modern technologies and
processes and can lead to significant efficiency gains. In order to evaluate energy efficiency across
different regions, Pöyry Consulting uses a measure of ―technical age‖—the relative age of a particular
plant, accounting for upgrades and improvements. Roughly speaking, North American and Latin American
plants tend to be older than in Europe; for example, the average technical age of printing and writing paper
mills currently in North America is estimated at 18 years, compared to 12 to 13 years in Europe (IEA,
2006, p. 7).
125. Second, trade-offs among various opportunities can impose technological limits on the extent to
which energy use, GHG emissions and water use can be reduced. For example, Nilsson et al. (2007, pp.
17-19) noted that, while closure of water loops in pulp and papermaking can reduce effluent discharges
from plants, closure also increases the complexity of the process, which can cause breaks in the paper
forming process, higher energy use and solid waste generation and can limit the quality of paper produced.
As a result, it is important to consider the integrated environmental impacts of best available technologies
and practices and to promote overall improvement in environmental performance with an understanding of
the interrelated nature of the fibre life-cycle (Nilsson et al., 2007, pp. 10-12).

63
126. As noted earlier, carbon capture and sequestration (CCS) has been identified as a potential long-
term technology for the fibres industry that could, at least conceptually, make the industry a net sink of
GHGs provided that the CO2 that is captured and sequestered is of biogenic origin and sustainably
harvested. There are a number of technical barriers to this technology that are the subject of intense
research throughout the world. Although this research is primarily in the context of prospects for reducing
the net emissions from the electric power sector, it applies to other large industrial point sources such as
the wood fibre industry. The basic technology for CCS has been demonstrated in the petroleum extraction
for several decades, but not at the scale or geographic extent that would be needed for application at paper
mills. Key technical barriers at this juncture include the integration of capture, transport and storage
technology, demonstrating the ability to capture and store large volumes of CO2 and the development of
monitoring technologies to ensure minimal leakage to the atmosphere.
127. Implementing certain technologies or practices at one stage may limit opportunities for reducing
environmental impacts at a later stage. Designing or retrofitting pulp and paper facilities requires certain
decisions to be made that may constrain the range of opportunities available to reduce certain
environmental impacts. As explained by Nilsson et al. (2007, p. 11):
A well-known, old example illustrates a mill, which has first concentrated on emissions to air
and water and then on water consumption, achieving very good performance. When turning to
solid waste, its options are already limited by the choices made and for energy and chemicals the
limitations increase even further.
128. Even when considering environmental impacts integrated across the fibre life-cycle, prioritising
certain attributes such as pulp type, paper quality, operational reliability and health and safety issues, may
limit the range of opportunities for reducing energy use, GHG emissions and water use.
6.2 Economic Drivers and Barriers
129. The costs and benefits of SMM practices for fibres are a central issue in deciding how to set
priorities and reduce environmental impacts. For SMM to be realised efficiently, efforts should seek to
maximise societal benefits and minimise societal costs. In many places, economic considerations drive
reductions in energy use, GHG emissions and water use. In other areas, market barriers may prevent SMM
from achieving efficient outcomes.
130. Three examples of key economic drivers that contribute to SMM of fibres include the following:
1. Cost savings that are achieved by reducing energy use, water use, or by eliminating effluent
streams that require extensive treatment. Reductions in these areas use resources more efficiently
and also lower GHG emissions and the discharges of pollutants from pulp and paper mills.
2. Access to markets that enable the sale of by-products or recycled material streams in the fibre
life-cycle. As the demand and access to markets for by-products and recycled materials from
fibre products increases, private-sector decision-makers have a greater incentive to use resources
more efficiently and recover materials streams to a greater extent.
3. Including environmental benefits when evaluating the costs and benefits of decisions to
implement SMM practices for fibre products.
131. For example, economic drivers have played a role in the adoption of CHP by the pulp and paper
industry. First, by generating electricity alongside the heat requirements for the facility, pulp mills can
generate energy more efficiently and realise cost savings. The economic incentive to be energy efficient is
greater in areas with higher average electricity prices, as shown in Figure 6.1. Other factors, such as the
types of pulp produced, industry size and structure and regional market differences are also important
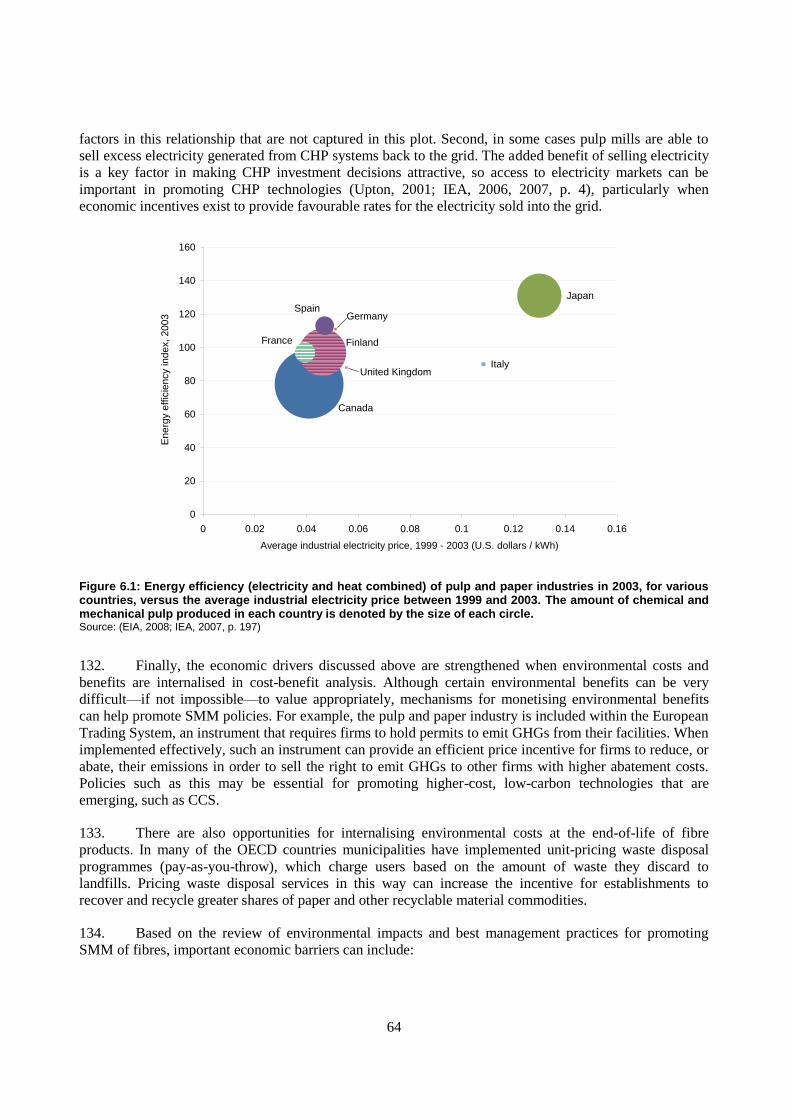
64
factors in this relationship that are not captured in this plot. Second, in some cases pulp mills are able to
sell excess electricity generated from CHP systems back to the grid. The added benefit of selling electricity
is a key factor in making CHP investment decisions attractive, so access to electricity markets can be
important in promoting CHP technologies (Upton, 2001; IEA, 2006, 2007, p. 4), particularly when
economic incentives exist to provide favourable rates for the electricity sold into the grid.
Japan
Italy
Canada
Finland
Spain
France
Germany
United Kingdom
0
20
40
60
80
100
120
140
160
0 0.02 0.04 0.06 0.08 0.1 0.12 0.14 0.16
Average industrial electricity price, 1999 - 2003 (U.S. dollars / kWh)
En
erg
y e
ffic
ien
cy in
de
x,
20
03
Figure 6.1: Energy efficiency (electricity and heat combined) of pulp and paper industries in 2003, for various countries, versus the average industrial electricity price between 1999 and 2003. The amount of chemical and mechanical pulp produced in each country is denoted by the size of each circle. Source: (EIA, 2008; IEA, 2007, p. 197)
132. Finally, the economic drivers discussed above are strengthened when environmental costs and
benefits are internalised in cost-benefit analysis. Although certain environmental benefits can be very
difficult—if not impossible—to value appropriately, mechanisms for monetising environmental benefits
can help promote SMM policies. For example, the pulp and paper industry is included within the European
Trading System, an instrument that requires firms to hold permits to emit GHGs from their facilities. When
implemented effectively, such an instrument can provide an efficient price incentive for firms to reduce, or
abate, their emissions in order to sell the right to emit GHGs to other firms with higher abatement costs.
Policies such as this may be essential for promoting higher-cost, low-carbon technologies that are
emerging, such as CCS.
133. There are also opportunities for internalising environmental costs at the end-of-life of fibre
products. In many of the OECD countries municipalities have implemented unit-pricing waste disposal
programmes (pay-as-you-throw), which charge users based on the amount of waste they discard to
landfills. Pricing waste disposal services in this way can increase the incentive for establishments to
recover and recycle greater shares of paper and other recyclable material commodities.
134. Based on the review of environmental impacts and best management practices for promoting
SMM of fibres, important economic barriers can include:
65
1. High capital investment requirements for certain technologies that can achieve substantial
environmental benefits.
2. Uncertainty or variability in market prices and the demand for products with a lower
environmental impact.
3. Economic trade-offs between improved environmental performance at one point in the fibre life-
cycle or increased costs and environmental effects at another point.
135. CCS provides a good example of the first barrier. Despite the current potential to capture and
sequester emissions from biomass burning, a principal barrier to realising this technology at a commercial
scale is the cost to capture CO2, which is estimated to be roughly USD 30-70/tonne CO2. This cost takes
into account the cost of the solvent to capture the CO2, as well as the large amount of energy required for
both capture and compression. Transport and storage costs are less by comparison, though not
insignificant, at USD15-30/tonne CO2. Overall, the substantial amount of capital needed to design,
construct and operate a CCS system remains a large obstacle to deployment of these technologies. In
addition, there is currently a lack of insurance instruments available to industry, which will be necessary to
manage projects with a risk.
136. An example of a second type of economic barrier is variability in the secondary market for
recovered wood fibres. Like other commodities, the market prices fluctuate with the global economy and
recently, market prices for recycled products have decreased drastically (Biddle, 2008). In the United
States, fibre products in particular have seen dramatic decreases in recycling market prices including
cardboard (decrease of 75%), mixed paper (decrease of 90%) and newsprint (decrease of 92%) in the last
quarter of 2008. While pulp mills may benefit from decreases in recycled paper feedstock costs, the
decrease in recycling markets means that processors and brokers of the recovered materials will likely lose
money in the reprocessing of paper products. Certain paper recovery systems may be buffered against
economic volatility: multi stream collection scheme systems, where the recovered fibre is of higher quality,
have shown resilience to recent price variations. For example, the European recovered paper market, which
largely utilises a source-separated multi stream collection scheme, continued reasonably well amidst the
global economic slowdown in 2008, while the low quality recovered paper from single stream collections
in the UK suffered (CEPI, 2009).
137. Finally, it is important to take an integrated view of economic issues along the fibre life-cycle.
Improvements in environmental performance at one life-cycle stage must be balanced against costs,
product quality and environmental impacts at earlier or later stages. For example, the system costs of
recycling are dependent mainly on the collection scheme. The two most common approaches for the
collection of recyclables include single-stream (co-mingled) or multi-stream (source-separated). Single-
stream recycling is a system that collects a mixture of all recyclables together and subsequently separates
and processes these materials. Multi-stream recycling is a system where recyclable materials are separated
at source (i.e. prior to collection, such as at curbside) and subsequently recovered and processed.15
138. In some regions, there is an ongoing debate on which system is ultimately superior. Each system
has pros and cons that can be complicated to evaluate across the fibre life-cycle. Single stream recycling
incorporates increased costs for processing recovered paper after collection, but overall paper recovery can
be greater due to the simpler collection scheme. At the same time, multi-stream recycling can realise
reduced processing costs after collection and lower rates of paper contamination, at the expense of
increased collection costs (CRI, 2009). The quality and usability of the recovered material in the multi-
stream collection scheme is generally superior and prevents transportation and handling of unusable
15
In Europe, a recently revised Waste Directive dictates that all member states install a multi stream (i.e. source
separated) collection scheme for recovered paper by 2015 (CEPI, 2009). Single stream recycling is more prevalent in
the United States (AF&PA, 2004).
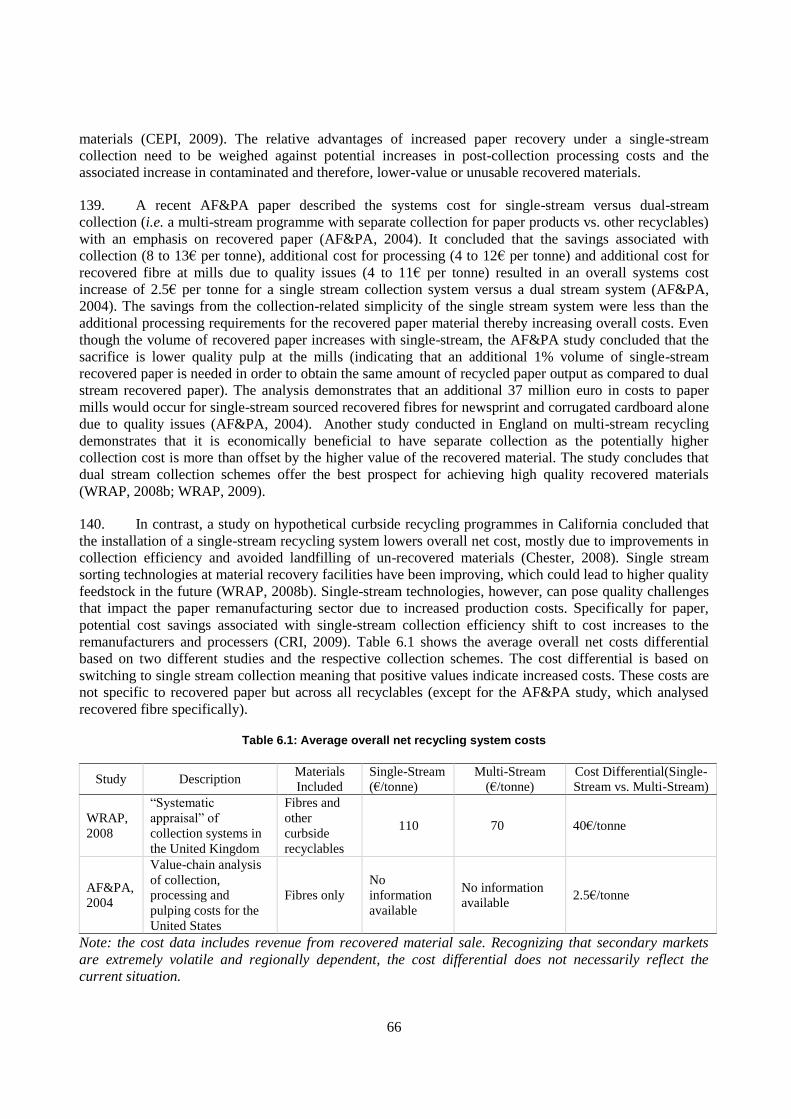
66
materials (CEPI, 2009). The relative advantages of increased paper recovery under a single-stream
collection need to be weighed against potential increases in post-collection processing costs and the
associated increase in contaminated and therefore, lower-value or unusable recovered materials.
139. A recent AF&PA paper described the systems cost for single-stream versus dual-stream
collection (i.e. a multi-stream programme with separate collection for paper products vs. other recyclables)
with an emphasis on recovered paper (AF&PA, 2004). It concluded that the savings associated with
collection (8 to 13€ per tonne), additional cost for processing (4 to 12€ per tonne) and additional cost for
recovered fibre at mills due to quality issues (4 to 11€ per tonne) resulted in an overall systems cost
increase of 2.5€ per tonne for a single stream collection system versus a dual stream system (AF&PA,
2004). The savings from the collection-related simplicity of the single stream system were less than the
additional processing requirements for the recovered paper material thereby increasing overall costs. Even
though the volume of recovered paper increases with single-stream, the AF&PA study concluded that the
sacrifice is lower quality pulp at the mills (indicating that an additional 1% volume of single-stream
recovered paper is needed in order to obtain the same amount of recycled paper output as compared to dual
stream recovered paper). The analysis demonstrates that an additional 37 million euro in costs to paper
mills would occur for single-stream sourced recovered fibres for newsprint and corrugated cardboard alone
due to quality issues (AF&PA, 2004). Another study conducted in England on multi-stream recycling
demonstrates that it is economically beneficial to have separate collection as the potentially higher
collection cost is more than offset by the higher value of the recovered material. The study concludes that
dual stream collection schemes offer the best prospect for achieving high quality recovered materials
(WRAP, 2008b; WRAP, 2009).
140. In contrast, a study on hypothetical curbside recycling programmes in California concluded that
the installation of a single-stream recycling system lowers overall net cost, mostly due to improvements in
collection efficiency and avoided landfilling of un-recovered materials (Chester, 2008). Single stream
sorting technologies at material recovery facilities have been improving, which could lead to higher quality
feedstock in the future (WRAP, 2008b). Single-stream technologies, however, can pose quality challenges
that impact the paper remanufacturing sector due to increased production costs. Specifically for paper,
potential cost savings associated with single-stream collection efficiency shift to cost increases to the
remanufacturers and processers (CRI, 2009). Table 6.1 shows the average overall net costs differential
based on two different studies and the respective collection schemes. The cost differential is based on
switching to single stream collection meaning that positive values indicate increased costs. These costs are
not specific to recovered paper but across all recyclables (except for the AF&PA study, which analysed
recovered fibre specifically).
Table 6.1: Average overall net recycling system costs
Study Description Materials
Included
Single-Stream
(€/tonne)
Multi-Stream
(€/tonne)
Cost Differential(Single-
Stream vs. Multi-Stream)
WRAP,
2008
―Systematic
appraisal‖ of
collection systems in
the United Kingdom
Fibres and
other
curbside
recyclables
110 70 40€/tonne
AF&PA,
2004
Value-chain analysis
of collection,
processing and
pulping costs for the
United States
Fibres only
No
information
available
No information
available 2.5€/tonne
Note: the cost data includes revenue from recovered material sale. Recognizing that secondary markets
are extremely volatile and regionally dependent, the cost differential does not necessarily reflect the
current situation.
67
141. In the short-term, whether a single-stream or dual-stream recycling system is in place, pulp and
paper mills may need to adjust their operations based on the quality of the recovered paper feedstock to
optimise production costs. This requires an investment in areas like pulping modification,
cleaning/decontamination and drum pulpers (AF&PA, 2004). The quality of recovered paper determines its
market value and can be an important component in the economics of recycling of wood fibres, so it is
important to study the full life-cycle implications of economic and environmental impacts in order to
maximise the benefits of recycling efforts relative to their costs.
6.3 Social Drivers and Barriers
142. As with any large industry, social and political pressures sometimes drive the adoption of certain
management practices in the pulp and paper industry. Improving SMM in this sector will be motivated by
some key societal and policy-related drivers including:
1. Increased consumer awareness of environmental sustainability issues associated with the paper
manufacturing sector;
2. Domestic and multi-national regulations and policy frameworks that seek to address global
challenges, such as climate change and other forest-related environmental impacts; and
3. The contribution of wood fibre products to society in terms of employment and community well-
being.
143. Growing consumer demand for environmentally friendly products and the significant role that
forests play in the mitigation of climate change are key drivers in the sustainable management of forests.
Sustainable forest management (SFM), in turn is a key best management practice to SMM and one in
which policy can provide further expansion of this practice. SFM integrates social, environmental and
economic functions of forest resources, recognizing that the ability to efficiently use these resources in the
pulp and paper industry is of paramount importance (Nabuurs et al., 2007). Increased consumer awareness
on corporate sustainability and the application of product- and company-specific carbon footprints also
serve as important societal drivers for pulp and paper companies to source their fibre from SFM forests.
144. Since emerging as a global priority at the 1992 United Nations Conference on Environment and
Development (UNCED), both the EU and North America have regulated forest resource management and
adopted high rates of forest certification that verifies SFM. In Europe, the European Commission created a
strategy for sustainable management and development of forests that helps to improve the ecological and
environmental stability of forests and the production of forestry-related products. This strategy includes
five approaches that will encourage continuous improvement in SFM, including implementation of
environmental regulation, integration of environmental issues into policy, collaboration with businesses
and consumers, access to data and information and improved land use conservation ideals (EC, 2006).
145. In the United States, regulations on forest management have guided the development of laws for
the protection of national forest systems in terms of resources, cultural values, minerals and wildlife
(Brown, 2004). For example, all 175 company members of the American Forest and Paper Association
(AF&PA) must comply with the Sustainable Forestry Initiative (SFI) and promote sustainable forest
management practices on all sourced forests they own as a condition of their membership.
146. In Canada, the Forest Products Association of Canada (FPAC) pledged that all of its forestry
operations would become certified to one of three internationally recognised standards for SFM (Canadian
Standards Association, Forest Stewardship Council or Sustainable Forestry Initiative). This has been
achieved across 138 million hectares that are now third-party certified for almost all (93%) of Canada‘s
publicly-owned and regulated forests (FPAC, 2007). The Programme for Endorsement of Forest
68
Certification Schemes (PEFC) has certified 194 million hectares worldwide, which covers a quarter of
global round wood production.
147. Conversely, public acceptance can also pose a barrier to certain SMM practices, as is the case
with carbon CCS. Recent studies have shown that only a small percentage of the population have even
heard of CCS and those that have heard know little about the technology and risks. While demonstration
projects have shown that the risks of CCS are low, misperceptions about how CO2 is stored as well as
concern about the creation of large ―CO2-disposal‖ sites beneath the ground have the potential to be major
barriers.
148. Second, creating policies to promulgate SFM is an important step to promoting SMM in the pulp
and paper industry. Guidance from the United Nations Forum on Forests includes policy frameworks that
incorporate forest law, science and research, monitoring and reporting and public awareness, among others.
In this context it is important to utilise various incentives and tools to promote SFM on the national level
but especially in developing nations. Incentives include ―creation of market access to non-timber forest
products, promotion of agro-forestry, creation of payment for environmental services schemes and the
decentralisation of management in the form of community based forest management‖ (Patosaari, 2007).
The expansion of SFM is also a political tool for reducing deforestation and illegal logging. The causes of
deforestation are complex and driven mainly by agriculture, infrastructure development and urbanisation
factors, but promoting SFM policies, particularly in developing nations, is an opportunity to mitigate
deforestation and enhance the credibility of SFM (The Forest Dialogue, 2008).
149. Finally, another important driver for SMM is the global interconnectedness and diversity of the
pulp and paper industry and its contribution to economic development worldwide. For an industry that
employs almost 13 million people across 200 nations, the importance of SMM cannot be overstated.
Particularly for poorer nations that depend on forest resources and their products, the very existence of the
pulp and paper industry contributes to alleviating poverty and advancing community well-being.
150. At the same time as social and political drivers can encourage SMM practices, implementing
these practices can also be hindered by social and political barriers including:
1. A lack of access to data and information in areas that can support SMM practices;
2. Imbalanced resources available for promoting SMM related practices in developing countries
relative to developed countries; and
3. Weak enforcement and governance of existing SMM practices and incipient legal and regulatory
frameworks for emerging SMM opportunities.
151. The lack of data collection and information sharing can hinder the adoption of practices,
technologies and lessons learned that could otherwise promote SMM of fibres. Currently, governments,
individual companies and pulp and paper trade organisations collect data concerning energy, emissions,
water use and production. However, not only do quality and availability inconsistencies exist on data
collected per paper type across various national or corporate level entities, but often the underlying data are
kept confidential. The IEA has recently discussed the need for ―international effort to harmonise data
collection‖ to allow for energy and resource comparisons and improvements (IEA, 2007).
152. The industry could benefit from information sharing, which would allow for important industry
benchmarking measures and a more complete assessment of best practices employed, energy consumed
and technological obstacles overcome. The International Council of Forest and Paper Associations
(ICFPA) Sustainability Progress Update for the pulp and paper industry describes that effective
environmental management systems are key necessities in establishing measurable targets and
consumption levels, while driving performance improvements (ICFPA, 2007). Currently, these systems are
69
lacking in various paper companies throughout the industry. In Europe, CEPI has a target of 100%
coverage of environmental management systems in the European pulp and paper production; in 2006, a
level of 83% was achieved (CEPI, 2007b). Trade organisations can influence members to submit and share
data on their processes. Paprican has recently conducted a benchmarking study that details energy
consumption per mill in terms of specific unit process areas, which can be applied to different mills across
Canada (Paprican, 2008). These types of benchmarking studies will be valuable in assessing and tracking
energy use across the pulp and paper industry, particularly since individual mills vary greatly.
153. The EU recently instituted a tracking/measuring programme through its REACH (Registration,
Evaluation, Authorisation and Restriction of Chemical substances) Regulation. This programme strives to
identify and track chemical substances used across all industries. Individual companies contribute data on
the properties and use of various chemicals to a central database to which both consumers and stakeholders
will have access. Through these improvements in registering chemicals and communicating chemical
hazards, industry can realise safety and public health benefits, as well as improved control over chemical
releases to the environment across the pulp and paper industry. A similar voluntary programme for the
pulp and paper industry (in concert with other manufacturing industries) to track raw materials, chemicals
and fuels consumption would provide a transparent repository of data. In terms of recovered paper supply
chain, a traceability system16
was recently launched in Europe that attempts to keep track of recovered
paper supplies as well as enforcing quality management (CEPI, 2009). Ultimately, these tracking and
reporting programmes will allow for more focused polices and best management practices to have a greater
impact on reducing consumption of natural resources and energy while also mitigating emissions.
154. Second, another important challenge in achieving SMM, particularly in regards to SFM, is the
financing and availability of funding for these efforts as well as weak policy frameworks for direct
investment in SFM practices in some regions (The Forest Dialogue, 2008). In developing nations,
capitalising on SFM‘s benefits has remained a challenge as the internal costs and benefits of maintaining
the sustainably sourced forest goods are imbalanced (The Forest Dialogue, 2008). There is a general
difficulty of obtaining external funding in developing nations which is crucial to the development of SFM
practices. Private sector funding in forest related goods and services could likely impact the desirability of
sustainably managed forests. Climate change mitigation strategies could also provide valuable revenue and
incentives to allow for SFM to become more economically attractive (The Forest Dialogue, 2008).
155. Even with adequate funding, unless sufficient enforcement practices behind achieving best
management practices are in place, it will be difficult to achieve high rates of adoption. Governance is
particularly important at the harvesting stage (to enforce SFM) and at end-of-life (to promote recycling).
Strict enforcement of raw material sourcing from sustainably managed forests will encourage the continued
increase in SFM global forest area and discourage illegal logging practices and deforestation. At the end-
of-life, increased accountability of paper recycling efforts on individual consumers and corporations will
offer a clear signal that paper recycling is encouraged and important.
156. In the case of CCS, incipient legal and regulatory frameworks pose a barrier to deployment.
Issues that still need to be resolved include the permitting process to create, monitor and close CO2 storage
sites, surface and underground property rights, long-term liability for damages, pipeline infrastructure
development and regulation, crediting and ownership for CO2 storage and legal uncertainties over how and
whether other environmental laws may apply.
16
For more information, see www.recoveredpaper-id.eu.

70
6.4 Assessment of Impacts of Technical, Economic and Social Drivers and Barriers on Best
Management Practices
157. Of the drivers and barriers discussed above, Table 6.2 below illustrates a simplified list of
technical, economic and social drivers and barriers that affect each of the best management practices
described in Section 5. Although this is not an exhaustive list, its intent is to show how various best
management practices are influenced by the drivers/barriers across the pulp and paper life-cycle stage.
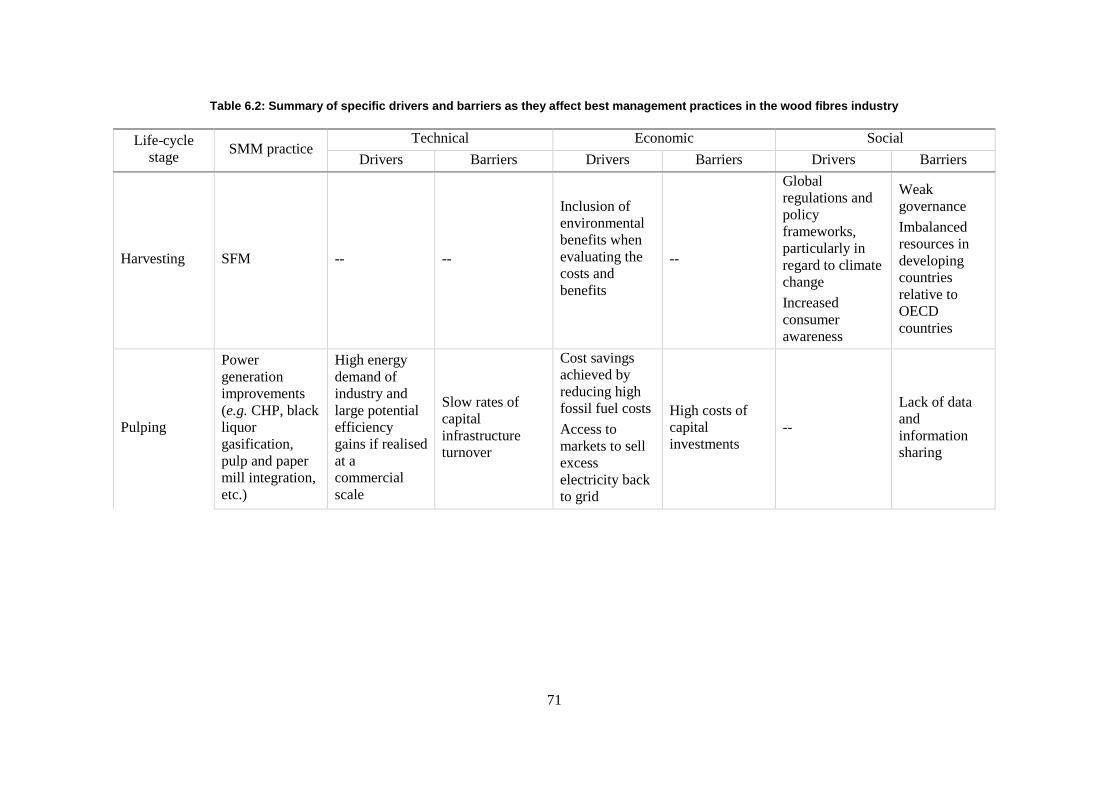
71
Table 6.2: Summary of specific drivers and barriers as they affect best management practices in the wood fibres industry
Life-cycle
stage SMM practice
Technical Economic Social
Drivers Barriers Drivers Barriers Drivers Barriers
Harvesting SFM -- --
Inclusion of
environmental
benefits when
evaluating the
costs and
benefits
--
Global
regulations and
policy
frameworks,
particularly in
regard to climate
change
Increased
consumer
awareness
Weak
governance
Imbalanced
resources in
developing
countries
relative to
OECD
countries
Pulping
Power
generation
improvements
(e.g. CHP, black
liquor
gasification,
pulp and paper
mill integration,
etc.)
High energy
demand of
industry and
large potential
efficiency
gains if realised
at a
commercial
scale
Slow rates of
capital
infrastructure
turnover
Cost savings
achieved by
reducing high
fossil fuel costs
Access to
markets to sell
excess
electricity back
to grid
High costs of
capital
investments
--
Lack of data
and
information
sharing

72
Life-cycle
stage SMM practice
Technical Economic Social
Drivers Barriers Drivers Barriers Drivers Barriers
Pulping (con.)
Increased
biomass and
switching to less
GHG-intensive
fuels
High current
use of biomass
in industry
--
Cost savings
achieved by
reducing high
fossil fuel costs
Value of
biomass for use
in forest
products chain
Increased
competition
with other
demands, such
as biofuels,
electricity
generation
Increased
consumer
awareness of
environmental
sustainability
issues
Balance with
use of biomass
against social
and other
commercial
uses
Pulping (con.) CCS
Large potential
to avoid CO2
emissions if
realised on a
commercial
scale
Technological
capability of
transport and
storage as well as
monitoring
technologies to
ensure minimal
leakage to the
atmosphere.
Further R&D
still required to
realise on a
commercial scale
Putting a price
on
environmental
benefits (i.e.
carbon market
prices)
High level of
capital
investment
required
Global
regulations and
policy
frameworks,
particularly in
regard to climate
change
Incipient legal
and regulatory
frameworks
particularly in
regard to
permitting,
crediting and
monitoring

73
Life-cycle
stage SMM practice
Technical Economic Social
Drivers Barriers Drivers Barriers Drivers Barriers
Pulping (con.)
Reducing
energy, GHG
emissions and
water use during
pulping and
bleaching
processes
Large potential
for
improvement
from
incremental
upgrades using
existing
technologies
Slow rates of
capital turnover
Trade-offs
between reducing
environmental
impacts and
other criteria (i.e.
safety, quality,
reliability)
Improvements at
one stage may
limit
opportunities in
later stages
Cost savings
achieved by
reducing high
fossil fuel costs
Inclusion of
environmental
benefits when
evaluating costs
and benefits
High capital
investments
required
Economic trade-
offs between
improving
environmental
performance and
other criteria
(e.g. quality)
Regulations and
policies that seek
to address
environmental
challenges (e.g.
climate change,
water
conservation,
etc.)
Lack of data
and
information
sharing
Imbalanced
resources for
promoting
SMM in
developing
countries
relative to
OECD
countries
Weak
enforcement
and
governance
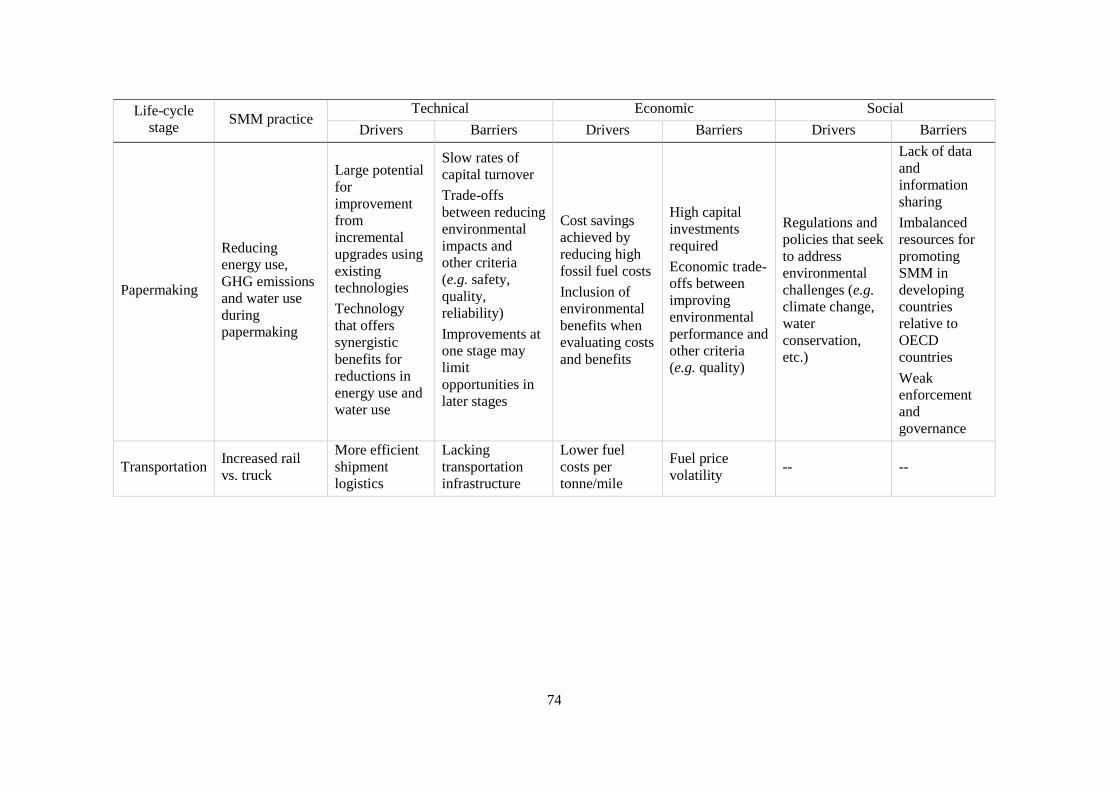
74
Life-cycle
stage SMM practice
Technical Economic Social
Drivers Barriers Drivers Barriers Drivers Barriers
Papermaking
Reducing
energy use,
GHG emissions
and water use
during
papermaking
Large potential
for
improvement
from
incremental
upgrades using
existing
technologies
Technology
that offers
synergistic
benefits for
reductions in
energy use and
water use
Slow rates of
capital turnover
Trade-offs
between reducing
environmental
impacts and
other criteria
(e.g. safety,
quality,
reliability)
Improvements at
one stage may
limit
opportunities in
later stages
Cost savings
achieved by
reducing high
fossil fuel costs
Inclusion of
environmental
benefits when
evaluating costs
and benefits
High capital
investments
required
Economic trade-
offs between
improving
environmental
performance and
other criteria
(e.g. quality)
Regulations and
policies that seek
to address
environmental
challenges (e.g.
climate change,
water
conservation,
etc.)
Lack of data
and
information
sharing
Imbalanced
resources for
promoting
SMM in
developing
countries
relative to
OECD
countries
Weak
enforcement
and
governance
Transportation Increased rail
vs. truck
More efficient
shipment
logistics
Lacking
transportation
infrastructure
Lower fuel
costs per
tonne/mile
Fuel price
volatility -- --

75
Life-cycle
stage SMM practice
Technical Economic Social
Drivers Barriers Drivers Barriers Drivers Barriers
End-of-life Increased
recycling
Recovered pulp
is a major
component of
the productive
capacity of the
industry
Substantial
gains available
using existing
technologies /
practices to
recover paper
Recovered fibre
has varying
qualities and,
after tapping the
best sources,
decreasing
marginal quality
Cost savings
from using
recovered fibres
to offset
production of
virgin fibres
Access to
markets for
recovered paper
Secondary
market price
volatility
Economic trade-
offs between
maximizing
paper recovery
and the quality
of paper that is
recovered
Increased
consumer
awareness of
environmental
sustainability
issues
Increased
employment in
the recycling
industry
Consumer and
commercial
awareness and
participation
Enhanced
recyclability of
paper product in
manufacture
Current use and
availability of
adhesives and
inks that do not
impair
recyclability
The demand for
high quality
paper products
which are
generally utilise
a lower
percentage of
recycled
materials
Lower cost for
paper
production
Potentially
higher costs for
development
and production
of recycling
friendly inks
and adhesives
Increased
consumer
awareness of
environmental
sustainability
issues
Weak policy
framework to
standardise
recyclability of
fibre products
76
7. CONCLUSIONS
158. The primary goal of this section is to provide an overview of the future of the global pulp and
paper industry and conclude key opportunities and barriers for SMM in the fibres industry from the above
sections. The key opportunities and barriers highlight the intersection of large environmental impacts (by
fibre type or life-cycle stage), low economic costs (or net economic benefits) and high social benefits (such
as increased employment, lower human health impacts, etc.).
7.1 Trends
159. The market for paper and board will continue to grow globally at 2.3% per year to 2030, with
particularly rapid increases in developing and emerging economies (OECD, 2008). Most likely, the growth
of the market for paper and paperboard in emerging economies (particularly in Southeast Asia) will change
the current pattern of trade flows described earlier in this report.
160. Currently, the confluence of slow global economic growth and high capital costs has lowered
profitability within the pulp and paper sector. The sector is also vulnerable to a weakening demand for
printing and publishing, which the continued rise of electronic media may affect. Alternative materials for
packaging, such as plastic, steel and aluminium create other challenges for the pulp and paper sector.
Despite these constraints, the baseline scenario in the OECD Environmental Outlook projects growth of the
pulp and paper sector to2030 assuming a continuation of current trends in global production and demand
for paper (OECD, 2008).
161. On a national and regional level, China will continue to be a significant global producer (it is
currently the second largest producer of pulp and paper), as well as a significant importer, requiring
upwards of 50% of its own domestic demand to be met with imports. In India, although the paper market is
relatively small, continued growth of roughly 6% is expected through 2020 driven by strong demand for
high quality printing. A reduction in growth of production in Western Europe coupled with an increase in
demand in Eastern Europe will likely cause Europe to become a net importer by 2030. Overall, there is an
expected shift in production capacity from the traditional large producers (i.e. North America and Western
Europe) to emerging markets such as China, India and Latin America. As paper and paperboard
consumption continues to increase, with particular contributions from emerging markets, the barriers to
improved SMM in the pulp and paper sector are important to recognise and overcome. Similarly, the
opportunities for SMM can be seized by emerging markets with guidance from developed markets.
7.2 Opportunities
162. The wood fibre products industry is a heavy manufacturing sector, especially in the consumption
of natural resources and energy. There are, however, opportunities for reducing energy use, GHG
emissions and water use across the entire fibre life-cycle. Given the increasing importance of reducing
energy use, GHG emissions and water use and considering that OECD member countries produce and
consume the majority of the world‘s paper, the opportunities for SMM of wood fibres (i.e. pulp and paper
products) outlined in this study represent key elements in OECD‘s portfolio of options to support its
member countries in developing and implementing such SMM goals.
163. From a carbon management perspective, the wood fibre industry actively manages larger carbon
stocks and greater annual carbon throughput than any other industries except oil and gas, organic

77
chemicals, coal, electric power and agriculture. Excluding agriculture, it is unique among industries in
terms of its management of substantial quantities of biogenic carbon.
164. There is a direct correlation between energy use and GHG emissions. Ultimately, the emissions
profile of the pulp and paper industry is dictated by i) the management practices at forests from which
biomass is utilised (i.e. whether they are sustainably managed or not); ii) the GHG-intensity of other fuels
use to generate process heat and electricity; and iii) the management of fibre products at end-of-life. OECD
nations could significantly reduce overall GHG emissions resulting from the wood fibre products industry
by increasing sustainably sourced biomass fuel use and using less carbon-intensive fuels to generate energy
within the industry, while improving recovery and recycling of fibres products at end-of-life.
165. Research and development for promising technologies and practices, such as black liquor
gasification and recycling infrastructure efficiency gains, will play an important role over the medium- to
longer-term. Support for new approaches and technologies, such as carbon capture and sequestration
(CCS), should also be made available to enable further opportunities in the future.
166. To promote SMM across the wood fibre life-cycle, the following opportunities across the wood
fibre life-cycle could be pursued:
o Harvesting
One of the most important focus areas is to promote sustainable forestry management
(SFM) both within OECD and particularly with developing nations. This can be done
through certification systems and through support by OECD member countries.
Independent third-party certification and effective enforcement capabilities are crucial to
establishing credibility of SFM sourced paper products.
The use of wood biomass for paper products stores carbon and paper products are important
commodities with valuable economic and social benefits. It is important to recognise the
balance between using biomass as fuel within the pulp and paper industry and in other
industries and with its effective use as a raw material for pulp and paper products.
o Pulping and papermaking
Energy use, GHG emissions and water use are influenced by factors such as i) the type of
pulping process; ii) the type of paper produced; and iii) plant-specific characteristics such
as age, capacity, operation and maintenance. As noted earlier, the complexity of pulp and
paper mills implies that different technologies will have different potentials for individual
mills, so it is difficult to adopt a ―one size fits all‖ approach in adopting technologies and
practices. Instead, interventions that modernise older equipment and speed up the rate of
capital turnover can be particularly effective, particularly at stages where energy use, GHG
emissions and water use are high.
In the pulping stage, reductions in energy use between 20 to 30% could be achieved in
conventional mills by adopting existing technologies such as combined heat and power
(CHP) systems. Chemical and thermo-mechanical pulp mills offer the greatest potential for
energy savings.
In the papermaking stage, energy use could be reduced by roughly 30 to 40% in
conventional mills by adopting existing technologies. Paper drying in the papermaking
stage is the most energy-intensive process across the life-cycle consuming 15 to 25% of
total energy.
The use of biomass as a fuel source is an important asset in the pulp and paper industry.
Modern chemical pulp mills can technically be completely self-sufficient in energy
production and even be net energy producers. The continued and expanded use of

78
sustainably sourced biomass as an energy source – notably as a supplement for fossil fuel
use – is critical for the wood fibres industry.
Chemical pulping can be roughly twice as water-intensive as mechanical pulping.
Reductions in water use on the order of 25 to 50% are possible in conventional mills by
adopting technologies such as dry debarking, partial or full closure of certain water loops,
washing system improvements and elemental chlorine-free (ECF) or enzymatic bleaching.
o Transportation
The transportation component of the life-cycle is a relatively small contributor to energy
use, GHG emissions and water use. Nonetheless, some opportunities exist for energy and
GHG reduction such as optimisation of supply chains in order to reduce distances, coupled
with the improvement of the efficiency of transportation modes (i.e. more use of rail as
opposed to truck).
o End-of-life
Increasing recovery and recycling of wood fibre products offers significant environmental
benefits. The improvement of paper recycling through education, technology and policy is
crucial to achieving SMM.
Greater utilisation of recovered paper can be achieved by improving recovered paper
collection efficiency, reducing the rates of contamination and developing technologies and
pulping processes.
Revenue from the sale of recovered paper is a strong economic driver to fibres recycling.
Interventions that expand access to markets for recyclable commodities and pursue high-
quality, high-value recovered paper streams, can lever this economic driver for recycling
and reduce the impact of price volatility and uncertainty.
Recognizing that paper cannot be recycled indefinitely, discards sent to combustion
facilities should employ energy recovery systems. Pulp and paper discards and residues that
are sent to landfills should be minimised. Most paper types (especially those that are based
on chemical pulping) generate more methane in landfills as compared to the embodied
carbon that remains stored in the landfill. However, paper types high in lignin exhibit
different decomposition characteristics in landfills and degrade to a lesser extent. For
example, newspaper may degrade at a very slow pace, such that even when one accounts
for the high global warming potential of methane, the emissions are outweighed by the
accumulation of carbon within the landfill. In general, it is most important to divert paper
types that have high methane generation potential from disposal in landfills. The presence
or absence of landfill gas collection systems has a large effect on net GHG emissions from
landfills. If a landfill gas collection system is present, energy recovery (which can displace
some electric power from the grid that is otherwise generated by fossil fuels) can further
reduce net emissions.
Although overall energy use is lower for the production of recycled paper as opposed to
virgin paper, in some cases and regions (i.e. coated freesheet paper types in the United
States), the GHG emissions for recycling are marginally larger than virgin production. This
is due to the large amount of biomass used in the production of virgin paper in contrast to
the large amount of fossil fuels used in the production of recycled paper. However, when
considering the full life-cycle of paper, recycling reduces the amount of paper that
otherwise would have been landfilled and would subsequently produce GHG emissions in
the form of methane. The GHG reductions from avoided fibre landfilling more than
outweigh the additional GHG emissions from recycled paper manufacture. The overall
GHG profile for recycling paper will be even more beneficial if biomass and other non
fossil fuel sources are used in the manufacture of recycled paper.
79
167. Finally, across the entire life-cycle, source reduction of paper – in practices such as
lightweighting packaging, double-sided printing and copying and paper re-use – offers a comprehensive
approach to reducing the size of the environmental footprint of wood fibres.
7.3 Key Barriers to SMM
168. The study identified several technical, economic and social / political barriers that are already
impeding adoption of technologies and practices that would contribute to SMM. The barriers identified in
this study are not necessarily specific to the pulp and paper sector, but may as well exist in other sectors.
169. Key technical, economic and political barriers to achieving SMM include:
Limited data collection, monitoring and reporting via environmental management systems;
High capital costs of equipment and infrastructure as well as the volatility of fuel and
electricity costs;
Limited enforcement of regulated SMM best management practices, particularly SFM;
Limited outreach and education on consumer awareness of wood fibre sustainability issues,
particularly on end-of-life management to increase paper recycling efforts; and
Limited access to funding for research and development within the wood fibres industry,
especially on emerging, unproven, but promising technologies.
80
REFERENCES
AF&PA (1994), Agenda 2020: A Technology Vision and Research Agenda for America's Forest, Wood
and Paper Industry.
AF&PA (2004), Paper Recycling – Quality is Key to Long-term Success, American Pulp and Paper
Association, prepared by Jaakko Pöyry Consulting (JPC Consulting) and Skumatz Economic
Research Associates (SERA).
Biddle, David. (2008), Recycling Market Woes, BioCycle 49, no. 11 (November): 54,
http://www.jgpress.com/archives/_free/001763.html .
Brown, Amie. (2004), Selected Laws Affecting Forest Service Activities, USDA Forest Service, available
at: http://www.fs.fed.us/publications/laws/selected-laws.pdf .
BUWAL (1998), ‗Life Cycle Inventories for Packagings‘, Environmental Series no. 250, Swiss Agency for
the Environment, Forests and Landscape (SAEFL), Berne, cited in Smith et al., 2001.
Carlsson, D., S. D'Amours, A. Martel & M. Ronnqvist (2006), Supply Chain Management in the Pulp and
Paper Industry, Universite Laval, http://www.cirrelt.ca/DocumentsTravail/2006/DT-2006-AM-
3.pdf, accessed May 12, 2009.
Calcott, P., & M. Walls (2002), Waste, Recycling and “Design for Environment”: Roles for Markets and
Policy Instruments, Resources for the Future, http://www.rff.org/rff/Documents/RFF-DP-00-30-
rev.pdf, accessed March 30, 2009.
CEPI (2006), Special Recycling 2005 Statistics: European Paper Industry hits new record in recycling,
Confederation of European Paper Industries (CEPI),
http://www.cepi.org/content/default.asp?pageid=7, accessed October 27, 2008.
CEPI (2007a), Key Statistics 2007: European Pulp and Paper Industry, Confederation of European Paper
Industries (CEPI), Brussels.
CEPI (2007b), CEPI Sustainability Report 2007, Confederation of European Paper Industries (CEPI),
http://www.cepi.org/Objects/1/Files/CEPI%20SR%20FINAL%20WEB.pdf, accessed July 7, 2009.
CEPI (2008), Key Statistics 2007, Confederation of European Paper Industries (CEPI),
http://www.cepi.org/content/default.asp?pageid=226, accessed October 27, 2008.
CEPI (2009), Email correspondence from Jori Ringman, CEPI, to Christopher Evans, ICF, April 16, 2009.
CFIC (2006), Canadian Forest Innovation Council, Forest Science Policy Forum on Transformative
Technologies, Canadian Forest Innovation Council, Prepared by The Conference Board of Canada,
May 31, 2006.
81
CRI (2009), Understanding economic and environmental impacts of single-stream collection systems,
Container Recycling Institute (CRI), http://www.container-recycling.org/assets/pdfs/reports/2009-
SingleStream.pdf, accessed December 15, 2009.
Chester, M., E. Martin and N. Sathaye (2008), Energy, Greenhouse Gas and Cost Reductions for
Municipal Recycling Systems, Environmental Science and Technology, 42:2142-2149.
Dahlbo, H., J. Laukka, T. Myllymaa, S. Koskela, J. Tenhunen, J. Seppälä, et al. (2005), Waste management
options for discarded newspaper in the Helsinki Metropolitan Area, Finnish Environment Institute
(SYKE), http://www.miljo.fi/print.asp?contentid=131301&lan=en&clan=en, accessed April 21,
2009.
Dehoust, G., M. Buchert, W. Jenseit, F. Schulze, A. Hermann, J. Ferenz, et al. (2006), Development of the
Closed Cycle and Waste Management Policy Towards a Sustainable Substance Flow and Resources
Policy: Sub-project "Identification of Relevant Substances and Materials for a Substance Flow-
Oriented Resource-Conserving Waste Management", Institute for Applied Ecology, Öko-Institut
e.V, http://www.bmu.de/english/waste_management/reports/doc/37341.php, accessed March 13,
2009.
EDF (1995a), Paper Task Force: Recommendations for Purchasing and Using Environmentally Preferable
Paper, Environmental Defence Fund, Duke University, Johnson & Johnson, McDonald‘s, The
Prudential Insurance Company of America and Time Inc., Chapter 5: Pulp and Paper Manufacturing
1995.
EDF (1995b), Paper Task Force: White Paper No. 9: Economics of Manufacturing Virgin and Recycled-
Content Paper, Environmental Defence Fund, Duke University, Johnson & Johnson, McDonald‘s,
The Prudential Insurance Company of America and Time Inc.1995.
EC (2001), Reference Document on Best Available Techniques in the Pulp and Paper Industry, European
Commission (EC), http://eippcb.jrc.es/reference/, accessed April 14, 2009.
EC (2006), Forest-Based industries - Sustainable development, European Commission (EC), available at:
http://ec.europa.eu/enterprise/forest_based/311_en.html.
EC (2009), Statistical Pocketbook 2009. European Commission (EC): Energy, available at:
http://ec.europa.eu/energy/publications/statistics/statistics_en.htm.
EEA (1999), Environment in the EU at the turn of the century, European Environment Agency (EEA),
cited in Smith et al., 2001.
EIA (2008), Electricity Prices for Industry 1999 – 2007, Energy Information Administration (EIA),
http://www.eia.doe.gov/emeu/international/elecprii.html, accessed May 5, 2009.
EIA (2007), Annual Energy Review: 2007 "Electricity Flow for 2007”, Energy Information Administration
(EIA), available at: http://www.eia.doe.gov/emeu/aer/pdf/aer.pdf.
EPA (2002), Profile of the Pulp and Paper Industry, 2nd Edition, U.S. Environmental Protection Agency
(EPA),
http://www.epa.gov/Compliance/resources/publications/assistance/sectors/notebooks/pulp.html,
accessed March 30, 2009.
82
EPA (2006), Solid Waste Management and Greenhouse Gases: A Life-Cycle Assessment of Emissions and
Sinks, U.S. Environmental Protection Agency (EPA),
http://epa.gov/climatechange/wycd/waste/reports.html, accessed October 22, 2008.
EPA (2007), Municipal Solid Waste in the United States: Facts and Figures for 2006, Office of Solid
Waste and Emergency Response, U.S. Environmental Protection Agency, Washington, DC.,
available at: http://www.epa.gov/epaoswer/non-hw/muncpl/msw99.htm .
EPA (2008a), Direct Emissions from Stationary Combustion Sources, U.S. Environmental Protection
Agency (EPA), http://www.epa.gov/stateply/resources/cross-sector.html, accessed April 21, 2009.
EPA (2008b), Direct Emissions from Mobile Combustion Sources, U.S. Environmental Protection Agency
(EPA), http://www.epa.gov/stateply/documents/resources/mobilesource_guidance.pdf, accessed
April 21, 2009.
ERPC (2006), European Declaration on Paper Recycling: 2006 - 2010, European Recovered Paper
Council (ERPC), http://www.citpa-europe.org/NeoDownload?docId=114632, accessed April 2,
2009.
Ervasti, I. (2008), ―The Limits of Paper Recycling‖, Pöyry, Presentation given in Romania, October 2008.
ETC (2004), Review of Existing LCA Studies on the Recycling and Disposal of Paper and Cardboard,
European Topic Centre on Waste and Material Flows, Final Draft Report to the EC, April 21, 2004
FAO (2005), Trends in Wood Products, United Nations Food and Agricultural Organization (FAO),
available at: http://www.fao.org/docrep/008/a0142m/a0142m00.htm.
FAO (2008), Food and Agriculture Organisation of the United Nations: Forestry Department, available at:
http://www.fao.org/forestry/home/en/.
FAO (2009), FAOSTAT forest products data base, United Nations Food and Agriculture Organisation,
http://faostat.fao.org, accessed May 8, 2009.
FPAC (2007a), Annual Review, Forest Products Association of Canada, available at:
http://www.fpac.ca/documents/fpac_annual_review_e_2007.pdf.
FPAC (2007b), Industry at a Crossroads: Choosing a Path to Renewal, available at:
http://www.fpac.ca/documents/TASK_FORCE.pdf.
Freed, R., A. Choate & S. Shapiro (2006), Revised Estimates of Effect of Paper Recycling on Forest
Carbon, ICF International.
ICFPA (2007), Sustainability Progress Update, The International Council of Forest and Paper
Associations, http://www.icfpa.org/ICFPA_sustainable_summary_update.pdf, accessed May 11,
2009.
ICFPA (2009), On-Line Comparative Matrix of Forest Certification Schemes, available at:
http://www.forestrycertification.info/.
IEA (2006), Energy Efficient Technologies and CO2 Reduction Potentials in the Pulp and Paper Industry,
International Energy Agency (IEA), in collaboration with the World Business Council for
83
Sustainable Development (WBCSD), Final version of workshop proceedings,
http://www.iea.org/Textbase/work/workshopdetail.asp?WS_ID=264, accessed February 11, 2009.
IEA (2007), Tracking Industrial Energy Efficiency and CO2 Emissions, International Energy Agency
(IEA), available at: http://www.iea.org/textbase/nppdf/free/2007/tracking_emissions.pdf.
IEA (2008), Energy Technology Perspectives 2008, International Energy Agency (IEA),
http://www.iea.org/Textbase/techno/etp/index.asp, accessed April 27, 2009.
IPCC (2007), Climate Change 2007: Synthesis Report Summary for Policymakers, available at:
http://www.ipcc.ch/pdf/assessment-report/ar4/syr/ar4_syr_spm.pdf.
Jacobs, & IPST (2006), Pulp and Paper Industry Energy Bandwidth Study, American Institute of Chemical
Engineers (AlChE), http://www1.eere.energy.gov/industry/forest/bandwidth.html, accessed April 7,
2009.
Miner, R. (2003), Characterizing Carbon Sequestration in Forest Products, International Council of Forest
and Paper Associations, http://www.climatebiz.com/files/document/CustomO16C45F64210.pdf, .
accessed October 22, 2008.
Nabuurs, G.J. et al. (2007), ―Forestry‖, in B. Metz, O.R. Davidson, P.R. Bosch, R. Dave, L.A. Meyer
(eds.), Climate Change 2007: Mitigation, Contribution of Working Group III to the Fourth
Assessment Report of the Intergovernmental Panel on Climate Change , Cambridge University
Press, Cambridge, United Kingdom and New York, NY, USA.
NCASI (2007a), The Greenhouse Gas and Carbon Profile of the Global Forest Products Industry,
National Council for Air and Stream Improvement,
http://www.ncasi.org/publications/Detail.aspx?id=2952, accessed October 22, 2008.
NCASI (2007b), The Greenhouse Gas and Carbon Profile of the Canadian Forest Products Industry,
National Council for Air and Stream Improvement,
http://www.ncasi.org/publications/Detail.aspx?id=3013, accessed October 22, 2008.
NCASI (2008), The Greenhouse Gas and Carbon Profile of the U.S. Forest Products Industry, National
Council for Air and Stream Improvement, http://www.ncasi.org//Publications/Detail.aspx?id=3108,
accessed October 22, 2008.
NCASI (2009), Email correspondence, Reid Minor, NCASI to Adam Brundage, ICF, May 9, 2009.
Nilsson, P., K. Puurunen, P. Vasara, & T. Jouttijärvi (2007), Continuum - Rethinking BAT Emissions of the
Pulp and Paper Industry in the European Union, Finnish Environment Institute (SYKE),
http://www.ymparisto.fi/default.asp?node=11174&lan=en, accessed April 14, 2009.
OECD (2005), Outcome of the First OECD Workshop on Sustainable Materials Management,
ENV/EPOC/WGWPR/RD(2005)5/FINAL, OECD,
http://www.olis.oecd.org/olis/2005doc.nsf/Linkto/env-epoc-wgwpr-rd(2005)5-final, accessed March
17, 2008.
OECD (2008), OECD Environmental Outlook to 2030, OECD, Paris.
84
Paprican (2008), Benchmarking Energy Use in Canadian Pulp and Paper Mills, Natural Resources Canada
(NRCan), http://oee.nrcan.gc.ca/industrial/technical-info/benchmarking/pulp-
paper/index.cfm?attr=24, accessed February 5, 2009.
Patosaari, P. (2007), Forest and Climate Change: Mitigation and Adaptation through Sustainable Forest
Management, Remarks presented to the 60th Annual DPI/NGO Conference, United Nations, New
York, September 2007.
Potter, A. (2008), Beyond Waste: Towards Sustainable Recycling in Selected EU Regions and Member
States, South East England Regional Assembly, October 16, 2008.
Prognos (2008), Resource Savings and CO2 Reduction Potential in Waste Management in Europe and the
Possible Contribution to the CO2 Reduction Target in 2020, available at:
http://www.prognos.com/index.php?id=609.
Skals, P., A. Krabek, P. Nielsen, & H. Wenzel (2008), Environmental assessment of enzyme assisted
processing in pulp and paper industry, The International Journal of Life Cycle Assessment, 13(2):
124-132, doi: 10.1065/lca2007.11.366 .
Skog, K., L. Heath, J. Smith, R. Miner, B. Upton, J. Urwin, et al. (2008), The Greenhouse Gas and Carbon
Profile of the U.S. Forest Products Sector, National Council for Air and Stream Improvement
(NCASI).
Skogs Industrierna (2008), The Forest Industry – A natural part of Sweden, Swedish Forest Industries
Federation,
http://www.skogsindustrierna.org/LitiumDokument20/GetDocument.asp?archive=3&directory=129
3&document=9365, accessed April 30, 2009.
Skogs Industrierna (2009), The Swedish Forest Industries: Facts and figures 2008, Swedish Forest
Industries Federation,
http://www.skogsindustrierna.org/LitiumDokument20/GetDocument.asp?archive=3&directory=139
9&document=10101, accessed April 30, 2009.
Smith, A., K. Brown, S. Ogilvie, K. Rushton, & J. Bates (2001), Waste Management Options and Climate
Change, European Commission, http://ec.europa.eu/environment/waste/studies/climate_change.htm,
accessed November 26, 2008.
Thacker, W. (2005), Composting of by-product solids from the pulp and paper industry, National Council
for Air and Stream Improvement (NCASI).
The Forest Dialogue (2008), Beyond REDD: The Role of Forests in Climate Change, available at:
www.wbcsd.org/includes/getTarget.asp?type=d&id=MzE4NTI.
The Heinz Center (2006), Following the Paper Trail: The Impact of Magazine and Dimensional Lumber
Production on Greenhouse Gas Emissions, A Case Study, Washington, DC.
Upton, B. (2001), Technologies for Reducing Carbon Dioxide Emissions: A Resource Manual for Pulp,
Paper and Wood Products Manufacturers, National Council for Air and Stream Improvement
(NCASI).
VDP (2008a), Facts on Paper 2008, Verband Deutscher Papierfabrikin e.V., available at:
http://www.marketplacepaper.org/pdf/Kompassenglisch.pdf.
85
VDP (2008b), Papermaking: Information on Raw Materials and Papermaking, Verband Deutscher
Papierfabrikin e.V. , available at: http://www.marketplacepaper.org/pdf/Papermaking.pdf.
WBCSD (2007), The Sustainable Forest Products Industry, Carbon and Climate Change, World Business
Council for Sustainable Development, available at:
http://www.wbcsd.org/DocRoot/tpQeE6CBA7qSB2KWvhns/sfpi-cop11.pdf, accessed on May 6,
2009.
WRAP (2008a), CO2-Impacts of Transporting the UK's Recovered Paper and Plastic Bottles to China,
Waste & Resources Action Programme (WRAP),
http://www.wrap.org.uk/applications/publications/publication_details.rm?id=698&publication=5760
&programme=corporate, accessed November 26, 2008.
WRAP (2008b), Kerbside Recycling: Indicative Costs and Performance, Waste & Resources Action
Programme, available at:
http://www.wrap.org.uk/downloads/Kerbside_collection_report_160608.527d453f.5504.pdf.
WRAP (2009) Kerbside or Co-mingled Collections: Quality should come first, Waste & Resources Action
Programme (WRAP), http://www.wrap.org.uk/wrap_corporate/news/kerbside_or.html, accessed on
July 7, 2009.
Zhi Fu, G., Chan, A., & Minns, D. (2005), ―Preliminary Assessment of the Environmental Benefits of
Enzyme Bleaching for Pulp and Paper Making‖, The International Journal of Life Cycle Assessment,
10(2): 136-142.


