
OECD-FAO Agricultural Outlook
Jonathan BrooksMexico City, 6th November 2014

2
Context
» High food prices in 2007-08 caught most by surprise, but such events are not unprecedented.
» Since then there has been a strong supply response and prices have fallen back, although maize prices peaked again in 2012/13 due to drought in the United States.
» Good harvest for most crops in 2013-14, with reduced crop price volatility
» Meat prices peaked in 2014, while dairy prices fell sharply from historic highs
» Low oil prices
» Uncertainty on future of biofuel mandates

3
Real food prices still high but returning to levels of the mid-1990s
19701972
19741976
19781980
19821984
19861988
19901992
19941996
19982000
20022004
20062008
20102012
2014
0
100
200
300
400
500
600
700
800
IMF food Index Maize Rice Wheat
Source: IMF

Commodity price volatility back to pre-crisis levels(Number of commodities whose volatility was above 25%)
199819992000200120022003200420052006200720082009201020112012201320140
3
6
9
12
15
18
21 1
2
01
5
0
8
5
17
14
45
0
21
Source: Baffes (2014) from ICE, CME, and World Bank calculations.
4
5
Highlights of the Outlook
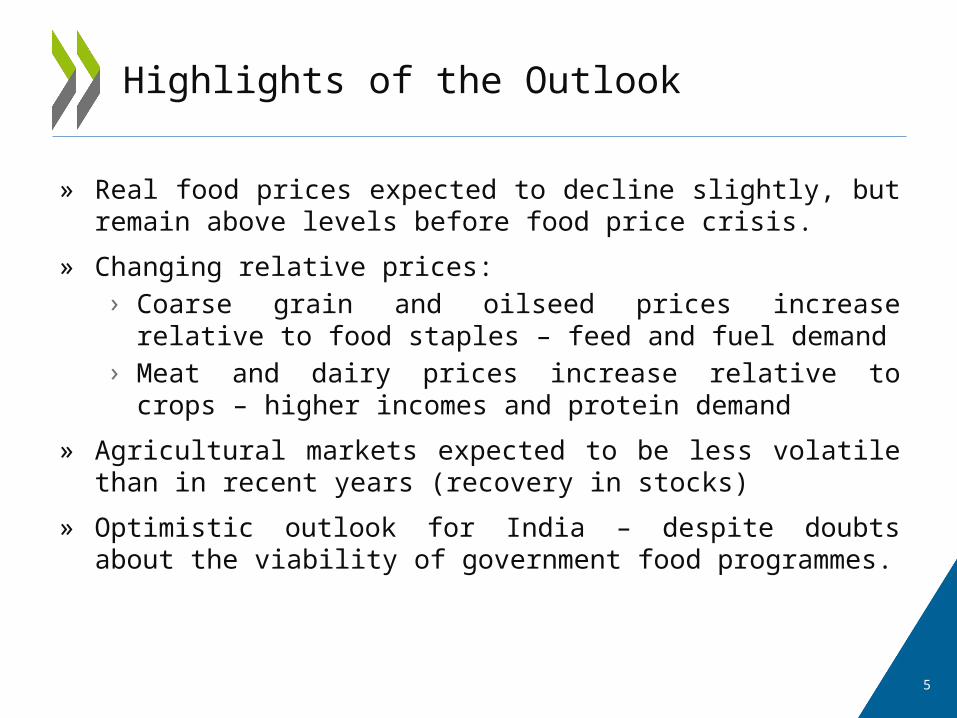
» Real food prices expected to decline slightly, but remain above levels before food price crisis.
» Changing relative prices:› Coarse grain and oilseed prices increase relative to food staples
– feed and fuel demand› Meat and dairy prices increase relative to crops – higher
incomes and protein demand
» Agricultural markets expected to be less volatile than in recent years (recovery in stocks)
» Optimistic outlook for India – despite doubts about the viability of government food programmes.
6
200020012002200320042005200620072008200920102011201220132014201520162017201820192020202120222023
0.4
0.5
0.6
0.7
0.8
0.9
1
1.1
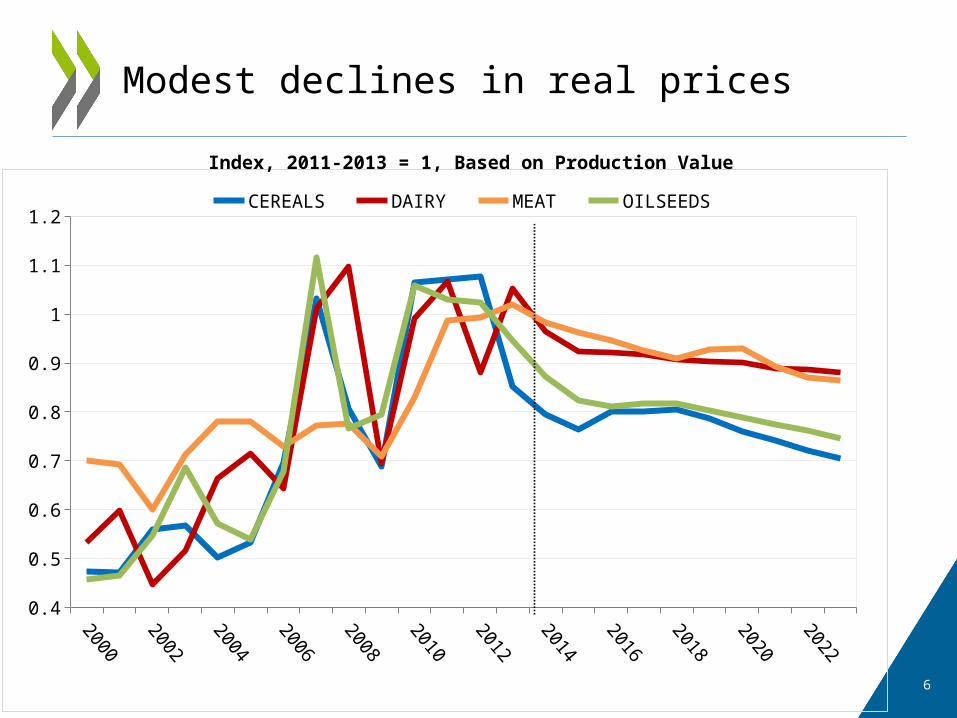
1.2CEREALS DAIRY MEAT OILSEEDS
Index, 2011-2013 = 1, Based on Production Value
Modest declines in real prices

7
Outlook assumes constant policies and “normal” market conditions, but there are risks:
» Slower economic growth in emerging economies (BRIICS)
» Energy prices & links to commodity markets
» Agricultural and trade policies
» Trade agreements
» Biofuel policies
Long-term structural uncertainties:
» Rate of agricultural productivity growth
» Consumption patterns (including waste)
» Natural resource constraints & environmental impacts
» Climate change
8
200020012002200320042005200620072008200920102011201220132014201520162017201820192020202120222023
0
50
100
150
200
250
300
350
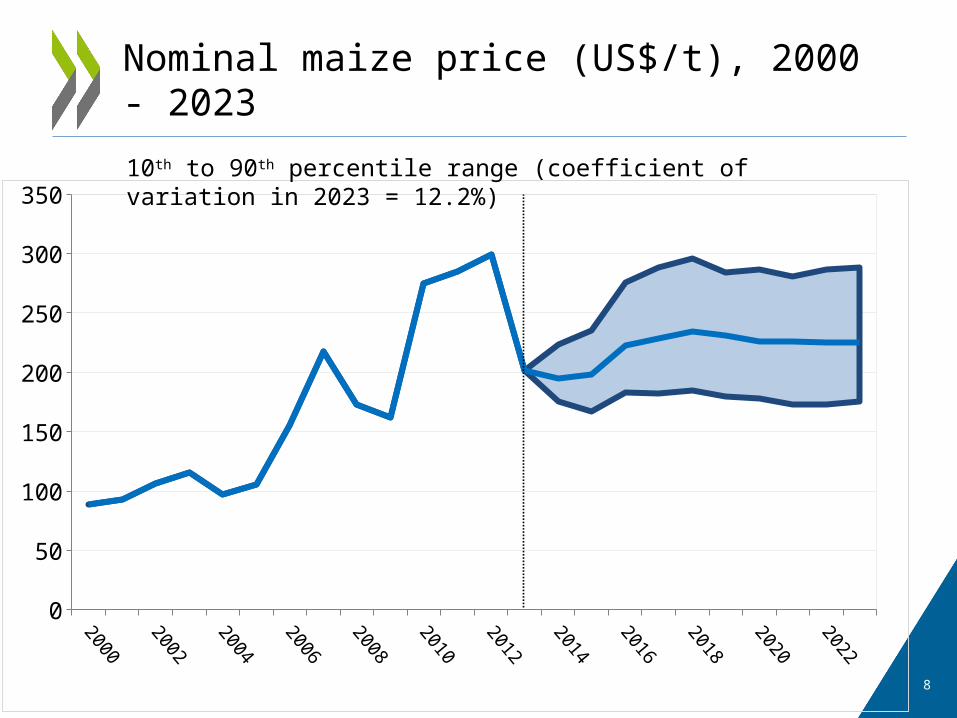
Nominal maize price (US$/t), 2000 - 2023
10th to 90th percentile range (coefficient of variation in 2023 = 12.2%)

9
Policy settings need to be robust to alternative future outcomes
» Medium-term Outlook will be influenced by how we address long- term challenges: global food security, sustainable resource use, climate change
» Agenda needs to focus more on public good provision and move away from income support and associated distortions
» Improve agricultural productivity sustainably – raises farmers’ incomes and lowers food prices
» Keep markets open:
› Market information can help countries avoid rash responses (AMIS and Rapid Response Forum)
› Importance of multilateral reform and post Bali WTO agenda
» Avoid policies that contribute to higher and more volatile food prices

For more information
10
Access the OECD-FAO Agricultural Outlookwww.agri-outlook.org
Visit our websiteswww.oecd.org/tad
http://www.fao.org/economic/en/
Connect with uswww.twitter.com/OECDagriculture
Contact [email protected]


