
This article was downloaded by: [Otto-von-Guericke-UniversitaetMagdeburg]On: 22 October 2014, At: 02:56Publisher: Taylor & FrancisInforma Ltd Registered in England and Wales Registered Number: 1072954Registered office: Mortimer House, 37-41 Mortimer Street, London W1T 3JH,UK
Astronomical & AstrophysicalTransactions: The Journal ofthe Eurasian AstronomicalSocietyPublication details, including instructions forauthors and subscription information:http://www.tandfonline.com/loi/gaat20
Observations of the methanol4-1-30 E line in molecularcloudsI. I. Berulis a , S. V. Kalenski a , A. M. Sobolev b & V.S. Strelnitski ca Astro-Space Center , Lebedev Physical Institute ,84/32 Profsojusnaja Str., Moscow, 117810, USSRb Astronomical Observatory , Urals State University ,51 Lenin Ave., Sverdlovsk, 620083, USSRc Institute of Astronomy , 48 Pjatnitskaja Str.,Moscow, 109017, USSRPublished online: 12 Nov 2007.
To cite this article: I. I. Berulis , S. V. Kalenski , A. M. Sobolev & V. S. Strelnitski(1992) Observations of the methanol 4-1-30 E line in molecular clouds, Astronomical& Astrophysical Transactions: The Journal of the Eurasian Astronomical Society, 1:3,231-245, DOI: 10.1080/10556799208260470
To link to this article: http://dx.doi.org/10.1080/10556799208260470
PLEASE SCROLL DOWN FOR ARTICLE
Taylor & Francis makes every effort to ensure the accuracy of all theinformation (the “Content”) contained in the publications on our platform.However, Taylor & Francis, our agents, and our licensors make no

representations or warranties whatsoever as to the accuracy, completeness,or suitability for any purpose of the Content. Any opinions and viewsexpressed in this publication are the opinions and views of the authors, andare not the views of or endorsed by Taylor & Francis. The accuracy of theContent should not be relied upon and should be independently verified withprimary sources of information. Taylor and Francis shall not be liable for anylosses, actions, claims, proceedings, demands, costs, expenses, damages,and other liabilities whatsoever or howsoever caused arising directly orindirectly in connection with, in relation to or arising out of the use of theContent.
This article may be used for research, teaching, and private study purposes.Any substantial or systematic reproduction, redistribution, reselling, loan,sub-licensing, systematic supply, or distribution in any form to anyone isexpressly forbidden. Terms & Conditions of access and use can be found athttp://www.tandfonline.com/page/terms-and-conditions
Dow
nloa
ded
by [
Otto
-von
-Gue
rick
e-U
nive
rsita
et M
agde
burg
] at
02:
56 2
2 O
ctob
er 2
014
Astronomical and Astrophysical Transactions, 1992, Vol. 1, pp. 231-245 Reprints available directly from the publisher. Photocopying permitted by license only
0 1992 Gordon and Breach Science Publishers S.A. Printed in the United Kingdom
OBSERVATIONS OF THE METHANOL 4-1-30 E LINE IN MOLECULAR CLOUDS
I. I. BERULIS and S. V. KALENSKI
Astro-Space Center, Lebedev Physical Institute, 84/32 Profsojusnaja Str., Moscow 117810, USSR
A. M. SOBOLEV
Astronomical Observatory, Urals State University, 51 Lenin Ave. , Sverdlovsk 620083, USSR
and V. S. STRELNITSKI
Institute of Astronomy, 48 Pjatnitskaja Str., Moscow 109017, USSR
(14 April, 1991)
Searches for new sources and regular monitoring of several molecular clouds in the methanol 44,-3,E transition are in progress since 1988 with the 22meter radio telescope of the Lebedev Physical Institute. Spectra and several-point maps (when available) of the sources are presented and briefly discussed. Several sources emit both “broad” (a few km/s) and “spike” ( 5 1 km/s) spectral features. No time variations were detected within the accuracy of the observations. The common procedure of the methanol column density calculations for the “broad” 44,-3, E features is critically analyzed. It is shown that treating these features as optically thin and “thermal” may lead to an over estimation of the column density by the order of magnitude. The astrophysical nature of the “broad” and “spike” components is discussed.
KEY WORDS Interstellar methanol, molecular clouds, radio lines.
1. INTRODUCTION
Methanol (CH,OH) is one of the most informative molecules for the observa- tional study of the sites of active star formation. Several of its lines (Jz-J, E, 4-,-30 E , 5-,-40 E, 7()-6, A + , 8()-7, A + ) are often observed at the same position and the same radial velocities; these lines were categorized as “Class A” lines (Batrla et al. (1987), Hashick, Menten and Baan (1990)-hereafter HMB). Though observed in warm (and thus star producing) molecular clouds, Class A lines emitters are not directly associated with such indicators of very young stars as compact HI1 regions, compact IR sources, H 2 0 or O H masers. This gives some ground to suppose that these sources may be related to even earlier stages of star formation. Potential possibility of observing the earliest stages of star formation makes the methanol Class A lines particularly interesting.
23 1
Dow
nloa
ded
by [
Otto
-von
-Gue
rick
e-U
nive
rsita
et M
agde
burg
] at
02:
56 2
2 O
ctob
er 2
014

232 I. I . BERULIS ET AL.
To search for new sources and to regularly investigate the already known ones (in particular, for their possible time variations), we have undertaken, since 1988, a permanent observational program in 4-1-30 E Line, at 36.169 GHz, with the Pushtchino 22 meter radio telescope of the Lebedev Physical Institute (Berulis & Ponomarenko, 1988; Berulis et al., 1988; Berulis et al . , 1990). We regularly observed the Sgr A, Sgr B2, Ori-KL, W51, DR 21, and NGC 2264 molecular clouds and have made a single observation of W3OH. We also detected the 4-1-30 E emission in one new source, G1.6-0.025. For this source and for Sgr B2, Ori-KL, and W51, several-point offset mapping has been made.
The observational technique is briefly described in section 2, and the results of the observations are presented in section 3. In section 4 we use the results of a numerical simulation for the methanol-E rotational levels excitation to discuss the procedure of the methanol column density determination (sub-section 4. l) , and we discuss the possible astrophysical nature of the “broad” and “spike” methanol spectral features (sub-section 4.2).
2. OBSERVATIONS
The Pushtchino 22 meter antenna of the Lebedev Physical Institute, augmented with a 8.2 mm maser amplifier receiver, has been used for the observations. The system temperature was -250 K. There were two parallel spectrometers at the output, with spectral resolutions of 7.5 and 125 kHz, respectively (0.062 and 1.04 km/s, at 36.169 GHz).
Our computer can simultaneously examine 128 spectral channels. This deter- mined the bandwidths. The maximum bandwidth was thus 128. 125 = 16,000kHz, or =133km/s. But when both spectrometers were used simul- taneously, the bandwidths were 96 7.5 = 720 kHz, or -6 km/s, for the high- resolution spectrometer, and (128-96) * 125 = 4000 kHz, or -33 km/s, for the low-resolution spectrometer.
The aperture efficiency of the 22 meter antenna at 8 mm is 0.18, and the main beam width (FWHM) is 2arcmin. The antenna temperature was corrected for atmospheric absorption; 1 K of this corrected antenna temperature corresponds to a flux of 39 Jy. The calibration of the antenna temperature, which was made with a calibrated noise tube, is typically good to -30%, but is, probably, twice than that worse for low declination sources. The beam switching mode was used for these observations. The pointing errors are estimated to be less than 30 arcsec.
The numerical results of the observations are collected in Table 1. The columns are: the source name; its equatorial coordinates for 1950.0; antenna temperature at the center of a spectral feature, corrected for atmospheric absorption; radial velocity relative to the Local Standard of Rest; linewidth (FWHM); molecular column density (see sub-section 4.1).
3. RESULTS FOR INDIVIDUAL SOURCES
G1.6-0.025. Methanol was first detected in this cloud, near the Galactic Center, by Whiteoak and Peng (1989), who observed here the &,-3-, E line in
Dow
nloa
ded
by [
Otto
-von
-Gue
rick
e-U
nive
rsita
et M
agde
burg
] at
02:
56 2
2 O
ctob
er 2
014

METHANOL IN MOLECULAR CLOUDS 233
Table 1 Parameters, determined from 4- t-30 E methanol observations.
W3 OH
Ori-KL
NGC 2264
SGR A-G
SGR B2
GI . 60.025
W 51
DR21 WEST
DR21 OH
02h23m 16‘ 61”3R’ 57” 05 32 47
06 38 25 09 32 28 I7 42 27
-29 04 36 17 44 07
-28 20 15 17 46 12
19 21 25 14 25 10 19 21 25 14 24 10 19 21 23 19 24 10
20 37 08 42 08 46 20 37 14 42 I I 20 20 37 14 42 12 (M
-05 24 15
-27 33 15
0.15 f 0.03
0.9 f 0.2
0.5 f 0.1 0.22 f 0.1 2.0 f 0.5 4.5 f 1.5 11 f 1.5 2 0 f 1.5 2 .0 f l .O 3 . 0 f 1.0 0.45 f 0.1
0 .2 f0 .1
0.25 f 0.1
0.8 f 0.2
0.4 f 0.05
0.3 f 0.1
-46.2 f 0.2
8.4 f 0. I
8.7 f 0.2 8 . 0 f 0 . 1 -5 + +25 5.7 f 0.2 40-95 70 f 0.5 40-65 54.2 f 0.2 55.3 f 0.2
56.3 f 0.5
53.8 f 1.0
-2.7 f 0.1
-2.8 f 0. I
0 . 2 f 0 . 1
4.4 f 0.3 8.7E + 15
1 .8 f0 .1 1.6E+16
3.0 f 0.2 9.3E + 14 0.8 f 0.1
2.5E + 16 4.0 f 0.2
4.OE + 17 3.5 f 0.2
2.OE + 15 <2 7.0 f 0.3 1.6E + 16
< I
<2
0.42 f 0.05
3.5 f 0.2
0.8 f 0.1
3.7E + 15
C
a
a d a. b. c d f
C
a Non-gaussian profile. Column density was determined using contour maps (Figure 10). Exact position of thc peak of brightness is not known Exact position of the maser is not known.
Parameters of the strongest component. line may ciinsist of several components.
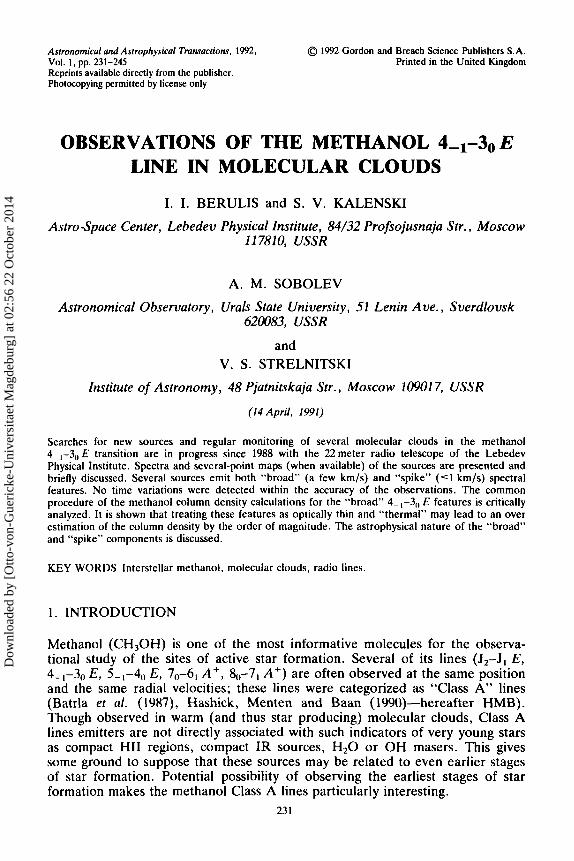
absorption. Following the Sobolev’s (1990) suggestion that this cloud could be a 4L1-3,, E line emitter, we undertook the observations in 9 points towards the cloud. The emission with the brightness temperatures Th = 3-8 K has been detected in 7 points, within the radial velocity interval of 40-65 km/s. The spectra are shown in Figure 1. The maximum antenna temperature in 4-,-3,, E line is observed towards the point ~ ~ ( 1 9 5 0 ) = 17h46”12”, b(1950) = -27”33’15”, where Gardner et al. (1985) observed a compact (931”) bright NH3 clump, but at a significantly different radical velocity, vLSR = 43 km/s. (Later, Gardner and Boes (1987) reported the detection, in the same direction, of a larger (5’) cloud with a very different radial velocity--vLSR = 165 km/s; unfortunately, our bandwidth did not cover this velocity to look for 4-1-30 E emission). Figure 1 also shows the spectrum obtained in the direction of another NH3 clump observed by Gardner et al. (1985) (at the offset position ALY = +4’30; A 6 = + l ’ ls l ) , and the spectrum, which was taken in direction of the strongest (minimum brightness temperature) absorption in the 2,,-3X1 E line, as measured by Whiteoak and Peng (1989) (offset position +2‘45’‘; 0’0). The broad 4-,-3,, E emission has the full width of about 10-15 km/s. However, this emission changes in shape and width from one offset point to another, and this is indicative of its blended structure, with the probable widths of a few km/s for the individual “broad” blended components. The shape
Dow
nloa
ded
by [
Otto
-von
-Gue
rick
e-U
nive
rsita
et M
agde
burg
] at
02:
56 2
2 O
ctob
er 2
014
234 1. I. BERULIS ET AL.
(1:O) 16.03.90
G 1.6-0.025 AV:1.037 KMIS
1 1 1 1 I
(0:O) 16.03.90
I (0:l) 16.03.90
1 1 1 1 1
(l:-l) 16.03.90 1 1 1 1 1
(O:-l) 16.03.90
- 4 t t (-1:O) 16.03.90
I l l 1 1
30 40 50 60 70
I I I I I I I 1 1 1 1 1
30 40 50 60 70 30 4 0 50 60 70
OV= 1,037 KM IS
(4 '30" : 1'15")
- Y v
c-
40 5 0 60 70 80
V,,, ( K M I S )
Figure 1 Spectra of (31.6-0.025 in 44,-30 E-methanol line. Equatorial coordinates of the central (0; 0) position are given in Table 1. Offset &,&positions, in arcmin, and the dates of observations are indicated for each spectrum. Abscissa is for the radial velocity relative to the Local Standard of Rest, and ordinate-for the antenna temperature corrected for atmospheric absorption. Spectral resolution is indicated after the source name.
Dow
nloa
ded
by [
Otto
-von
-Gue
rick
e-U
nive
rsita
et M
agde
burg
] at
02:
56 2
2 O
ctob
er 2
014

METHANOL IN MOLECULAR CLOUDS 235
20
lo: 0
20 A
Y
v c* l o -
0 -
20
lo: 0
of the spectrum changes significantly by offsets of l‘, and it changes radically, when offsets are larger than 2‘. This indicates that the “broad” blended features are produced by clumps with the size scale of the order 1’. Besides these “broad” features there are two narrow (11 km/s), “spike,” features, at vLSR = 54 and 57 km/s.
Sgr B2. Spectra of this source at several offset points are shown in Figure 2. In qualitative accordance with Morimoto et al. (1985), there is a broad (several tens of km/s) “thermal” background, and narrower “maser” features, one of which, at vLSR = 70 km/s, coincides in radial velocity with a “broad maser” feature in Morimoto et al. (1985). Unfortunately, any quantitative comparison of our spectra with those by Morimoto et al. is impossible because of large pointing and brightness temperature errors due to a very low elevation of the source (17’, at our latitude). Comparison of our own spectra, obtained during the time interval between April 1988 and February 1989, doesn’t reveal any change of intensity for the strongest features, within the observational errors.
(01 ) 4 1 1 89 ( -13) 4 11 89 -
A I A ( 0 0) 411 89 (-1.0) 4.11 89
- -
A - A
- 1 I 1 I 1 I 1 1 1 1 1
40 50 60 70 80 90 ( 0 -1) 311 89 -
40 50 60 70 80 90
Dow
nloa
ded
by [
Otto
-von
-Gue
rick
e-U
nive
rsita
et M
agde
burg
] at
02:
56 2
2 O
ctob
er 2
014

236 I . I . BERULIS ET AL.
SGR A-G A V z 1 . 0 3 7 KMIS
3.0 I 1 3 . 1 2 . 8 9
-10 0 1 0 20
VLSR ( KMIS) Figure 3 Spectrum of Sgr A-G. See caption to Figure 1 for comments.
Sgr A-G. The 441-31) E spectrum of this source (Figure 3) is similar to the Sgr B2 spectrum, though it is weaker and its “thermal” component is narrower. We observed as Hashick and Baan also observed (1989-hereafter HB), besides the broad emission, a narrow component with 6v = 4 km/s. We did not detect any changes surpassing the observational errors between May and December 1989. Ori-KL. Two spectra of this source, obtained with a time interval of 10
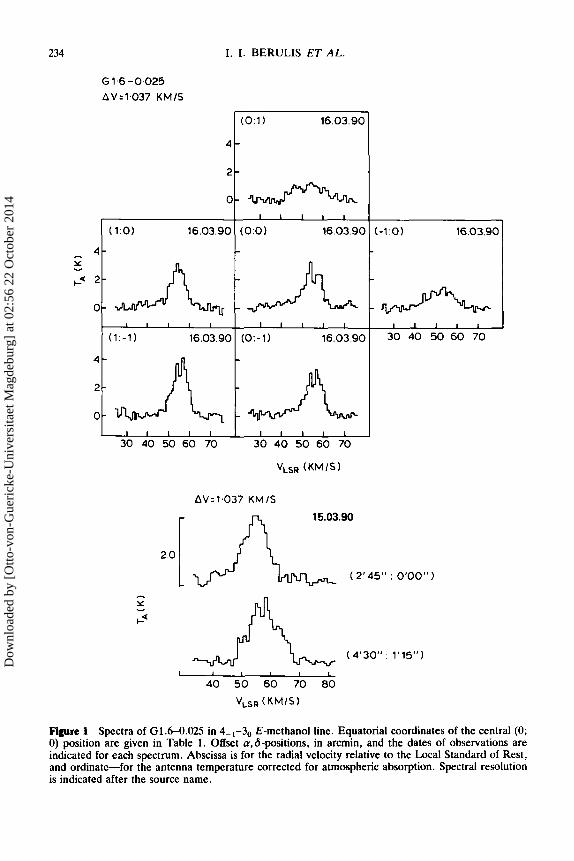
months, are shown in Figure 4a. No detectable change can be noted. The results of a single-dish mapping in 4-1-30 E line (Figure 4b) suggest that
the source is extended for our beamwidth, or multiple. The isophotes are not symmetrical, but there is a pronounced maximum, which coincides, within the pointing errors, with the position of the Methanol Emission Core (MEC) [Johansson et al., 1984; Menten et al., 19881. The extension of the emission to the South is probably connected with another well-known methanol source, situated at =1’.5 southward of MEC.
Although the source seems extended on our map, the maximum flux density we measured at MEC position (S = 35 Jy) is close to the values obtained at the same position by HB and HMB with a beam width of 5 6 . We conclude that the major contribution to the observed emission at the MEC position makes a region, which is smaller than 1 arcmin in diameter. W51. Spectra measured on March 14-16, 1990, at 11 positions toward W51 are
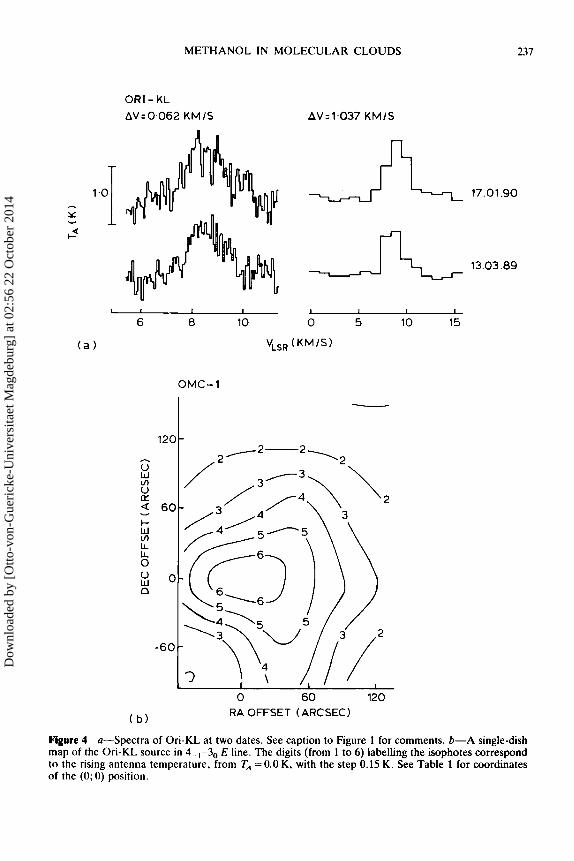
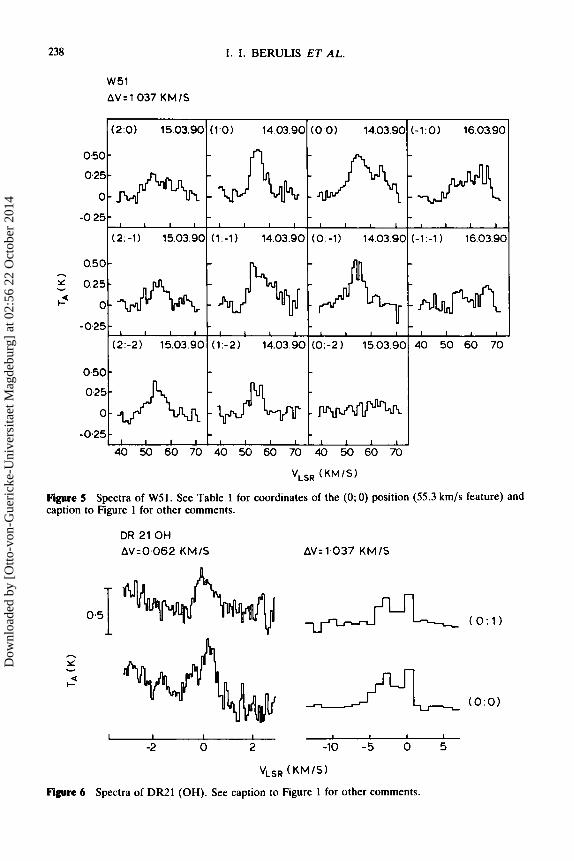
shown in Figure 5. The source has a complicated structure. One can distinguish at least 2 broad components (6v = 4 km/s), on which, at some directions, narrow (6v 5 1.5 km/s) features are superposed. The narrow features (detected only marginally) coincide in position and velocity, within the measurements errors, with the masers in J2-J1 E lines discovered by Menten et al. (1986).
DR21 (OH). Our results (Figure 6), like those by HB, revealed a narrow (6v = 0.8 km/s) feature, superposed on a broader (6v = 4 km/s) component. No variability was detected between May and October, 1989. Moreover, the flux
Dow
nloa
ded
by [
Otto
-von
-Gue
rick
e-U
nive
rsita
et M
agde
burg
] at
02:
56 2
2 O
ctob
er 2
014
METHANOL IN MOLECULAR CLOUDS 237
h
Y v
$
OR1 - KL AVz0.062 K M l S AV=1.037 K M l S
17.01.90
I 1 I I J 1 I I
6 8 10 0 5 10 15
OMC-1
h u W in u U
t- w u) LL LI 0 u w
a v
n
-6
( b ) RA OFFSET (ARCSEC)
Figure 4 a-Spectra of Ori-KL at two dates. See caption to Figure 1 for comments. b-A single-dish map of the Ori-KL source in 44-3 , E line. The digits (from 1 to 6) labelling the isophotes correspond to the rising antenna temperature, from TA = 0.0 K , with the step 0.15 K. See Table 1 for coordinates of the (0; 0) position.
Dow
nloa
ded
by [
Otto
-von
-Gue
rick
e-U
nive
rsita
et M
agde
burg
] at
02:
56 2
2 O
ctob
er 2
014
238 I . I . BERULIS ET AL.
0-
-0 25-
050- - v
r-4 0
-025-
050-
0
-025-
W51 AV-1,037 KMlS
(2 0) 150390 (1 0) 140390 (0 0) 140390 (-1 0) 16039C
:::A:&:&:A - -
;A:m 025:A :A 025:& 1-
- - (2 -1) 150390 (1 -1) 140390 (0 -1) 140390 (-1 -1) 16039(
1 I I 1 I I I 1 1 I 1 I I I I
-
I I I I I I 1
(2 -2) 150390 (1-2) 140390 ( 0 - 2 ) 150390 40 50 60 70
I I I 1 I 1 1 I 1 1 1
40 50 60 70 40 50 60 70 40 50 60 70
Figure 5 Spectra of W51. See Table 1 for coordinates of the (0; 0) position (55.3 km/s feature) and caption to Figure 1 for other comments.
DR 21 OH AV=O.062 KMIS AV= 1,037 KM I S
- Y
t-
Y
a
I 1 I I 1 I 1 I
-2 0 2 -10 -5 0 5
VLsR (KMIS)
Figure 6 Spectra of DR21 (OH). See caption to Figure 1 for other comments.
Dow
nloa
ded
by [
Otto
-von
-Gue
rick
e-U
nive
rsita
et M
agde
burg
] at
02:
56 2
2 O
ctob
er 2
014

METHANOL IN MOLECULAR CLOUDS 239
DR 21 WEST AV = 0.062 KM /S
1 I
- 4 -2
VLSR (KMIS)
Figure 7 Spectra of DR21 (West) in the direction (~(1950.0) = 2oh37"14", b(1950.0) = 42"12'00". See caption to Figure 1 for other comments.
density we measured (-12Jy) coincided with that measured by HB. The difference of the narrow component profile shapes, at positions differing by 1' in N-S direction (Figure 6), suggests at least two spatially separated sources.
DR21 (West). We confirmed here (Figure 7) the existence of a narrow line, detected by HMB. A small difference in flux densities, measured by HMB and by us, is probably due to calibration and pointing errors.
NGC 2264. We detected here, at the position of methanol maser, indicated by HB and HMB, a narrow (6v = 0.8 km/s) feature, superposed on a broad
NGC 2264 A V = 0.062 K M / S AV = 1.037 KM 15
4.05.90 1 .o I I 1 I 1 I 1 1 I
6 8 10 0 5 10 15
V,,, ( K M I S )
Figure 8 Spectra of NGC 2264. See caption to Figure 1 .
Dow
nloa
ded
by [
Otto
-von
-Gue
rick
e-U
nive
rsita
et M
agde
burg
] at
02:
56 2
2 O
ctob
er 2
014
240 I . I. BERULIS ET AL.
W 3 OH AV = 1.037 KMIS
T
- Y
U c - 0.2
3 1.03.89
1 1 I 1 I
-55 -50 -45 -40
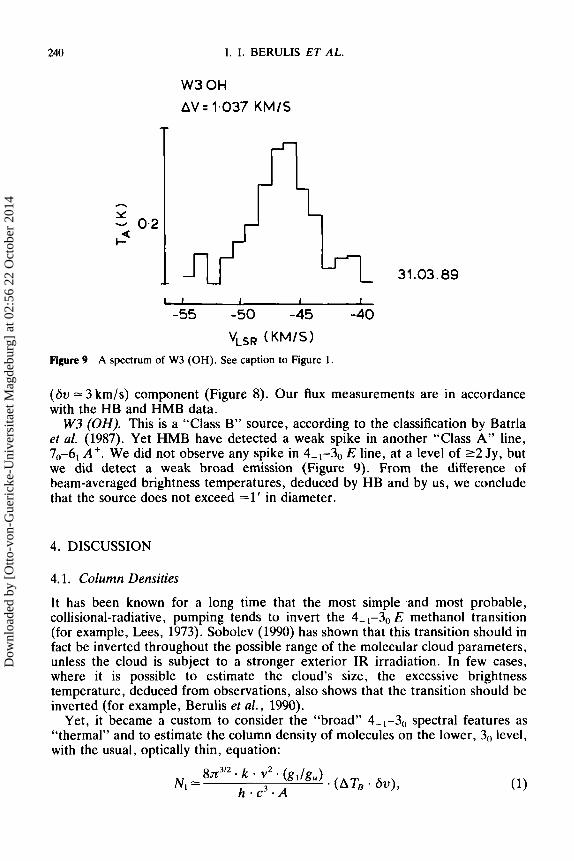
Figure 9 A spectrum of W3 (OH). See caption to Figure 1
(6v = 3 km/s) component (Figure 8). Our flux measurements are in accordance with the HB and HMB data.
W3 (OH). This is a “Class B” source, according to the classification by Batrla et al. (1987). Yet HMB have detected a weak spike in another “Class A” line, 7,,-6, A+. We did not observe any spike in 4-1-30 E line, at a level of 2 2 Jy, but we did detect a weak broad emission (Figure 9). From the difference of beam-averaged brightness temperatures, deduced by HB and by us, we conclude that the source does not exceed =1’ in diameter.
4. DISCUSSION
4.1. Column Densities
It has been known for a long time that the most simple .and most probable, collisional-radiative, pumping tends to invert the 4- 1-30 E methanol transition (for example, Lees, 1973). Sobolev (1990) has shown that this transition should in fact be inverted throughout the possible range of the molecular cloud parameters, unless the cloud is subject to a stronger exterior IR irradiation. In few cases, where it is possible to estimate the cloud’s size, the excessive brightness temperature, deduced from observations, also shows that the transition should be inverted (for example, Berulis et al . , 1990).
Yet, it became a custom to consider the “broad” 4-1-30 spectral features as “thermal” and to estimate the column density of molecules on the lower, 3,) level, with the usual, optically thin, equation:
Dow
nloa
ded
by [
Otto
-von
-Gue
rick
e-U
nive
rsita
et M
agde
burg
] at
02:
56 2
2 O
ctob
er 2
014
METHANOL IN MOLECULAR CLOUDS 24 1
where two observable quantities are: A TE-the brightness temperature at line center, measured above the background, Gv-the line width (FWHM), in velocity units (cm/s); and the constants are: v-the transition frequency, g, , g,-the statistical weights, A-the Einstein coefficient (A = 1.5 lO-’s-l for 4-1-30 E transition); other constants have their usual meanings.
Besides the assumption of the optical thickness t << 1, it is supposed in Eq. (1) that the absolute value of the transition excitation temperature, IzI, is >>hvlk (-1.73 K for 4-1-3, E transition), and lzl >> Tbg.
From the usual solution of the radiation transfer equation,
and the expression for the optical depth,
(where A v D is the Doppler width (FWHM) of the absorption coefficient) one obtains the correct expression for N1 :
~ I T ~ / ~ v ~ A V D (6 I Is,) “- I -cZA . [l - exp ( -hvlkT,)]
Let us introduce the reduction coefficient, C, by
N; = N , / C .
One obtains from the Eqs. ( 1 ) and (4):
(4)
We see that the reduction coefficient cannot be directly obtained from the observed quantities. Besides ATE, it depends on the unknown quantity T, and on the poorly known quantity Thg. The T, can be estimated only from model calculation.
We calculated the statistical equilibrium equations for the CH30H E rotational level populations in a homogeneous spherical cloud. The effects of radiation transfer in rotational lines were taken into account in a crude manner, following, in main lines, Stutzki & Winnewisser (1989, (with some modifications described by Sobolev & Kalinina ((1991), Central values method for estimation of quantum transitions excitation states with arbitrary line profile. Astronomical and Geodesic Investigations, Sverdlovsk, in press). Some technical details can be found in Sobolev (1990). The results-isolines of the 4- ,-3,, excitation temperature, optical depth, brightness temperature at the cloud’s surface, and the reduction coefficient C, are presented in Figure 10, as functions of lg n and l g N l A v . These are results for the model with kinetic temperature T = 3 0 K and the brightness temperature of the isotropic background ThK = 2.7 K.
Dow
nloa
ded
by [
Otto
-von
-Gue
rick
e-U
nive
rsita
et M
agde
burg
] at
02:
56 2
2 O
ctob
er 2
014

242
K 0 0
3 -
1. I . BERULIS ET AL.
:3,\ 5
K 4 0 0 -I
3
u 2 7 -2 8 9 10 11 12 7 8 9 10 11 12
6- 6- f AT,
K
E? 4 - 1
3 -
2 1 1 1 1 I 2- I I I I J
7 8 9 10 11 12 7 8 9 10 11 12
Log NCH30H’VD
Figure 10 Isolines of the excitation temperature, q, optical diameter, t, brightness temperature, AT’, and reduction coefficient, C, obtained in a model simulation of the 44, - 3,, E line excitation in the homogeneous spherical cloud with kinetic temperature & = 30 K and isotropic background brightness temperature Th = 2.7 K. The isolines are presented as functions of the hydrogen number density and CH,OH number density divided by velocity dispersion, both in logarithmic scale. The dashed lines on the AT, graph give the field of directions according to Eq. (9). See text.
We can summarize the results as follows:
(1) In a large range of parameters, typical for the galactic molecular clouds, the 4-1-30 transition is inverted; (2) The assumptions underlying the Eq. (l), namely, t << 1, ITXI >> hv lk and IT,I >> Tbg, could be violated in molecular clouds; (3) Use of the Eq. (1) leads to an overestimation of the molecular column density-up to a factor of several tens.
The results for other models have shown a strong dependence on the assumed background continuum parameters. As a tendency, the stronger the background is, the weaker the inversion, and the smaller is the reduction coefficient C. With a sufficiently strong IR background even “anti-inversion” (overcooling) of the 4-1-30 transition is possible.
All the column densities presented in the Table, excluding that for G1.6-0.025, were calculated using the Eq. (1) for the 30 level population, with subsequent transition to the total CH30H column density by applying the common partition
Dow
nloa
ded
by [
Otto
-von
-Gue
rick
e-U
nive
rsita
et M
agde
burg
] at
02:
56 2
2 O
ctob
er 2
014
METHANOL IN MOLECULAR CLOUDS 243
function. The rotational temperatures were taken: for Ori-KL from Menten et al. (1988), for other sources-from Menten et al. (1986) and Gottlieb et al. (1979). Thus, all the column densities in Table 1, but that for G1.6-0.025, should be regarded as upper limits and could surpass the real N values even by the order of magnitude.
The column density for the broad component of the G1.6-0.025 spectrum was estimated by a more sophisticated method of comparing the observational results for two lines, 4-,-3,, and 2,)-3X1 E, with the results of a numerical modeling (Sobolev, 1990).
4.2. The “Broad” and “Spike” Features
One of the intriguing properties of the CH30H sources in 4-,-3() E and 7,,-6, A+ lines is the coexistence of the “broad” (several km/s) and “narrow” (11 krn/s) features. This was first pointed out by Morimoto et al. (1985), for 441-30 line in Sgr B2, and then observed by HB and HMB in this line and in 70-61 A+ line. We also often observed this phenomenon in 4-1-30 E line-(see Table 1 and spectra of Sgr B2, NGC 2264, G1.6-0.025, W51, DR21 (OH)).
As we already mentioned, the high interest to the narrow-line emission in 4-,-3,, E lines is partly due to the fact that the sources of these lines, as well as those of 7,,-6, A’, 5-1 - 4,) E, 8,)- 7, A+ and J2-JI E lines (“Class A” lines), though observed in regions of active star formation, are, apparently, not connected directly with any indicators of very young stars; thus, one can suppose that they are connected with even earlier stages of star formation. It has been shown, in particular, that the J2-J1 E masers in Ori-KL could well be, with their observed properties, protostars at the stage of gravitational contraction (Streln- itskij, 1981).
Yet, before considering this intriguing interpretation for 4- ,-3” spike features, we would like to investigate here the possibility of a more simple explanation. Namely, we will try to answer the question: may the observed superposition of the “broad” and “spike” features be due to the radiation from ordinary (not collapsing) fragments of the hierarchical structure of the interstellar medium (ISM)?
To make some quantitative estimates, we will admit that in a typical case the ratio of line widths for a “broad” and a “spike” feature is = 5 , and the ratio of their antenna temperatures is =1.
Let us accept the following observationally established relations between geometrical scale: L, average number density, n, and velocity dispersion, Av, of the ISM turbulence fragments (Goldsmith & Arquilla, 1985):
n 0: L-‘.’, (6)
(7) Av o(
If we assume that the observed line width, 6v, is mainly due to the turbulent velocity dispersion, that is 6v = Av, then the adopted ratio of =5 for the broad and spike 6v’s corresponds to a dimension ratio of several tens, according to Eq. (7). Since even the broad features are not fully resolved with our antenna, the corresponding brightness temperature ratio should be h lo2-lo3.
Dow
nloa
ded
by [
Otto
-von
-Gue
rick
e-U
nive
rsita
et M
agde
burg
] at
02:
56 2
2 O
ctob
er 2
014

244 I. I. BERULIS ET AL.
Taking into account that the column density, N , is equal to n L, we will have, from Eq. (7): ( N l A v ) a (n - L . L-0.4) 0: ( n - LO.’). But, from (6) and (7):
and, consequently,
N l A v 0: (9)
The grid of dashed straight lines, superposed on the ATB isolines in Figure 10, reproduces this relation. It is seen that the required transition from the observed AT, = 10’ K for the “broad” features to the above estimated ATB 2 lo“ K for the “spikes” is possible, if the uantity N l A v , in the clumps producing the “broad” features, is of the order 10’’ cm-3 s (& half an order), and the hydrogen number density in these clumps is of the order 10’ cmP3. Rising the density by an order, or slightly more, from this value along the dashed lines, hence, rising N / A v by several times only, produces the brightness temperature increase of more than two orders. This steep rise of TB is due to a dramatic rise of the optical depth, t, when the gas number density increases along the N l A v nO.’ lines, at N / A v =
Thus, the “spike” phenomenon can, in principle, be explained as a result of the transition, by decreasing the turbulence fragment dimensions, from the fragments with It1 < 1, radiating mainly spontaneous (“thermal”) emission, even if the populations are inverted, to those with It1 > 1, which are subject to a real maser amplification.
This simple interpretation does not exclude, of course, that the compact fragments producing the “spike” radiation are collapsing protostars. More detailed investigation of the “spikes,” with better resolution in space, frequency and time, is needed.
cmP3 s (see Figure 10).
5. CONCLUSIONS
The results of the two-year regular observations of 4-,-3,, E-methanol line in several galactic molecular clouds revealed some common properties of the sources. Superposition of the “broad” and “spike” features in the spectra and relatively stable character of radiation (including the “spike,” obviously maser, emission) are to be mentioned the first.
Crude numerical calculation of the non-equilibrium level populations and the line formation in a homogeneous spherical cloud showed that the common practice of the methanol column density derivation, from the results of 4-1-30 E , “broad” line observations could be erroneous by the order of magnitude, due to the masing in an optically thick cloud.
Though the “spike” sources could well be compact collapsing protostars, they can also be interpreted as ordinary (gravitationally stable) fragments of interstel- lar turbulence, compact and dense enough (L < 0.1 pc, nH > lo3 crnp3) to become optically thick in the inverted 4-1-30 line.
Dow
nloa
ded
by [
Otto
-von
-Gue
rick
e-U
nive
rsita
et M
agde
burg
] at
02:
56 2
2 O
ctob
er 2
014

METHANOL IN MOLECULAR CLOUDS 245
References
Batrla, W., Matthews, H. K., Menten, K. M. and Walmsley, C. M. (1987). Detection of strong methanol masers towards galactic HI1 regions. Nature 326, 49-51.
Berulis, 1. I . and Ponomarenko, N. I . (1988). Observations of methanol (CH,OH) spectral line at 8- mm wavelength, In X X I YERAC, Abstracts, Manchester, p. 47.
Berulis, I. I., Logvinenko, S. V., Ponomarenko, N . L., Vasil'kov, V. 1. and Kalenskii, S. V. (1988). Observations of 36.169 GHz ( J = 4 ,-3,,E) radioline of methanol in molecular clouds. Astron. Tsirk. no 1532, 19-20.
Berulis, I . I . , Kalenskii, S. V. and Logvinenko, S. V. (1990). Observations of 36.169GHz (J=4- , -3 , ,E) radioline of methanol in molecular clouds OMC-I and DR21 (OH). Pis'ma u Astron. Zh. 16, 421-427.
Gardner, F. F. and Boes, F. (1987). Proc. ustr. SOC. Aust. 7, 185-188. Gardner, F. F. , Whiteoak, J . B . , Forster, J . R., Peters, W. L. and Kuiper, T. B. H. (1985).
Ammonia in the hot galactic center cloud GI . 6-0.025. Proc. ustr. soc. Aust. 6, 176-181. Goldsmith, P. F. and Arquilla, R. (1985). Rotation in dark clouds. In Protostars and Planets If, D. C.
Black and M. S. Matthews, eds, The University of Arizona Press, Tucson, Arizona, pp. 137-149. Gottlieb, C. A , , Ball, J . A , , Gottlieb, E. W. and Dickinson, D. F. (1979). Interstellar methyl alcohol.
The Astrophys. J . 227, 422-432. Haschick, A. D. and Baan, W. A. (1989). The detection of the 44,-3, ,E trnasition of methanol at
36.2 GHz toward hot HI1 regions The Astrophys. J . 339, 949-955. Haschick, A. D . , Menten, K. M. and Baan, W. A. (1990). Detection of widespread strong methanol
masers at 44 GHz. The Astrophys. J . 354, 556-567. Johansson. L. E. B., Anderson , C., Ellder, J . , Friberg, P. , Hjalmarsson, A. , H Q l u n d , B., Irvine,
W. M., Olofsson, H. , and Rydbeck G. (1984). Spectral scan of Orion and IRC + 10216 from 72 to 91 GHz. Astron. Astrophys. 130, 227-256.
Lees, R. M. (1973). On the E,-E, labelling of energy levels and the anomalous excitation of interstellar methanol. The Astrophys. J. 184, 763-771.
Menten, K. M., Walmsley, C. M., Henkel, C. and Wilson, T. L. (1986). The centimeter transitions of E-type methanol. Astron. Astrophys. 157, 318-328.
Menten, K. M., Walmsley, C. M., Henkel, C. and Wilson, T. L. (1988). Methanol in the Orion region. I . Millimeter-wave observations. Astron. Astrophys. 198, 253-266.
Morimoto, M., Ohishi, M. and Kanzava, T. (1985). New maser lines of methanol. The Astrophys. 1. (Letters) 288, Lll-L15.
Sobolev, A . M. (1990). Interpretation of 2,)-3 I CH,OH-E line observations in G1.6-0.025. Astron. Tsirk. no 1543, 7-8.
Strel'nitskij, V. S. (1981). Interpretation of the A = 1.2 cm methanol radio line emission in Orion. Pis'ma u Astron. Zh. I , 406-413.
Stutzki, J . and Winnewisser, G. (1985). On the interpretation of hyperfine-structure intensity anomalies in the NH, (J, K) = ( 1 , 1 ) inversion transition. Asrron. Astrophys. 144, 13-26.
Whiteoak, I . B. and Peng, R . 4 . (1989). Observations of 12.2 GHz methanol absorption towards the molecular cloud G1.6-0.025. Mon. Not Roy. Astron. SOC. 239, 677-685.
Dow
nloa
ded
by [
Otto
-von
-Gue
rick
e-U
nive
rsita
et M
agde
burg
] at
02:
56 2
2 O
ctob
er 2
014


