NZ’S TRADING RELATIONSHIP WITH AUSTRALIA: A STATE
LEVEL ANALYSIS
REPORT PREPARED BY:
RESEARCH AND ANALYSIS UNIT
ECONOMIC DIVISION
MINISTRY OF FOREIGN AFFAIRS AND TRADE
FEBRUARY 2016

Page 2 of 27
DISCLAIMER:
This research report is intended to inform and provoke thought. It does not
reflect the views of the New Zealand Government or represent government
policy. Data in this report is correct as at the time of writing and any recent
updates to data have not been incorporated.
Page 3 of 27
SUMMARY
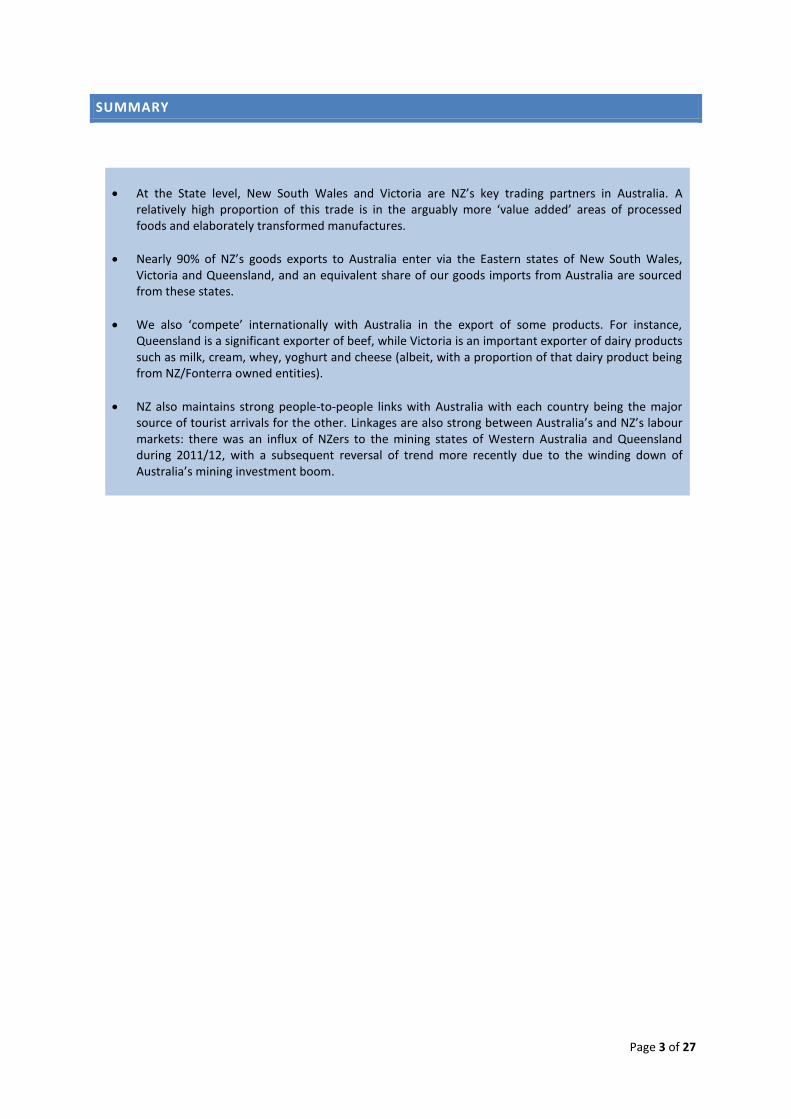
At the State level, New South Wales and Victoria are NZ’s key trading partners in Australia. A relatively high proportion of this trade is in the arguably more ‘value added’ areas of processed foods and elaborately transformed manufactures.
Nearly 90% of NZ’s goods exports to Australia enter via the Eastern states of New South Wales, Victoria and Queensland, and an equivalent share of our goods imports from Australia are sourced from these states.
We also ‘compete’ internationally with Australia in the export of some products. For instance, Queensland is a significant exporter of beef, while Victoria is an important exporter of dairy products such as milk, cream, whey, yoghurt and cheese (albeit, with a proportion of that dairy product being from NZ/Fonterra owned entities).
NZ also maintains strong people-to-people links with Australia with each country being the major source of tourist arrivals for the other. Linkages are also strong between Australia’s and NZ’s labour markets: there was an influx of NZers to the mining states of Western Australia and Queensland during 2011/12, with a subsequent reversal of trend more recently due to the winding down of Australia’s mining investment boom.
Page 4 of 27
INTRODUCTION
Given the critical importance of Australia in NZ’s trading profile, Australia’s economic performance will always
have a strong influence on NZ’s economic performance. However, while Australia remains NZ’s main goods
and services export destination, and third largest source of goods imports, our trade with Australia is not
evenly spread across the states. The aim of this report is to use state-level data to provide a more refined
understanding of how the transition in Australia away from the mining investment boom may impact on NZ’s
trade prospects over the near to medium term.
RECENT ECONOMIC DEVELOPMENTS
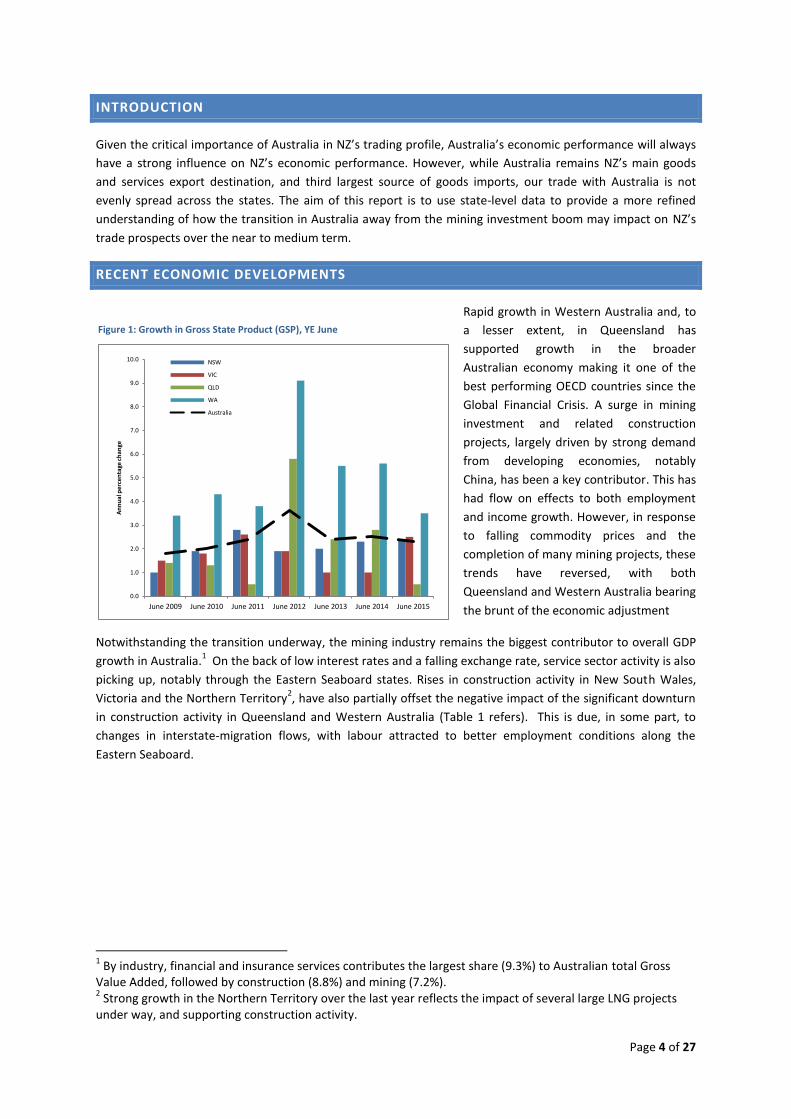
Rapid growth in Western Australia and, to
a lesser extent, in Queensland has
supported growth in the broader
Australian economy making it one of the
best performing OECD countries since the
Global Financial Crisis. A surge in mining
investment and related construction
projects, largely driven by strong demand
from developing economies, notably
China, has been a key contributor. This has
had flow on effects to both employment
and income growth. However, in response
to falling commodity prices and the
completion of many mining projects, these
trends have reversed, with both
Queensland and Western Australia bearing
the brunt of the economic adjustment
Notwithstanding the transition underway, the mining industry remains the biggest contributor to overall GDP
growth in Australia.1 On the back of low interest rates and a falling exchange rate, service sector activity is also
picking up, notably through the Eastern Seaboard states. Rises in construction activity in New South Wales,
Victoria and the Northern Territory2, have also partially offset the negative impact of the significant downturn
in construction activity in Queensland and Western Australia (Table 1 refers). This is due, in some part, to
changes in interstate-migration flows, with labour attracted to better employment conditions along the
Eastern Seaboard.
1 By industry, financial and insurance services contributes the largest share (9.3%) to Australian total Gross
Value Added, followed by construction (8.8%) and mining (7.2%). 2 Strong growth in the Northern Territory over the last year reflects the impact of several large LNG projects
under way, and supporting construction activity.
Figure 1: Growth in Gross State Product (GSP), YE June
0.0
1.0
2.0
3.0
4.0
5.0
6.0
7.0
8.0
9.0
10.0
June 2009 June 2010 June 2011 June 2012 June 2013 June 2014 June 2015
An
nu
al p
erce
nta
ge c
han
ge
NSW
VIC
QLD
WA
Australia
Page 5 of 27
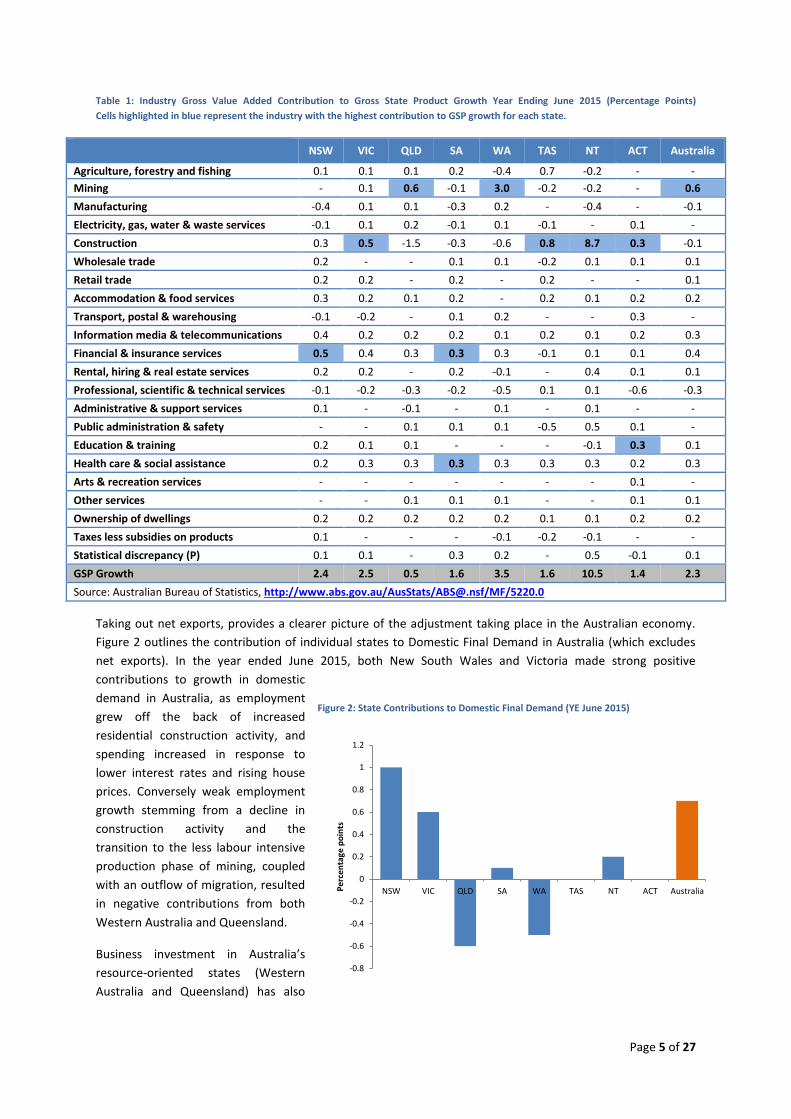
Table 1: Industry Gross Value Added Contribution to Gross State Product Growth Year Ending June 2015 (Percentage Points)
Cells highlighted in blue represent the industry with the highest contribution to GSP growth for each state.
NSW VIC QLD SA WA TAS NT ACT Australia
Agriculture, forestry and fishing 0.1 0.1 0.1 0.2 -0.4 0.7 -0.2 - -
Mining - 0.1 0.6 -0.1 3.0 -0.2 -0.2 - 0.6
Manufacturing -0.4 0.1 0.1 -0.3 0.2 - -0.4 - -0.1
Electricity, gas, water & waste services -0.1 0.1 0.2 -0.1 0.1 -0.1 - 0.1 -
Construction 0.3 0.5 -1.5 -0.3 -0.6 0.8 8.7 0.3 -0.1
Wholesale trade 0.2 - - 0.1 0.1 -0.2 0.1 0.1 0.1
Retail trade 0.2 0.2 - 0.2 - 0.2 - - 0.1
Accommodation & food services 0.3 0.2 0.1 0.2 - 0.2 0.1 0.2 0.2
Transport, postal & warehousing -0.1 -0.2 - 0.1 0.2 - - 0.3 -
Information media & telecommunications 0.4 0.2 0.2 0.2 0.1 0.2 0.1 0.2 0.3
Financial & insurance services 0.5 0.4 0.3 0.3 0.3 -0.1 0.1 0.1 0.4
Rental, hiring & real estate services 0.2 0.2 - 0.2 -0.1 - 0.4 0.1 0.1
Professional, scientific & technical services -0.1 -0.2 -0.3 -0.2 -0.5 0.1 0.1 -0.6 -0.3
Administrative & support services 0.1 - -0.1 - 0.1 - 0.1 - -
Public administration & safety - - 0.1 0.1 0.1 -0.5 0.5 0.1 -
Education & training 0.2 0.1 0.1 - - - -0.1 0.3 0.1
Health care & social assistance 0.2 0.3 0.3 0.3 0.3 0.3 0.3 0.2 0.3
Arts & recreation services - - - - - - - 0.1 -
Other services - - 0.1 0.1 0.1 - - 0.1 0.1
Ownership of dwellings 0.2 0.2 0.2 0.2 0.2 0.1 0.1 0.2 0.2
Taxes less subsidies on products 0.1 - - - -0.1 -0.2 -0.1 - -
Statistical discrepancy (P) 0.1 0.1 - 0.3 0.2 - 0.5 -0.1 0.1
GSP Growth 2.4 2.5 0.5 1.6 3.5 1.6 10.5 1.4 2.3
Source: Australian Bureau of Statistics, http://www.abs.gov.au/AusStats/[email protected]/MF/5220.0
Taking out net exports, provides a clearer picture of the adjustment taking place in the Australian economy.
Figure 2 outlines the contribution of individual states to Domestic Final Demand in Australia (which excludes
net exports). In the year ended June 2015, both New South Wales and Victoria made strong positive
contributions to growth in domestic
demand in Australia, as employment
grew off the back of increased
residential construction activity, and
spending increased in response to
lower interest rates and rising house
prices. Conversely weak employment
growth stemming from a decline in
construction activity and the
transition to the less labour intensive
production phase of mining, coupled
with an outflow of migration, resulted
in negative contributions from both
Western Australia and Queensland.
Business investment in Australia’s
resource-oriented states (Western
Australia and Queensland) has also
-0.8
-0.6
-0.4
-0.2
0
0.2
0.4
0.6
0.8
1
1.2
NSW VIC QLD SA WA TAS NT ACT AustraliaPe
rce
nta
ge p
oin
ts
Figure 2: State Contributions to Domestic Final Demand (YE June 2015)
Page 6 of 27
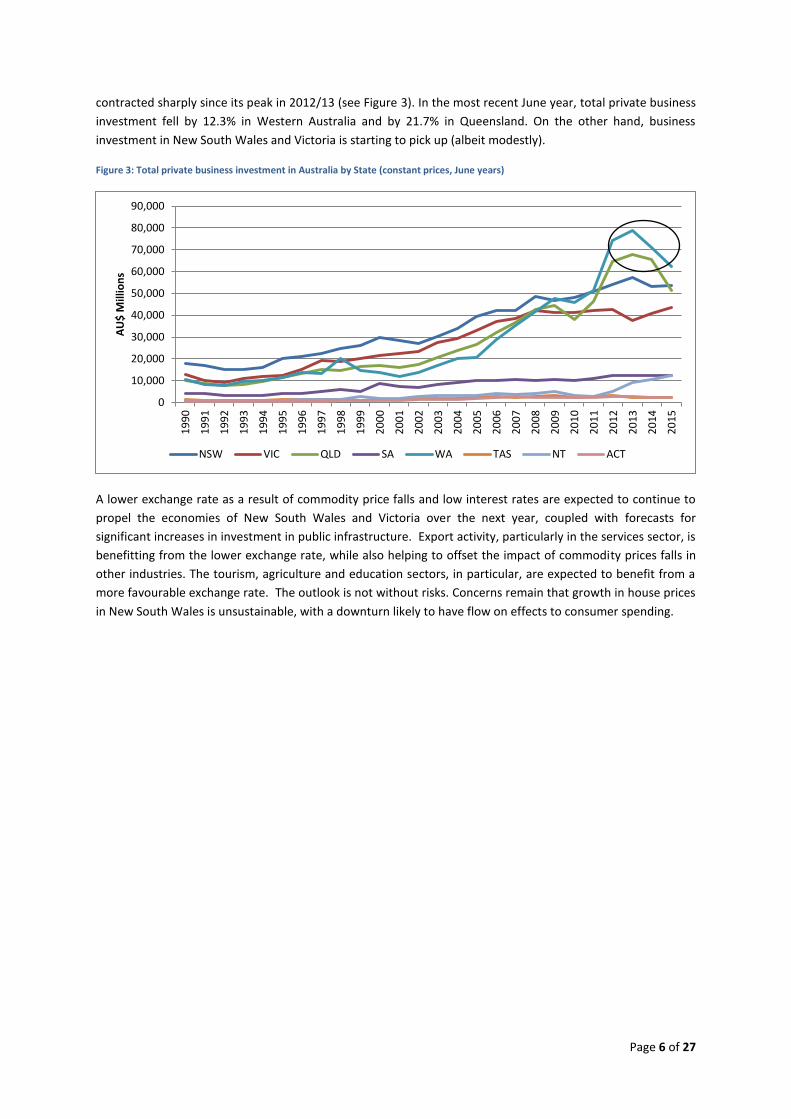
contracted sharply since its peak in 2012/13 (see Figure 3). In the most recent June year, total private business
investment fell by 12.3% in Western Australia and by 21.7% in Queensland. On the other hand, business
investment in New South Wales and Victoria is starting to pick up (albeit modestly).
Figure 3: Total private business investment in Australia by State (constant prices, June years)
A lower exchange rate as a result of commodity price falls and low interest rates are expected to continue to
propel the economies of New South Wales and Victoria over the next year, coupled with forecasts for
significant increases in investment in public infrastructure. Export activity, particularly in the services sector, is
benefitting from the lower exchange rate, while also helping to offset the impact of commodity prices falls in
other industries. The tourism, agriculture and education sectors, in particular, are expected to benefit from a
more favourable exchange rate. The outlook is not without risks. Concerns remain that growth in house prices
in New South Wales is unsustainable, with a downturn likely to have flow on effects to consumer spending.
0
10,000
20,000
30,000
40,000
50,000
60,000
70,000
80,000
90,000
19
90
19
91
19
92
19
93
19
94
19
95
19
96
19
97
19
98
19
99
20
00
20
01
20
02
20
03
20
04
20
05
20
06
20
07
20
08
20
09
20
10
20
11
20
12
20
13
20
14
20
15
AU
$ M
illio
ns
NSW VIC QLD SA WA TAS NT ACT
c
Page 7 of 27
TRANS-TASMAN TRADE3
Australia is NZ’s largest two-way trading partner in terms of goods and services trade, whilst NZ is
Australia’s sixth largest two-way trading partner.
Australia is NZ’s largest export market for both goods and services and is our second largest source of
imports (behind the EU).
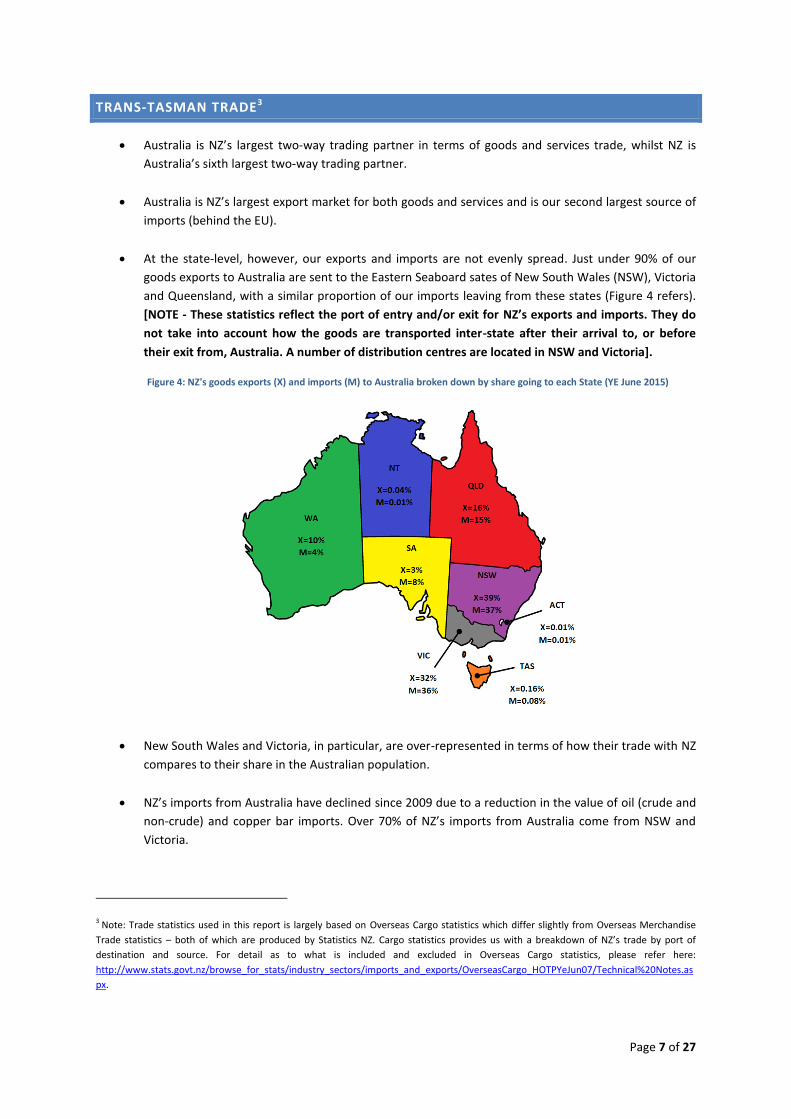
At the state-level, however, our exports and imports are not evenly spread. Just under 90% of our
goods exports to Australia are sent to the Eastern Seaboard sates of New South Wales (NSW), Victoria
and Queensland, with a similar proportion of our imports leaving from these states (Figure 4 refers).
[NOTE - These statistics reflect the port of entry and/or exit for NZ’s exports and imports. They do
not take into account how the goods are transported inter-state after their arrival to, or before
their exit from, Australia. A number of distribution centres are located in NSW and Victoria].
Figure 4: NZ's goods exports (X) and imports (M) to Australia broken down by share going to each State (YE June 2015)
New South Wales and Victoria, in particular, are over-represented in terms of how their trade with NZ
compares to their share in the Australian population.
NZ’s imports from Australia have declined since 2009 due to a reduction in the value of oil (crude and
non-crude) and copper bar imports. Over 70% of NZ’s imports from Australia come from NSW and
Victoria.
3 Note: Trade statistics used in this report is largely based on Overseas Cargo statistics which differ slightly from Overseas Merchandise
Trade statistics – both of which are produced by Statistics NZ. Cargo statistics provides us with a breakdown of NZ’s trade by port of
destination and source. For detail as to what is included and excluded in Overseas Cargo statistics, please refer here:
http://www.stats.govt.nz/browse_for_stats/industry_sectors/imports_and_exports/OverseasCargo_HOTPYeJun07/Technical%20Notes.as
px.
Page 8 of 27
NZ is a more important export destination for some Australian states and territories than others,
coming in 1ST
for ACT and 4th
for Victoria.
Table 2: Australian State/Territory Rankings of NZ as a Goods Trading Partner (YE June 2014)
While Australia is a critical trading partner for NZ, it is also a major competitor for some of our key
exports, most notably for beef exports. Exports of beef is Queensland’s second largest goods export –
valued at AU$3.7 billion in the June 2014 year (cf. AU$2.5 billion exported from NZ in the June 2015
year). On the other hand, Victoria is an important exporter of dairy products such as milk, cream,
whey, yoghurt and cheese (albeit, with a proportion of that dairy product being from NZ/Fonterra
owned entities).
EXPORTS
GOODS
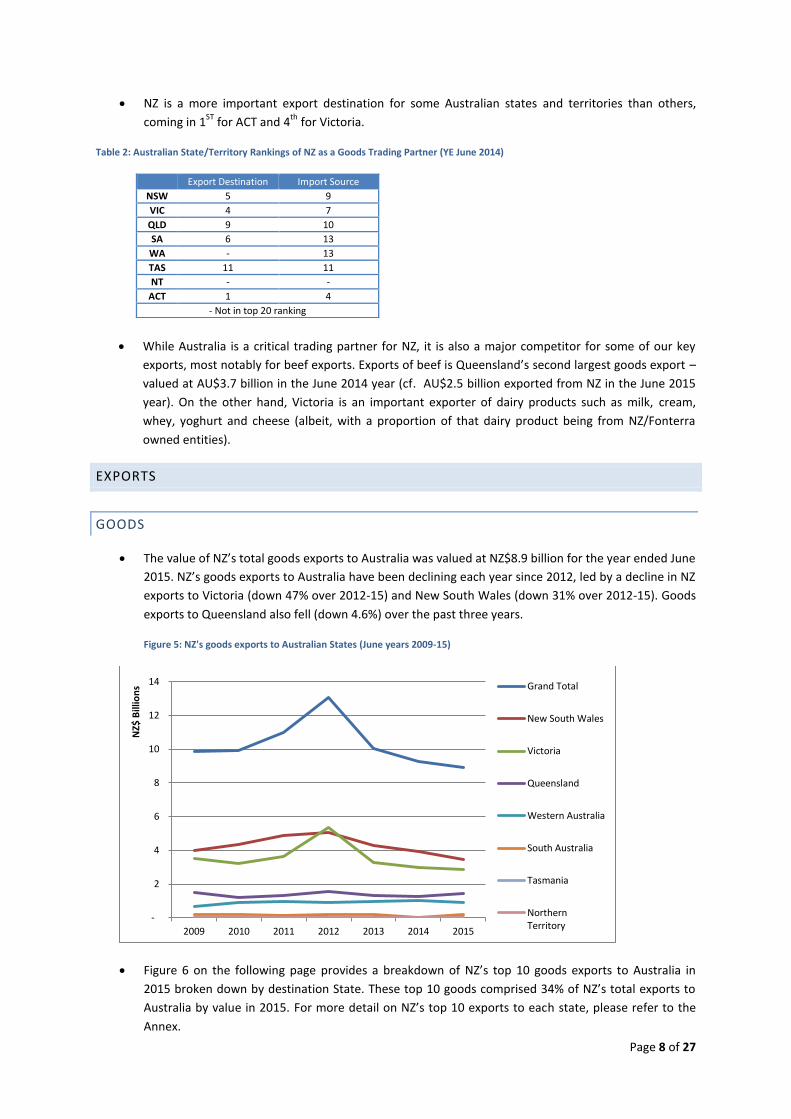
The value of NZ’s total goods exports to Australia was valued at NZ$8.9 billion for the year ended June
2015. NZ’s goods exports to Australia have been declining each year since 2012, led by a decline in NZ
exports to Victoria (down 47% over 2012-15) and New South Wales (down 31% over 2012-15). Goods
exports to Queensland also fell (down 4.6%) over the past three years.
Figure 5: NZ's goods exports to Australian States (June years 2009-15)
Figure 6 on the following page provides a breakdown of NZ’s top 10 goods exports to Australia in
2015 broken down by destination State. These top 10 goods comprised 34% of NZ’s total exports to
Australia by value in 2015. For more detail on NZ’s top 10 exports to each state, please refer to the
Annex.
-
2
4
6
8
10
12
14
2009 2010 2011 2012 2013 2014 2015
NZ$
Bill
ion
s Grand Total
New South Wales
Victoria
Queensland
Western Australia
South Australia
Tasmania
NorthernTerritory
Export Destination Import Source
NSW 5 9
VIC 4 7
QLD 9 10
SA 6 13
WA - 13
TAS 11 11
NT - -
ACT 1 4
- Not in top 20 ranking
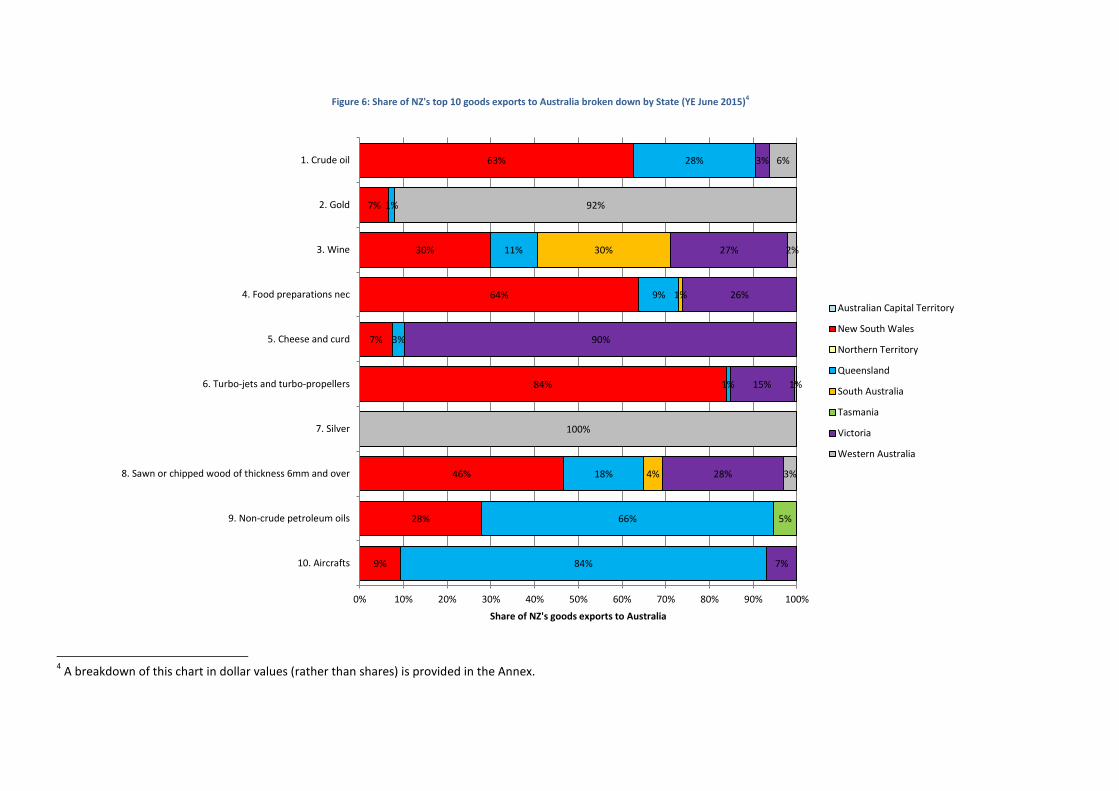
Figure 6: Share of NZ's top 10 goods exports to Australia broken down by State (YE June 2015)4
4 A breakdown of this chart in dollar values (rather than shares) is provided in the Annex.
9%
28%
46%
84%
7%
64%
30%
7%
63%
84%
66%
18%
1%
3%
9%
11%
1%
28%
4%
1%
30%
5%
7%
28%
15%
90%
26%
27%
3%
3%
100%
1%
2%
92%
6%
0% 10% 20% 30% 40% 50% 60% 70% 80% 90% 100%
10. Aircrafts
9. Non-crude petroleum oils
8. Sawn or chipped wood of thickness 6mm and over
7. Silver
6. Turbo-jets and turbo-propellers
5. Cheese and curd
4. Food preparations nec
3. Wine
2. Gold
1. Crude oil
Share of NZ's goods exports to Australia
Australian Capital Territory
New South Wales
Northern Territory
Queensland
South Australia
Tasmania
Victoria
Western Australia
Page 10 of 27
Notwithstanding declining oil prices, crude oil remains NZ’s biggest goods export to Australia in value
terms, with New South Wales the destination for over 62% of this trade ($556m year ended June
2015).
A near halving of our crude oil exports to New South Wales since 2012, driven in part by the closure of
a major oil refinery, has increased the proportion of our crude oil exports to Queensland from 4%
($71m) in 2012 to 28% ($249m) in the year ended June 2015.
The value of NZ gold exports to Australia is currently on a declining trend as prices have fallen.
While the Eastern Seaboard states are the key destination for most of our other major exports to
Australia, gold, silver and wine are notable exceptions.
Gold exports – NZ’s second biggest export to Australia – are predominantly sent to Western Australia.
Western Australia has one of the largest gold refineries in the world with the Perth facility refining the
total annual production of gold in Australia as well as, gold mined in NZ and other countries. It is
important to note that in 2009, 40% of NZ’s gold exports to Australia were sent to New South Wales
and 60% to Western Australia. Today, 92% of NZ’s gold exports to Australia are sent directly to
Western Australia, with a very small proportion (7%) exported to New South Wales.
Our silver exports are almost exclusively destined for Western Australia ($212 million).
South Australia is the entry port for approximately 30% of our wine exports ($110 million), compared
to just 3% of our total goods exports to Australia.
Other standouts include the 90% of our cheese exports sent to Victoria ($219 million),
notwithstanding that Victoria is also the biggest Australian state for dairy production.
LEVEL OF PROCESSING
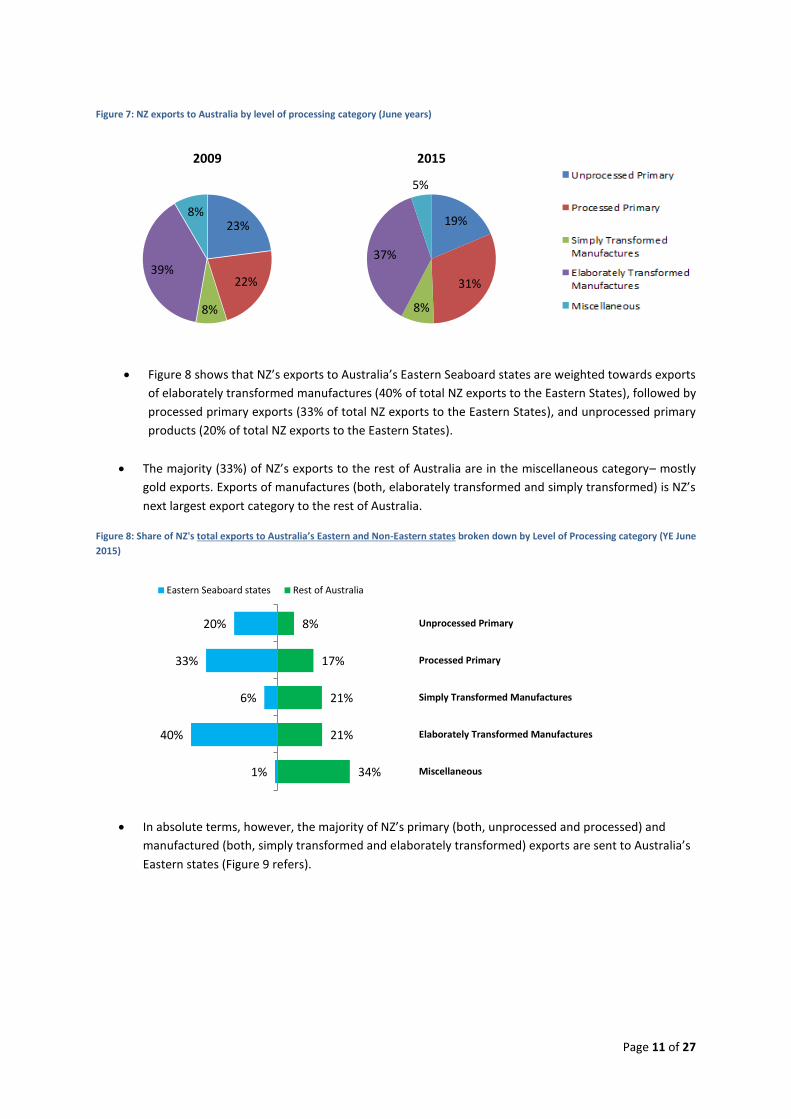
The charts below illustrate NZ’s goods exports by level of processing to Australian states for the years
ended June 2009 and 2015.
The majority of NZ’s exports to Australia are elaborately transformed manufactures although this
share has declined from 39% in 2009 to 37% today.
Exports of processed primary products have increased from comprising 22% of NZ’s total exports to
Australia in 2009 to 31% in 2015.
Page 11 of 27
Figure 8 shows that NZ’s exports to Australia’s Eastern Seaboard states are weighted towards exports
of elaborately transformed manufactures (40% of total NZ exports to the Eastern States), followed by
processed primary exports (33% of total NZ exports to the Eastern States), and unprocessed primary
products (20% of total NZ exports to the Eastern States).
The majority (33%) of NZ’s exports to the rest of Australia are in the miscellaneous category– mostly
gold exports. Exports of manufactures (both, elaborately transformed and simply transformed) is NZ’s
next largest export category to the rest of Australia.
Figure 8: Share of NZ's total exports to Australia’s Eastern and Non-Eastern states broken down by Level of Processing category (YE June
2015)
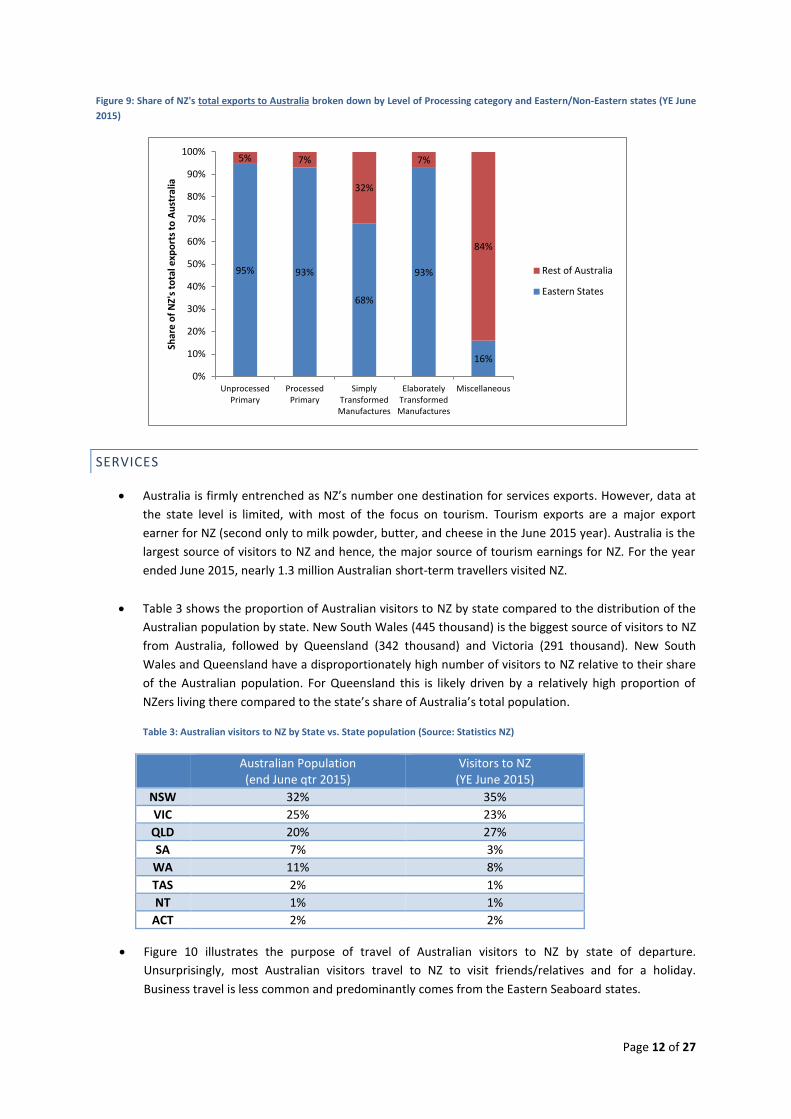
In absolute terms, however, the majority of NZ’s primary (both, unprocessed and processed) and
manufactured (both, simply transformed and elaborately transformed) exports are sent to Australia’s
Eastern states (Figure 9 refers).
34%
21%
21%
17%
8%
1%
40%
6%
33%
20%
Miscellaneous
Elaborately Transformed Manufactures
Simply Transformed Manufactures
Processed Primary
Unprocessed Primary
Eastern Seaboard states Rest of Australia
23%
22%
8%
39%
8%
2009
19%
31%
8%
37%
5%
2015
Figure 7: NZ exports to Australia by level of processing category (June years)
Page 12 of 27
Figure 9: Share of NZ's total exports to Australia broken down by Level of Processing category and Eastern/Non-Eastern states (YE June
2015)
SERVICES
Australia is firmly entrenched as NZ’s number one destination for services exports. However, data at
the state level is limited, with most of the focus on tourism. Tourism exports are a major export
earner for NZ (second only to milk powder, butter, and cheese in the June 2015 year). Australia is the
largest source of visitors to NZ and hence, the major source of tourism earnings for NZ. For the year
ended June 2015, nearly 1.3 million Australian short-term travellers visited NZ.
Table 3 shows the proportion of Australian visitors to NZ by state compared to the distribution of the
Australian population by state. New South Wales (445 thousand) is the biggest source of visitors to NZ
from Australia, followed by Queensland (342 thousand) and Victoria (291 thousand). New South
Wales and Queensland have a disproportionately high number of visitors to NZ relative to their share
of the Australian population. For Queensland this is likely driven by a relatively high proportion of
NZers living there compared to the state’s share of Australia’s total population.
Table 3: Australian visitors to NZ by State vs. State population (Source: Statistics NZ)
Australian Population (end June qtr 2015)
Visitors to NZ (YE June 2015)
NSW 32% 35%
VIC 25% 23%
QLD 20% 27%
SA 7% 3%
WA 11% 8%
TAS 2% 1%
NT 1% 1%
ACT 2% 2%
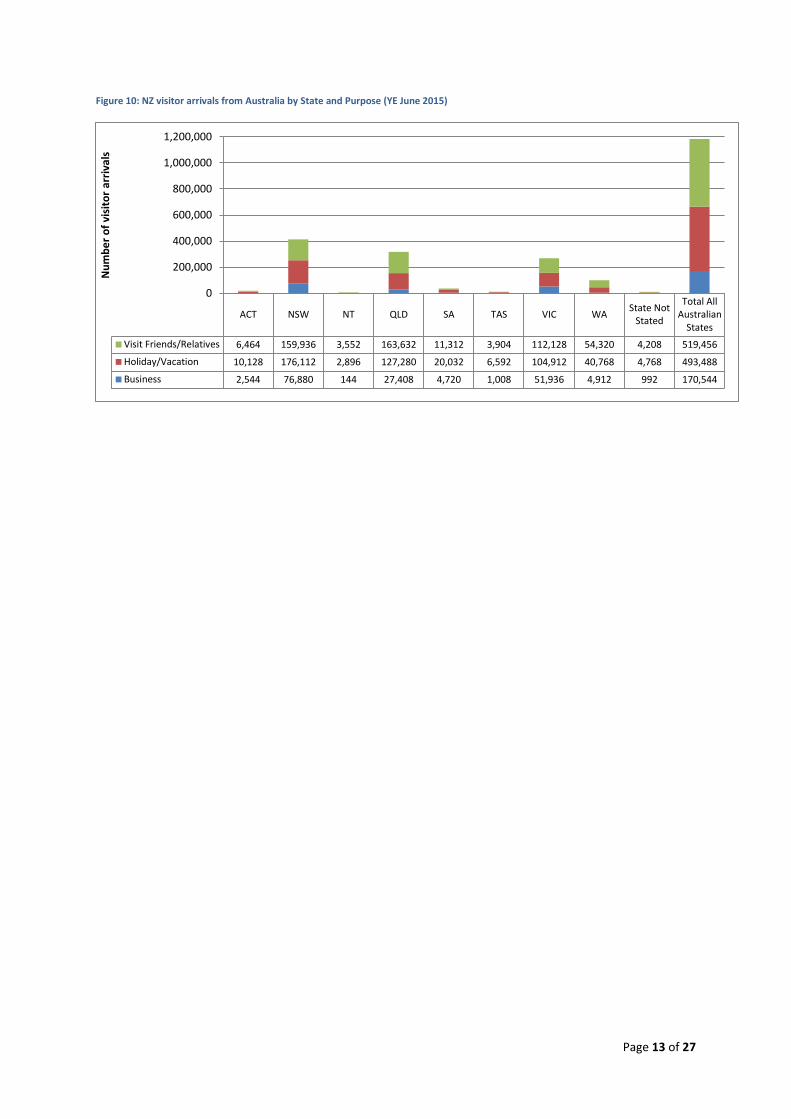
Figure 10 illustrates the purpose of travel of Australian visitors to NZ by state of departure.
Unsurprisingly, most Australian visitors travel to NZ to visit friends/relatives and for a holiday.
Business travel is less common and predominantly comes from the Eastern Seaboard states.
95% 93%
68%
93%
16%
5% 7%
32%
7%
84%
0%
10%
20%
30%
40%
50%
60%
70%
80%
90%
100%
UnprocessedPrimary
ProcessedPrimary
SimplyTransformedManufactures
ElaboratelyTransformedManufactures
Miscellaneous
Shar
e o
f N
Z's
tota
l exp
ort
s to
Au
stra
lia
Rest of Australia
Eastern States
Page 13 of 27
Figure 10: NZ visitor arrivals from Australia by State and Purpose (YE June 2015)
ACT NSW NT QLD SA TAS VIC WAState Not
Stated
Total AllAustralian
States
Visit Friends/Relatives 6,464 159,936 3,552 163,632 11,312 3,904 112,128 54,320 4,208 519,456
Holiday/Vacation 10,128 176,112 2,896 127,280 20,032 6,592 104,912 40,768 4,768 493,488
Business 2,544 76,880 144 27,408 4,720 1,008 51,936 4,912 992 170,544
0
200,000
400,000
600,000
800,000
1,000,000
1,200,000
Nu
mb
er
of
visi
tor
arri
vals
Page 14 of 27
IMPORTS
GOODS
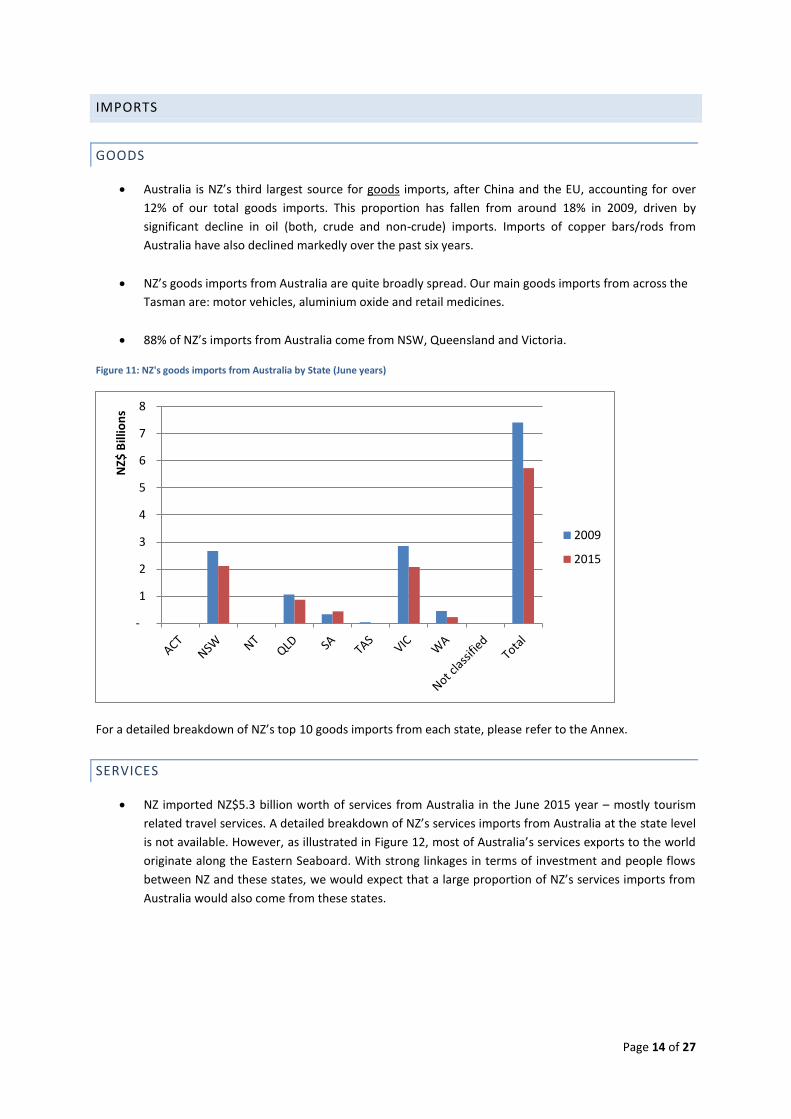
Australia is NZ’s third largest source for goods imports, after China and the EU, accounting for over
12% of our total goods imports. This proportion has fallen from around 18% in 2009, driven by
significant decline in oil (both, crude and non-crude) imports. Imports of copper bars/rods from
Australia have also declined markedly over the past six years.
NZ’s goods imports from Australia are quite broadly spread. Our main goods imports from across the
Tasman are: motor vehicles, aluminium oxide and retail medicines.
88% of NZ’s imports from Australia come from NSW, Queensland and Victoria.
Figure 11: NZ's goods imports from Australia by State (June years)
For a detailed breakdown of NZ’s top 10 goods imports from each state, please refer to the Annex.
SERVICES
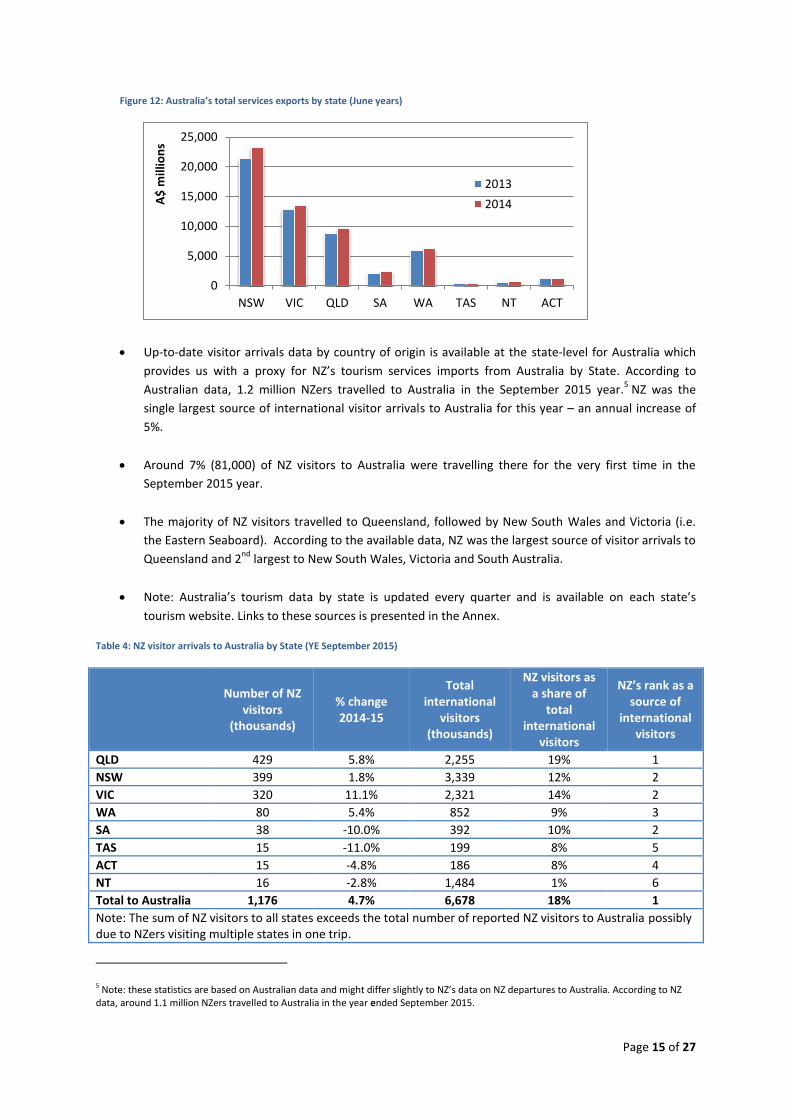
NZ imported NZ$5.3 billion worth of services from Australia in the June 2015 year – mostly tourism
related travel services. A detailed breakdown of NZ’s services imports from Australia at the state level
is not available. However, as illustrated in Figure 12, most of Australia’s services exports to the world
originate along the Eastern Seaboard. With strong linkages in terms of investment and people flows
between NZ and these states, we would expect that a large proportion of NZ’s services imports from
Australia would also come from these states.
-
1
2
3
4
5
6
7
8
NZ$
Bill
ion
s
2009
2015
Page 15 of 27
Figure 12: Australia’s total services exports by state (June years)
Up-to-date visitor arrivals data by country of origin is available at the state-level for Australia which
provides us with a proxy for NZ’s tourism services imports from Australia by State. According to
Australian data, 1.2 million NZers travelled to Australia in the September 2015 year.5 NZ was the
single largest source of international visitor arrivals to Australia for this year – an annual increase of
5%.
Around 7% (81,000) of NZ visitors to Australia were travelling there for the very first time in the
September 2015 year.
The majority of NZ visitors travelled to Queensland, followed by New South Wales and Victoria (i.e.
the Eastern Seaboard). According to the available data, NZ was the largest source of visitor arrivals to
Queensland and 2nd
largest to New South Wales, Victoria and South Australia.
Note: Australia’s tourism data by state is updated every quarter and is available on each state’s
tourism website. Links to these sources is presented in the Annex.
Table 4: NZ visitor arrivals to Australia by State (YE September 2015)
Number of NZ visitors
(thousands)
% change 2014-15
Total international
visitors (thousands)
NZ visitors as a share of
total international
visitors
NZ’s rank as a source of
international visitors
QLD 429 5.8% 2,255 19% 1
NSW 399 1.8% 3,339 12% 2
VIC 320 11.1% 2,321 14% 2
WA 80 5.4% 852 9% 3
SA 38 -10.0% 392 10% 2
TAS 15 -11.0% 199 8% 5
ACT 15 -4.8% 186 8% 4
NT 16 -2.8% 1,484 1% 6
Total to Australia 1,176 4.7% 6,678 18% 1
Note: The sum of NZ visitors to all states exceeds the total number of reported NZ visitors to Australia possibly due to NZers visiting multiple states in one trip.
5 Note: these statistics are based on Australian data and might differ slightly to NZ’s data on NZ departures to Australia. According to NZ data, around 1.1 million NZers travelled to Australia in the year ended September 2015.
0
5,000
10,000
15,000
20,000
25,000
NSW VIC QLD SA WA TAS NT ACT
A$
mill
ion
s
2013
2014
Page 16 of 27
PEOPLE TO PEOPLE LINKS
WHERE DO NZERS LIVE IN AUSTRALIA?
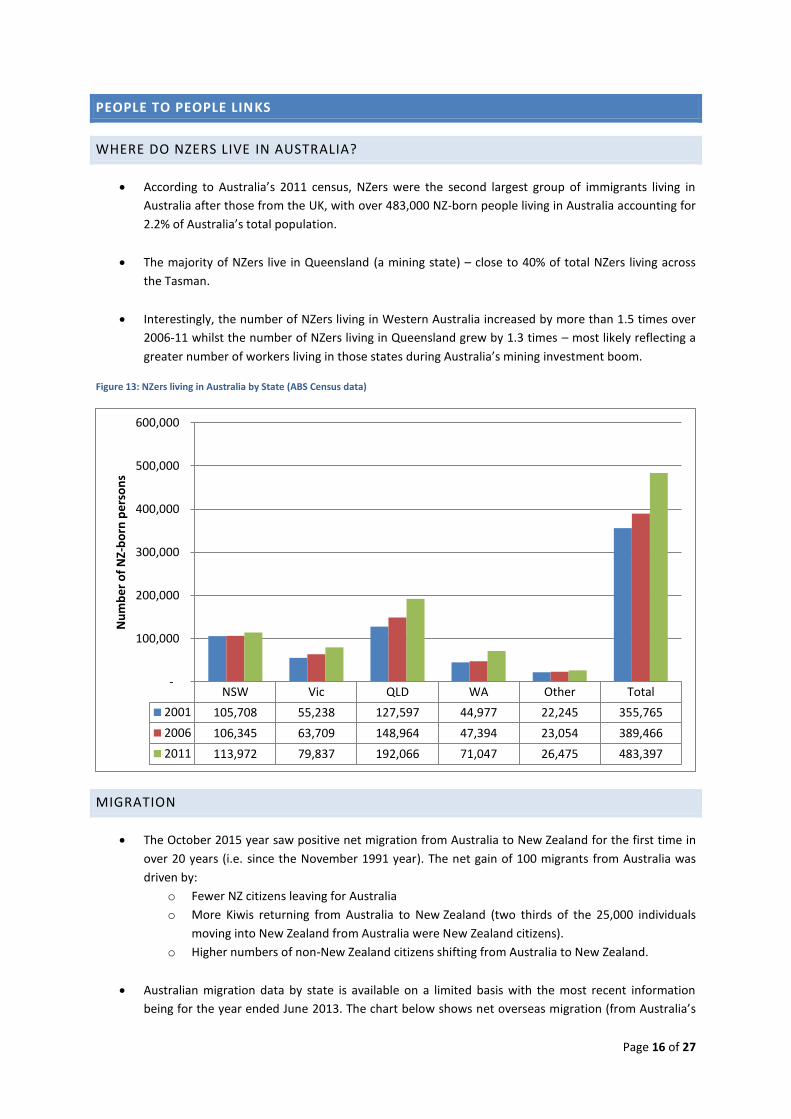
According to Australia’s 2011 census, NZers were the second largest group of immigrants living in
Australia after those from the UK, with over 483,000 NZ-born people living in Australia accounting for
2.2% of Australia’s total population.
The majority of NZers live in Queensland (a mining state) – close to 40% of total NZers living across
the Tasman.
Interestingly, the number of NZers living in Western Australia increased by more than 1.5 times over
2006-11 whilst the number of NZers living in Queensland grew by 1.3 times – most likely reflecting a
greater number of workers living in those states during Australia’s mining investment boom.
Figure 13: NZers living in Australia by State (ABS Census data)
MIGRATION
The October 2015 year saw positive net migration from Australia to New Zealand for the first time in
over 20 years (i.e. since the November 1991 year). The net gain of 100 migrants from Australia was
driven by:
o Fewer NZ citizens leaving for Australia
o More Kiwis returning from Australia to New Zealand (two thirds of the 25,000 individuals
moving into New Zealand from Australia were New Zealand citizens).
o Higher numbers of non-New Zealand citizens shifting from Australia to New Zealand.
Australian migration data by state is available on a limited basis with the most recent information
being for the year ended June 2013. The chart below shows net overseas migration (from Australia’s
NSW Vic QLD WA Other Total
2001 105,708 55,238 127,597 44,977 22,245 355,765
2006 106,345 63,709 148,964 47,394 23,054 389,466
2011 113,972 79,837 192,066 71,047 26,475 483,397
-
100,000
200,000
300,000
400,000
500,000
600,000
Nu
mb
er
of
NZ-
bo
rn p
ers
on
s
Page 17 of 27
perspective) by state for those persons who enter/leave the country on a New Zealand Citizen
subclass 444 visa (i.e. NZ citizens). Links to this data is available in the Annex.
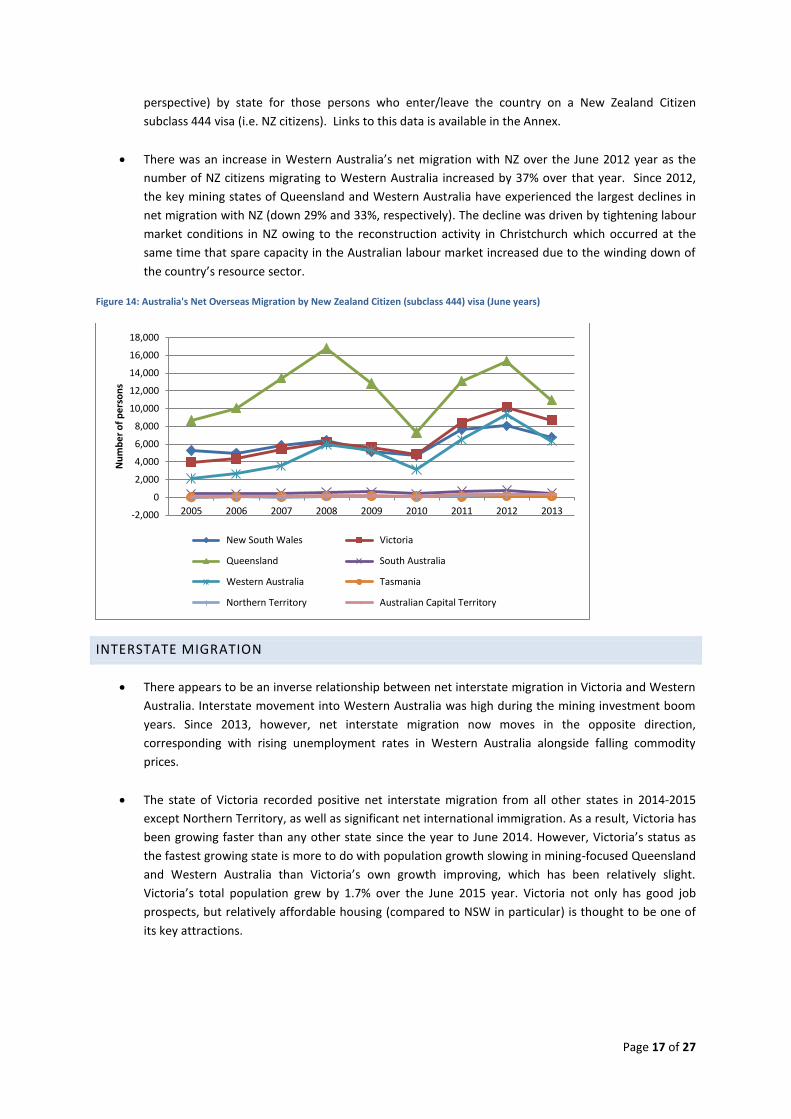
There was an increase in Western Australia’s net migration with NZ over the June 2012 year as the
number of NZ citizens migrating to Western Australia increased by 37% over that year. Since 2012,
the key mining states of Queensland and Western Australia have experienced the largest declines in
net migration with NZ (down 29% and 33%, respectively). The decline was driven by tightening labour
market conditions in NZ owing to the reconstruction activity in Christchurch which occurred at the
same time that spare capacity in the Australian labour market increased due to the winding down of
the country’s resource sector.
Figure 14: Australia's Net Overseas Migration by New Zealand Citizen (subclass 444) visa (June years)
INTERSTATE MIGRATION
There appears to be an inverse relationship between net interstate migration in Victoria and Western
Australia. Interstate movement into Western Australia was high during the mining investment boom
years. Since 2013, however, net interstate migration now moves in the opposite direction,
corresponding with rising unemployment rates in Western Australia alongside falling commodity
prices.
The state of Victoria recorded positive net interstate migration from all other states in 2014-2015
except Northern Territory, as well as significant net international immigration. As a result, Victoria has
been growing faster than any other state since the year to June 2014. However, Victoria’s status as
the fastest growing state is more to do with population growth slowing in mining-focused Queensland
and Western Australia than Victoria’s own growth improving, which has been relatively slight.
Victoria’s total population grew by 1.7% over the June 2015 year. Victoria not only has good job
prospects, but relatively affordable housing (compared to NSW in particular) is thought to be one of
its key attractions.
-2,000
0
2,000
4,000
6,000
8,000
10,000
12,000
14,000
16,000
18,000
2005 2006 2007 2008 2009 2010 2011 2012 2013
Nu
mb
er
of
pe
rso
ns
New South Wales Victoria
Queensland South Australia
Western Australia Tasmania
Northern Territory Australian Capital Territory
Page 18 of 27
INVESTMENT
Australia is NZ’s largest source and destination for foreign direct investment (the tables below refer).
Table 5: Australia's stock of direct investment in NZ, NZ$ millions (Sept 2015)
2010 2015 Rank % of total
FDI $46,171 $50,082 1 51.6
Total $113,031 $110,254 1 29.6
Table 6: NZ's stock of direct investment in Australia, NZ$ millions (Sept 2015)
2010 2015 Rank % of total
ODI $13,779 $12,225 1 48.5
Total $48,083 $59,422 1 26.9
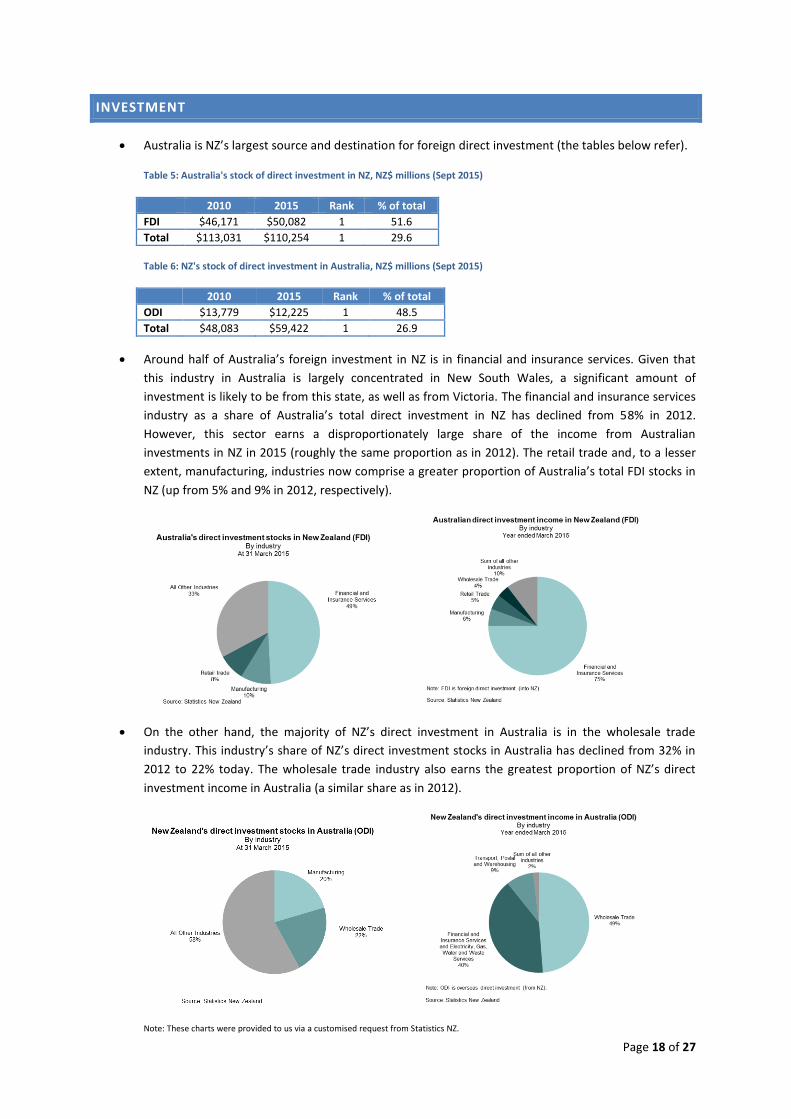
Around half of Australia’s foreign investment in NZ is in financial and insurance services. Given that
this industry in Australia is largely concentrated in New South Wales, a significant amount of
investment is likely to be from this state, as well as from Victoria. The financial and insurance services
industry as a share of Australia’s total direct investment in NZ has declined from 58% in 2012.
However, this sector earns a disproportionately large share of the income from Australian
investments in NZ in 2015 (roughly the same proportion as in 2012). The retail trade and, to a lesser
extent, manufacturing, industries now comprise a greater proportion of Australia’s total FDI stocks in
NZ (up from 5% and 9% in 2012, respectively).
On the other hand, the majority of NZ’s direct investment in Australia is in the wholesale trade
industry. This industry’s share of NZ’s direct investment stocks in Australia has declined from 32% in
2012 to 22% today. The wholesale trade industry also earns the greatest proportion of NZ’s direct
investment income in Australia (a similar share as in 2012).
Note: These charts were provided to us via a customised request from Statistics NZ.
Page 19 of 27
CONCLUSIONS
The effects of Australia’s changing economic scene will undoubtedly ripple across the Tasman to NZ
given the strong economic relationship between the two countries.
The effects of the slowdown are most concentrated in Australia’s mining states of Queensland and
Western Australia. Notwithstanding this, however, Queensland continues to be a relatively important
state for NZ trade and people-to-people links.
NZ maintains its strongest trading relationship with New South Wales and Victoria, and these states
remain relatively well poised for growth, though this is not without risks.
Future growth in Australia is expected to be focused in services exports such as tourism, education
and business services, as well as in other non-mining sectors. This could pose some competition for
NZ’s exports to third countries, particularly in light of Australia’s recently concluded FTAs with key NZ
trading partners: China, Japan and South Korea.
Looking further ahead: If the Australian economy successfully rebalances into the non-mining
economy, this should be beneficial for NZ. Housing market activity has already picked up and this has
been accompanied by stronger consumption growth, particularly in New South Wales and Victoria.
Increasing consumption spending could likely lead to greater demand for NZ’s food and manufactured
exports.
Page 20 of 27
ANNEX
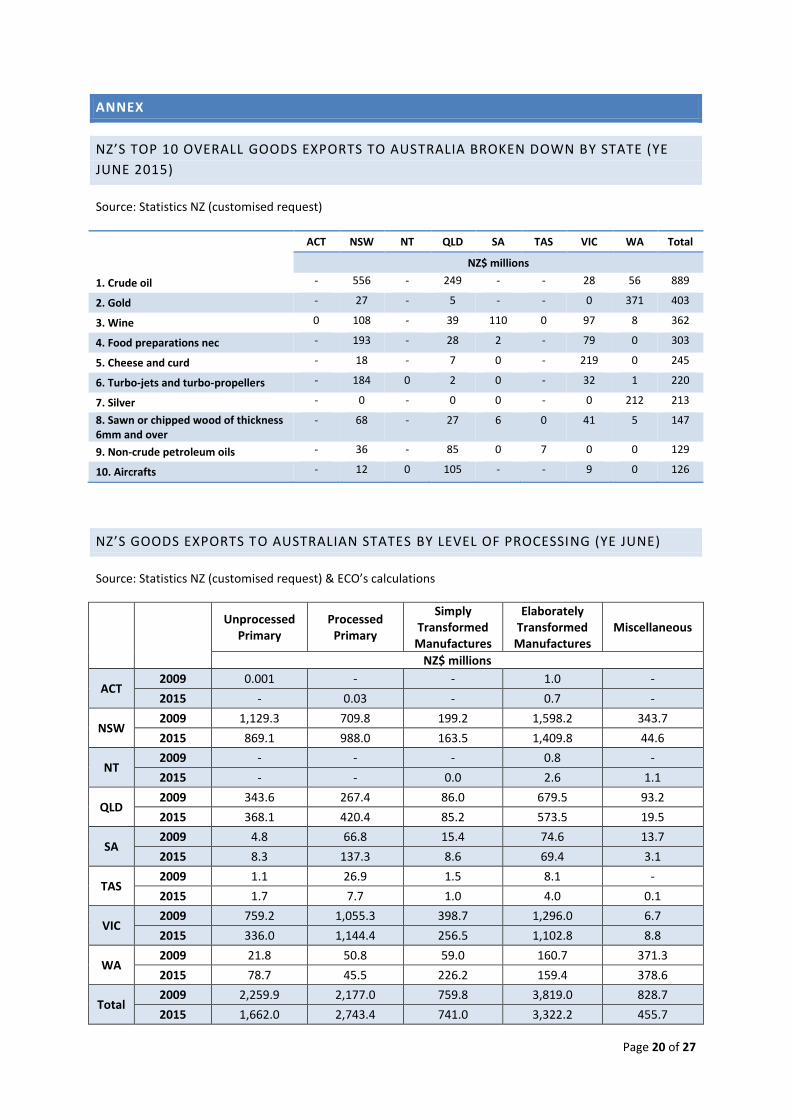
NZ’S TOP 10 OVERALL GOODS EXPORTS TO AUSTRALIA BROKEN DOWN BY STATE (YE
JUNE 2015)
Source: Statistics NZ (customised request)
ACT NSW NT QLD SA TAS VIC WA Total
NZ$ millions
1. Crude oil - 556 - 249 - - 28 56 889
2. Gold - 27 - 5 - - 0 371 403
3. Wine 0 108 - 39 110 0 97 8 362
4. Food preparations nec - 193 - 28 2 - 79 0 303
5. Cheese and curd - 18 - 7 0 - 219 0 245
6. Turbo-jets and turbo-propellers - 184 0 2 0 - 32 1 220
7. Silver - 0 - 0 0 - 0 212 213
8. Sawn or chipped wood of thickness 6mm and over
- 68 - 27 6 0 41 5 147
9. Non-crude petroleum oils - 36 - 85 0 7 0 0 129
10. Aircrafts - 12 0 105 - - 9 0 126
NZ’S GOODS EXPORTS TO AUSTRALIAN STATES BY LEVEL OF PROCESSING (YE JUNE)
Source: Statistics NZ (customised request) & ECO’s calculations
Unprocessed Primary
Processed Primary
Simply Transformed
Manufactures
Elaborately Transformed
Manufactures Miscellaneous
NZ$ millions
ACT 2009 0.001 - - 1.0 -
2015 - 0.03 - 0.7 -
NSW 2009 1,129.3 709.8 199.2 1,598.2 343.7
2015 869.1 988.0 163.5 1,409.8 44.6
NT 2009 - - - 0.8 -
2015 - - 0.0 2.6 1.1
QLD 2009 343.6 267.4 86.0 679.5 93.2
2015 368.1 420.4 85.2 573.5 19.5
SA 2009 4.8 66.8 15.4 74.6 13.7
2015 8.3 137.3 8.6 69.4 3.1
TAS 2009 1.1 26.9 1.5 8.1 -
2015 1.7 7.7 1.0 4.0 0.1
VIC 2009 759.2 1,055.3 398.7 1,296.0 6.7
2015 336.0 1,144.4 256.5 1,102.8 8.8
WA 2009 21.8 50.8 59.0 160.7 371.3
2015 78.7 45.5 226.2 159.4 378.6
Total 2009 2,259.9 2,177.0 759.8 3,819.0 828.7
2015 1,662.0 2,743.4 741.0 3,322.2 455.7
Page 21 of 27
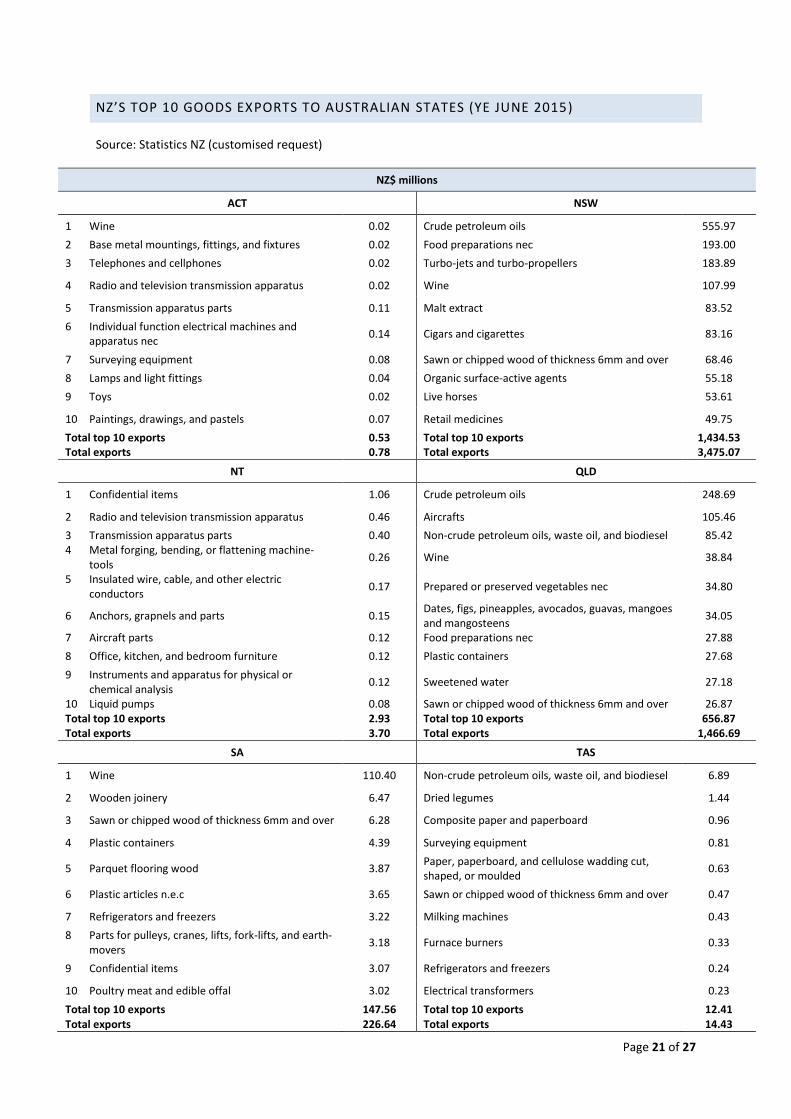
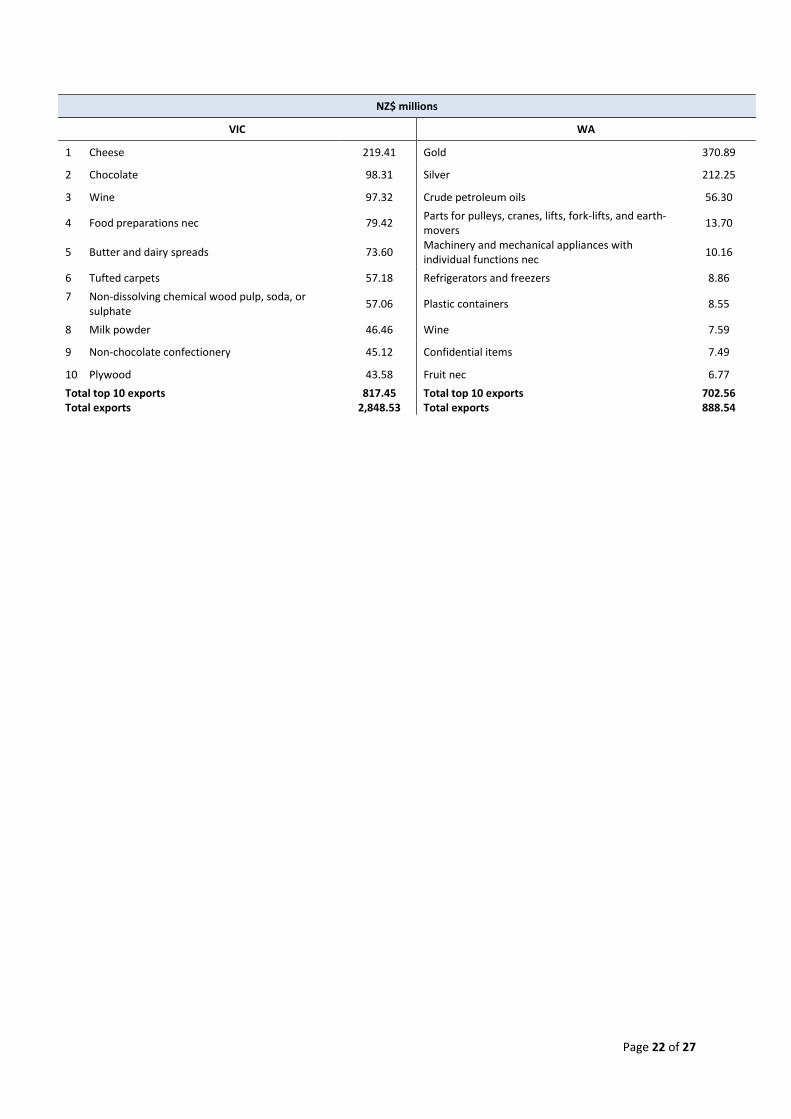
NZ’S TOP 10 GOODS EXPORTS TO AUSTRALIAN STATES (YE JUNE 2015)
Source: Statistics NZ (customised request)
NZ$ millions
ACT NSW
1 Wine 0.02 Crude petroleum oils 555.97
2 Base metal mountings, fittings, and fixtures 0.02 Food preparations nec 193.00
3 Telephones and cellphones 0.02 Turbo-jets and turbo-propellers 183.89
4 Radio and television transmission apparatus 0.02 Wine 107.99
5 Transmission apparatus parts 0.11 Malt extract 83.52
6 Individual function electrical machines and apparatus nec
0.14 Cigars and cigarettes 83.16
7 Surveying equipment 0.08 Sawn or chipped wood of thickness 6mm and over 68.46
8 Lamps and light fittings 0.04 Organic surface-active agents 55.18
9 Toys 0.02 Live horses 53.61
10 Paintings, drawings, and pastels 0.07 Retail medicines 49.75
Total top 10 exports 0.53 Total top 10 exports 1,434.53 Total exports 0.78 Total exports 3,475.07
NT QLD
1 Confidential items 1.06 Crude petroleum oils 248.69
2 Radio and television transmission apparatus 0.46 Aircrafts 105.46
3 Transmission apparatus parts 0.40 Non-crude petroleum oils, waste oil, and biodiesel 85.42 4 Metal forging, bending, or flattening machine-
tools 0.26 Wine 38.84
5 Insulated wire, cable, and other electric conductors
0.17 Prepared or preserved vegetables nec 34.80
6 Anchors, grapnels and parts 0.15 Dates, figs, pineapples, avocados, guavas, mangoes and mangosteens
34.05
7 Aircraft parts 0.12 Food preparations nec 27.88
8 Office, kitchen, and bedroom furniture 0.12 Plastic containers 27.68
9 Instruments and apparatus for physical or chemical analysis
0.12 Sweetened water 27.18
10 Liquid pumps 0.08 Sawn or chipped wood of thickness 6mm and over 26.87 Total top 10 exports 2.93 Total top 10 exports 656.87 Total exports 3.70 Total exports 1,466.69
SA TAS
1 Wine 110.40 Non-crude petroleum oils, waste oil, and biodiesel 6.89
2 Wooden joinery 6.47 Dried legumes 1.44
3 Sawn or chipped wood of thickness 6mm and over 6.28 Composite paper and paperboard 0.96
4 Plastic containers 4.39 Surveying equipment 0.81
5 Parquet flooring wood 3.87 Paper, paperboard, and cellulose wadding cut, shaped, or moulded
0.63
6 Plastic articles n.e.c 3.65 Sawn or chipped wood of thickness 6mm and over 0.47
7 Refrigerators and freezers 3.22 Milking machines 0.43
8 Parts for pulleys, cranes, lifts, fork-lifts, and earth-movers
3.18 Furnace burners 0.33
9 Confidential items 3.07 Refrigerators and freezers 0.24
10 Poultry meat and edible offal 3.02 Electrical transformers 0.23
Total top 10 exports 147.56 Total top 10 exports 12.41 Total exports 226.64 Total exports 14.43
Page 22 of 27
NZ$ millions
VIC WA
1 Cheese 219.41 Gold 370.89
2 Chocolate 98.31 Silver 212.25
3 Wine 97.32 Crude petroleum oils 56.30
4 Food preparations nec 79.42 Parts for pulleys, cranes, lifts, fork-lifts, and earth-movers
13.70
5 Butter and dairy spreads 73.60 Machinery and mechanical appliances with individual functions nec
10.16
6 Tufted carpets 57.18 Refrigerators and freezers 8.86
7 Non-dissolving chemical wood pulp, soda, or sulphate
57.06 Plastic containers 8.55
8 Milk powder 46.46 Wine 7.59
9 Non-chocolate confectionery 45.12 Confidential items 7.49
10 Plywood 43.58 Fruit nec 6.77
Total top 10 exports 817.45 Total top 10 exports 702.56 Total exports 2,848.53 Total exports 888.54
Page 23 of 27
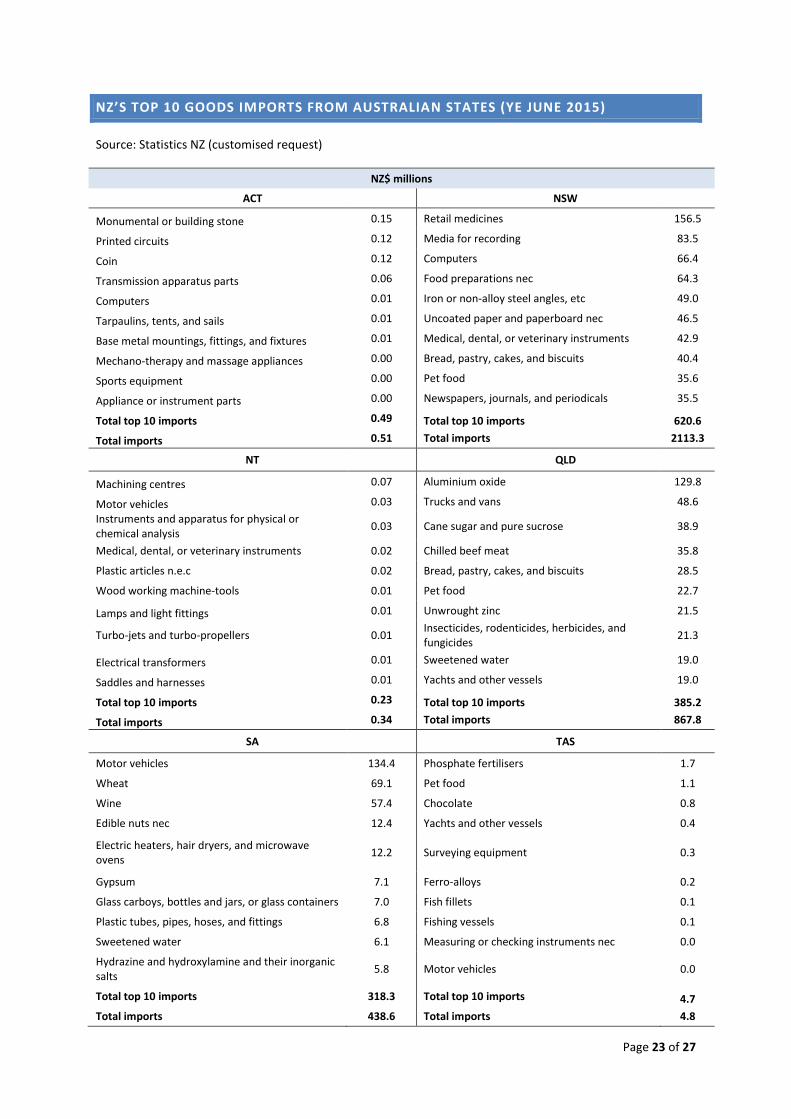
NZ’S TOP 10 GOODS IMPORTS FROM AUSTRALIAN STATES (YE JUNE 2015)
Source: Statistics NZ (customised request)
NZ$ millions
ACT NSW
Monumental or building stone 0.15 Retail medicines 156.5
Printed circuits 0.12 Media for recording 83.5
Coin 0.12 Computers 66.4
Transmission apparatus parts 0.06 Food preparations nec 64.3
Computers 0.01 Iron or non-alloy steel angles, etc 49.0
Tarpaulins, tents, and sails 0.01 Uncoated paper and paperboard nec 46.5
Base metal mountings, fittings, and fixtures 0.01 Medical, dental, or veterinary instruments 42.9
Mechano-therapy and massage appliances 0.00 Bread, pastry, cakes, and biscuits 40.4
Sports equipment 0.00 Pet food 35.6
Appliance or instrument parts 0.00 Newspapers, journals, and periodicals 35.5
Total top 10 imports 0.49 Total top 10 imports 620.6
Total imports 0.51 Total imports 2113.3
NT QLD
Machining centres 0.07 Aluminium oxide 129.8
Motor vehicles 0.03 Trucks and vans 48.6
Instruments and apparatus for physical or chemical analysis
0.03 Cane sugar and pure sucrose 38.9
Medical, dental, or veterinary instruments 0.02 Chilled beef meat 35.8
Plastic articles n.e.c 0.02 Bread, pastry, cakes, and biscuits 28.5
Wood working machine-tools 0.01 Pet food 22.7
Lamps and light fittings 0.01 Unwrought zinc 21.5
Turbo-jets and turbo-propellers 0.01 Insecticides, rodenticides, herbicides, and fungicides
21.3
Electrical transformers 0.01 Sweetened water 19.0
Saddles and harnesses 0.01 Yachts and other vessels 19.0
Total top 10 imports 0.23 Total top 10 imports 385.2
Total imports 0.34 Total imports 867.8
SA TAS
Motor vehicles 134.4 Phosphate fertilisers 1.7
Wheat 69.1 Pet food 1.1
Wine 57.4 Chocolate 0.8
Edible nuts nec 12.4 Yachts and other vessels 0.4
Electric heaters, hair dryers, and microwave ovens
12.2 Surveying equipment 0.3
Gypsum 7.1 Ferro-alloys 0.2
Glass carboys, bottles and jars, or glass containers 7.0 Fish fillets 0.1
Plastic tubes, pipes, hoses, and fittings 6.8 Fishing vessels 0.1
Sweetened water 6.1 Measuring or checking instruments nec 0.0
Hydrazine and hydroxylamine and their inorganic salts
5.8 Motor vehicles 0.0
Total top 10 imports 318.3 Total top 10 imports 4.7
Total imports 438.6 Total imports 4.8
Page 24 of 27
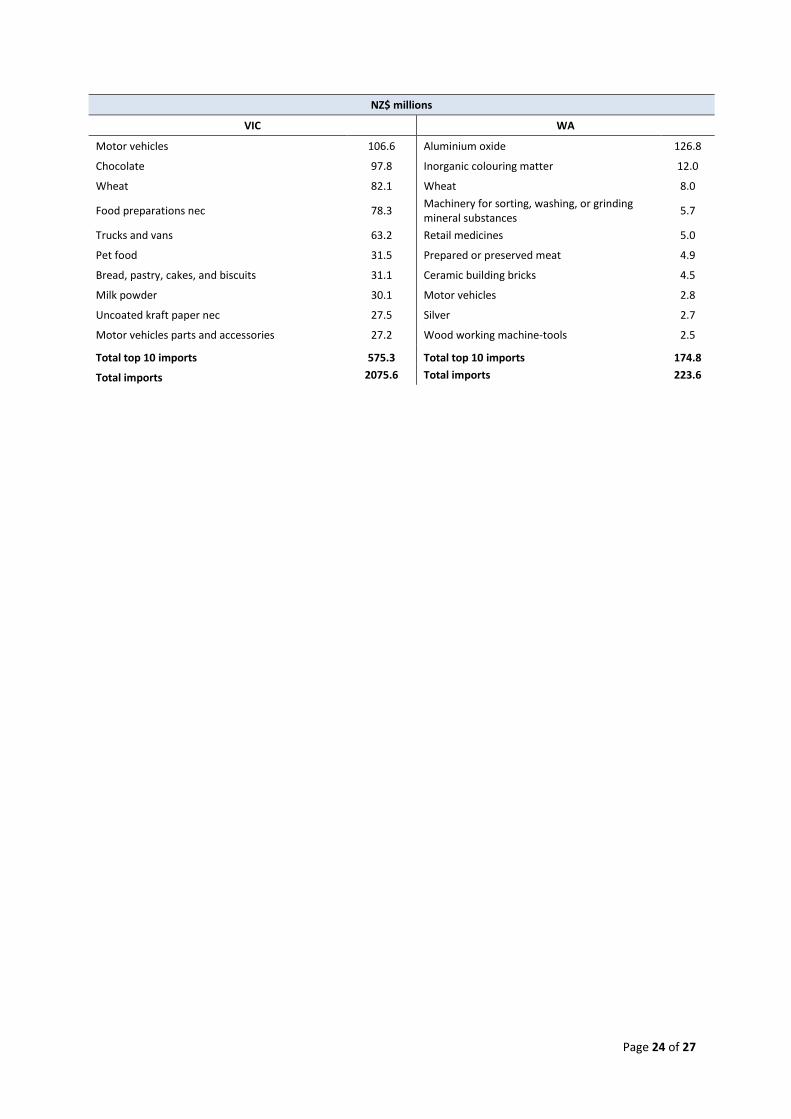
NZ$ millions
VIC WA
Motor vehicles 106.6 Aluminium oxide 126.8
Chocolate 97.8 Inorganic colouring matter 12.0
Wheat 82.1 Wheat 8.0
Food preparations nec 78.3 Machinery for sorting, washing, or grinding mineral substances
5.7
Trucks and vans 63.2 Retail medicines 5.0
Pet food 31.5 Prepared or preserved meat 4.9
Bread, pastry, cakes, and biscuits 31.1 Ceramic building bricks 4.5
Milk powder 30.1 Motor vehicles 2.8
Uncoated kraft paper nec 27.5 Silver 2.7
Motor vehicles parts and accessories 27.2 Wood working machine-tools 2.5
Total top 10 imports 575.3 Total top 10 imports 174.8
Total imports 2075.6 Total imports 223.6
Page 25 of 27
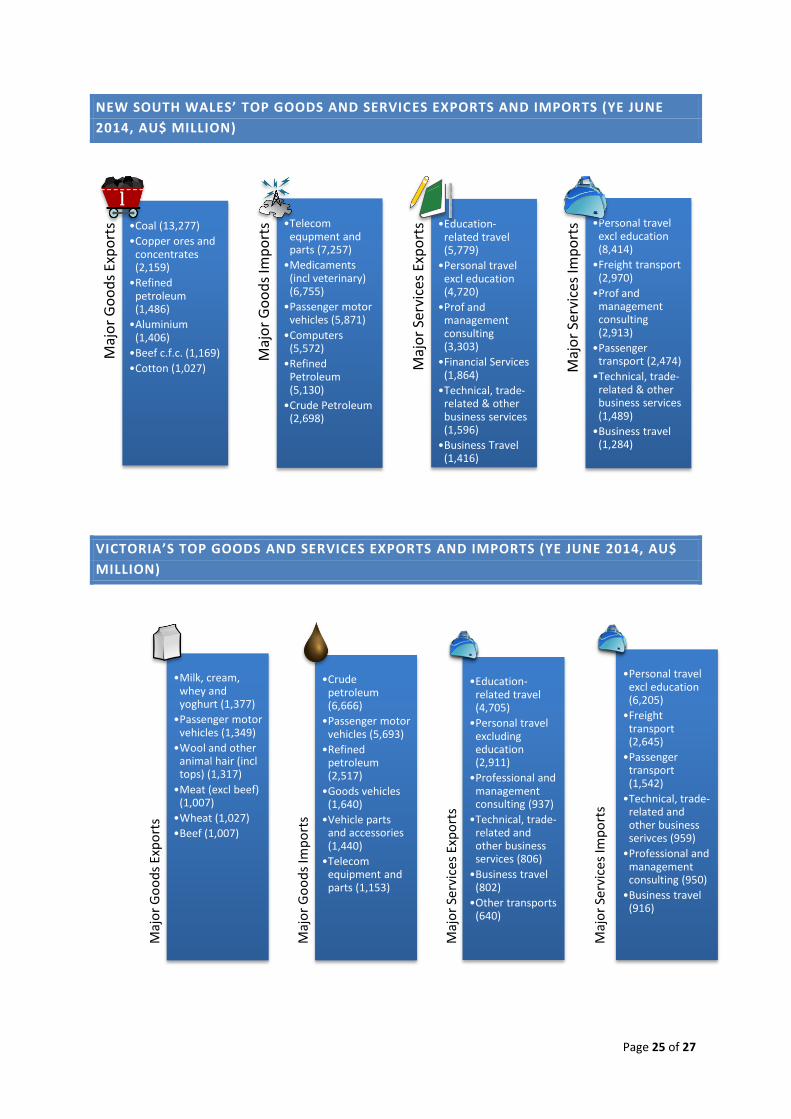
NEW SOUTH WALES’ TOP GOODS AND SERVICES EXPORTS AND IMPORTS (YE JUNE
2014, AU$ MILLION)
VICTORIA’S TOP GOODS AND SERVICES EXPORTS AND IMPORTS (YE JUNE 2014, AU$
MILLION)
Maj
or
Go
od
s Ex
po
rts •Coal (13,277)
•Copper ores and concentrates (2,159)
•Refined petroleum (1,486)
•Aluminium (1,406)
•Beef c.f.c. (1,169)
•Cotton (1,027)
Maj
or
Go
od
s Im
po
rts •Telecom
equpment and parts (7,257)
•Medicaments (incl veterinary) (6,755)
•Passenger motor vehicles (5,871)
•Computers (5,572)
•Refined Petroleum (5,130)
•Crude Petroleum (2,698)
Maj
or
Serv
ices
Exp
ort
s •Education-related travel (5,779)
•Personal travel excl education (4,720)
•Prof and management consulting (3,303)
•Financial Services (1,864)
•Technical, trade-related & other business services (1,596)
•Business Travel (1,416)
Maj
or
Serv
ices
Imp
ort
s •Personal travel excl education (8,414)
•Freight transport (2,970)
•Prof and management consulting (2,913)
•Passenger transport (2,474)
•Technical, trade-related & other business services (1,489)
•Business travel (1,284)
Maj
or
Go
od
s Ex
po
rts
•Milk, cream, whey and yoghurt (1,377)
•Passenger motor vehicles (1,349)
•Wool and other animal hair (incl tops) (1,317)
•Meat (excl beef) (1,007)
•Wheat (1,027)
•Beef (1,007)
Maj
or
Go
od
s Im
po
rts
•Crude petroleum (6,666)
•Passenger motor vehicles (5,693)
•Refined petroleum (2,517)
•Goods vehicles (1,640)
•Vehicle parts and accessories (1,440)
•Telecom equipment and parts (1,153)
Maj
or
Serv
ice
s Ex
po
rts
•Education-related travel (4,705)
•Personal travel excluding education (2,911)
•Professional and management consulting (937)
•Technical, trade-related and other business services (806)
•Business travel (802)
•Other transports (640)
Maj
or
Serv
ice
s Im
po
rts
•Personal travel excl education (6,205)
•Freight transport (2,645)
•Passenger transport (1,542)
•Technical, trade-related and other business serivces (959)
•Professional and management consulting (950)
•Business travel (916)
Page 26 of 27
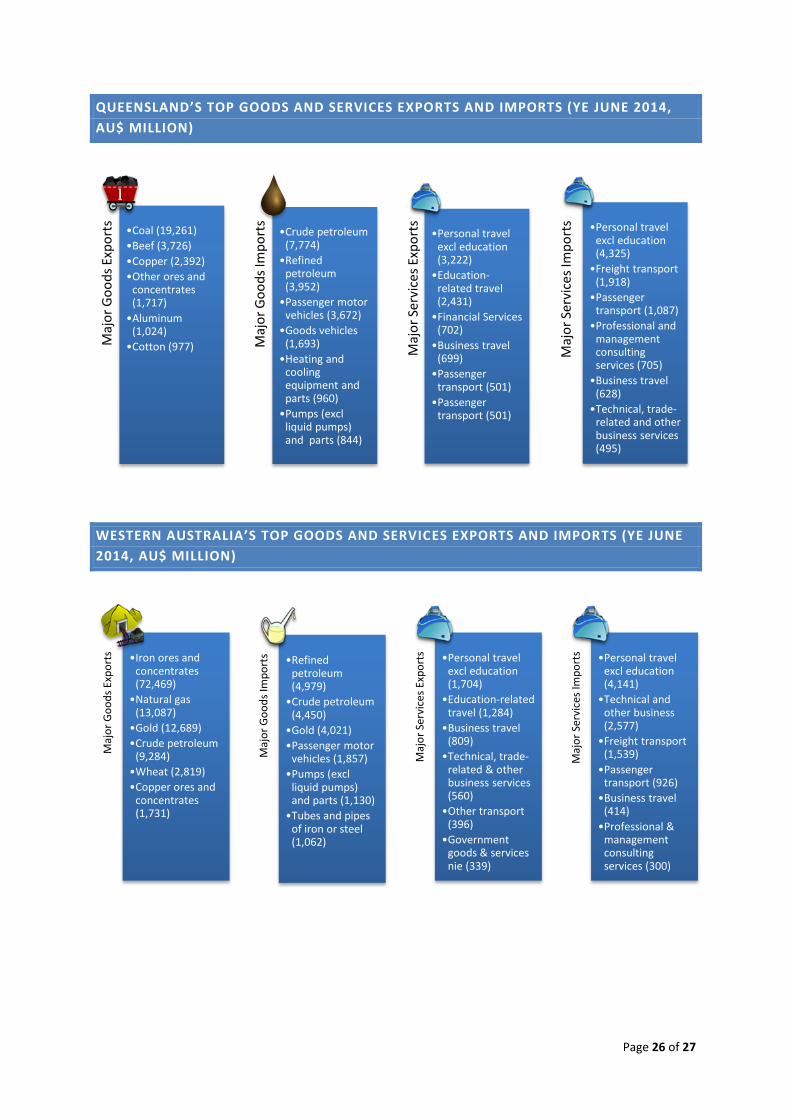
QUEENSLAND’S TOP GOODS AND SERVICES EXPORTS AND IMPORTS (YE JUNE 2014,
AU$ MILLION)
WESTERN AUSTRALIA’S TOP GOODS AND SERVICES EXPORTS AND IMPORTS (YE JUNE
2014, AU$ MILLION)
Maj
or
Go
od
s Ex
po
rts
•Coal (19,261)
•Beef (3,726)
•Copper (2,392)
•Other ores and concentrates (1,717)
•Aluminum (1,024)
•Cotton (977) Maj
or
Go
od
s Im
po
rts
•Crude petroleum (7,774)
•Refined petroleum (3,952)
•Passenger motor vehicles (3,672)
•Goods vehicles (1,693)
•Heating and cooling equipment and parts (960)
•Pumps (excl liquid pumps) and parts (844)
Maj
or
Serv
ice
s Ex
po
rts
•Personal travel excl education (3,222)
•Education-related travel (2,431)
•Financial Services (702)
•Business travel (699)
•Passenger transport (501)
•Passenger transport (501)
Maj
or
Serv
ice
s Im
po
rts •Personal travel
excl education (4,325)
•Freight transport (1,918)
•Passenger transport (1,087)
•Professional and management consulting services (705)
•Business travel (628)
•Technical, trade-related and other business services (495)
Maj
or
Go
od
s Ex
po
rts •Iron ores and
concentrates (72,469)
•Natural gas (13,087)
•Gold (12,689)
•Crude petroleum (9,284)
•Wheat (2,819)
•Copper ores and concentrates (1,731)
Maj
or
Go
od
s Im
po
rts •Refined
petroleum (4,979)
•Crude petroleum (4,450)
•Gold (4,021)
•Passenger motor vehicles (1,857)
•Pumps (excl liquid pumps) and parts (1,130)
•Tubes and pipes of iron or steel (1,062)
Maj
or
Serv
ices
Exp
ort
s •Personal travel excl education (1,704)
•Education-related travel (1,284)
•Business travel (809)
•Technical, trade-related & other business services (560)
•Other transport (396)
•Government goods & services nie (339)
Maj
or
Serv
ices
Imp
ort
s •Personal travel excl education (4,141)
•Technical and other business (2,577)
•Freight transport (1,539)
•Passenger transport (926)
•Business travel (414)
•Professional & management consulting services (300)
Page 27 of 27
USEFUL RESOURCES
Australia’s Top Goods and Services Exports by State – DFAT publication.
http://dfat.gov.au/about-us/publications/Pages/australia-s-trade-by-state-and-territory.aspx
Australian tourism/visitor arrivals and expenditure data
o Tourism Research Australia (for data at the country level)
o Tourism Victoria http://www.tourism.vic.gov.au/research.html
o Destination New South Wales http://www.destinationnsw.com.au/tourism/facts-and-figures
o Tourism and Events Queensland http://teq.queensland.com/en-AU/Research-and-
Insights/Source-Market-Research
o Tourism Western Australia http://www.tourism.wa.gov.au/Research-
Reports/Pages/Research_Reports.aspx
o South Australian Tourism Commission http://www.tourism.sa.gov.au/research-reports.aspx
o Tourism NT http://www.tourismnt.com.au/research.aspx
o Tourism Tasmania http://www.tourismtasmania.com.au/research
o Visit Canberra http://www.tourism.act.gov.au/research/latest-research
Australian Net Overseas Migration by State and Type of Visa
http://www.abs.gov.au/AUSSTATS/[email protected]/DetailsPage/3412.02013-14?OpenDocument


