NUTRITIONAL KNOWLEDGE OF MOTHERS AND NUTRITIONAL STATUS OF
THEIR CHILDREN 6-59 MONTHS UNDER MALEZI BORA PROGRAMME IN
KAWANGWARE SUB LOCATION, DAGORETTI, NAIROBI COUNTY
MARGARET BOCHABERI GICHANA
BSc. (Food, Nutrition and Dietetics)
A DISSERTATION SUBMITTED IN PARTIAL FULFILMENT OF THE
REQUIREMENTS FOR THE DEGREE OF MASTER OF SCIENCE IN APPLIED
HUMAN NUTRITION OF THE UNIVERSITY OF NAIROBI
DEPARTMENT OF FOOD SCIENCE, NUTRITION AND TECHNOLOGY
2013

i
DECLARATION
This dissertation is my original work and has not been presented for a degree in any other
University
Sign………………………………. Date……………………..
Margaret Bochaberi Gichana
This dissertation has been submitted for examination with our approval as university
supervisors
Sign………………………………. Date……………………………….
Professor Jasper K.Imungi
Department of Food Science, Nutrition and Technology, University of Nairobi
Signed………………………. Date……………………….
Dr Catherine N.Kunyanga
Department of Food Science, Nutrition and Technology, University of Nairobi

ii
DEDICATION
This dissertation is dedicated to my loving husband, Julius Gichana, my only daughter Joan
Mokeira, my sons Tom Frank and Steve Bosire who sacrificed to intercede for me when the
waters were stormy, to my husband especially for being understanding and supportive
financially, socially and emotionally. May the almighty grant them mercy and grace.

iii
ACKNOWLEDGEMENTS
I am grateful to my God for his abundant grace and love that has brought me this far. I wish
to acknowledge and thank all participants for their time and efforts, without whose
contribution this research would not have been possible.
I appreciate my supervisor Prof Jasper K.Imungi who despite his busy schedule, he always
had time to guide and correct me during the entire period of this study. May the almighty God
bless and give him daily strength. I am also deeply indebted to Dr Catherine N.Kunyanga for
her great inspiration and excellent support throughout the whole project – thank you. I also
owe special thanks to Prof. Wambui Kogi-Makau for her commitment in teaching an
introductory course to this study. My thanks also go to Ms Joan Waluvengo for her support
whenever I needed help in the library.
I would also like to thank my classmates in Msc Applied Human Nutrition class 2011/2012
for their encouragement and support. I sincerely appreciate Mr Francis Odhiambo and Mr
Joseph Mugo for having spared time to assist me in data analysis. I also acknowledge the
Field Assistants who participated in data collection and the Assistant-Chief for Kawangware
Sub-Location who tirelessly ensured that we were safe during the study period. God bless
you all.
iv
TABLE OF CONTENTS
DECLARATION....................................................................................................................... i
DEDICATION.......................................................................................................................... ii
ACKNOWLEDGEMENTS .................................................................................................. iii
TABLE OF CONTENTS ....................................................................................................... iv
LIST OF TABLES .................................................................................................................. ix
LIST OF FIGURES ................................................................................................................. x
ACRONYMS AND ABBREVIATIONS ............................................................................... xi
OPERATIONAL DEFINITIONS ........................................................................................ xii
ABSTRACT ........................................................................................................................... xiv
CHAPTER ONE: INTRODUCTION .................................................................................... 1
1.1 BACKGROUND .............................................................................................................. 1
1.2 PROBLEM STATEMENT ............................................................................................ 3
1.3 STUDY JUSTIFICATION ............................................................................................ 3
1.4 OBJECTIVE................................................................................................................... 4
1.5 HYPOTHESES .............................................................................................................. 4
CHAPTER TWO: LITERATURE REVIEW ....................................................................... 6
2.0 INTRODUCTION ............................................................................................................ 6
2.1 GROWTH MONITORING AND PROMOTION ........................................................... 6
2.1.1 Methods of Growth Monitoring ........................................................................... 7
2.1.2 Objectives of Growth Monitoring ........................................................................ 7
2.1.3 Importance of Growth Monitoring and Promotion .............................................. 7
2.2 IMMUNIZATION ...................................................................................................... 8
2.3 CHILD NUTRITION .................................................................................................. 8
v
2.4 NUTRIENT SUPPLEMENTATION FOR CHILDREN UNDER FIVE YEARS ..... 9
2.4.1 Methods of Assessing Vitamin A Deficiency .................................................... 11
2.4.2 Consequences of Vitamin A Deficiency in Children ......................................... 11
2.5 MALNUTRITION OF CHILDREN .............................................................................. 11
2.5.1 Prevalence of Malnutrition in Children ............................................................. 12
2.5.2 Causes of Child Malnutrition ............................................................................. 13
2.5.3 Consequences of Malnutrition in Children ........................................................ 15
2.6 METHODS OF ASSESSING NUTRITIONAL STATUS OF CHILDREN ................ 16
2.7 MATERNAL NUTRITIONAL KNOWLEDGE ...................................................... 16
2.7.1 Methods of Evaluation of Mothers Knowledge ................................................. 17
2.8 METHODS OF EVALUATING NUTRITION PROGRAMS ...................................... 18
CHAPTER THREE: STUDY DESIGN AND METHODOLOGY ................................... 19
3.1 STUDY DESIGN ...................................................................................................... 19
3.1.1 Study Site ........................................................................................................... 19
3.1.2 Population in the Study Area ............................................................................. 19
3.1.3 Administrative and Political Structure ............................................................... 19
3.1.4 Services Available ............................................................................................. 20
3.1.5 Economic Activities .............................................................................................. 20
3.2 METHODOLOGYgyyyuyha .................................................................................... 21
3.2.1 Study Sample ........................................................................................................... 21
3.2.2 Sample Size Determination................................................................................ 21
3.2.3 Sampling Procedure ........................................................................................... 22
vi
3.2.4 Inclusion Criteria ............................................................................................... 22
3.2.5 Exclusion Criteria .............................................................................................. 23
3.3 RESEARCH INSTRUMENTS AND TOOLS ......................................................... 23
3.3.1 Questionnaire: Structured and Pre-tested ................................................................ 23
3.4 RECRUITMENT AND TRAINING OF FIELD ASSISTANTS .................................. 23
3.4.1 Ethical and Human Rights Consideration .......................................................... 24
3.5 DATA COLLECTION .............................................................................................. 24
3.5.1 Demographic Data ................................................................................................... 24
3.5.2 Qualitative Data: Nutritional Knowledge .......................................................... 25
3.5.3 Anthropometric Measurements .......................................................................... 25
3.6 DATA MANAGEMENT AND ANALYSIS ........................................................... 26
3.6.1 Data Quality Control .......................................................................................... 26
3.6.2 Data Management .............................................................................................. 27
3.6.3 Data Analysis ..................................................................................................... 27
CHAPTER FOUR: RESULTS ............................................................................................. 28
4.0 INTRODUCTION .......................................................................................................... 28
4.1 SOCIO DEMOGRAPHIC CHARACTERISTICS OF THE HOUSEHOLDS ............. 28
4.2 SOCIO- DEMOGRAPHIC CHARACTERISTICS OF THE MOTHERS .................... 29
4.2.1 Distribution of Mothers by Marital Status ......................................................... 29
4.2.2 The Age Composition of the Study Population ....................................................... 29
4.2.3 Mother’s Occupation ............................................................................................... 30
4.2.4 Father’s Occupation ................................................................................................. 30
vii
4.2.5 Education of Mothers and Fathers ........................................................................... 30
4.3 SOCIO-ECONOMIC CHARACTERISTICS OF THE MOTHERS ............................. 31
4.3.1 Household’s Main Sources of Livelihood ............................................................... 31
4.3.2 Household’s Income Distribution ............................................................................ 32
4.4 MATERNAL NUTRITIONAL KNOWLEDGE ........................................................... 33
4.4.1 Knowledge of Malezi Bora by Mothers .................................................................. 33
4.4.2 Sources of Knowledge on Malezi bora.................................................................... 33
4.4.3 Knowledge of Malezi Bora Activities by Mothers .................................................. 33
4.4.4 Knowledge of Mothers on Sources of Vitamin A and Protein Foods ..................... 34
4.4.5 Distribution of Nutritional knowledge score by Mothers ........................................ 34
4.5 NUTRITIONAL STATUS OF THE CHILDREN......................................................... 35
4.5.1 Stunting (height-for-age) of Children ...................................................................... 35
4.5.2 Underweight (weight-for-age) of children .............................................................. 36
4.5.3 Wasting (weight-for-height) of Children ................................................................. 37
4.5.4 Mid-upper Arm Circumference (MUAC) of the Children ...................................... 37
4.5.5 Association between Mothers’ Knowledge and Wasting of children ..................... 38
4.6 CHILD MORBIDITY .................................................................................................... 39
4.1.1 Healthcare Sought During Illness ...................................................................... 40
4.1.1 Child Immunization Status, Vitamin A Supplementation and Deworming ...... 41
CHAPTER FIVE: DISCUSSION ......................................................................................... 42
5.1 SOCIO-DEMOGRAPHIC AND SOCIO-ECONOMIC CHARACTERISTICS .......... 42
5.2 MATERNAL NUTRITIONAL KNOWLEDGE ...................................................... 44
viii
5.3 NUTRITIONAL STATUS OF THE CHILDREN.................................................... 46
5.3 IMMUNIZATION OF THE CHILDREN .................................................................... 48
5.4 CHILD MORBIDITY .................................................................................................... 48
CHAPTER SIX: CONCLUSIONS AND RECOMMENDATIONS ................................. 50
6.1 CONCLUSIONS ....................................................................................................... 50
6.2 RECOMMENDATIONS .......................................................................................... 51
REFERENCES ....................................................................................................................... 52
Appendix 1: Study introduction and consent seeking ........................................................ 57
Appendix 2: Questionnaire ................................................................................................... 58
Appendix 3: Focused group discussion Guide .................................................................... 65
Appendix 4: Training curriculum ........................................................................................ 66
Appendix 5: Protocol for taking the weight and length/height of the children ............... 67
ix
LIST OF TABLES
Table 1: Vitamin A Supplementation coverage in Kenya for 10 years up to 2010 ................. 10
Table 2: Distribution of the sample population by size of household ..................................... 28
Table 3: Distribution of mothers by marital status .................................................................. 29
Table 4: Distribution of the study children by household’s main source of livelihood ........... 32
Table 5: Distribution of total household income by use .......................................................... 32
Table 6: Knowledge of Malezi Bora activities by mothers ..................................................... 33
Table 7: Knowledge of sources of vitamin A and protein foods by mothers .......................... 34
Table 8: Distribution of Nutritional knowledge score by mothers .......................................... 35
Table 9: Distribution of children by stunting ........................................................................... 36
Table 10: Distribution of children underweight by sex ........................................................... 36
Table 11: Distribution of wasting in the children by sex ......................................................... 37
Table 12: Distribution of MUAC in the study children by sex................................................ 38
Table 13: Distribution of wasting in the children by sex and mothers’ knowledge of malezi
bora .......................................................................................................................................... 39
Table 14: Distribution of the children by type of healthcare sought during illness ................. 40
x
LIST OF FIGURES
Figure 1: Conceptual framework of the cause of malnutrition ................................................ 15
Figure 2: Diagrammatic presentation of the sampling procedure ............................................ 22
Figure 3: Distribution of mothers’ by occupation.................................................................... 30
Figure 4: Distribution of the mothers and fathers by education .............................................. 31
Figure 5: Distribution of the study children by the illnesses ................................................... 40
Figure 6: Immunization status in the study children ................................................................ 41
xi
ACRONYMS AND ABBREVIATIONS
ANC: Antenatal Care
CHW: Community Health Workers
HC: Health Centre
HCC: Health Centre Catchment
HDDS: Household Dietary Diversity Score
HFA: Height for Age (HAZ)
MoH: Ministry of Health
MUAC: Mid Upper Arm Circumference
NCHS: National Center for Health Statistics
SD: Standard Deviation
UNICEF: United Nations Children’s Fund
VAS: Vitamin A Supplementation
WFA: Weight for Age (WAZ)
KAP: Knowledge, Attitude and Practice
CBO: Community Based Organizations
DNO: District Nutrition Officer
PMTCT: Prevention of Mother to Child Transmission
xii
OPERATIONAL DEFINITIONS
Anthropometry: The study and technique of taking body measurements, especially for use
on a comparison or classification basis. It refers to the measurement of the human individual
for the purposes of understanding human physical variation.
Childcare Practices: For this study refers to the practices of caregivers in the household
which translate to food and nutritional security and health care resources into a child's growth
and development.
Complementary food: Foods given to a child in addition to breast milk usually introduced
between 4-6 months of age
EPI-Info: A series of micro computer packages used to assess nutritional status such as
height for age, weight for height and weight for age.
Household: Refers to one person who lives alone or a group of persons, related or unrelated
who share food or make common provisions for food and other essentials for living.
Knowledge: Refers to verbalized or demonstrated ability to reproduce from memory facts
and principles.
Nutrition Status: Refers to whether or not the child is underweight, stunted or wasted.
Underweight: Refers to having low weight for age mainly due to chronic under nutrition or
acute malnutrition (WAZ)
Wasting: Refers to having low weight for height according to WHO standard with a <-2 SD
mainly due to acute malnutrition (WHZ)
Z score or standard deviation: The deviation of anthropometric value(s) for an individual
child from the median value of the reference population. World Health Organisation (WHO)
divided by the standard deviation of the reference population.
xiii
Dependency ratio: The sum of all persons under 15 years or over 64 years of age, divided
by the number of persons age 15-64, multiplied by 100
Nutrition knowledge: is defined as the understanding of different types of food and how
food nourishes the body and influences health.
xiv
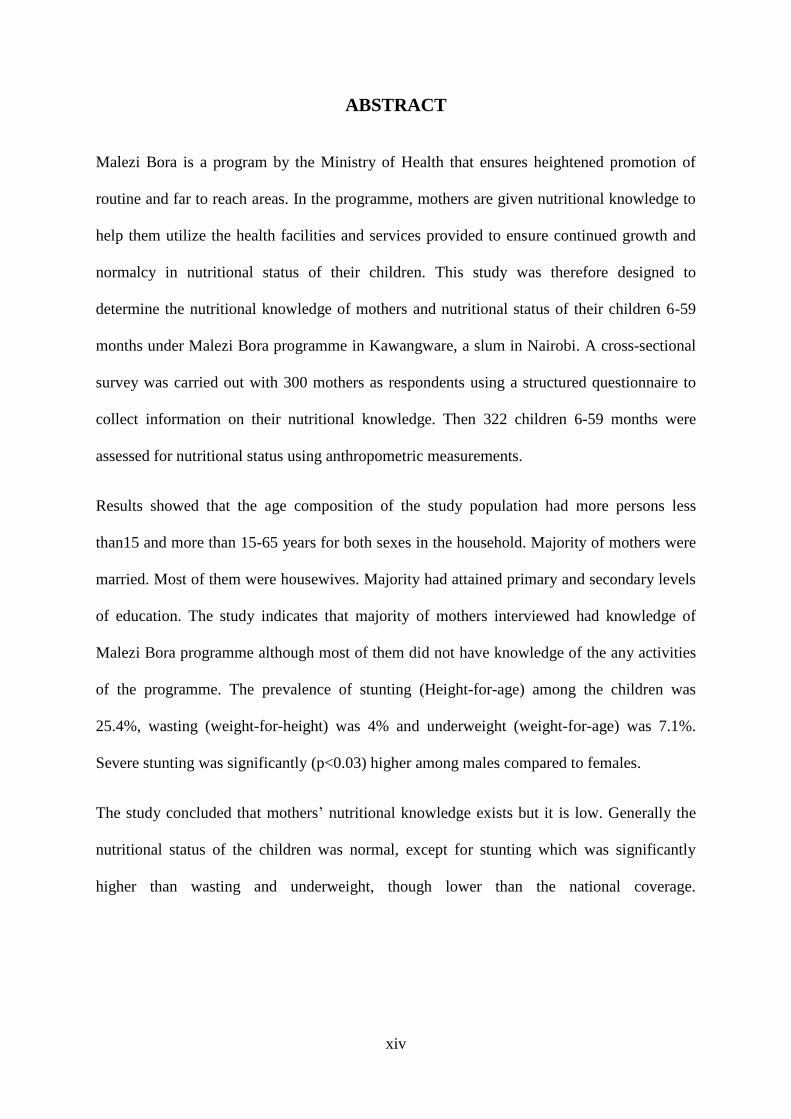
ABSTRACT
Malezi Bora is a program by the Ministry of Health that ensures heightened promotion of
routine and far to reach areas. In the programme, mothers are given nutritional knowledge to
help them utilize the health facilities and services provided to ensure continued growth and
normalcy in nutritional status of their children. This study was therefore designed to
determine the nutritional knowledge of mothers and nutritional status of their children 6-59
months under Malezi Bora programme in Kawangware, a slum in Nairobi. A cross-sectional
survey was carried out with 300 mothers as respondents using a structured questionnaire to
collect information on their nutritional knowledge. Then 322 children 6-59 months were
assessed for nutritional status using anthropometric measurements.
Results showed that the age composition of the study population had more persons less
than15 and more than 15-65 years for both sexes in the household. Majority of mothers were
married. Most of them were housewives. Majority had attained primary and secondary levels
of education. The study indicates that majority of mothers interviewed had knowledge of
Malezi Bora programme although most of them did not have knowledge of the any activities
of the programme. The prevalence of stunting (Height-for-age) among the children was
25.4%, wasting (weight-for-height) was 4% and underweight (weight-for-age) was 7.1%.
Severe stunting was significantly (p<0.03) higher among males compared to females.
The study concluded that mothers’ nutritional knowledge exists but it is low. Generally the
nutritional status of the children was normal, except for stunting which was significantly
higher than wasting and underweight, though lower than the national coverage.
1
CHAPTER ONE: INTRODUCTION
1.1 BACKGROUND
Malezi Bora is (Swahili word for Good Nurturing) a program by the Ministry of Health that
ensures heightened promotion of routine services and far to reach areas. The program
addresses different themes each year. These include growth monitoring, immunization,
vitamin A supplementation, antenatal care, prevention of mother to child transmission
(PMTCT) of HIV/AIDS, reproductive health and anything which concerns a mother and
child. Malezi Bora was adopted in Kenya by the Ministry of Public Health and Sanitation in
partnership with UNICEF in 2007 (Kariuki, 2010). The main objective of the programme was
to intervene on the declining child survival in Kenya through countrywide mobilization for
increased utilization of routine child survival services. The programme advocates that
children under five years old are taken to health centres and hospitals for routine services.
Mothers are given nutrition education and pregnant women immunized against tetanus and all
these services are provided free. UNICEF carries out the monitoring of implementation of
Malezi Bora and helps in providing feedback to the ministry. UNICEF supports social
mobilization for the Malezi Bora Weeks and works closely with the Ministry of Public Health
and Sanitation to ensure the required drugs and other equipment are available at all the health
facilities (Kariuki, 2010)).
The Malezi Bora programme weeks aims to sensitize and educate the public on free health
and nutrition services available to infants, expectant and breast feeding mothers in all
government health facilities countrywide. It aims to increase the utilization and improve
delivery of routine evidence based health and nutrition services, thus propelling Kenya
towards achieving the Millennium Development Goals (Mburu, 2008).
2
Malezi Bora program, is a shift from past programmes where health interventions such as
immunization were delivered mainly through outreach campaigns. Instead, mothers are
being encouraged to routinely take their children to their local health facilities (Mwabe,
2012). In 2007 Ministry of Health (MoH) ceased using National Immunization Days for
delivering child survival (CS) interventions and instead integrated them within routine
services using fixed health facilities. Malezi Bora activities include an intensive campaign
twice a year; two weeks in June and November to encourage caregivers take children to fixed
health sites and reach out to the community (Kabaka, et al., 2007)
The other partners of Malezi Bora include Kenya’s Religious and Faith groups, who
represent the Inter-Religious Council of Kenya (IRCK), the Religious Groups use their
networks to mobilize Kenyans of all faiths to turn up for services at the health facilities, both
during the Malezi Bora weeks and other relevant functions during the year. The groups also
participate in the monitoring of Malezi Bora implementation strategy in different parts of the
country (Mburu, 2008). In the years prior to Malezi Bora initiation, Kenya had achieved high
Vitamin A Supplementation coverage of up to 80%, though in 2007 a drop was noticed due
to transition from using National Immunization Days to fixed health facilities. Dagoretti
district in Nairobi registered coverage of 26.7% of 6-11 months during the year (Kabaka et
al., 2008).
Dagoretti District Health and Management Team (DHMT) in partnership with stakeholders
like Aphia plus African Medical Research Foundation, Uchumi, World Vision, Concern
Worldwide, Provincial Medical Officer (PMO), Health Workers and the Community do
participate in the implementation of the program. Malezi bora activities in the district are an
elaboration of malezi bora services, PMTCT, reproductive health, vitamin A
supplementation, maternal and neonatal care, postnatal care, breastfeeding, paediatric Hiv
3
care, free medical camps to too hard to reach areas, continuous medical education (CME) to
health workers on maternal nutrition, active case finding by the CHWs in the community and
health talks at the health facilities. The source of the information was a report not yet
published.
A study on Knowledge, Attitude and Practice (KAP) for Infant, Young, Child Feeding
(IYCF) in the Urban Slums of Nairobi and Kisumu, Maternal Nutrition Knowledge which is
the key focus of malezi bora was low with most mothers (<60%) unable to name any vitamin
A rich natural or fortified food sources. Dietary diversity of children between 6 and 23
months was limited and consumption of animal protein foods and fruits were particularly low
(Worldwide, 2011 ).
1.2 PROBLEM STATEMENT
Maternal Nutrition Knowledge is a key focus of Malezi Bora nutrition and health programme
although previous studies show that this information was limited. The dietary diversity was
low among children particularly with regard to low intake of animal protein source foods
which are essential for their growth, development and maintenance. Most mothers were
unable to name any Vitamin A rich natural or fortified food sources essential for disease
prevention and strengthening of immunity of children. The low nutritional knowledge of
mothers is capable of leading to poor nutritional status of their children, translating into low
achievement of the programme objectives, that of curbing declining child survival and poor
nutritional status of the children.
1.3 STUDY JUSTIFICATION
To contribute to the nutrition knowledge of mothers through enhancing nutrition education
under Malezi Bora programme by sensitization and mobilization. The purpose of the study
4
was to assess nutritional knowledge and nutritional status of children 6-59 months under the
programme. The results of the study would be useful in programme planning strategies,
assessment and evaluation to achieve their objectives and to enhance mothers’ nutrition
knowledge, improve perception on the importance of immunization and antenatal services.
Mothers would better utilise the health facilities that offer routine child survival services,
leading to good nutrition of the children, reduce child morbidity and mortality. Vitamin A
Supplementation is a very essential child survival service for child growth and protection
from frequent infections if received after every six months up to five years of age.
1.4 OBJECTIVE
1.4.1 Overall objective
To assess maternal nutritional knowledge and nutritional status of their children 6-59 months
under Malezi Bora programme in Kawangware Sub-Location, Dagoretti District, Nairobi
County.
1.4.2 Specific objective
1) To establish the socio-demographic and socio-economic characteristics of the
households.
2) To determine the nutritional knowledge of mothers.
3) To determine the nutritional status of the children 6-59 months.
4) To determine the morbidity of children 6-59 months in Kawangware sub-location
1.5 HYPOTHESES
1. The mothers possess significant nutrition knowledge to influence positively the
nutritional status of children.
5
2. The nutritional status of the children 6-59 months is normal.
6
CHAPTER TWO: LITERATURE REVIEW
2.0 INTRODUCTION
This chapter reviews existing information on Malezi Bora and the improvement of child
nutrition through growth monitoring and promotion, child immunization, child nutrition,
Vitamin A Supplementation for children under five years, causes and prevalence of
malnutrition, methods of assessing nutritional status of children, maternal nutrition
knowledge and methods of monitoring and evaluating nutrition programs.
2.1 GROWTH MONITORING AND PROMOTION
Growth Monitoring (GM) is the process of following the growth rate of a child in comparison
to a standard by periodic, frequent anthropometric measurements in order to assess growth
adequacy and identify faltering early. Growth Monitoring and Promotion (GMP) is a
prevention activity comprised of GM linked with promotion (usually counselling) that
increases awareness about child growth; improves caring practices; increases demand for
other services, as needed; and serves as the core activity in an integrated child health and
nutrition program, when appropriate (Griffiths & Rosso, 2007). Growth Monitoring,
particularly of infants and young children, is widely regarded as an essential element of
primary health care and in a recent survey 154 of 178 ministries of health reported that they
monitor child growth (Ashworth, et al., 2008). Most growth monitoring programmes use
weight charts to provide a graphic representation of a child’s weight-for-age.An
undernourished or sick child will have a slower rate of weight gain than a well-
nourished,healthy child (Ashworth, et al., 2008).
7
2.1.1 Methods of Growth Monitoring
The most widely promoted method of growth monitoring is weighing and charting growth,
since weight gain is believed to be the most sensitive indicator of growth and is universally
applicable, this method is favoured by UNICEF (Lofti, 1988). Among other techniques,
measuring Mid Upper Arm Circumference (MUAC) is claimed to be the easiest and cheapest
alternative to weighing and has been recommended for use at the home and village levels
whenever regular and frequent weighing is not possible (Lofti, 1988).
2.1.2 Objectives of Growth Monitoring
Growth monitoring provides a diagnostic tool for health and nutrition surveillance of
individual children and to instigate effective action in response to growth faltering
(Ashworth, et al., 2008). It teaches mothers, families and health workers how diet and illness
can affect child growth and thereby stimulate individual initiative and improved practices. It
also provides regular contact with primary health-care services, and so facilitates their
utilization (Ashworth, et al., 2008). Growth monitoring can serve as an entry point for
community mobilization and social action, especially when growth monitoring data are
aggregated and used for community-level assessment and analysis of child malnutrition,
targeting supplementary feeding and reporting prevalence of underweight (Ashworth, et al.,
2008).
2.1.3 Importance of Growth Monitoring and Promotion
The main anticipated benefits in developing countries are: reduction in under nutrition,
morbidity and mortality among young children. There is early intervention when growth
faltering is more easily remedied (Ashworth, et al., 2008). The families are motivated and
enabled to take effective action, nutrition and health counselling tailored to individual needs.
There is opportunity to assess remedial actions, greater self reliance and self-esteem, greater
8
utilization of preventive health-care services, fewer referrals for curative care (Ashworth, et
al., 2008).
2.2 IMMUNIZATION
Immunization is key to achieving the Millennium Development Goals (MDGs), especially
the goal to reduce deaths among children under five years old (MDG 4). Reducing these
deaths means providing more children, not only vaccines, but also with life-saving drugs, ant
malarial bed nets, schooling, sanitary living conditions, clean water, and other essentials that
are mostly taken for granted in the better-off parts of the world. It also means addressing the
global imbalance in spending on health, where developing countries-with 85% of the world’s
population-account for only 12% of global spending on health (WHO, 2009).
Over the past decade, immunization programmes have added new and underused vaccines to
the original six-diphtheria, tetanus, pertussis, measles, polio and tuberculosis-given to young
children. They include vaccines against hepatitis B, Haemophilus inflenzae type b (Hib)
disease, mumps, pneumococcal disease, rotavirus and rubella (WHO, 2009). Immunization
averts an estimated 2.5 million child deaths a year, but despite the successes, millions of
children in developing countries-almost 20% of the children born every year-do not get the
complete immunizations scheduled for their first year of life (WHO, 2009).
2.3 CHILD NUTRITION
The locus of poverty and under nutrition among children appears to be gradually shifting
from rural to urban areas, as the number of the poor and undernourished increases more
quickly in urban than in rural areas. In sub-Saharan Africa, a 2006 study showed that
disparities in child nutrition between rich and poor urban communities were greater than
those between urban and rural areas (Fotso, 2007).
9
Under nutrition is a concetrated problem of low national priority. 80% of the world’s
undernourished children are living in just 20 countries (Pradmore and Hill, 2009). Better
nutrition translates into a stronger and healthier population with greater opportunities of
breaking the cycle of poverty and achieving better quality of life (Azzari, et al., 2011).
2.4 NUTRIENT SUPPLEMENTATION FOR CHILDREN UNDER FIVE
YEARS
Vitamin A is an essential nutrient for the proper functioning of the immune system and the
healthy growth and development of children. Insufficient intake of vitamin A in children can
dramatically increase the risk of death, blindness, and illness, especially from measles and
diarrhoea (UNICEF, 2012). Nutrient supplementation for children under five years pertains
mainly to administration of vitamin A because the nutrient has been ascertained to be of
public health concern in most underdeveloped countries of the world. Vitamin A
supplementation refers to the percentage of children ages 6-59 months old who received at
least one high-dose vitamin A capsule in the previous six months (UNICEF, 2012).
Vitamin A deficiency is a major contributor to the mortality of children under five.
Improving the vitamin A status of deficient children through supplementation enhances their
resistance to disease and can reduce mortality from all causes by approximately 23 per cent.
Guaranteeing high supplementation coverage is therefore critical, not only to eliminating
vitamin A deficiency as a public-health problem, but also as a central element of the child
survival agenda (UNICEF), 2007).
The delivery of vitamin A in Kenya has been integrated into routine health services, for
example through biannual 'special days" where supplementation is combined with other child
survival interventions such as de-worming or nutrition education. Vitamin A supplements are
also commonly distributed as part of the Expanded Program on Immunization, particularly at
10
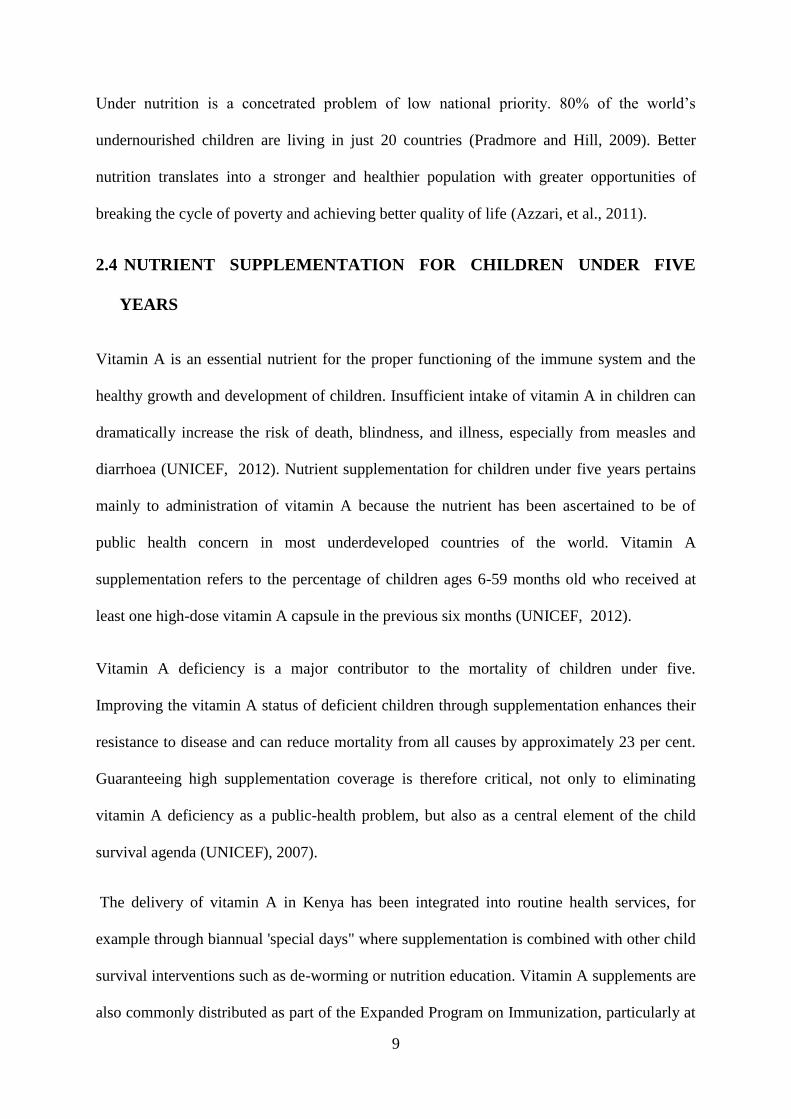
nine months with the measles vaccinations (UNICEF, 2012). Vitamin A supplementation
coverage rate (% of children ages 6-59 months) in Kenya was 62% in 2010. The highest
figure of coverage over the past 11 years has been 91% in 2002, while the lowest has been
22% in 2007 (UNICEF, 2012)
Table 1: Vitamin A Supplementation coverage in Kenya for 10 years up to 2010
Year Percentage
1999 80.00
2001 90.00
2002 91.00
2003 33.00
2004 63.00
2005 69.00
2007 22.00
2008 27.00
2009 51.00
2010 62.00
Source: United Nations Children's Fund, State of the World's Children (2010)
In the years prior to Malezi Bora implementation, Kenya had achieved high VAS coverage of
up to 80%. VAS coverage dropped for all age groups, the drop being most significant in the
12-59 month age range. More children received VAS during the period when
communications about the availability of health services were intensified but the overall
results show that migrating campaign style child survival interventions and integrating them
with routine health services using fixed posts has led to loss of coverage (Kabaka et al.,
2008). According to Kenya Demographic and Health Survey 2008-2009 vitamin A coverage
reduced to 62%.
11
2.4.1 Methods of Assessing Vitamin A Deficiency
Xerophthalmia classification was traditionally used to identify populations with vitamin A
deficiency. Currently; night blindness and dark adaptometry have been proposed as
population assessment methods. Serum and breast milk retinol concentrations are used to
identify vitamin A deficiency risk. Retinol binding protein (RBP) and serum retinol are used
to determine if serum retinol concentrations are depressed by infection. Other methods are
relative dose response and modified relative dose response tests (Tanumihardjo, 2004).
2.4.2 Consequences of Vitamin A Deficiency in Children
Vitamin A deficiency (VAD) is a major public health nutrition problem in the developing
world (Keith and West, 2002). It especially affects young children, among whom deficiency
can cause exophthalmia and lead to blindness, limit growth, weaken innate and acquired host
defences, exacerbate infection and increase the risk of death (Keith and West, 2002). It is the
leading cause of preventable blindness in children and increases the risk of disease and death
from severe infections. It is also becoming clear that VAD can extend through school age and
adolescent years into adulthood (Keith and West, 2002).
2.5 MALNUTRITION OF CHILDREN
Child malnutrition can manifest itself in several ways. It is commonly assessed through
measurement of a child’s weight and height, as well as through biochemical and clinical
assessment (UNICEF, 2013). Indicators based on weight,heght and age are compared to
internationl standards and are most commonly used to assess the nutritional status of a
population (UNICEF, 2013). Child malnutrition is also the most pressing problem of the
world, damaging both children and the nations. Significant proportion of deaths of young
12
children Worldwide is due to malnutrition and efforts to reduce malnutrition should be a
policy priority (Wijesinghe, 2010).
Malnutrition prevails everywhere around the world and both developed and developing
countries are suffering from malnourishment (Khan et al., 2010). Malnutrition is a public
health problem and is associated with among other factors literacy of mother, household
wealth index and morbidities (Farid-Ul- Hasnain, 2010). Therefore, improving socio-
economic condition along with literacy of mothers and preventing infections through
personal hygiene might help in improving the nutritional status of children (Farid-Ul-
Hasnain, 2010). Malnutrition is characterized by under nutrition a major concern in
developing countries. The aetiology of malnutrition is complex and multi-factorial; it is
usually a consequence of inadequate dietary intake (Farid-Ul- Hasnain, 2010). Malnutrition
is insufficient, excessive or imbalance consumption of dietary energy and nutrients. It
manifests in different forms, such as under nutrition, over nutrition and micronutrients
malnutrition. Malnutrition in early childhood is associated with functional impairment in
adult life as malnourished children are physically and intellectually less productive when they
become adults (Babatunde, et al., 2011). Malnutrition in Sub-Saharan Africa contributes to
high rates of childhood morbidity and mortality. However, little information on the
nutritional status of children is available from informal settlements (Olack, et al., 2011).
Currently,195 million under-five children are affected by malnutrition 90% of them live in
sub-Saharan Africa and South Asia.At least 20 million children suffer from severe acute
malnutrition (SAM),and another 175 million are undernourished (Olack, et al., 2011).
2.5.1 Prevalence of Malnutrition in Children
The global prevalence in children under the age of 5 has declined 36 per cent over the past
two decades-from an estimated 40 per cent in 1990 to 26 per cent in 2011 (UNICEF, 2013).
13
Prevalence of malnutrition among under-five children is very high in many developing
countries of the World (Babatunde, et al., 2011). In developing countries, approximately 183
million children are underweight-for-age, 67 million are underweight-for-height (wasted),
and 226 million are low height-for-age (stunted). An estimated 230 million under-five
children are believed to be chronically malnourished in developing countries. In Sub-Saharan
Africa, 41% of under-five children are malnourished and deaths from malnutrition are
increasing on daily basis in the region (Foluke et al., 2011). The 2008 Kenya Demographic
and Health Survey showed that 35.3% of under-five children were stunted nationwide, 6.7%
were wasted, and 16.3% were underweight (KNBS, 2010).
Levels and trends in child malnutrition from 1990-2011 show that the global prevalence of
stunting has decreased 36% from an estimated 40% in1990 to 26% in 2011. The global
prevalence of underweight has declined 37% from 25% in 1990 to 16 (UNICEF, 2012).
A study carried out in Mathare one of the larger slums in Nairobi with an estimate
population of 423,000 people, realised a severe acute malnutrition (SAM) prevalence of
0.2% translating into a caseload of 169 cases requiring treatment at the one government
health centre serving the area (Schofield, 2009). Chronic malnutrition as measured by
stunting rates was a significant problem in the slums representing a loss of both physical and
mental potential for affected children. Compared to Nairobi Province as a whole (18.7%
stunting), children in the slums sampled (32.7% stunting) were two times more likely to be
stunted indicating a high level of disparity in nutritional outcomes across Nairobi Province
(Schofield, 2009).
2.5.2 Causes of Child Malnutrition
The UNICEF conceptual framework defines malnutrition and captures the malt factorial
causality of under nutrition. Nutritional status is influenced by three broad factors: food,
14
health and care. Optimal nutritional status results when children have access to affordable,
diverse, nutrient-rich food; appropriate maternal and child-care practices; adequate health
services; and a healthy environment including safe water, sanitation and good hygiene
practices (UNICEF, 2013). These factors directly influence nutrient intake and the presence
of disease. The interaction between under nutrition and infection creates a potentially lethal
cycle of worsening illness and deteriorating nutritional status (UNICEF, 2013).
Food, health and care are affected by social,economic and political factors. The combination
and relative importance of these factors differ from country to country. Understanding the
immediate and underlying causes of under nutrition in a given context is critical to delivering
appropriate,effective and sustainable solutions and adequately meeting the needs of the most
vulnerable people (UNICEF, 2013).
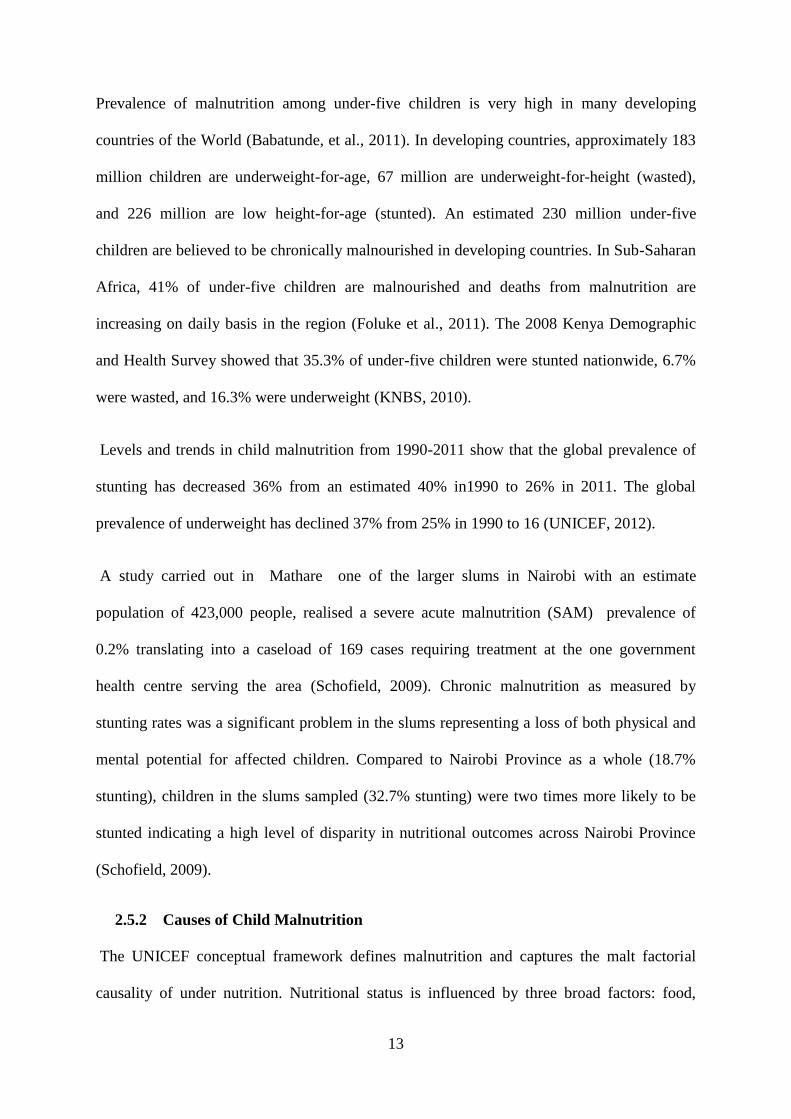
The global conceptual framework of the causes of malnutrition presents a useful generalized
understanding of how malnutrition and/or child death are the outcomes of a multispectral
development problem that can be most effectively analyzed in terms of immediate,
underlying and basic causes (Figure 1). This framework has become one of the most familiar
images within the international nutrition community over the past decade and has helped
foster improved understandings and dialogue about the nature and causes of malnutrition.
The immediate causes of malnutrition and child death are the mutually reinforcing conditions
of inadequate dietary intake and infectious disease; the underlying causes are household food
insecurity, inadequate maternal and child care, and inadequate health services and health
environment; and the basic causes include formal and non-formal institutions, Political,
economic, and ideological structures and systems—representing the perennial political,
economic, and institutional conflicts that public nutrition programs must work within
(Benson, 2005)
15
Source: UNICEF, 1991
Figure 1: Conceptual Framework of the Cause of Malnutrition
2.5.3 Consequences of Malnutrition in Children
Child malnutrition impacts cognitive function and contributes to poverty through impending
individual’s ability to lead productive lives. In addition, it is estimated that more than one-
third of under-five deaths are attributable to under nutrition (UNICEF, 2012).
Undernutrition can cause various diseases such as blindness due to vitamin A deficiency and
neural tube defects due to folic acid deficiency (UNICEF, 2013).
Malnourished children have a delayed motor development and lower cognitive function and
school performance. In adulthood, individuals who were malnourished as children have
impaired work capacity and worse reproductive performance. Malnutrition can have negative
effects not only on those afflicted but also on their offspring (Schroeder, 2008).
16
2.6 METHODS OF ASSESSING NUTRITIONAL STATUS OF CHILDREN
The methods of assessing nutritional status of children are; anthropometric methods,
biochemical tests, clinical signs and symptoms and dietary assessment methods used either
alone or more effectively in combination. Increasingly, nutritional assessment systems are
now applied to define multiple lives of nutrient status and not just the level associated with a
nutrient deficiency (Gibson, 2005). Thus, only anthropometric and dietary methods were used
in this study because they yield satisfactory results within due ceiling of the available
resources.
Anthropometry is the most useful tool for assessing the nutritional status of children. There
are many anthropometric indicators in use, such as mid upper arm circumference (MUAC),
weight for age, weight for height and body mass index. Most of these indicators need to be
used along with specific reference tables, e.g. National Center for Health Statistics (NCHS)
tables, for interpreting data (Hasan, et al., 2011). Anthropometry measurements are widely
used in the assessment of nutritional status, at both the individual and population levels. One
of the main advantages is that anthropometric measurements may be related to past exposure,
to present procession to future events (Gibson, 2005). Anthropometry measurements are of
two types. One group of measurements assesses body size; the other group determines body
composition (Gibson, 2005).
2.7 MATERNAL NUTRITIONAL KNOWLEDGE
Mothers are the foremost providers of primary care for children. Their understanding of
basic nutrition and health measures strongly influence the care they provide (Appoh, 2005).
Household socio-economic characteristics also determine to a large extent the nutritional
status of children and a positive relationship between socio-economic status and the ability of
17
mothers to provide adequate food and primary care has been observed (Appoh, 2005. The
aspects of nutrition knowledge include; age for introducing solid foods into a child’s diet and
the type of solid foods to introduce, frequency of child feeding, diet during diarrhoea and the
mother’s perceptions of her own child’s nutritional status. Mothers’ practical nutrition
knowledge is important for child outcome (Appoh, 2005).
Maternal nutrition knowledge substitutes for schooling, particularly at lower levels of income
and schooling (Block, 2007). Promoting maternal nutrition knowledge may represent an
important avenue for improving diet in children from socio-economically disadvantaged
neighbourhoods (Williams, et al., 2012)
2.7.1 Methods of Evaluation of Mothers Knowledge
The evaluation of mothers knowledge can be based on Bloom’s taxonony of the learning
process (Martnez, et al., 1996). According to Bloom,learning follows a sequential process
from theory to practice. Knowledge is said to occur when an individual is able to reproduce a
specific piece of informatiom. Next comes understanding,which is divided into three levels:
translation,in which an individual will be able to rephrase the information acquired;
interpretation,meaning that a certain mental process takes place in such a way that a given
piece of knowledge receives treatment that makes it appear in a new to the individual; and
extrapolation,which involves prediction of a given happening, based on undersanding the
information that the individual already has (Martnez, et al., 1996). Another method of
evaluation in community participation through identifying determinants of
Knowledge,Attitude and Practices of the relevant topic (Hejazi, et al., 2010).
18
2.8 METHODS OF EVALUATING NUTRITION PROGRAMS
Monitoring and evaluation can be divided into three parts: monitoring (a process
management tool), evaluation (to measure programme performance and impact) and
participatory monitoring (community-based) (Ismail, et al., 2005). Monitoring is the periodic
and routine collection of information throughout th life of the programme to determine
whether programme delivery is proceeding smoothly. It is first and foremost a management
tool for programme staff,but also provides essential information to understand and explain
the results of programme evaluation (Ismail, et al., 2005). Evaluation attempts to determine
and document,as systematically and as objectively as possible,the relevance,effectiveness and
impact of a programme in the light of its objectives (Ismail, et al., 2005). Participatory
monitoring is a system where the communities monitor their own progress towards achieving
their own specific developmental goals. For this, it is recommended that community groups
be encouraged to establish a simple system of participatory monitoring that relates closely to
their own identified priorities and activities (Ismail, et al., 2005).
19
CHAPTER THREE: STUDY DESIGN AND METHODOLOGY
3.1 STUDY DESIGN
A cross-sectional survey using a structured questionnaire to collect qualitative and
quantitative data was used. The information was collected from mothers who were
respondents of whom each represented a household with children 6-59 months old to assess
maternal nutritional knowledge and nutritional status of children in a city slum.
3.1.1 Study Site
The area of study is Kawangware sub-location, in Kawangware location, Dagoretti District.
Dagoretti district lies in the western part of Nairobi County. The district has a population of
350,102 residents according to 2009 Kenya population census, 17% of the population account
for children under five years. The district is well covered with health facilities, 4 City
Council, numerous private clinics, Community Based Organizations (CBO) and Faith Based
clinics. Kenyatta National and Mbagathi district hospitals are also located in the district. This
information was obtained from the District Nutrition Officer (DNO) of dagoretti district.
Kawangware sub-location is situated between Naivasha road, Kawangware road and Gitanga
road.
3.1.2 Population in the Study Area
Kawangware location has a population of 128, 956, while Kawangware sub-location has a
population of 77,374. Kawangware is the largest Location in Dagoretti District with about
6,000 households. This information is available at the District commissioner’s office.
3.1.3 Administrative and Political Structure
Kawangware is in Dagoretti Division, Dagoretti District under the district commissioner.
Administratively, the division falls under a District Officer’s control. The division has six
20
locations; Waithaka, Mutuini, Uthiru/Ruthimitu, Kawangware, Riruta and Kenyatta/Golf
Course that are overseen by a Chief. Locations are further divided into twelve sub-locations,
each having a sub-chief. Dagoretti Constituency is also represented by a Member of
Parliament and 8 City Council wards elect their own Councillors (Weru, 1998).
3.1.4 Services Available
There are two boreholes used as water points, and a 20 litre can usually costs as much as
Kshs.5.Afew other water points have been erected by landlords, charging Kshs.3,but supplies
are normally available only once a week. The plots have either toilets or latrines. Drainage is
poor and the settlement is very muddy in the rainy seasons. Shared toilets, poor garbage
disposal, no social gathering places or playgrounds for children, electricity supply to a few,
children attend government educational facilities at kawangware or Muslim village. Private
schools are available which charge Shs 4000-4500 per year. Health facilities available to the
residents are Kawangware Dispensary (Nairobi City Council) which provides medical
services, for a fee of Kshs.20 to 40.Additionally, there are five private clinics and numerous
chemists or drug shops (Weru, 1998).
3.1.5 Economic Activities
Some residents own mini-markets, wholesale and retail businesses; others are employed as
casual labourers or are salaried workers. Daily earnings vary widely, from a minimum of Shs
100 up to 3,000.Majority of residents are self-employed as small-scale business persons or
work as casual labourers and unemployed (Weru, 1998).
21
3.2 METHODOLOGY
3.2.1 Study Sample
The study sample was 300 households each with a mother and 322 children under-five years
6-59 months of age. The difference between the number of households and the number of
children is due to the fact that some households had more than one child under five, and both
were taken for the study.
3.2.2 Sample Size Determination
Sample size was calculated using Fischer et al (1991) formula as follows:
N=z²pq/d²
Where N= the desired sample size
z= the standard normal deviation which is 1.96 at 95% confidence interval
p= proportion of, mothers with inadequate nutritional knowledge in Mathare slums
Nairobi Province estimated at 75 % (Schofield, 2009)
q=1-p the proportion of mothers with adequate nutrition knowledge.
d= the degree of accuracy desired set at 5%
Therefore;
N= (1.96)²(0.75×0.25)
0 .05²
=288
Plus 5% attrition=302 households each with a mother with a child 6-59 months, however,
300 households were considered adequate sample for the study.
22
3.2.3 Sampling Procedure
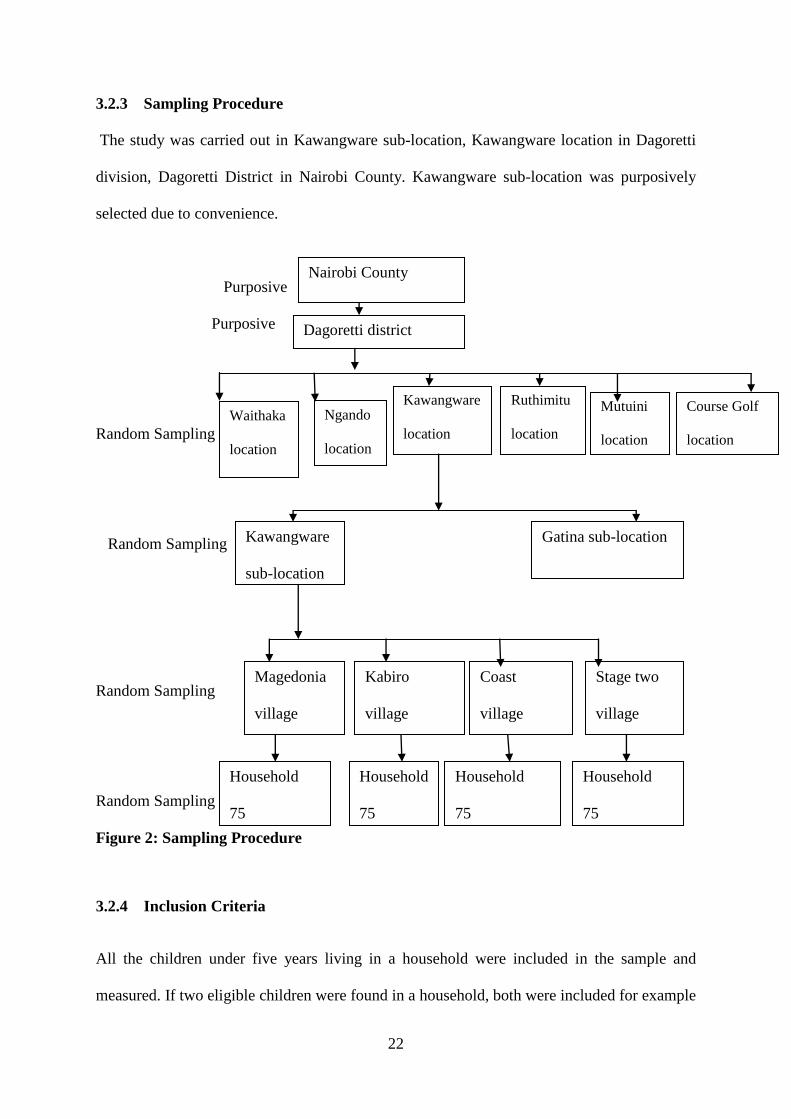
The study was carried out in Kawangware sub-location, Kawangware location in Dagoretti
division, Dagoretti District in Nairobi County. Kawangware sub-location was purposively
selected due to convenience.
Purposive
Purposive
Random Sampling
Random Sampling
Random Sampling
Random Sampling
Figure 2: Sampling Procedure
3.2.4 Inclusion Criteria
All the children under five years living in a household were included in the sample and
measured. If two eligible children were found in a household, both were included for example
Dagoretti district
Waithaka
location
Kabiro
village
Ngando
location
Kawangware
location
Ruthimitu
location
Mutuini
location
Course Golf
location
Kawangware
sub-location
Magedonia
village
Coast
village
Stage two
village
Household
75
Household
75
Household
75
Household
75
Gatina sub-location
Nairobi County
23
twins. This was extremely important as it ensured that every child had the same chance of
being selected, which was a basic principle of the survey design. All mothers with children
under five years were interviewed too.
3.2.5 Exclusion Criteria
Children over five years and households that declined request to participate.
3.3 RESEARCH INSTRUMENTS AND TOOLS
3.3.1 Questionnaire: Structured and Pre-tested
A structured questionnaire was used and it was divided into two parts; Quantitative and
Qualitative; Quantitative data included socio demographic and socioeconomic characteristics,
Seven days food frequency, dietary diversity and anthropometric measurements such as
weight and height/length. Qualitative data included maternal nutritional knowledge. Pre
testing was done on 30 households from a sub-location not included in the study. During the
pre-test, time taken to complete a questionnaire was noted; sequence of questions,
understanding of questions by the respondents and the way field assistants asked the
questions were also noted by the principal investigator. The pre-test results were used to
modify the tools accordingly. Pretesting perfected the research assistant’s skills on data
quality management and in administering the questionnaires.
3.4 RECRUITMENT AND TRAINING OF FIELD ASSISTANTS
The recruitment of field assistants was advertised verbally through the area Chief and Sub-
Chief. The criteria for recruitment consisted of good conduct and reliability, attainment of
secondary level of education, ability to read and write, communication skills, Community
Health Workers (CHWs) and ladies had an added advantage for they have better skills of
24
handling children. The training took two days and areas covered were; study objectives, the
use of survey equipments, interviewing techniques and anthropometric measurements and
filling the questionnaire. The whole team went through the questionnaire to understand its
contents for uniformity in interpretation of the questions. They were trained on good
behaviour and courtesy as they visited households. This included dress code, no receiving or
making calls during the interviews, no smoking or drinking or faking data and no discussion
about information gathered from other households.
3.4.1 Ethical and Human Rights Consideration
Research clearance was sought from the Dean’s Office Faculty of Agriculture, University of
Nairobi. Informed consent was sought from the District Administrators, the District
Commissioner of Dagoretti District, and the Chief for Kawangware Location and Assistant-
Chief for Kawangware Sub-Location before undertaking the research. Consent was also
sought from the respondents and children before administering the questionnaire, after clearly
explaining the objectives of the study. The information obtained from the respondents was
handled with confidentiality. The choice of respondents was respected in case they decide not
to participate.
3.5 DATA COLLECTION
3.5.1 Demographic Data
Demographic and socio-economic data on the household was collected using the
questionnaire. Data on maternal marital status, educational levels and age, occupation of the
parents, source of income, sex and age of the child and the size of the household was
collected.
25
3.5.2 Qualitative Data: Nutritional Knowledge
Nutritional knowledge data was collected using a structured questionnaire from mothers. The
information collected was nutrition messages such as household consumption of proteins
especially animal source and vitamin A rich foods, nutrition activities and deworming. .
Using the mean score and standard deviation, a knowledge z-score was computed and used to
group the respondents into three knowledge groups of low, medium and high knowledge
score.
3.5.3 Anthropometric Measurements
Height – Measurement based on recumbent length or standing height. Length measurement
for children under 2 years (over 85 cm) of age and height measurement for others. The
Length or height was measured and reported to the nearest 0.1cm length/height. Height Board
of the United Nations Children Funds (UNICEF) was used by the field workers after
undergoing training to measure the height of children. Readings of heights was taken to the
nearest centimetre and height for children above 2 years.
Weight- Weight measurement was reported to the nearest 0.1 kg. Ideally, weight was
determined with the child wearing no clothing or just wears one layer of undergarments. The
weight was measured using hanging plastic pants and a Salter scale for measuring weight of
children
MUAC- Mid-upper arm circumference was taken for 6-36months using the left arm. The arm
was bent at the elbow to make a right angle. The tape was placed at zero which is indicated
by the two arrows, on the tip of the shoulder and the tape was pulled to the tip of the elbow.
The midpoint of the arm was marked with a pen. The arm was then straightened, the tape
placed around the marked area and the reading taken twice to get an average.
26
Age determination- Information on age was obtained from a written birth card or similar
document, with verbal information on date of birth from the mother. Age was calculated in
months to at least one decimal place.
3.6 DATA MANAGEMENT AND ANALYSIS
3.6.1 Data Quality Control
The investigator closely supervised the field assistants and the supervisors to obtain good
quality data. All the questionnaires were checked for completeness before releasing the
interviewees at the end of each day. In the field storage of data materials and questionnaires
were in secure plastic folders. There were meetings with the enumerators and supervisors on
daily review and was able to deal with any issues arising. Data entry was done every evening.
Also good quality data was obtained by pre-testing the tools before actually administering the
tool to the target population. The field assistants were adequately trained to ensure quality
data collection and the scales were checked for accuracy and calibrated every morning using
standard known weights in this case a kilogramme of beans was used. Each day before
leaving the field, each team leader reviewed and signed all forms to ensure that no pieces of
data had been left out. Team leaders and survey supervisor recorded all important points in a
notebook as soon as possible (e.g. during breaks or at the base in the evening), including
observations, ideas, problems, actions taken and the rationale for such decisions. Each note
contained the date, location, and names of relevant people.
There were evening and morning meetings, survey team members were encouraged to
regularly discuss their experiences and findings together. This brought out important points,
and sometimes revealed where survey methods needed to be modified.
27
3.6.2 Data Management
Data entry templates were developed before data collection using; Statistical Package for
Social Sciences (SPSS).
3.6.3 Data Analysis
The data was entered and analysed using Statistical Package for Social Sciences (SPSS v16)
and MS Excel. Data from open-ended questions were pre-coded before entry. Weight and
height were converted to weight-for-age, weight-for-height and height-for-age using WHO
Anthro (v for personal computers (v 3.2.2). The indices were expressed as z-scores using the
international reference population (Onis, 2003). Children were classified as stunted, wasted
or underweight if the respective z-scores fell below -2SD of the reference population for the
age and sex (WHO, 2009).
Descriptive statistics (means, percentages, standard deviations and range) were computed for
demographic and socio-economic data. Analysis was stratified by age, sex, knowledge score,
and other characteristics. A P-value of <0.05 was considered significant in all the analyses. A
chi-square and independent t-tests type of statistics was used for comparison of prevalence
stunting, underweight and wasting between different groups.
28
CHAPTER FOUR: RESULTS
4.0 INTRODUCTION
This chapter presents results of the study conducted in Nairobi’s Kawangware slums. The
results are organised as per the objectives of the study. The objectives of the study were as
follows: to establish the socio-demographic and socio-economic characteristics of the
households of the study children; to determine nutritional knowledge of mothers; to
determine the nutritional status of the children 6-59 months and to determine child morbidity.
4.1 SOCIO DEMOGRAPHIC CHARACTERISTICS OF THE HOUSEHOLDS
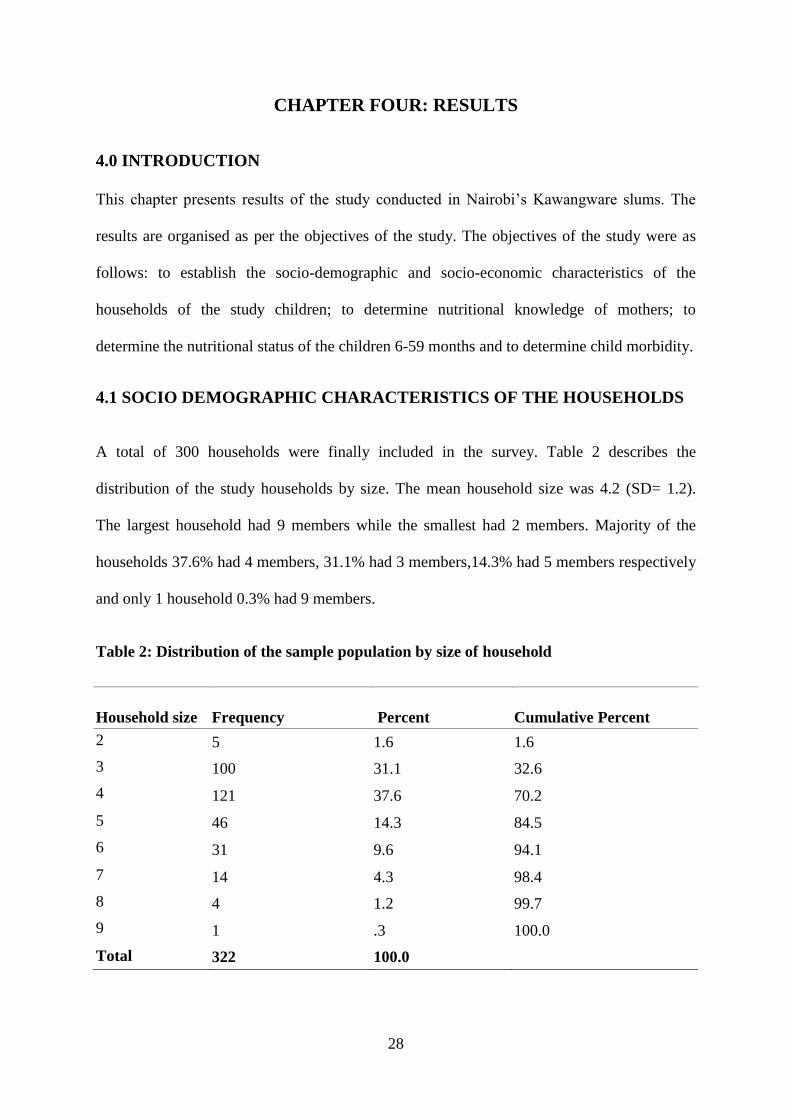
A total of 300 households were finally included in the survey. Table 2 describes the
distribution of the study households by size. The mean household size was 4.2 (SD= 1.2).
The largest household had 9 members while the smallest had 2 members. Majority of the
households 37.6% had 4 members, 31.1% had 3 members,14.3% had 5 members respectively
and only 1 household 0.3% had 9 members.
Table 2: Distribution of the sample population by size of household
Household size Frequency Percent Cumulative Percent
2 5 1.6 1.6
3 100 31.1 32.6
4 121 37.6 70.2
5 46 14.3 84.5
6 31 9.6 94.1
7 14 4.3 98.4
8 4 1.2 99.7
9 1 .3 100.0
Total 322 100.0
29
4.2 SOCIO- DEMOGRAPHIC CHARACTERISTICS OF THE MOTHERS
The survey included one respondent who were mothers for children 6-59 months from each
household and in total 322 children were studied too. The youngest child was 6 months old,
while the oldest was 59 months old. The mean age of the children was 27 months (SD, 14), of
the households studied, 93.2% had 1 child aged below five years old, and 6.5% had two
children while 0.3% had 3 children below five years, accounting for the difference between
the number of households and that of the children studied
4.2.1 Distribution of Mothers by Marital Status
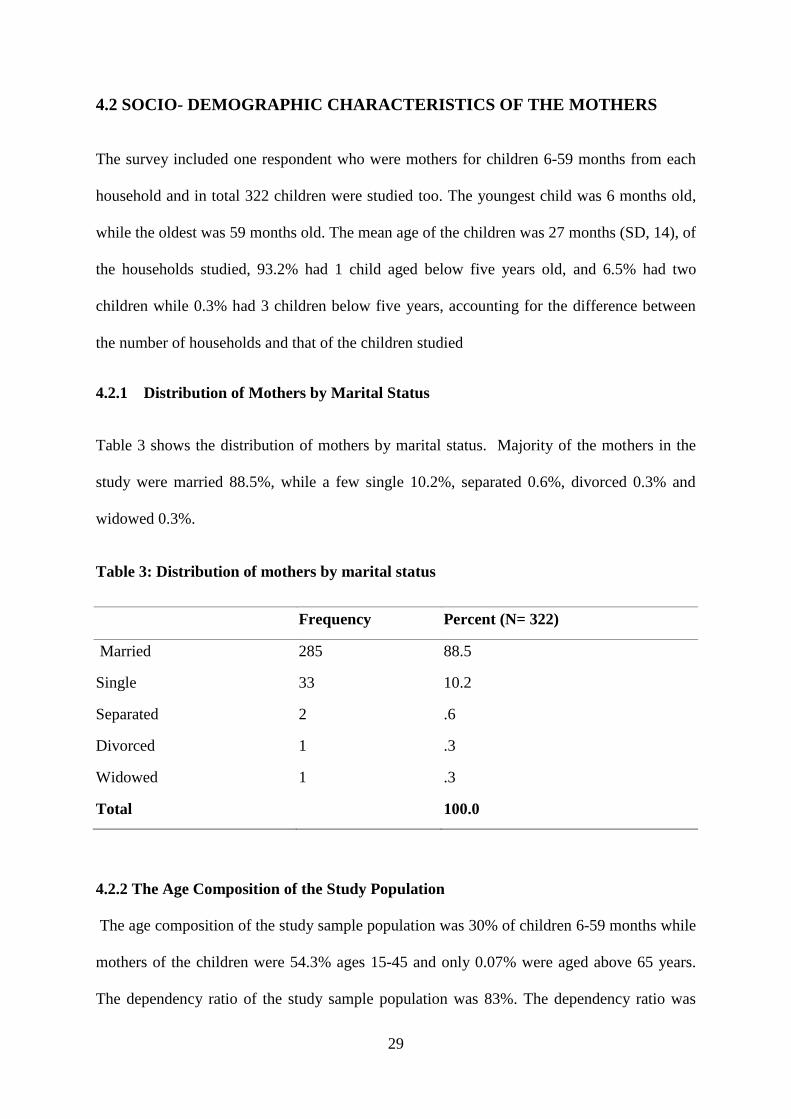
Table 3 shows the distribution of mothers by marital status. Majority of the mothers in the
study were married 88.5%, while a few single 10.2%, separated 0.6%, divorced 0.3% and
widowed 0.3%.
Table 3: Distribution of mothers by marital status
Frequency Percent (N= 322)
Married 285 88.5
Single 33 10.2
Separated 2 .6
Divorced 1 .3
Widowed 1 .3
Total 100.0
4.2.2 The Age Composition of the Study Population
The age composition of the study sample population was 30% of children 6-59 months while
mothers of the children were 54.3% ages 15-45 and only 0.07% were aged above 65 years.
The dependency ratio of the study sample population was 83%. The dependency ratio was
30
calculated by getting sum of all persons under 15 years, divided by the number of persons age
15-64, multiplied by 100.
4.2.3 Mother’s Occupation
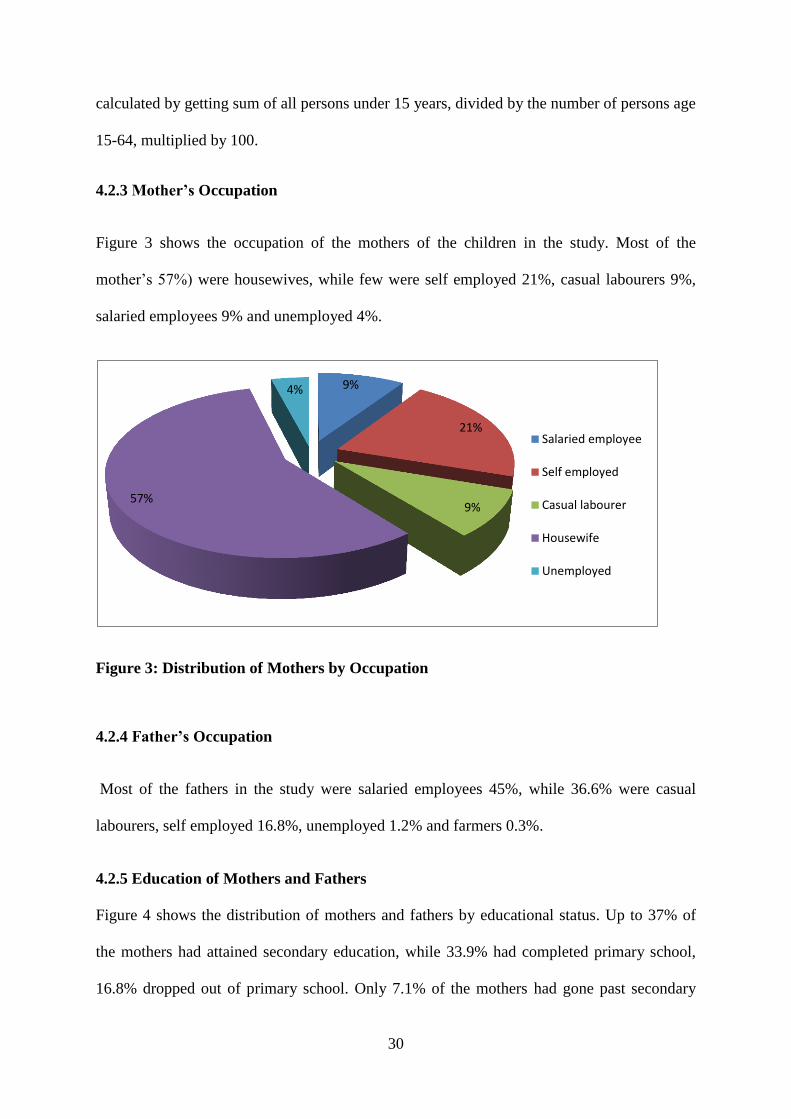
Figure 3 shows the occupation of the mothers of the children in the study. Most of the
mother’s 57%) were housewives, while few were self employed 21%, casual labourers 9%,
salaried employees 9% and unemployed 4%.
Figure 3: Distribution of Mothers by Occupation
4.2.4 Father’s Occupation
Most of the fathers in the study were salaried employees 45%, while 36.6% were casual
labourers, self employed 16.8%, unemployed 1.2% and farmers 0.3%.
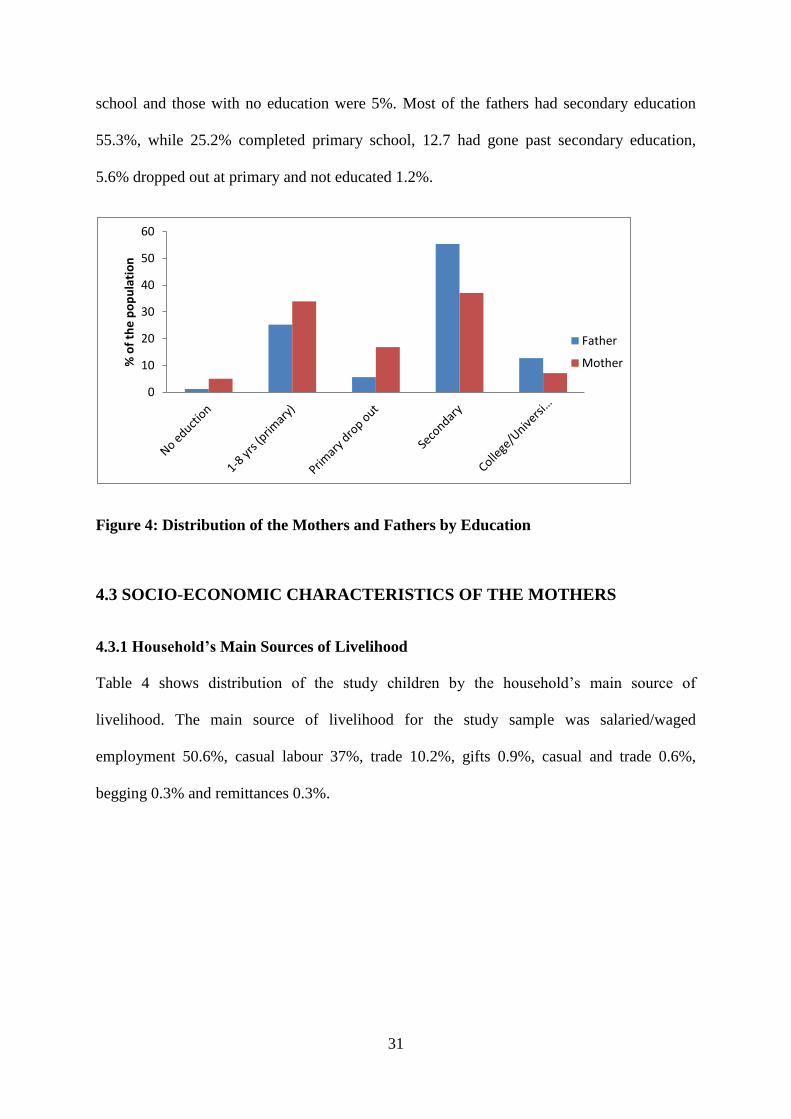
4.2.5 Education of Mothers and Fathers
Figure 4 shows the distribution of mothers and fathers by educational status. Up to 37% of
the mothers had attained secondary education, while 33.9% had completed primary school,
16.8% dropped out of primary school. Only 7.1% of the mothers had gone past secondary
9%
21%
9% 57%
4%
Salaried employee
Self employed
Casual labourer
Housewife
Unemployed
31
school and those with no education were 5%. Most of the fathers had secondary education
55.3%, while 25.2% completed primary school, 12.7 had gone past secondary education,
5.6% dropped out at primary and not educated 1.2%.
Figure 4: Distribution of the Mothers and Fathers by Education
4.3 SOCIO-ECONOMIC CHARACTERISTICS OF THE MOTHERS
4.3.1 Household’s Main Sources of Livelihood
Table 4 shows distribution of the study children by the household’s main source of
livelihood. The main source of livelihood for the study sample was salaried/waged
employment 50.6%, casual labour 37%, trade 10.2%, gifts 0.9%, casual and trade 0.6%,
begging 0.3% and remittances 0.3%.
0
10
20
30
40
50
60
% o
f th
e p
op
ula
tio
n
Father
Mother
32
Table 4: Distribution of the study children by household’s main source of livelihood
Frequency Percent
Casual labour 119 37.0
Salaried or waged 163 50.6
Begging 1 .3
Gifts 3 .9
Trade 33 10.2
Remittances 1 .3
casual and trade 2 .6
Total 322 100.0
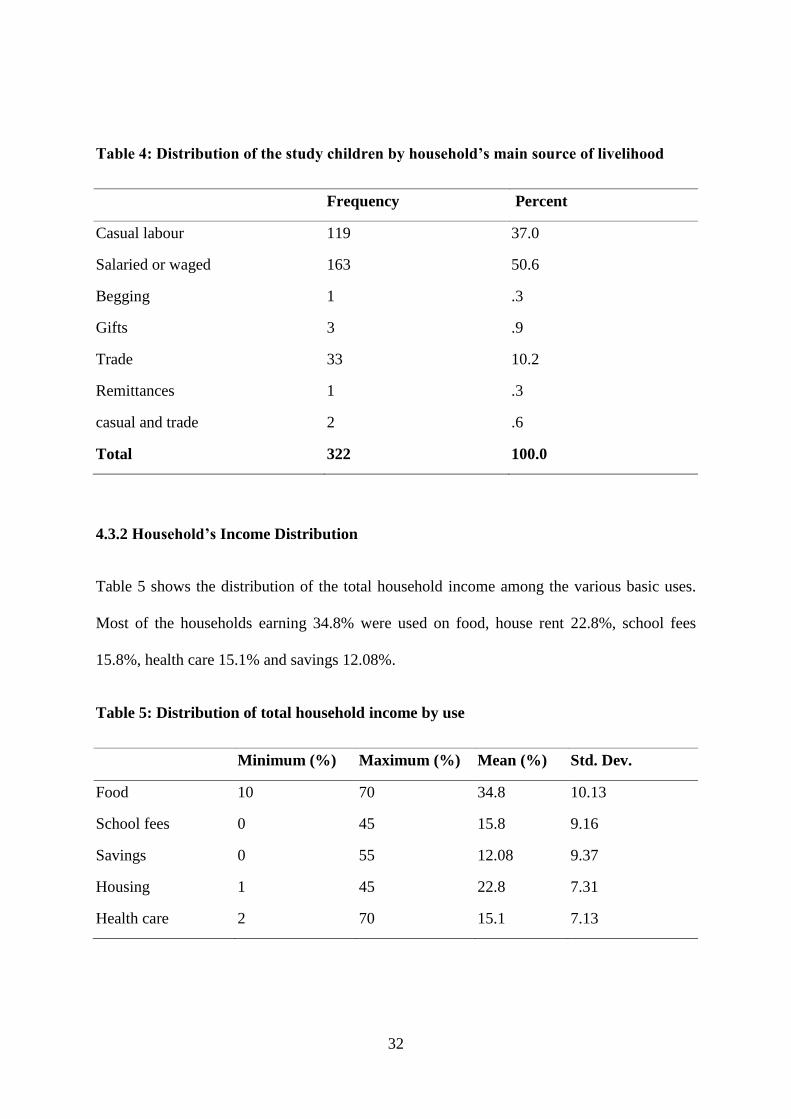
4.3.2 Household’s Income Distribution
Table 5 shows the distribution of the total household income among the various basic uses.
Most of the households earning 34.8% were used on food, house rent 22.8%, school fees
15.8%, health care 15.1% and savings 12.08%.
Table 5: Distribution of total household income by use
Minimum (%) Maximum (%) Mean (%) Std. Dev.
Food 10 70 34.8 10.13
School fees 0 45 15.8 9.16
Savings 0 55 12.08 9.37
Housing 1 45 22.8 7.31
Health care 2 70 15.1 7.13
33
4.4 MATERNAL NUTRITIONAL KNOWLEDGE
4.4.1 Knowledge of Malezi Bora by Mothers
The results of the study show that (78.9%) of the mothers interviewed had knowledge of
Malezi Bora while the rest (21.1%) did not have any knowledge
4.4.2 Sources of Knowledge on Malezi bora
The results of the study show different sources of knowledge on Malezi Bora. The health
facilities as a source had 47%, community health workers 20%, radio 20%, while those
without any source were 10% and road show campaigns 3%.
4.4.3 Knowledge of Malezi Bora Activities by Mothers
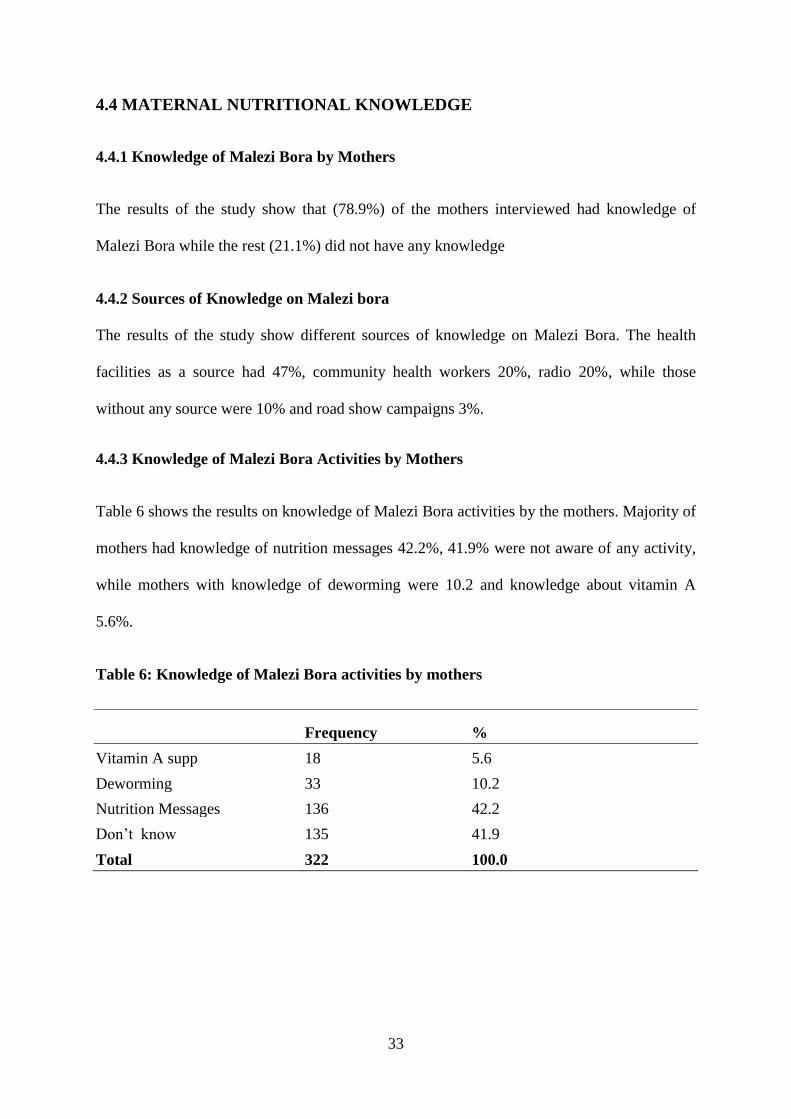
Table 6 shows the results on knowledge of Malezi Bora activities by the mothers. Majority of
mothers had knowledge of nutrition messages 42.2%, 41.9% were not aware of any activity,
while mothers with knowledge of deworming were 10.2 and knowledge about vitamin A
5.6%.
Table 6: Knowledge of Malezi Bora activities by mothers
Frequency %
Vitamin A supp 18 5.6
Deworming 33 10.2
Nutrition Messages 136 42.2
Don’t know 135 41.9
Total 322 100.0
34
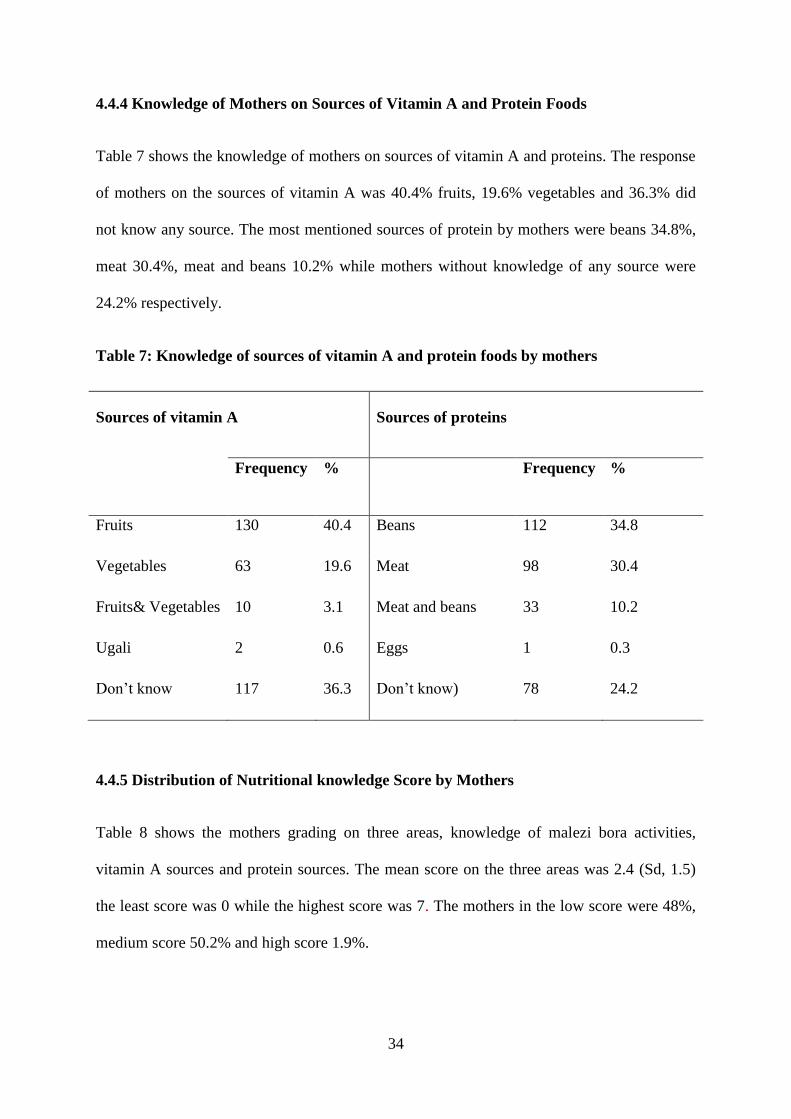
4.4.4 Knowledge of Mothers on Sources of Vitamin A and Protein Foods
Table 7 shows the knowledge of mothers on sources of vitamin A and proteins. The response
of mothers on the sources of vitamin A was 40.4% fruits, 19.6% vegetables and 36.3% did
not know any source. The most mentioned sources of protein by mothers were beans 34.8%,
meat 30.4%, meat and beans 10.2% while mothers without knowledge of any source were
24.2% respectively.
Table 7: Knowledge of sources of vitamin A and protein foods by mothers
Sources of vitamin A Sources of proteins
Frequency % Frequency %
Fruits 130 40.4 Beans 112 34.8
Vegetables 63 19.6 Meat 98 30.4
Fruits& Vegetables 10 3.1 Meat and beans 33 10.2
Ugali 2 0.6 Eggs 1 0.3
Don’t know 117 36.3 Don’t know) 78 24.2
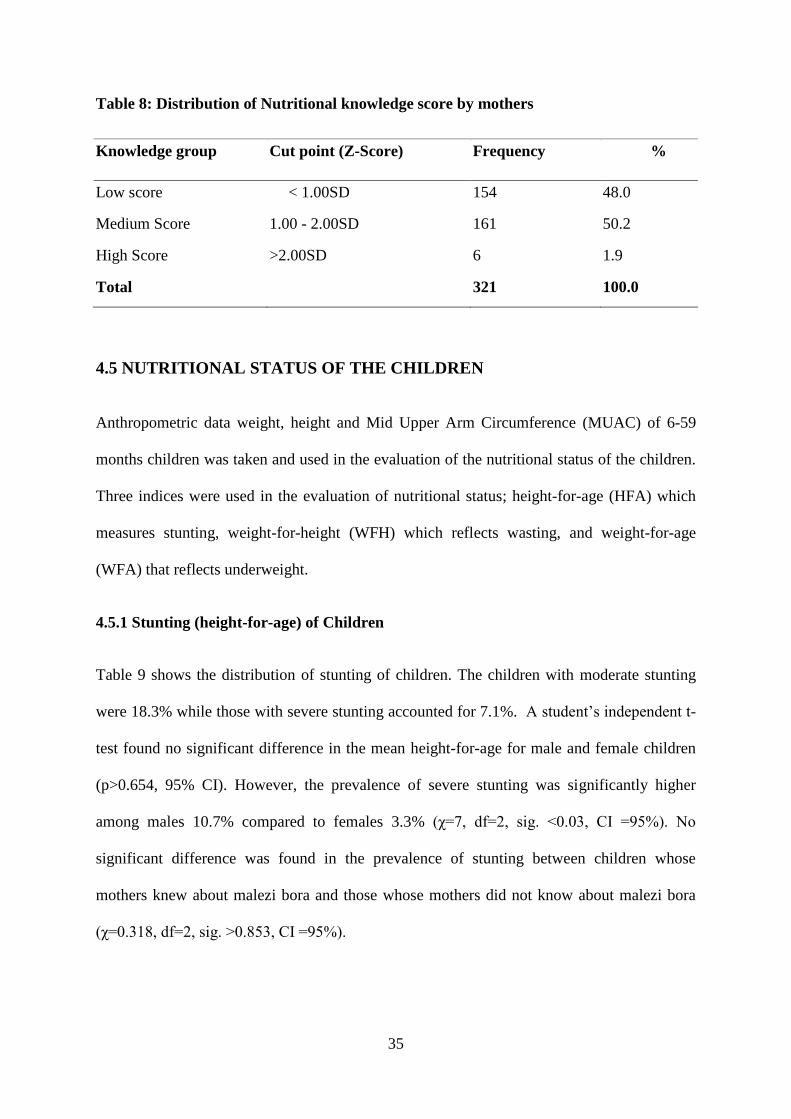
4.4.5 Distribution of Nutritional knowledge Score by Mothers
Table 8 shows the mothers grading on three areas, knowledge of malezi bora activities,
vitamin A sources and protein sources. The mean score on the three areas was 2.4 (Sd, 1.5)
the least score was 0 while the highest score was 7. The mothers in the low score were 48%,
medium score 50.2% and high score 1.9%.
35
Table 8: Distribution of Nutritional knowledge score by mothers
Knowledge group Cut point (Z-Score) Frequency %
Low score < 1.00SD 154 48.0
Medium Score 1.00 - 2.00SD 161 50.2
High Score >2.00SD 6 1.9
Total 321 100.0
4.5 NUTRITIONAL STATUS OF THE CHILDREN
Anthropometric data weight, height and Mid Upper Arm Circumference (MUAC) of 6-59
months children was taken and used in the evaluation of the nutritional status of the children.
Three indices were used in the evaluation of nutritional status; height-for-age (HFA) which
measures stunting, weight-for-height (WFH) which reflects wasting, and weight-for-age
(WFA) that reflects underweight.
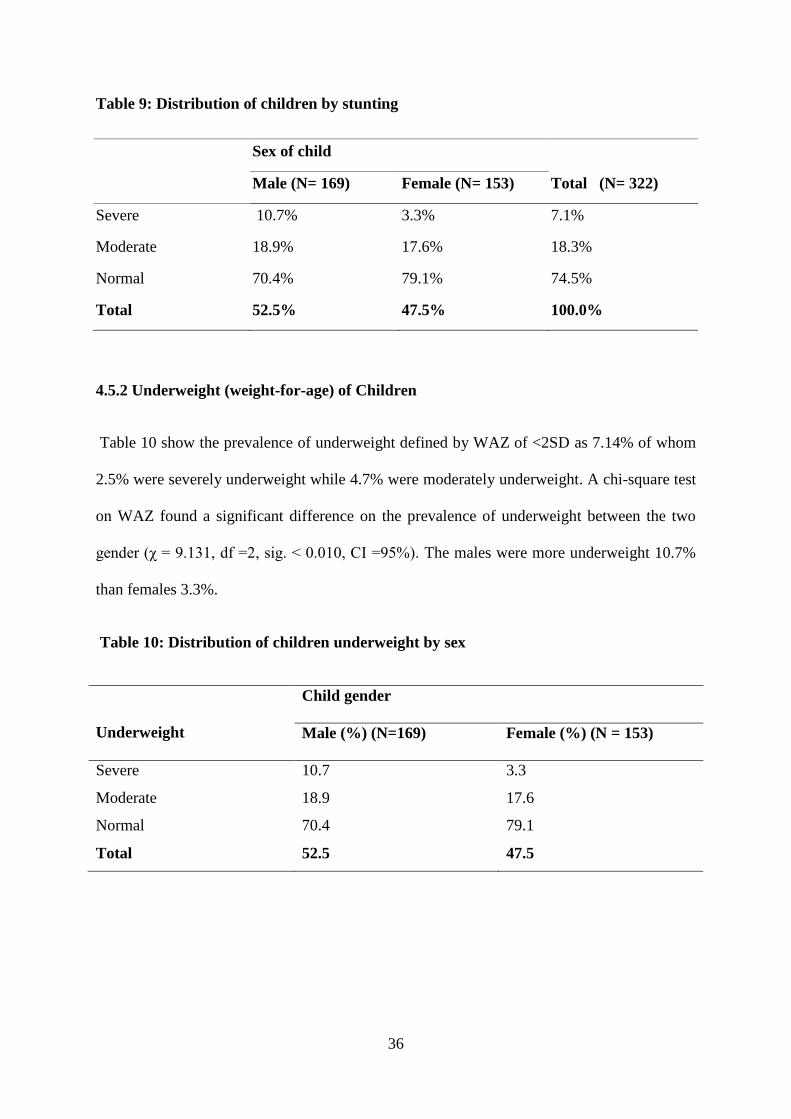
4.5.1 Stunting (height-for-age) of Children
Table 9 shows the distribution of stunting of children. The children with moderate stunting
were 18.3% while those with severe stunting accounted for 7.1%. A student’s independent t-
test found no significant difference in the mean height-for-age for male and female children
(p>0.654, 95% CI). However, the prevalence of severe stunting was significantly higher
among males 10.7% compared to females 3.3% (χ=7, df=2, sig. <0.03, CI =95%). No
significant difference was found in the prevalence of stunting between children whose
mothers knew about malezi bora and those whose mothers did not know about malezi bora
(χ=0.318, df=2, sig. >0.853, CI =95%).
36
Table 9: Distribution of children by stunting
Sex of child
Total (N= 322) Male (N= 169) Female (N= 153)
Severe 10.7% 3.3% 7.1%
Moderate 18.9% 17.6% 18.3%
Normal 70.4% 79.1% 74.5%
Total 52.5% 47.5% 100.0%
4.5.2 Underweight (weight-for-age) of Children
Table 10 show the prevalence of underweight defined by WAZ of <2SD as 7.14% of whom
2.5% were severely underweight while 4.7% were moderately underweight. A chi-square test
on WAZ found a significant difference on the prevalence of underweight between the two
gender (χ = 9.131, df =2, sig. < 0.010, CI =95%). The males were more underweight 10.7%
than females 3.3%.
Table 10: Distribution of children underweight by sex
Underweight
Child gender
Male (%) (N=169) Female (%) (N = 153)
Severe 10.7 3.3
Moderate 18.9 17.6
Normal 70.4 79.1
Total 52.5 47.5
37
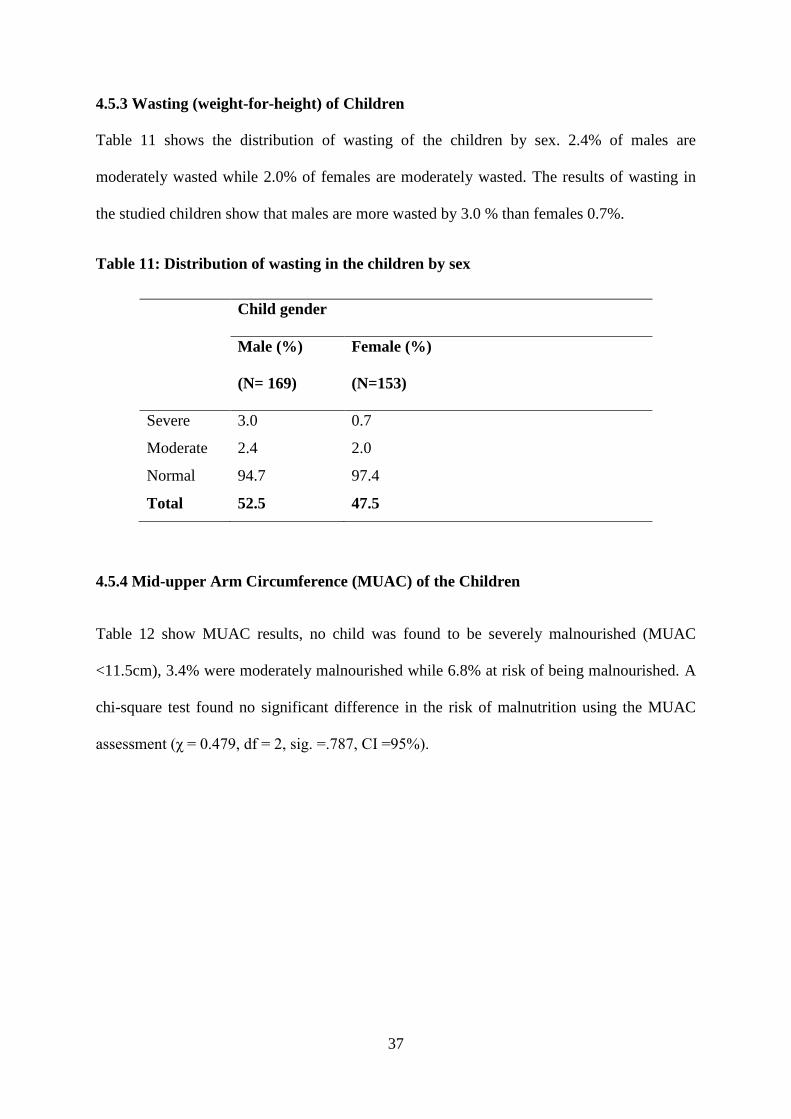
4.5.3 Wasting (weight-for-height) of Children
Table 11 shows the distribution of wasting of the children by sex. 2.4% of males are
moderately wasted while 2.0% of females are moderately wasted. The results of wasting in
the studied children show that males are more wasted by 3.0 % than females 0.7%.
Table 11: Distribution of wasting in the children by sex
Child gender
Male (%)
(N= 169)
Female (%)
(N=153)
Severe 3.0 0.7
2.0 Moderate 2.4
Normal 94.7 97.4
Total 52.5 47.5
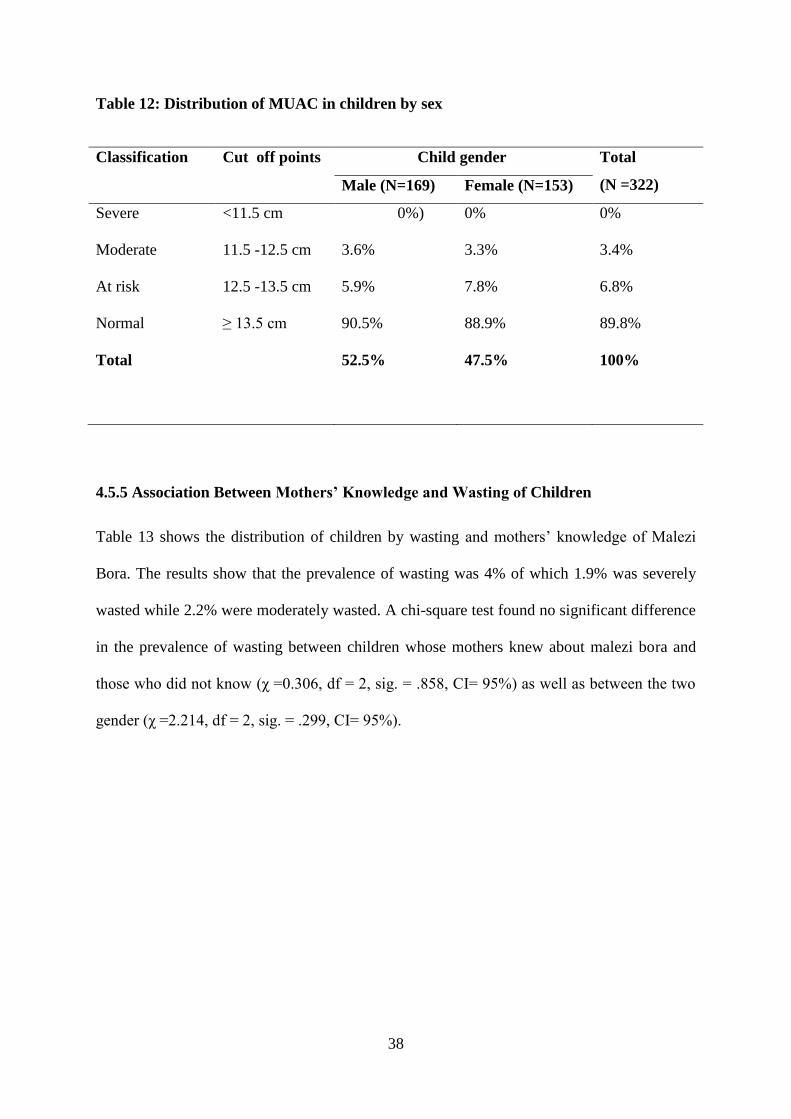
4.5.4 Mid-upper Arm Circumference (MUAC) of the Children
Table 12 show MUAC results, no child was found to be severely malnourished (MUAC
<11.5cm), 3.4% were moderately malnourished while 6.8% at risk of being malnourished. A
chi-square test found no significant difference in the risk of malnutrition using the MUAC
assessment (χ = 0.479, df = 2, sig. =.787, CI =95%).
38
Table 12: Distribution of MUAC in children by sex
Classification Cut off points Child gender Total
(N =322) Male (N=169) Female (N=153)
Severe <11.5 cm 0%) 0% 0%
Moderate 11.5 -12.5 cm 3.6% 3.3% 3.4%
At risk 12.5 -13.5 cm 5.9% 7.8% 6.8%
Normal ≥ 13.5 cm 90.5% 88.9% 89.8%
Total 52.5% 47.5% 100%
4.5.5 Association Between Mothers’ Knowledge and Wasting of Children
Table 13 shows the distribution of children by wasting and mothers’ knowledge of Malezi
Bora. The results show that the prevalence of wasting was 4% of which 1.9% was severely
wasted while 2.2% were moderately wasted. A chi-square test found no significant difference
in the prevalence of wasting between children whose mothers knew about malezi bora and
those who did not know (χ =0.306, df = 2, sig. = .858, CI= 95%) as well as between the two
gender (χ =2.214, df = 2, sig. = .299, CI= 95%).
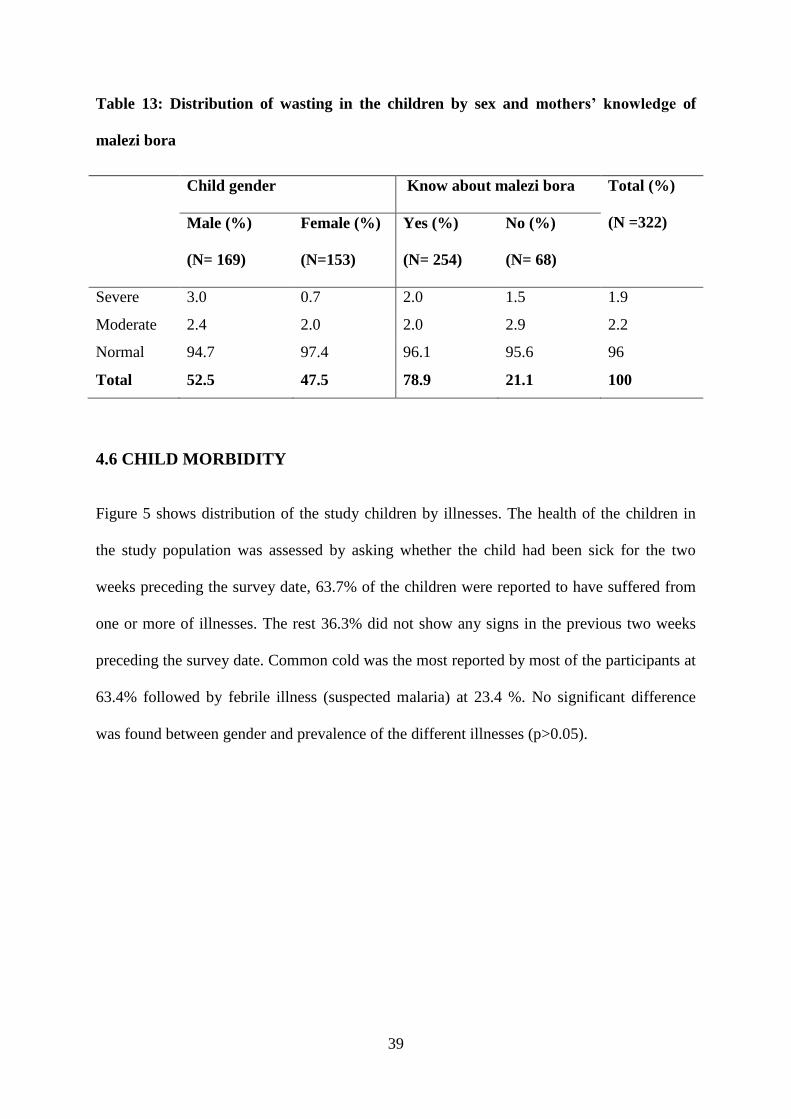
39
Table 13: Distribution of wasting in the children by sex and mothers’ knowledge of
malezi bora
Child gender Know about malezi bora Total (%)
(N =322) Male (%)
(N= 169)
Female (%)
(N=153)
Yes (%)
(N= 254)
No (%)
(N= 68)
Severe 3.0 0.7 2.0 1.5 1.9
Moderate 2.4 2.0 2.0 2.9 2.2
Normal 94.7 97.4 96.1 95.6 96
Total 52.5 47.5 78.9 21.1 100
4.6 CHILD MORBIDITY
Figure 5 shows distribution of the study children by illnesses. The health of the children in
the study population was assessed by asking whether the child had been sick for the two
weeks preceding the survey date, 63.7% of the children were reported to have suffered from
one or more of illnesses. The rest 36.3% did not show any signs in the previous two weeks
preceding the survey date. Common cold was the most reported by most of the participants at
63.4% followed by febrile illness (suspected malaria) at 23.4 %. No significant difference
was found between gender and prevalence of the different illnesses (p>0.05).
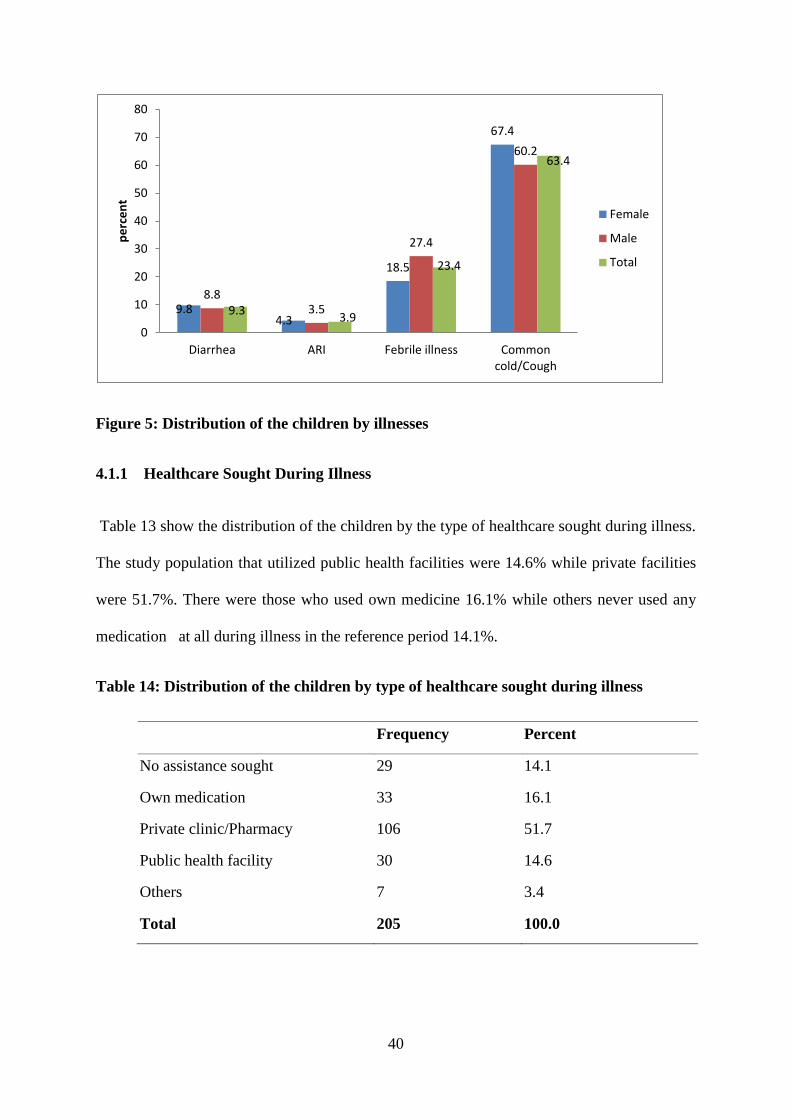
40
Figure 5: Distribution of the children by illnesses
4.1.1 Healthcare Sought During Illness
Table 13 show the distribution of the children by the type of healthcare sought during illness.
The study population that utilized public health facilities were 14.6% while private facilities
were 51.7%. There were those who used own medicine 16.1% while others never used any
medication at all during illness in the reference period 14.1%.
Table 14: Distribution of the children by type of healthcare sought during illness
Frequency Percent
No assistance sought 29 14.1
Own medication 33 16.1
Private clinic/Pharmacy 106 51.7
Public health facility 30 14.6
Others 7 3.4
Total 205 100.0
9.8 4.3
18.5
67.4
8.8 3.5
27.4
60.2
9.3 3.9
23.4
63.4
0
10
20
30
40
50
60
70
80
Diarrhea ARI Febrile illness Commoncold/Cough
pe
rce
nt
Female
Male
Total
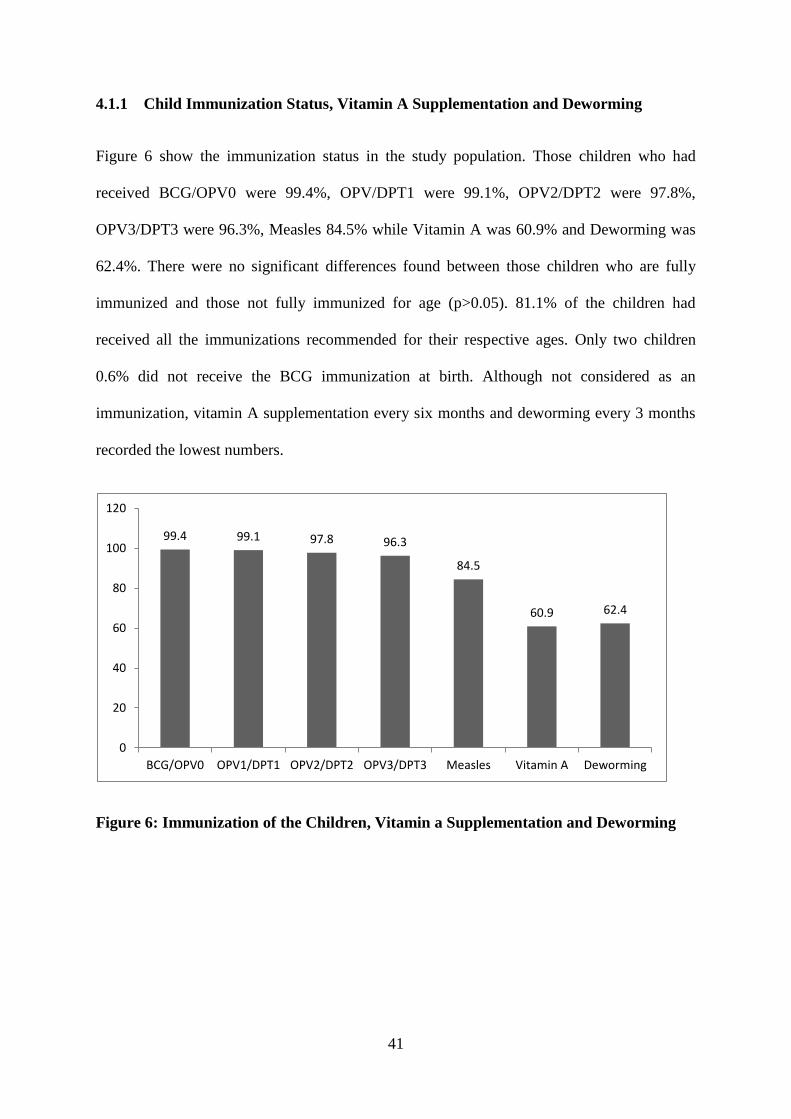
41
4.1.1 Child Immunization Status, Vitamin A Supplementation and Deworming
Figure 6 show the immunization status in the study population. Those children who had
received BCG/OPV0 were 99.4%, OPV/DPT1 were 99.1%, OPV2/DPT2 were 97.8%,
OPV3/DPT3 were 96.3%, Measles 84.5% while Vitamin A was 60.9% and Deworming was
62.4%. There were no significant differences found between those children who are fully
immunized and those not fully immunized for age (p>0.05). 81.1% of the children had
received all the immunizations recommended for their respective ages. Only two children
0.6% did not receive the BCG immunization at birth. Although not considered as an
immunization, vitamin A supplementation every six months and deworming every 3 months
recorded the lowest numbers.
Figure 6: Immunization of the Children, Vitamin a Supplementation and Deworming
99.4 99.1 97.8 96.3
84.5
60.9 62.4
0
20
40
60
80
100
120
BCG/OPV0 OPV1/DPT1 OPV2/DPT2 OPV3/DPT3 Measles Vitamin A Deworming
42
CHAPTER FIVE: DISCUSSION
5.1 SOCIO-DEMOGRAPHIC AND SOCIO-ECONOMIC
CHARACTERISTICS
The demographic and socioeconomic characteristics identified in the study population were;
Marital status of the mothers, Age composition of the study population, Parents occupation,
Education of the parents, Household size, Household’s main economic activities and
Household’s income use. Previous studies indicated that greater household income directly
raise the ability to purchase sufficient quantities of nutritious foods (Miller & Rodgers, 2009).
In a study carried out in Kwale, the demographic and socio-economic factors were implicated
as the underlying causes of the poor nutritional status of children in Kenya (Adeladza, 2009).
The study showed that there were more women married hence upholding the moral values of
the family and creation of conducive environment for upbringing of children. In a study by
Kenya demographic health survey 2008-2009, 58 percent of the women were married
(KNBS, 2010).
This study showed that age and sex were important demographic variables, where the
distribution of the household population had more persons in the younger age groups for both
sexes. According to a study by Kenya demographic health survey, the distribution of the
household population had more persons in the younger age groups than in the older age
groups for both sexes, with those age 0-19 accounting for more than half of the population
(KNBS, 2010). The population distribution in this study has more persons in the younger age
group than in the older age groups for both sexes. The dependency ratio of this study was
83%, a clear indication that there is a heavy burden to the household to be able to meet their
43
basic requirements especially adequate food and proper healthcare for all members in the
family.
The current study indicates that the respondents who were mothers were housewives who
dependent solely on their spouses to provide money for essential basic needs like food,
shelter, clothing, while a few were self employed. There is need to empower women so as to
be able to contribute to the family basket to easy straining in the household basic needs.
According to 2008-2009 KDHS majority of women were employed and as compared to the
unemployed (KNBS, 2010). The findings of this study show a big disparity between men and
women in terms of employment an indication that men were the major breadwinners in most
of the households. It was observed that most families were struggling to afford even a single
day’s meal, decent housing, clean water for use, proper healthcare for the household
members, good sanitation and environmental hygiene which are essential for good nutritional
status of children.
The study showed that more men had gone past secondary education compared to women and
this may have contributed to men getting salaried jobs. Previous studies observed that
education is a key determinant of the lifestyle and status an individual enjoys in a society
(KNBS, 2010). In a study carried out in Kwale it was observed that a mother’s education is
closely linked to nutritional status of children. Children of no educated mothers are more
likely to be underweight than those of secondary-educated mothers (p<0.05) which is
consistent with numerous studies showing the importance of maternal education for child
health and nutrition (Adeladza, 2009). In a previous study it was identified that greater
education for mothers contributes to new skills, beliefs and choices about sound health and
nutritional practices (Miller & Rodgers, 2009). Similarly a study in the Democratic Republic
of Congo established that mother’s education has a positive effect on child health in
44
developing countries (Emina, et al., 2011). The lack of attainment of appropriate education
levels observed in the respondents who were mothers requires to be addressed if the
nutritional status of children has to improve; indeed an educated woman has a positive impact
to the household and national development.
The findings of this study show the mean size of the household as 4.2 people similar to a
study carried out by Kenya Demographic and Health Survey in 2008-2009 (KNBS, 2010).
Other studies have shown that more children in a household are associated with more
competition for scarce resources, which could affect children’s dietary intake, decrease
access to medical treatment and increase their exposure to infectious diseases (Miller and
Rodgers, 2009).
A livelihood comprises the capabilities, assets (including both material and social resources)
and activities required for a means of living (Piya, et al., 2011). In this study it was observed
that the main source of livelihood for households was employment either permanent or
casual. The earnings of the study population were distributed among the various basic uses of
the households. The study showed that the income earned by households respondents and
spouses was not enough to enable them afford a diversified diet, proper housing, give their
children good education and access appropriate healthcare and healthcare schemes like
medical insurances. Previous studies in Pakistan showed that the sources of livelihoods were
farming, wage earners, self-employed, business, remittances and casual labour (Urrehman &
Rana, 2008)
5.2 MATERNAL NUTRITIONAL KNOWLEDGE
Nutrition knowledge is the understanding of different types of food and how food nourishes
the body and influences health (Insel et al., 2003). Nutrition knowledge affects food choices
and preparation, knowledge particularly given to women is a powerful weapon against
45
malnutrition since increased knowledge and skills enable women to earn higher incomes and
thus enhance household food security and improve the quality of day to day care women
gives themselves and all members of their household, especially children. It empowers
women to make optimal choices for nutritious and safe food (Ongosi, 2010). Maternal
nutrition knowledge has frequently been identified as an important target for nutrition
promotion interventions (Laurens, et al., 2012).
In this study majority of the mothers interviewed had knowledge of Malezi bora while a few
of them did not have any knowledge at all. The mothers who had knowledge of the
programme were able to list different sources, health facilities and community health workers
being the most mentioned. In the study a small percentage of mothers were aware of malezi
bora activities while the rest of them did not know any activity. The study observed that the
Malezi bora activities of interest were; vitamin A supplementation, deworming and nutrition
messages. In this study it was observed that there is need to decentralise the malezi bora
programme from the health facilities to the community level in order to involve those
mothers who rarely or never access healthy facilities at all.
The study findings showed that majority of mothers were not aware of any vitamin A and
protein source. The most mentioned sources were fruits and beans respectively. In a previous
study in Sri Lanka it was realized that the knowledge of the mother regarding the importance
of vitamin A was not satisfactory (Wijesinghe et al., 2010), while a study in Bangladesh
determined that the children’s nutritional habits are positively affected by higher nutritional
knowledge of mothers (Faraque, et al., 2008). In another study, mother’s nutritional
knowledge was determined to increase in parallel with the education level (Variyam, et al.,
1999). In this study it was observed that majority of households, children 6-59 years were not
consuming foods that are rich in vitamin A and proteins especially animal sources due to low
46
income earned by the household, inadequate nutrition knowledge of mothers and cultural
beliefs. Protein foods of reference like eggs were not given to children reason being that they
would delay in speech.
Reports by Parul Christian and others revealed that a mother is the principal provider of the
primary care that her child needs during the first six years of its life. The type of care she
provides depends to a large extent on her knowledge and understanding of some aspects of
basic nutrition and health care. It is understandable that her educational status has been
reported to influence her child-care practices (Christian et al., 1988). Similarly, another study
revealed that maternal nutrition knowledge was independently associated with nutritional
status after the effects of other significant variables were controlled (Appoh & Krekling,
2005). In other previous studies mothers with higher levels of nutrition knowledge, acquired
primarily outside of school, are able to choose a more diversified diet for their children and,
broadly speaking, to utilize food more effectively (Francesco, 2010). In addition reports on
maternal nutritional knowledge and the nutritional status of preschool children in Kibera slum
area, by Waihenya and others (1996) revealed that most mothers had access to nutrition
education and there was no significant relationship between the nutritional status of children
and overall nutritional knowledge. This is because, nutritional knowledge alone is inadequate
in ensuring young children's nutrition security and, hence, for nutrition education
programmes to have a positive impact, facilitational strategies must be incorporated
(Waihenya, et al., 1996).
5.3 NUTRITIONAL STATUS OF THE CHILDREN
The results of this study revealed that prevalence of stunting (Height-for-age) among the
children was high. The prevalence of severe stunting was significantly higher among males
compared to females. Previous studies in an informal settlement (kibera) in Nairobi showed
47
the prevalence of stunting among boys to be higher than among girls (Olack, et al., 2011).
The current study shows no significant difference in the prevalence of stunting between
children whose mother knew about malezi bora and those whose mothers did not know about
malezi bora. According to KDHS 2008-2009 stunting of children under five years was higher
nationally. Stunting reflects failure to receive adequate nutrition over a long period of time
and is also affected by recurrent and chronic illness. Height-for-age, therefore, represents the
long-term effects of malnutrition in a population and is not sensitive to recent, short-term
changes in dietary intake (KNBS, 2010). Previous studies showed that girls and boys are
almost likely to be stunted globally, but in sub-Saharan Africa stunting afflicts more boys
than girls (UNICEF, 2013).
This study showed that the prevalence of Underweight (weight-for-age) was not different
from the national statistics. There was no significant difference on the prevalence of
underweight between males and females. A previous study by Kenya Demographic and
Health Survey of 2008-2009 showed that underweight of children under five is lower than
stunting (KNBS, 2010). In a report by UNICEF a ten per cent of children in the developing
world are severely underweight (UNICEF, 2009).
In this study wasting or low weight-for-height was lower than stunting and underweight. In
previous studies by KDHS 2008-2009 the percentage of children wasted was lower than
stunting (KNBS, 2010). The study showed no significant difference in the prevalence of
wasting between children whose mothers knew about malezi bora and those with no
information of malezi bora. According to UNICEF a small percentage of children are wasted
(UNICEF, 2009). Similarly, a study in Libya shows that stunting of children was higher than
underweight and wasting (Adel et al., 2008). Previous reports showed that in sub-Saharan
Africa, nearly 1 in 10 children under the age of five years were wasted in 2011 a prevalence
that has decreased about 10 per cent since 1990 (UNICEF, 2013).
48
5.3 IMMUNIZATION OF THE CHILDREN
Immunization averts an estimated 2.5 million child deaths a year, but despite the successes,
millions of children in developing countries-almost 20% of the children born every year-do
not get the complete immunizations scheduled for their first year of life (WHO, 2009).
There were no significant differences (p>0.05 between those children who are fully
immunized and those not fully immunized for age. Majority of children had received all the
immunizations recommended for their respective ages. Previous studies by KDHS 2008-2009
showed that majority of children age 12-23 months were fully vaccinated at time before the
survey (KNBS, 2010). This study revealed that the study population adhered to the
immunization procedures of the children under five years promptly except for few who did
not. Although not considered as an immunization, vitamin A supplementation every six
months is preceded by the deworming three months before is carried out as routine.
5.4 CHILD MORBIDITY
The incidence of child morbidity has been shown to be higher in slums and peri- urban areas
than in more privileged urban settings or, sometimes, even rural areas ((UNICEF, 2012).
Child health remains one of the most popular development indicators because it measures the
quality of life in developing countries (Konseiga, 2008). The findings showed that majority
of children were suffering from different illnesses prior to two weeks before the study and
common cold was the most reported by the mothers. This is as a result of poor housing
conditions leading to congestion, poor sanitation and low social economic status, making it
difficult for the parents to afford warm clothing for their children. Majority of the mothers
sought treatment from both the public health facilities and private clinics. In the 2008-09
KDHS, most mothers sought advice or treatment for their children’s illnesses from the health
facilities (KNBS, 2010). Previous studies show that caretakers sought medical care more
49
frequently for diarrhoea symptoms than for coughing and even more so when the diarrhoea
was associated with fever (Taffa and Chepngeno-Langat, 2005).
50
CHAPTER SIX: CONCLUSIONS AND RECOMMENDATIONS
6.1 CONCLUSIONS
Majority of mothers are married, most of them being housewives and majority had attained
primary and secondary levels of education. The total household income is shared among
basic needs with food and house rent taking the highest share as health care and savings take
less.
The study concluded that mothers’ nutritional knowledge exists but it is low.
Generally the nutritional status of the children was normal, except for stunting which was
significantly higher than wasting and underweight, though lower than the national coverage.
Majority of children suffer from common cold and febrile illness, necessitating their mothers
to seek treatment especially from private clinics than public health facilities. Majority of
children had received their immunizations by the age of 24 months.
51
6.2 RECOMMENDATIONS
The study recommends the following:
There is need to educate women on allocation of income to health care services just as for
food to improve on declining child survival and promote growth development.
The Ministry of Health to decentralise Malezi Bora programme from the health facilities to
the community level nationally, through CHWs in order to involve all mothers who rarely or
never access healthy facilities at all. There is need for creation of awareness to all mothers
about the routine services offered at the health facilities.
Further studies based on the results of this study to be carried out to enable assessment and
evaluation of the programme both internally and externally.
There is need for further study to establish the reasons why stunting is more prevalent than
wasting and underweight in the current study, especially in males than females.
52
REFERENCES
Adeladza, T. A., 2009. The Influence of Socio-economic and Nutritional Characteristics on
Child Growth in Kwale District of Kenya. African Agriculture Nutrition and Development.
9(7):1584-5374.
Appoh, L. Y. & Krekling, S., 2005. Maternal nutrotional knowledge and child nutritional
status in the Volta region of Ghana. Maternal and Child Nutrition. 1(2): 100-110.
Ashworth, A., Shrimpton, R & Jamil, K., 2008. Growth Monitoring and Promotion: Review
of evidence of impact. Blackwell. Maternal and Child Nutrition. 4: 86-117.
Azzari, C., Carletto, G., Davis, B. & Nucifora, A., 2011. Child Undernutrition in
Mozambique, s.l.: s.n.
Babatunde, R. O., Olagunju, F. I., Fakayode, S. B. & Sola-Ojo, F. E., 2011. Prevalence and
Determinants of Malnutrition among Under-five children of Farming Households in Kwara
state,Nigeria. Agricultural Science. 3(3): 173-174.
Block, S. A., 2007. Maternalnutrition knowledge versus schooling as determinants of child
micronutrient status. Oxford Economic Papers. 59(2): 330-335.
Christian, P., Abbi, R., Gujral, S. & Gopaldas, T., 1988. The role of maternal literacy and
nutrition knowledge in determining children's nutritional status. Food and Nutrition Bulletin,
10(4).
Davis, P. S. & Roodveldt, R., 2001. Standard methods for the collection and collation of
anthropometric data in children, Australia: National Food and Nutrition Monitoring and
Surveillance Project.
Emina, J. B.-O., Kandala, N.-B., Inungu, J. & Yazoume, Y., 2011. Maternal education and
child nutritional status in the Democratic Republic of Congo. Public Health and
Epidemiology. 3(12): 576-592.
Faraque, A.S.,Ahmed, A.M.,Ahmed, T.,Islam,M.M.,Hossain,M.I.,Roy,S.K.,Alam,N.,Kabir,I.
& Sack,D.A., 2008. Nutrition:Basis for Healthy Children and Mothers in Bangladesh. Health
Population Nutrition. 26(3): 325-339.
53
Fransesco, B., 2010. Child Nutrition in Mozambique in 2003:The Role of Mother's Education
and Nutrition Knowledge. Economic and Human Biology. 8(3): 331-45.
Fotso, J. C., 2007. Urban-Rural Differentials in Child Malnutrition:Trends and
Socioeconomic Correlates in Sob-Saharan Africa, s.l.: s.n.
Gibson, R. S., 2005. Anthropometric assessment. In: Principles Of Nutritional Assessment.
Amazon: Oxford University Press, pp. 233-234.
Griffiths, M. & Rosso, J. D., 2007. Growth Monitoring and The Promotion of Healthy Young
Child Growth:Evidence of Effectiveness and Potential to Prevent Malnutrition., S.l.: The
Manoff Group.
Hasan, I., Zulkifle, M. & Ansari, A. H., 2011. An assessment of nutritional status of the
children of government urdu higher primary schools of Azad Nagar and its surrounding areas
of Bangalore. Archives of Applied Science Research. 3(3): 167-176.
Hejazi, S. H. et al., 2010. Evaluation of Knowledge,Attitude and Performance of the Mothers
of Children Affected by Cutaneous Leishmaniasis. Infectious Diseases: Research and
Treatment, Volume 3: 35-40.
Ismail, S., Immink, M. & Nantel, G., 2005. Improving Nutrition Programmes.An assessment
tool for action (Revised Edition), Italy: Food and Agriculture Organization of the United
Nations Rome.
Kabaka, S. et al., 2007. An Analysis of the Social MobilizationStrategy to increase Vitamon
A Supplemenatation Covearge through routine Health services-The Case of the Malezi Bora
Strategy in Kenya. Micronutrient Initiative, Nairobi: s.n.
Kariuki, J., 2010. Malezi Bora 2010-Another boost to maternal and child survival in Kenya,
S.l.: UNICEF.
Keith, p. & West, J., 2002. Extent of Vitamin A Deficieny among Preschool Children and
Women of Reproductive Age. Nutrition. 132(9): 2857s-2866s.
Konseiga, A., 2008. Family Migration:A Vehicle of Child Morbidity in the Informal
Settlements of Nairobi City,Kenya, Bonn: Institute for the Study of Labour (IZA).
54
Laurens, W. et al., 2012. Is maternal nutrition knowledge more strongly associated with the
diets of mothers or their children school-aged?. Public Health Nutrition. 15(8): 1396-1401.
Lofti, M., 1988. Growth monitoring:A brief literature review of current knowledge. Food and
Nutrition Bulletin, 10(4).
Khan Khattak, M.M.A. & Ali,S., 2010. Malnutrition and Associated Risk Factors in Pre-
School Children(2-5 years) in District Swabi(NWFP)-Pakistan. Medical Sciences. Volume
10: 34-39.
Kenya National Bureau of Statistics (KNBS)and ICF Macro.2010.Kenya Demographic and
Health Survey 2008-2009.Calverton,Maryland:KNBS and ICF Macro.
Martnez, H. et al., 1996. Mother's knowledge,understanding, and use of the bubble chart in a
rural area of central Mexico, Tokyo: United Nations University.
Mburu, R., 2008. Overview of Malezi bora week, Nairobi: Health Sector Programme in
Kenya.
Miller, J. E. & Rodgers, Y. V., 2009. Mother's Education and Children's Nutritional
Status:New Evidence from Cambodia. Asian Development Review. 26(1): 131-165.
Mwabe, J., 2012. Promoting child’s health through the routine use of local health centres,
s.l.: UNICEF.
Olack, B. et al., 2011. Nutritional Status of Under-five Children Living in an Informal Urban
Settlement in Nairobi,Kenya. Health Population and Nutrition. 29(4): 357-363.
Ongosi, A. N., 2010. Nutrient Intake and Nutrition Knowledge of Lactating Women (0-6)
months postpartum) in a Law Socio-Economic Area in Nairobi,Kenya, Pretoria: University of
Pretoria.
Onis, M. d., 2003. The World Health Organization Global Database on Child Growth and
Malnutrition:methodology and applications. International Journal of Epidemiology.32(4):
518-526.
World Health Organization, 1995. Physical Status:The use and interpretation of
anthropometry:, Geneva: report of a WHO expert committee, WHO technical report
series;854.
55
Piya, L., Maharjan, K. L. & Joshi, N. P., 2011. Livelihood Strateries of Indigenous
Nationalities in Nepal:A Case of Chepangs. Journal of International Development and
Cooperation. 77(2): 100-101.
Pradmore, P. & Hill, C. R., 2009. Addressing the Underlying and Basic Causes of Child
Undernutrition in Developing Countries:What Works and Why?, s.l.: s.n.
Schofield, L., 2009. Report of Baseline Nutrition Assessment in the Slums pf Nairobi East
and North Districts,Nairobi Kenya, Nairobi: Concern World wide.
Taffa, N. & Chepngeno-Langat, G., 2005. Determinants of health care seeking for childhood
illnesses in Nairobi slums. Tropical Medicine and International Health. 10(3); 240-245.
Tanumihardjo A, S., 2004. Assessing Vitamin A Status:Past,Present and Future.
Nutrition.134(1): 290s-293s.
Tirfe, M., 2006. The role of Maternal characteristics on nutritional status of Ethiopian
Children, Addis Ababa: S.N.
UNICEF, 2013. Improving Child Nutrition:The achievable imperative for progress, New
York: United Nations.
United Nations Children's Fund (UNICEF), 2012. The State of the World's Children, New
York: United Nations.
United Nations Children's Fund,World Health Organization, 2012. The World
Bank,UNICEF-WHO-World Bank Joint Child Malnutrition Estimates, s.l.: (UNICEF,New
York;WHO,Geneva;The World Bank,Washington,DC;).
Urrehman, M. & Rana, M. F., 2008. Livelihood strategies of different categories of
households in rural areas of abottabad,Pakistan. Sarhad Agriculture. 24(4): 688-689.
Variyam, J. N. et al., 1999. Mothers'Nutrition Knowledge and Children's Dietary Intakes.
Amercan Agricultural Economics Association. 81(2): 373-384.
Waihenya, E., Kogi-Makau, W. & Muita, J., 1996. Maternal nutritional knowledge and the
nutritional status of preschool children in a Nairobi slum. East Africa Medical. 73(7): 419-23.
Weru, J., 1998. An Inventory of the slums in Nairobi, Nairobi: S.N.
56
WHO UNICEF, W. B., 2009. Immunization:putting vaccines to good use. In: State of the
world's vaccines and immunization. Geneva: World Health Organization: 29-30.
WHO,UNICEF, World Bank., 2009. State of the world's vaccines and immunization, 3rd ed.
Geneva, World Health Organization.
Williams, L. et al., 2012. Is maternal knowledge more strongly associated with the diets of
mothers or thier school-aged children?. Public Health Nutrition. 15(08): 1396-1401.
Wijesinghe.D.G.N.G, P. .. (2010). Nutritional Status of under 5 Year-Old Children and its
Relationshipwith Maternal Nutrition Knowledge in Weeraketiya DS division ofSri Lanka.
Tropical Agricultural Research Vol. 21(4) : 330-339.
Worldwide, C. (2011). Concern Worldwide Nutrition KAP Survey-Terms of
Reference:KAP(Knowledge,Attitude and Practice)Survey for IYCF Pilot Strategies in the
Urban Slums of Nairobi and Kisumu,Kenya.

57
Appendix 1: Study introduction and consent seeking
Hello? My name is I am carrying out research on performance of
malezi bora programme on improving the nutritional knowledge of mothers and nutritional
status of children aged 6-59 months in Kawangware, Dagoretti District, Nairobi County.
Your household has been randomly selected from among many others. The information you
give us will be treated confidentially and your name will not reflect in the main report. It is
voluntary to take part in the survey, but we urge you to participate whole heartedly. Should
you have any questions we will gladly answer you.
Respondent agreed to be interviewed
YES NO
Signature of interviewee ______________ Date _________________
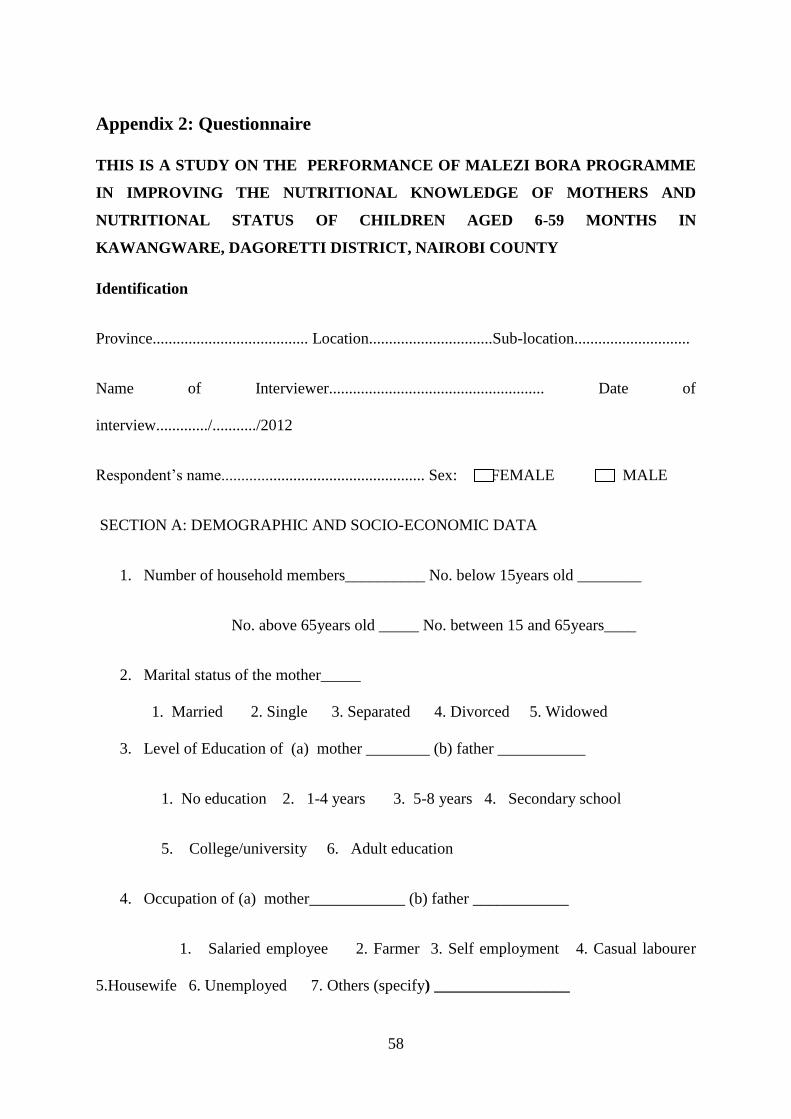
58
Appendix 2: Questionnaire
THIS IS A STUDY ON THE PERFORMANCE OF MALEZI BORA PROGRAMME
IN IMPROVING THE NUTRITIONAL KNOWLEDGE OF MOTHERS AND
NUTRITIONAL STATUS OF CHILDREN AGED 6-59 MONTHS IN
KAWANGWARE, DAGORETTI DISTRICT, NAIROBI COUNTY
Identification
Province....................................... Location...............................Sub-location.............................
Name of Interviewer...................................................... Date of
interview............./.........../2012
Respondent’s name................................................... Sex: FEMALE MALE
SECTION A: DEMOGRAPHIC AND SOCIO-ECONOMIC DATA
1. Number of household members__________ No. below 15years old ________
No. above 65years old _____ No. between 15 and 65years____
2. Marital status of the mother_____
1. Married 2. Single 3. Separated 4. Divorced 5. Widowed
3. Level of Education of (a) mother ________ (b) father ___________
1. No education 2. 1-4 years 3. 5-8 years 4. Secondary school
5. College/university 6. Adult education
4. Occupation of (a) mother____________ (b) father ____________
1. Salaried employee 2. Farmer 3. Self employment 4. Casual labourer
5.Housewife 6. Unemployed 7. Others (specify) _________________

59
5. What is the household’s main source of income (Livelihood)?
1. Animal and animal product sales 2. Casual labour 3. Salaried or waged
4. Begging 5. Gifts 6. Trade 7. Crop sale 8. Remittances 9.Other
(specify)______
6. What is the household’s average monthly income? ________________
7. How is your household income distributed among the uses listed in the table below
[using proportional piling method- use 100 seeds]
SECTION B: MORBIDITY; Q9-Q13
8. Has your child been sick in the last two weeks?
1. Yes 2. No
9. If yes, how many times? _________________
10. How many days in each occasion? _____________
11. Did you seek healthcare assistance when child was sick?
1. Yes 2. No
13. If yes, where? ____________
1. Own medication 2. Traditional healer 3. Private clinic/ Pharmacy
Food (%)=1 Health care (%)=2 Others (%=3)
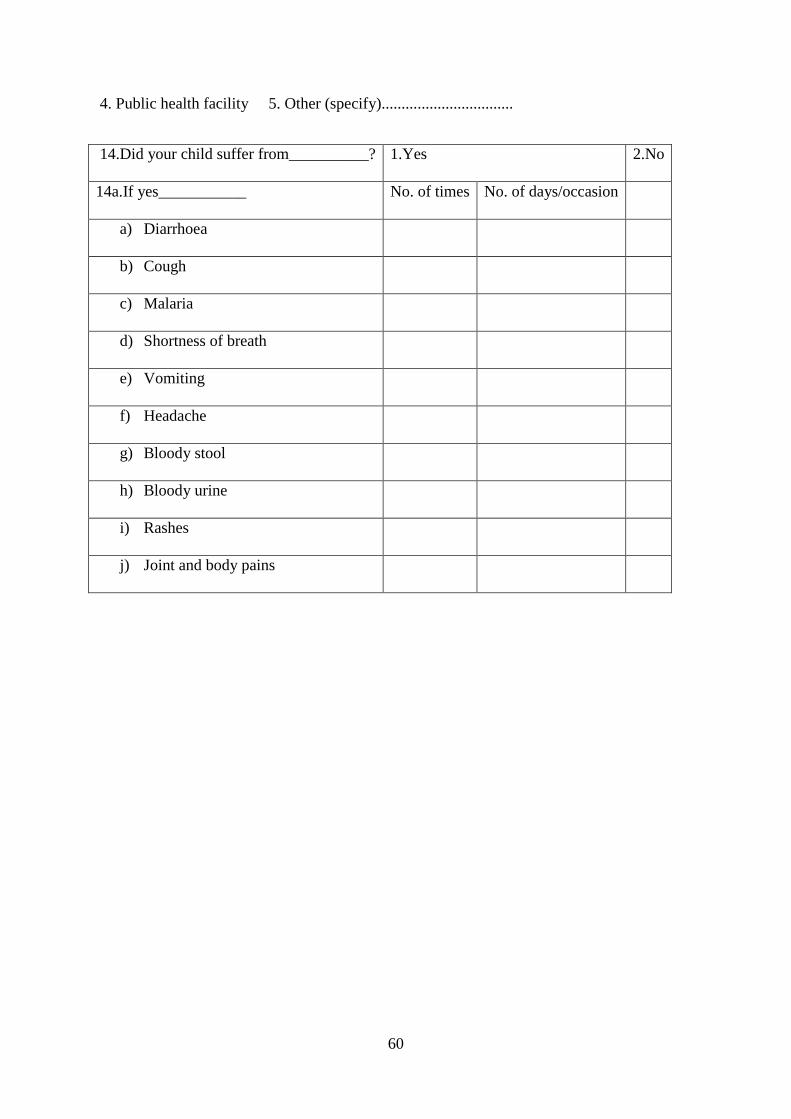
60
4. Public health facility 5. Other (specify).................................
14.Did your child suffer from__________? 1.Yes 2.No
14a.If yes___________ No. of times No. of days/occasion
a) Diarrhoea
b) Cough
c) Malaria
d) Shortness of breath
e) Vomiting
f) Headache
g) Bloody stool
h) Bloody urine
i) Rashes
j) Joint and body pains
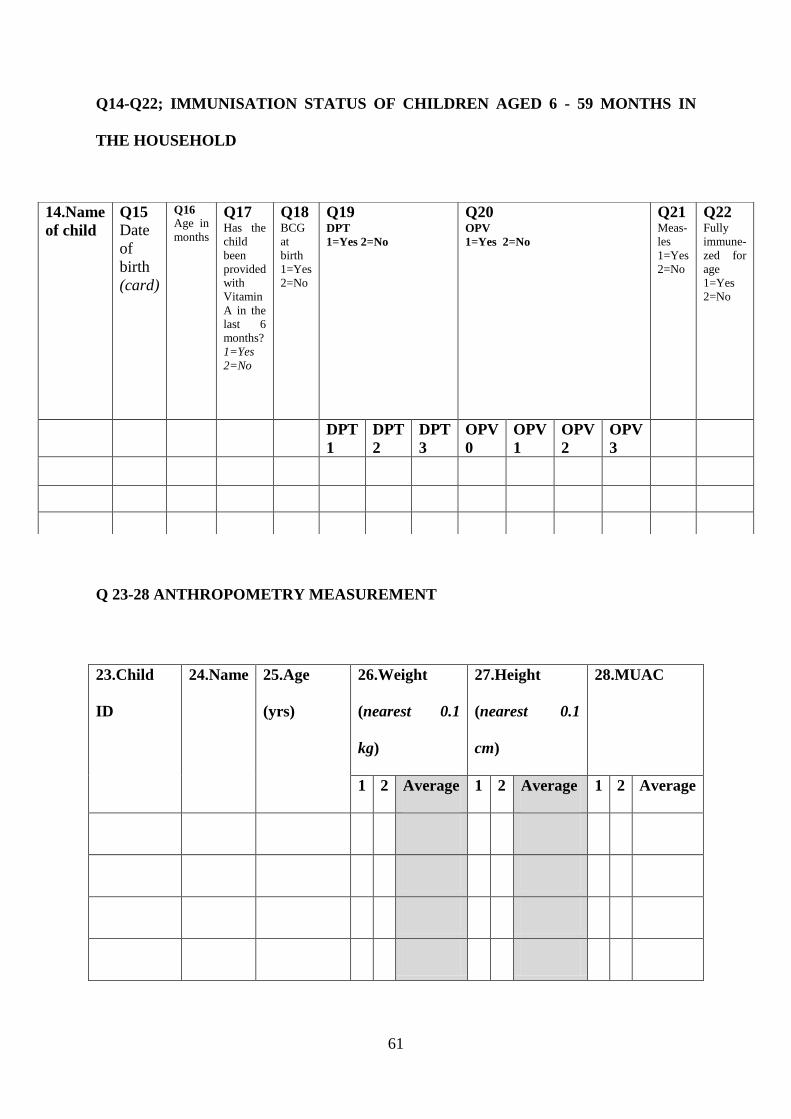
61
Q14-Q22; IMMUNISATION STATUS OF CHILDREN AGED 6 - 59 MONTHS IN
THE HOUSEHOLD
Q 23-28 ANTHROPOMETRY MEASUREMENT
14.Name
of child
Q15
Date
of
birth
(card)
Q16
Age in
months
Q17 Has the
child
been
provided
with
Vitamin
A in the
last 6
months?
1=Yes
2=No
Q18 BCG
at
birth
1=Yes
2=No
Q19
DPT
1=Yes 2=No
Q20 OPV
1=Yes 2=No
Q21 Meas-
les
1=Yes
2=No
Q22 Fully
immune-
zed for
age
1=Yes
2=No
DPT
1
DPT
2
DPT
3
OPV
0
OPV
1
OPV
2
OPV
3
23.Child
ID
24.Name 25.Age
(yrs)
26.Weight
(nearest 0.1
kg)
27.Height
(nearest 0.1
cm)
28.MUAC
1 2 Average 1 2 Average 1 2 Average
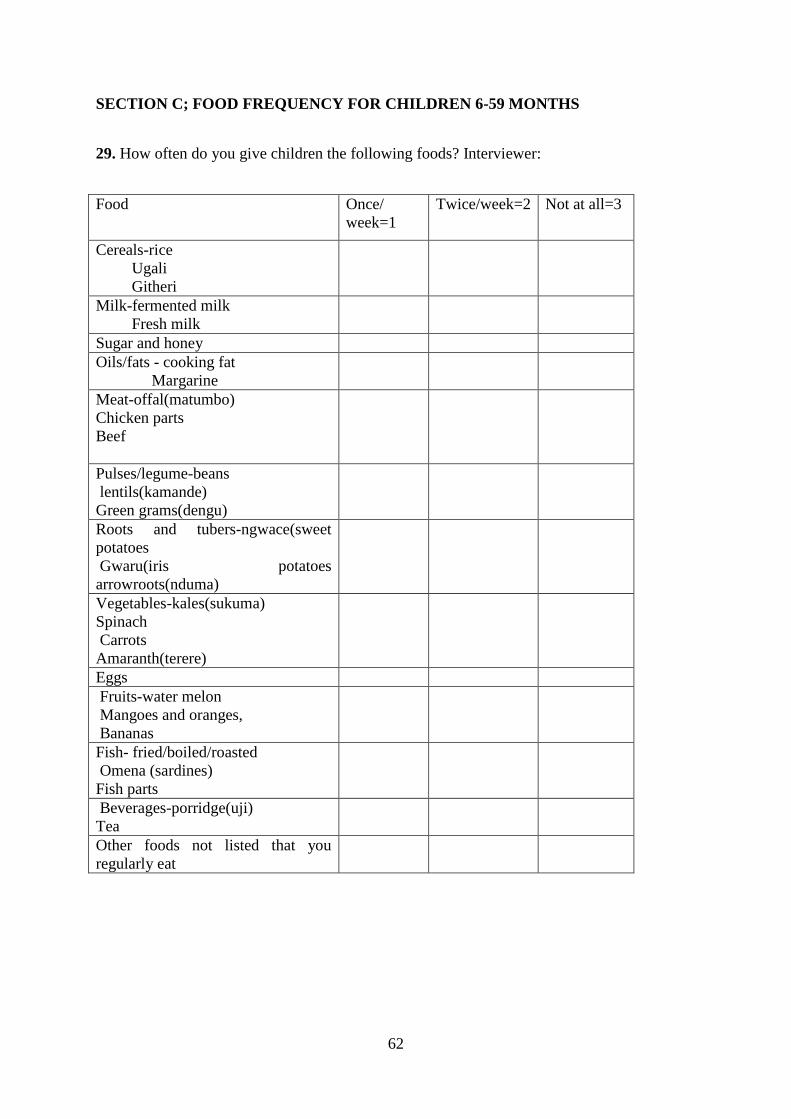
62
SECTION C; FOOD FREQUENCY FOR CHILDREN 6-59 MONTHS
29. How often do you give children the following foods? Interviewer:
Food Once/
week=1
Twice/week=2 Not at all=3
Cereals-rice
Ugali
Githeri
Milk-fermented milk
Fresh milk
Sugar and honey
Oils/fats - cooking fat
Margarine
Meat-offal(matumbo)
Chicken parts
Beef
Pulses/legume-beans
lentils(kamande)
Green grams(dengu)
Roots and tubers-ngwace(sweet
potatoes
Gwaru(iris potatoes
arrowroots(nduma)
Vegetables-kales(sukuma)
Spinach
Carrots
Amaranth(terere)
Eggs
Fruits-water melon
Mangoes and oranges,
Bananas
Fish- fried/boiled/roasted
Omena (sardines)
Fish parts
Beverages-porridge(uji)
Tea
Other foods not listed that you
regularly eat

63
SECTION C: WATER, SANITATION AND HEALTH FACILITIES
Q30a What is your main source of drinking water? ________
1 =Tap 2 =Borehole (protected) 3=Borehole (not protected) 4=River 5= Well
(not protected) 6= Well (protected) 7= spring 8 =rain water 9=Other
(specify)..
Q30b Do you treat your drinking water? __________ 1=Yes 2=No
Q30c If Yes in Q14b how do you treat your water? _____________
1=boiling, 2=expose it to the sun, 3=use chemicals (water guard), 4=filters/sieves
5=other (specify)...................
Q31a Presently, how much water do you use for domestic purposes in litres per day?
______it’s; 99 = have plenty flowing/tap water
Q31b How far is the water source to and fro including waiting time? ___________minutes
Q31c Which means of transport do you use to get there? _____________
1. =Walking 2. =Bicycle ride 3. = Matatu ride 4= Motorcycle 5: Cart
6. = Others (specify) _________________
Q32 What kind of toilet facility does your household use? ___________
1= Traditional pit latrine 2== Ventilated improved latrine
3=None/Bush/Field 4=other (specify).........................

64
Q33 What health care facilities/ services do you have access to?
1= Public hospital/health centre 2=Private hospital/health centre 3=none
4=other (specify)............................
Q34 How far is the nearest health facility, where you get your services? ________minutes
SECTION D; NUTRITION KNOWLEDGE
Q35a Have you ever heard of Malezi Bora?1= Yes2=No________________
Q36b If yes from where? _____________________________
Q37 what do you know about Malezi Bora? __________________
Q38 Are you aware of any malezi bora activities? 1=Yes 2=NO
Q39 what nutrition messages do you know in relation to child care practices?
__________________
Q40 Do you take your child to the clinic after measles injection for weighing? 1=Yes 2=No
Q41 Have you ever participated in Malezi Bora campaign? 1=yes 2=No
Q42 what are the main sources of vitamin A? ________________________________
Q43 what are the sources of proteins? ______________________________________
Q44 what is a balanced diet? ____________________________________________
Q45a Do you deworm your child? 1= Yes2=No___________________________________
Q45b If yes how often? __________________________________________________
Q46c where do you get the dewormers from? 1=Healthy facility 2=shop 3=pharmacy

65
Appendix 3: Focused group discussion Guide
Name of moderator________________________ Date__________________
Name of recorder__________________________ Place__________________
No Name of participant Occupation Marital
status
Number of
under
fives
Nutrition
knowledge
1
2
3
4
5
6
7
8
9
10
Question guideline:
What do you understand about nutrition?
1. Is nutrition essential for the growth of your child? 1=yes 2=No
2. If yes how?
3. What is a balanced diet?
4. Name three sources of vitamin A and C?
5. Do you deworm your children? 1=yes 2=No
6. If yes how often?
7. What do you know malezi bora?
8. Name four activities carried out during malezi bora week?
9. Give me two nutritional messages about child care practices?
Thank you for your attention
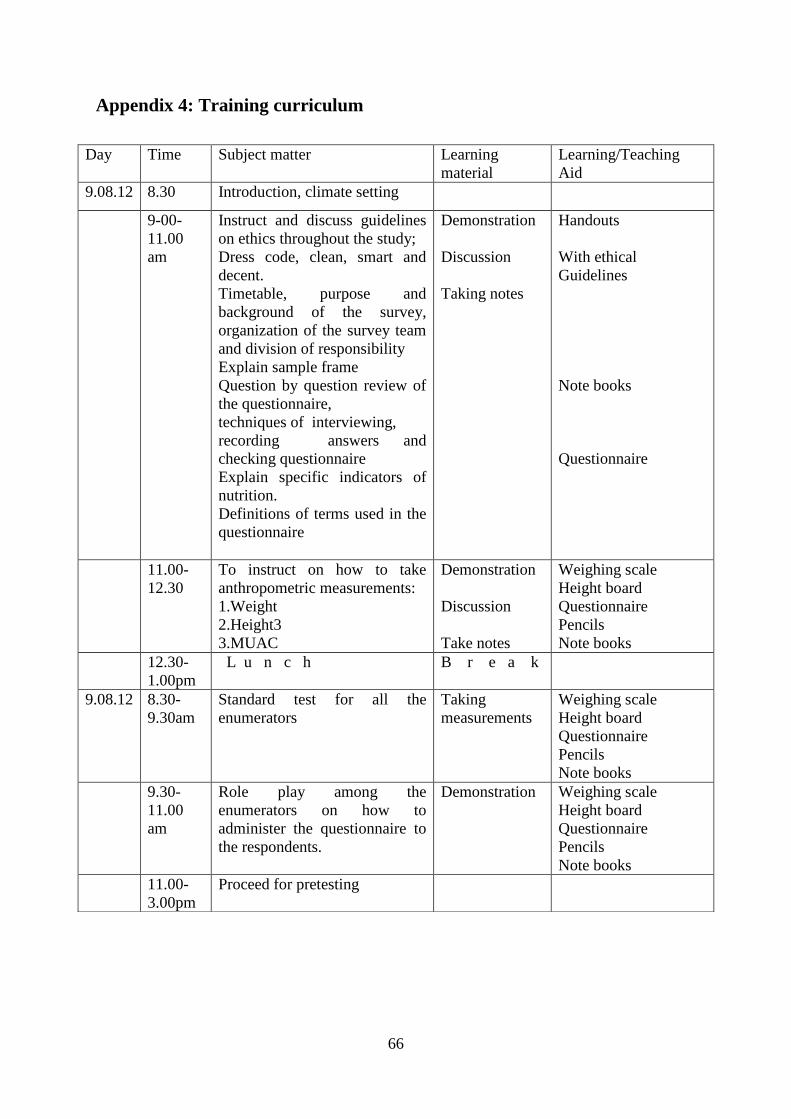
66
Appendix 4: Training curriculum
Day Time Subject matter Learning
material
Learning/Teaching
Aid
9.08.12 8.30 Introduction, climate setting
9-00-
11.00
am
Instruct and discuss guidelines
on ethics throughout the study;
Dress code, clean, smart and
decent.
Timetable, purpose and
background of the survey,
organization of the survey team
and division of responsibility
Explain sample frame
Question by question review of
the questionnaire,
techniques of interviewing,
recording answers and
checking questionnaire
Explain specific indicators of
nutrition.
Definitions of terms used in the
questionnaire
Demonstration
Discussion
Taking notes
Handouts
With ethical
Guidelines
Note books
Questionnaire
11.00-
12.30
To instruct on how to take
anthropometric measurements:
1.Weight
2.Height3
3.MUAC
Demonstration
Discussion
Take notes
Weighing scale
Height board
Questionnaire
Pencils
Note books
12.30-
1.00pm
L u n c h B r e a k
9.08.12 8.30-
9.30am
Standard test for all the
enumerators
Taking
measurements
Weighing scale
Height board
Questionnaire
Pencils
Note books
9.30-
11.00
am
Role play among the
enumerators on how to
administer the questionnaire to
the respondents.
Demonstration Weighing scale
Height board
Questionnaire
Pencils
Note books
11.00-
3.00pm
Proceed for pretesting

67
Appendix 5: Protocol for taking the weight and length/height of the
children
a. Steps to be followed when weighing a child using a hanging spring balance and
pants
1. Explain to the child's mother what you intend to do.
2. Hang the scale from a suitable point such as tree, doorframe, or a stick held from the
shoulders of two people
3. (local men can be enlisted to accompany the team for this specific purpose). The dial on
the scale must be at eye level.
4. Hang the weighing pants from the hook of the scale and check that the needle reads zero.
5. Remove the child's clothes and any jewellery, and place him or her in the weighing pants.
6. Hang the weighing pants, with the child in them, from the hook on the scale.
7. Check that nothing is touching the child or the pants.
8. Read the scale at eye level to the nearest 100 g (0.1kg).
9. Say the number out loud.
10. The assistant should repeat the weight out loud so that everyone can hear, and write the
weight on the datasheet.
b. Steps to be followed when measuring the length/.height using the height board
1. Explain the procedure to the child's mother or caregiver.
2. Remove the child's shoes and any hair ornament or knot on the child's head.
3. Place the child gently onto the board on his/her back, with the head against the fixed
vertical part and the soles of the feet near the cursor or moving part.
4. The child should lie straight in the middle of the board, looking directly up.
5. The assistant should hold the child's head firmly against the base of the board.
6. The measurer places one hand on the knees (to keep the legs straight), leaving the child's
feet flat against the cursor with the other, and pushing the cursor against the feet firmly
but gently.
7. The measurer reads and announces the length to the nearest 0.1cm.
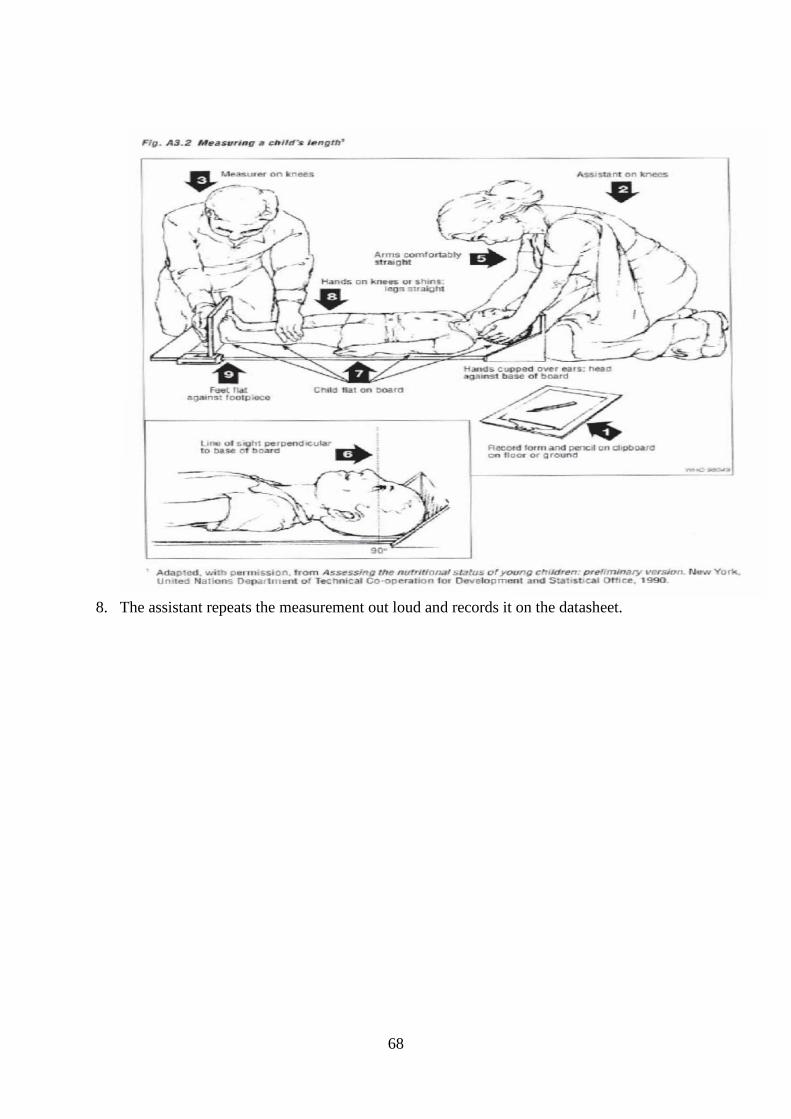
68
8. The assistant repeats the measurement out loud and records it on the datasheet.
69


