Download - NUTRIENTS, TROPHIC STATE, AND ECOSYSTEM HEALTH: perspectives from ecosystem ecology Michelle Baker

NUTRIENTS, TROPHIC STATE, AND
ECOSYSTEM HEALTH:
perspectives from ecosystem ecology
Michelle Baker

Organisms are part of a physical, chemical and biological system inwhich energy flow andmaterial cycles are important functions.
Chapin et al. 2004

APPROACHES IN ECOSYSTEM ECOLOGY
Observations
N2O
(µg
l-1)
0
600
1200
0 1530 60 90 120
Time (min)
0.14 µg N l-1 s-1
Baker and Jeffs published in Hall et al. 2009, L+O

APPROACHES IN ECOSYSTEM ECOLOGY
Experiments
Hochhalter et al. in prep, Ecol. Mon.

APPROACHES IN ECOSYSTEM ECOLOGY
Models
DIN
sequestrationas PON
algal uptake
PON burial
DIN
denitrification
N fixation
DINDONPON
Littoraluptake
DONPON
regeneration
GW inputs
GW inputs
Long nutrient spiralsShort nutrient spirals
INFLOW LAKE OUTFLOW
DIN plungetemperature dependent
PON, DON

NUTRIENTS: THE UNDERBELLY OF GLOBAL CHANGE
Nir Elias/Reuters
Work in the Baker lab focuseson nutrient cycling processesin streams and rivers.
These processes affect water quality for use by humansand other organisms.
Bioavailable nutrients are increasing globally, threatening water quality and the life that depends on it.

• Nutrients required for all life
• Reactive nutrients increasing globally
• Cycling is complex; impairment can occur below toxic levels
• Sources (and thus management options) extend beyond watershed boundaries
• Opportunities to foster interdisciplinary research – we measure attributes of stream health!
NUTRIENTS: THE UNDERBELLY OF GLOBAL CHANGE
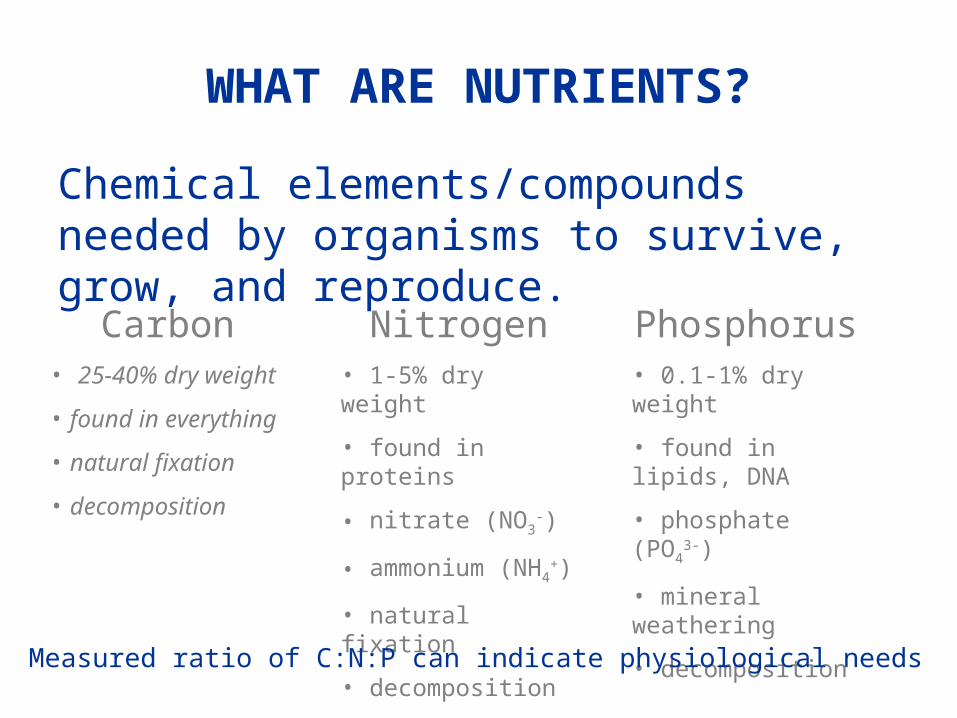
Chemical elements/compounds needed by organisms to survive, grow, and reproduce.
Nitrogen• 1-5% dry weight
• found in proteins
• nitrate (NO3-)
• ammonium (NH4
+)
• natural fixation
• decomposition
Phosphorus• 0.1-1% dry weight
• found in lipids, DNA
• phosphate (PO4
3-)
• mineral weathering
• decomposition
Carbon• 25-40% dry weight
• found in everything
• natural fixation
• decomposition
Measured ratio of C:N:P can indicate physiological needs
WHAT ARE NUTRIENTS?

AtmosphereLithosphereSoilsOcean (dissolved)Terrestrial biomassOcean biomass
79.6%20.4%0.006%0.002%0.00007%0.00001%
0.000005%7.3%61.1%30.5%0.032%0.99%
Key point: Most are NOT biologically available
data from Schlesinger 1997
Nitrogen Phosphorus
WHERE ARE MOST OF THE NUTRIENTS?

Nitrogen : natural fixation, lightening, decomposition,
combustion, Haber-Bosch, legume crops
Phosphorus: chemical weathering, decomposition, mining
HOW DO NUTRIENTS BECOME BIOLOGICALLY AVAILABLE?

Human activity has morethan doubled the amountof “reactive” nitrogencycling globally.
• Haber-Bosch process• N-fixing crops• N oxide formation from combustion
HUMANS INCREASE NUTRIENT AVAILABILITY

Falkowski et al. 2000 Nature
Human activity has quadrupled the amount of “reactive” phosphoruscycling globally.
Phosphate mining production
HUMANS INCREASE NUTRIENT AVAILABILITY
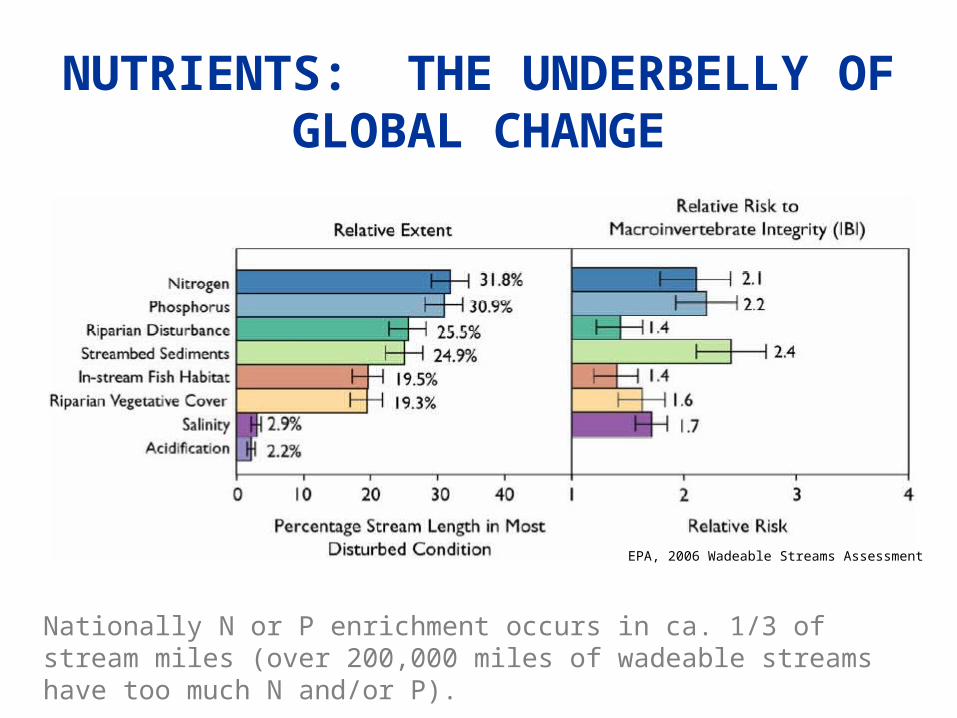
Nationally N or P enrichment occurs in ca. 1/3 of stream miles (over 200,000 miles of wadeable streams have too much N and/or P).
EPA, 2006 Wadeable Streams Assessment
NUTRIENTS: THE UNDERBELLY OF GLOBAL CHANGE

AquaticLife
DO
pH
Habitat
Food
Plant/Algal Growth
MicrobialGrowth
Nutrients
LightFlow
Temperature Substrate
Water ChemistryHerbivory
Competition
Recreation
PathogensDrinking
Credit: Mike Paul, Tetra Tech
Linkages among nutrients, biota, and designated uses
Trophic State
OH WHAT A TANGLED WEB…

TROPHIC STATE
Associated Press (2008)
Autotroph (self-feeder)
Heterotroph (other-feeder)

TROPHIC STATE
Wayne Wurtsbaugh 2000
Oligotrophic
Eutrophic

• Trophic state often characterized by chlorophyll; but production depends on biomass AND activity.
• Heterotrophic state not often considered. Driven by organic matter supply.
• Both autotrophic and heterotrophic states affected by temperature AND nutrients.
TROPHIC STATE IN STREAMS
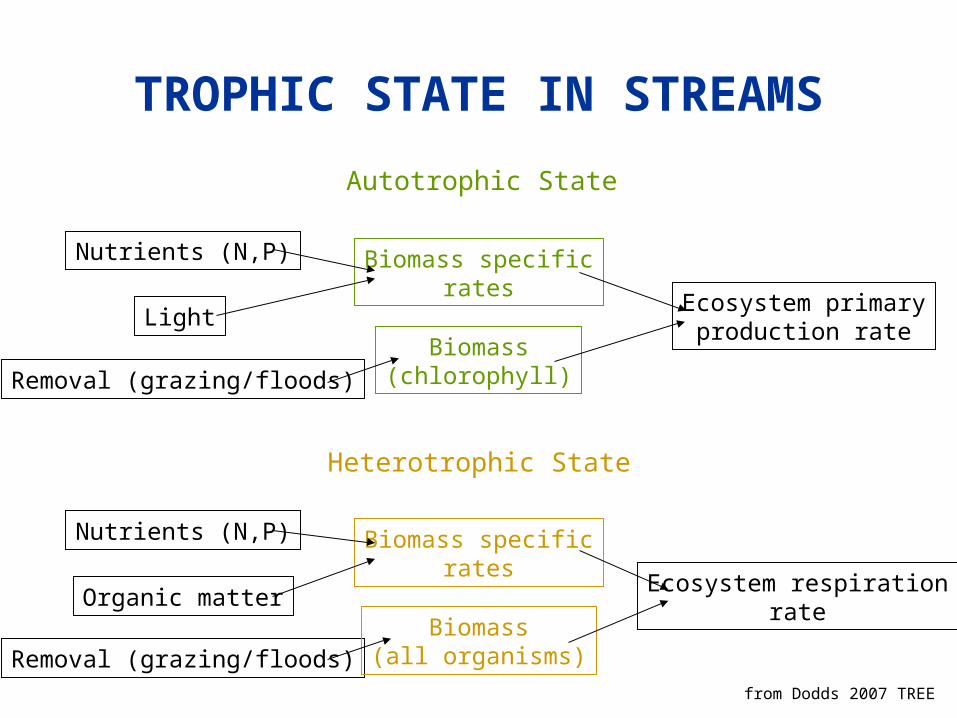
Nutrients (N,P)
Light
Removal (grazing/floods)
Biomass specificrates
Biomass(chlorophyll)
Ecosystem primaryproduction rate
Nutrients (N,P)
Removal (grazing/floods)
Organic matter
Biomass specificrates
Biomass(all organisms)
Ecosystem respirationrate
from Dodds 2007 TREE
Autotrophic State
Heterotrophic State
TROPHIC STATE IN STREAMS

THINGS WE MEASURE THAT ARE INDICATORS OF STREAM HEALTH IN THE CONTEXT OF NUTRIENTS AND TROPHIC STATE THAT ARE IMPORTANT FOR SUSTAINABILITY OF WATER RESOURCES…

nutrients
C, N, P
ECOSYSTEM METABOLISM
Time of day
Dis
solv
ed O
2 (
mg/
L)
2
4
6
8
10
12
14
16
00:00 10:00 20:00 06:00
photo sources: National Geographic, NABS, Microbe zoo
Dissolved oxygen record
time of day
Small increases in nutrients stimulateprimary production, respiration.

Elapsed time (h)
0 20 40 60 80
Dis
solv
ed
Oxy
gen
(%
sa
tura
tion)
40
60
80
100
120
140
160
2100 SCudahy Lane
Jordan River data, August 2006, courtesy of E. Duffindata plotted after Dodds 2007 TREE
net photosynthetic
respiration
2100 S is net autotrophicP>R
Cudahy Lane is netheterotrophic P<R
Either Cudahy Lane hasless autotrophic activity,more heterotrophic activityor both.
ECOSYSTEM METABOLISM

BIOCHEMICAL OXYGEN DEMAND (BOD)
N-BOD•nitrogenous
oxygen demand
•autotrophic bacteria
•heterotrophs can outcompete nitrifyers for NH4
+ C-BOD•carbonaceous
oxygen demand
BOD5
•biochemical oxygen demand in a bottle incubated at 25 C in dark for 5 days
• includes organic matter oxidation AND inorganic matter oxidation

Nutrient treatment
NO3 NH4 SRP N+P
BO
D a
s %
co
ntr
ol (
me
an
+ S
D)
0
100
200
300
400
500
600
Logan RLittle Bear RCutler ResBear Lake
BIOCHEMICAL OXYGEN DEMAND (BOD)
Nutrients can stimulateoxygen consumption.
Reed and Baker, 2010 (unpublished)
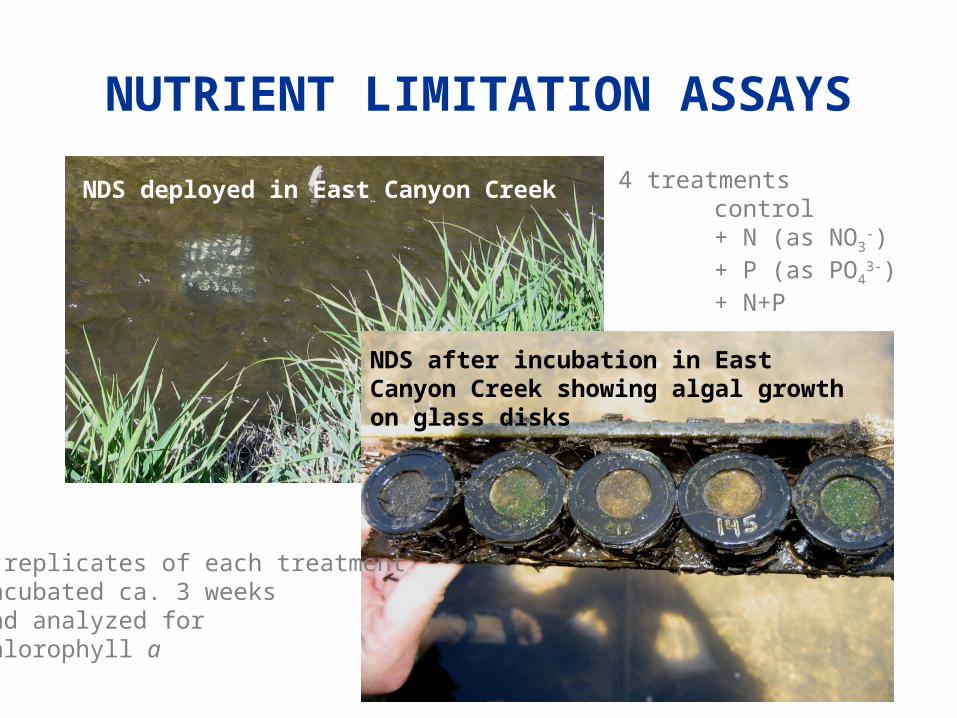
NDS deployed in East Canyon Creek
NDS after incubation in East Canyon Creek showing algal growth on glass disks
4 treatmentscontrol+ N (as NO3
-)+ P (as PO4
3-)+ N+P
5 replicates of each treatmentincubated ca. 3 weeksand analyzed for chlorophyll a
NUTRIENT LIMITATION ASSAYS
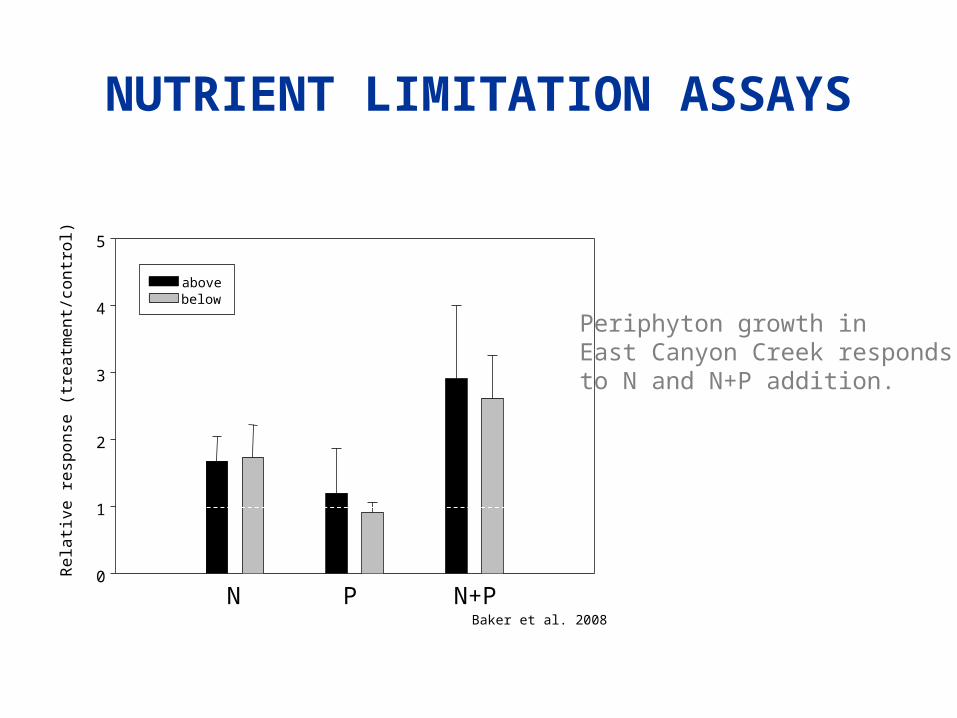
Re
lativ
e r
esp
on
se (
tre
atm
en
t/co
ntr
ol)
0
1
2
3
4
5
above below
N P N+P
Periphyton growth in East Canyon Creek respondsto N and N+P addition.
NUTRIENT LIMITATION ASSAYS
Baker et al. 2008
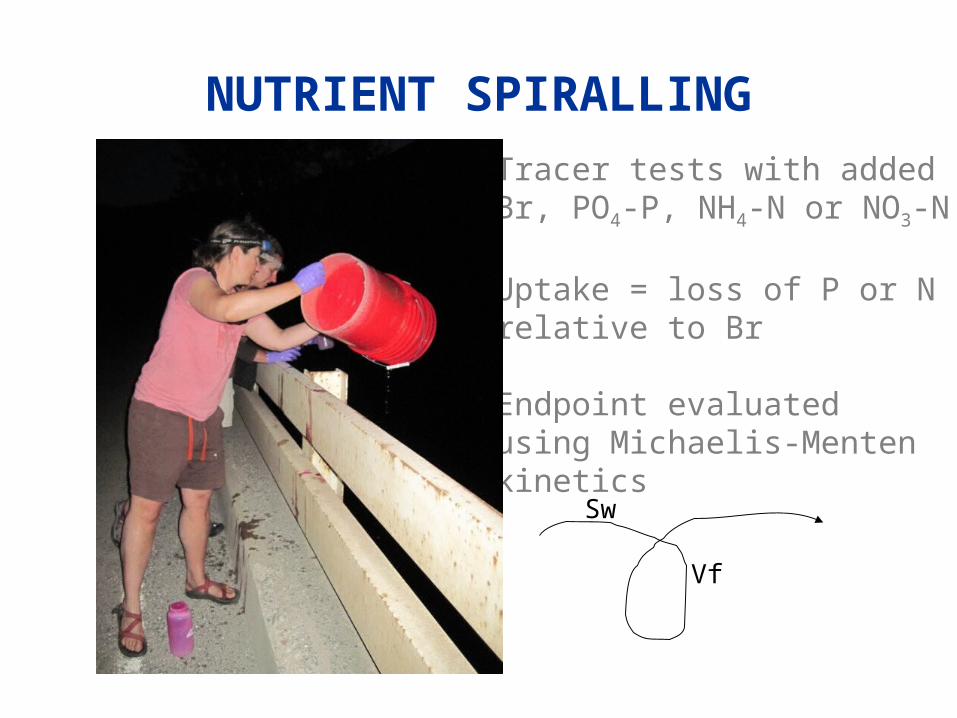
NUTRIENT SPIRALLINGTracer tests with addedBr, PO4-P, NH4-N or NO3-N
Uptake = loss of P or Nrelative to Br
Endpoint evaluatedusing Michaelis-Mentenkinetics
Sw
Vf

NUTRIENT SPIRALLING
Sw, NH4 – 833 mVf, NH4 – 28 mm/min
Sw, NO3 - 2062 mVf, NO3 – 11 mm/min
1680 m
3360 m
5880 m 8040 m
Baker et al. 2010, unpublished
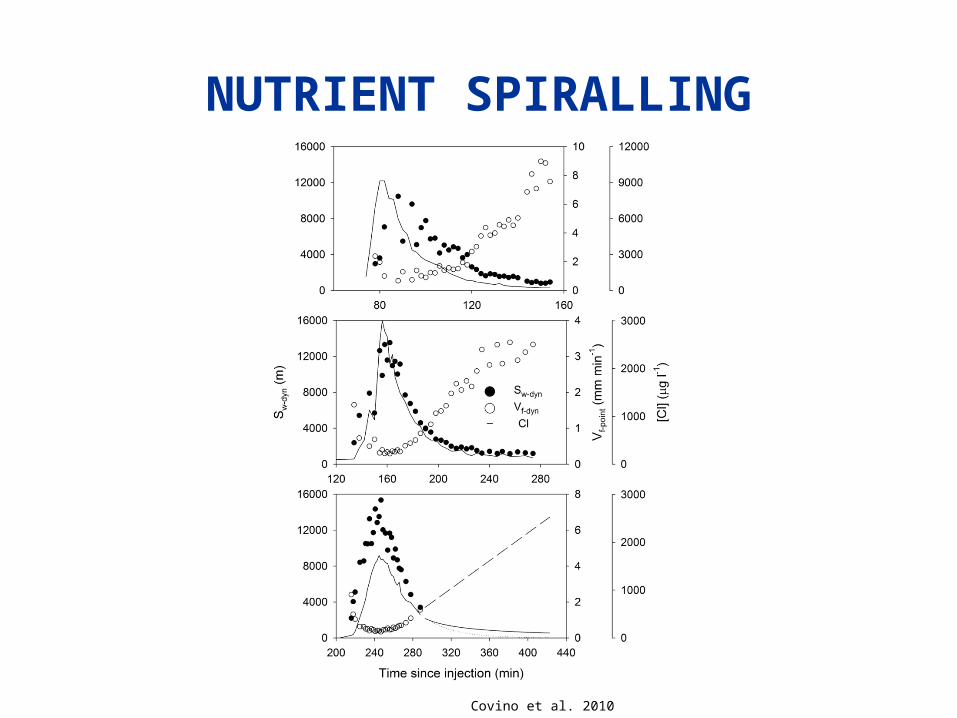
NUTRIENT SPIRALLING
Covino et al. 2010
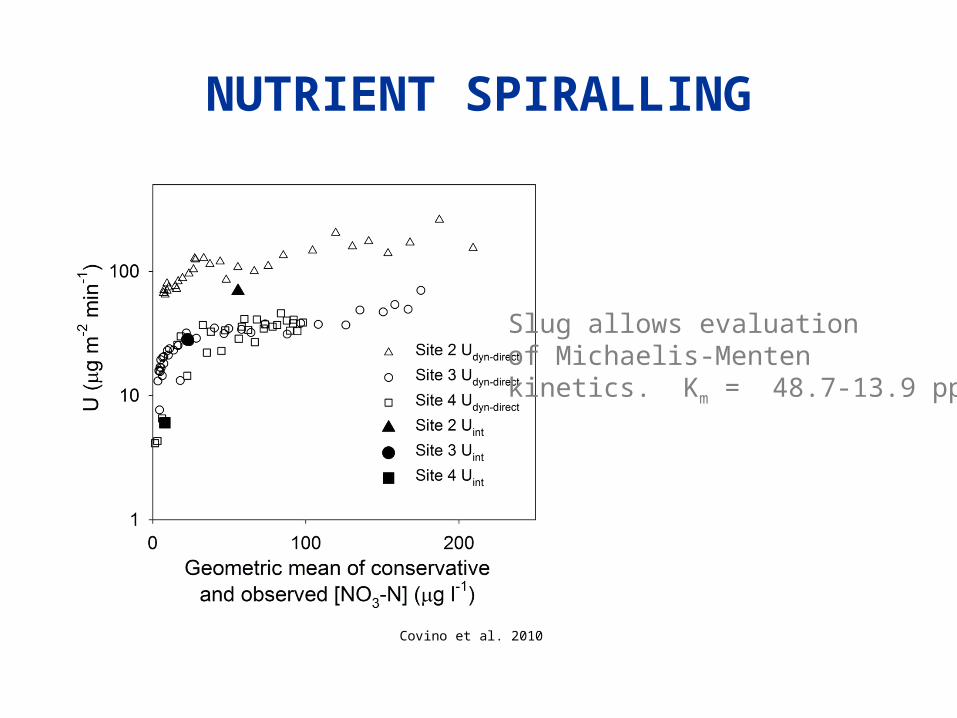
Slug allows evaluationof Michaelis-Mentenkinetics. Km = 48.7-13.9 ppb
Covino et al. 2010
NUTRIENT SPIRALLING

We use a combination of tools and ideas from ecology, biogeochemistry, hydrology, and microbiology to understand processes that control nutrients in streams and rivers.
These processes describe stream functioning (health).

Lab GroupC. Arp, K. Goodman, S. Hochhalter, A. Myers, S. Vallaire, C. Crenshaw, I. Washbourne, A. Benedetto, J. Crawford, E. Lytle, B. Ombach, J. Reed
Other CollaboratorsM. Gooseff, R. Haggerty, R. Hall, B. McGlynn, E. Rosi-Marshall, J. Tank, W. Wurtsbaugh
FundingNSF EAR 04-09534, NSF DEB 01-32983, 05-19327,09-22153, UT DWQ
ACKNOWLEDGEMENTS


