
1
M E M O R A N D U M
Noise Analysis of the Blue Creek Wind Farm Project TO: Heartland Wind, LLC Blue Creek Project Team
FROM: Mark Bastasch, P.E./CH2M HILL
DATE: December 14, 2009
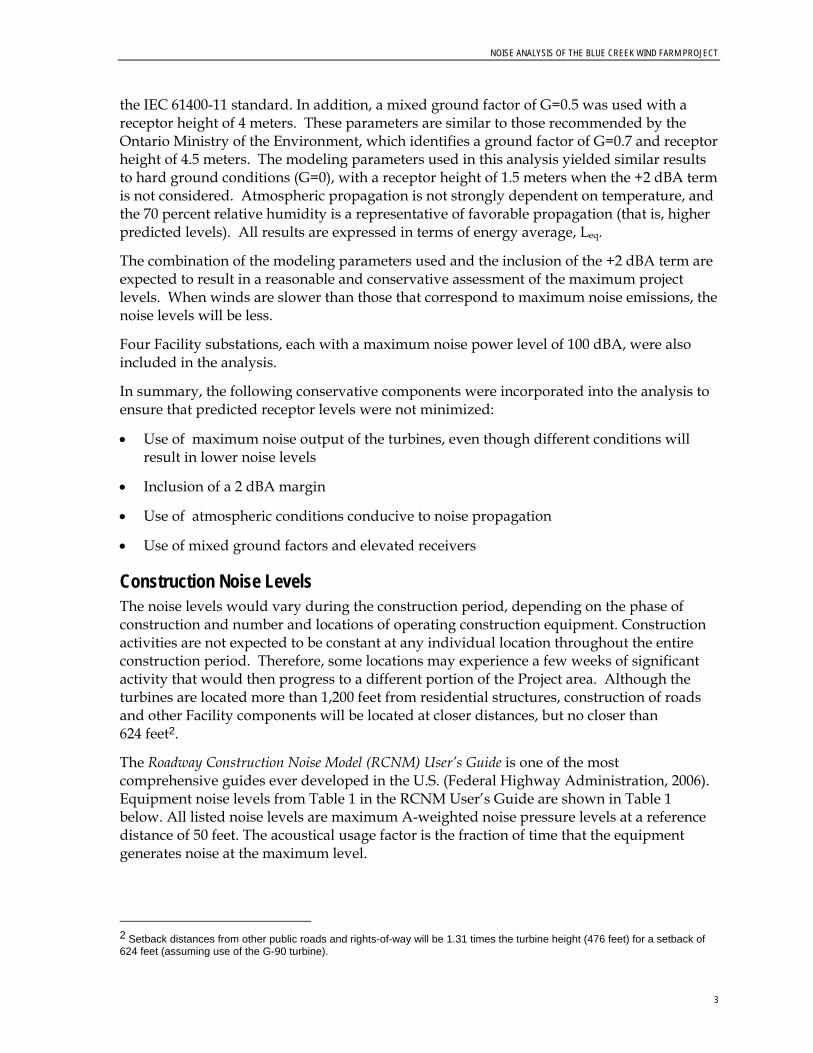
Summary This memorandum documents a noise analysis conducted for Heartland Wind, LLC’s proposed Blue Creek Wind Farm (the Facility) in Paulding and Van Wert counties, Ohio. This assessment covered 167 Gamesa G90 wind turbines (G-90) on 100- meter-tall towers and the associated electrical substations, as shown in Figure 11. Once the final turbine locations have been identified, the noise analysis will be updated. The expected operational noise levels predicted at residences within the Project area range from less than 30 dBA to 53 dBA (these results are inclusive of a +2 dBA adjustment). An introduction to acoustics and technical vocabulary is presented in Attachment A.
Methods Standard acoustical engineering methods were used in this analysis. The noise propagation factors used were adopted from ISO 9613-2, Acoustics—Sound Attenuation During Propagation Outdoors, Part 2: General Method of Calculation (International Organization for Standardization [ISO], 1993) and VDI 2714, Outdoor Sound Propagation (Verein Deutscher Ingenieure [VDI], 1988). Atmospheric absorption for conditions of 10°C and 70 percent relative humidity (conditions that favor propagation) was computed in accordance with ISO 9613-1, Acoustics—Sound Attenuation During Propagation Outdoors, Part 1: Calculation of the Absorption of Sound by the Atmosphere (ISO, 1993).
Each wind turbine was considered to have an overall noise power level of 108.4 dBA and was modeled on an octave band basis for the nine standard octave bands from 31.5 to 8000 Hz. This overall noise power level represents the maximum turbine noise level determined in accordance with IEC61400-11, Wind Turbine Generator Systems—Part 11: Acoustic Noise Measurement Techniques (International Electrotechnical Commission [IEC], 2006) and includes a +2 dBA adjustment to account for typical vendor warranty, uncertainty or declared noise power levels. Although it is statistically unlikely that all of the turbines would simultaneously exceed the expected maximum value of 106.4 dBA, the +2 dBA adjustment was included in the modeling as a conservative measure. This maximum noise power level used in this analysis is realized at wind speeds of 6 meters per second (m/s) (13.4 mph) or greater. The 6 m/s wind speed is referenced to a 10-meter (32.8 feet) height, which is equivalent to a hub height wind speed of 8.7 m/s (19.5 mph) in accordance with 1 The proposed Facility will have up to 175 turbines, for a maximum potential output of 350 megawatts. The specific locations for 167 turbines and other related Facility infrastructure are identified in Figure 1. An additional eight turbines will be located in an area along the eastern portion of the project area boundary. The Applicant will provide the locations of these turbines in the shaded area on Figure 1 with appropriate site-specific information by April 1, 2010 in sufficient time for the Ohio Power Siting Board (OPSB) staff to consider the information in the Staff Report.

R I D G ER I D G E
W A S H I N G T O NW A S H I N G T O N
W A S H I N G T O NW A S H I N G T O N
M O N T E R E YM O N T E R E Y
B E N T O NB E N T O N
H O A G L I NH O A G L I N
P L E A S A N TP L E A S A N T
J E N N I N G SJ E N N I N G S
B L U E C R E E KB L U E C R E E K
J A C K S O NJ A C K S O N
J A C K S O NJ A C K S O N
H A R R I S O NH A R R I S O NB R O W NB R O W N
M O N R O EM O N R O EJ A C K S O NJ A C K S O N
L A T T YL A T T Y
P A U L D I N GP A U L D I N G
J E N N I N G SJ E N N I N G S
U N I O NU N I O N
P E R R YP E R R Y
M A R I O NM A R I O N
T U L L YT U L L Y
H A R R I S O NH A R R I S O N
LATTY
PAYNE
CLOVERDALE
BROUGHTON
FORTJENNINGS
OTTOVILLE
CONVOY
MIDDLEPOINT
SCOTT
VANWERT
DUPONT
HAVILAND
DELPHOS
MELROSE
GROVERHILL
OAKWOOD
PUTNAMALLEN
PAULDING
PUTNAMVAN WERT
PU
TNA
MPA
ULD
ING
ALL
EN
VAN
WE
RT
VAN WERT
1111
550550
101
101
HHooff ff mmaa nn
Whittern
Whittern
LortieLortie
Cla
yton
Cla
yton
MonroevilleMonroeville
RiderRider
BarkleyBarkley
FlatrockFlatrock
Snyder
Snyder
TT
Moore
Moore
1111 5500
Mcardle
Mcardle
Becker
Becker
FahlsingFahlsing
Sampson
Sampson
Gustin
Gustin
HaleyHaley
Bellmon
t
Bellmon
t
850850
950950
OOlldd UUss HHwwyy 3300
900900
GromeauxGromeaux
Daw
sonD
awson
1111 00 00
PiquaPiqua
Row
eR
owe
VanderlyVanderly
750750
10501050
500
500
HoaglandHoagland
BakerBaker
600
600
400400
PauldingPaulding
MaplesMaples
CarrierCarrier
600600
GGaarr CCrr eeee kk
BremerBremer
Roussey
Roussey
HoweHowe
C C
EdgertonEdgerton
Roy
Roy
RorickRorick
101
101
BaldwinBaldwin
CC
MonroeMonroe
100
100
SSttaaddiiuumm
SlusherSlusher
TillmanTillman
Morgan
Morgan
700
700
300
300
600
600
200
200
Martin
Martin
TernetTernet
MMaass ss
ii ll oonn
4949
11 6
697116
637
49
697118
66
63 7
634
114
66
613
189
634
190
613
613
114
49
637
500
114
613
114
49
114
500
66
66
500
613
613
49
101
14
101
30
MMII DDDDLL EE PPOOII NNTT
MA
RS
HM
AR
SH
JENNINGS
JENNINGS
WETZELWETZEL
CCOO
NNVV
OOYY
HHEE
LLLL
EERR
CHURCHCHURCH
FOXFOX
VEACHVEACH
WOODLANDWOODLAND
LEESONLEESON
GRILLGRILL
VVAANN WW EERRTT PPAAUU LLDDII NNGG CCOO LL IINN EE
STATESTATE
PEARSONPEARSON
UPPUPP
VVAANN WW EERRTT PPAA UULL DDIINNGG CCOO LLII NNEE
RIC
HE
YR
ICH
EY
DDUU
TTCC
HH JJ OO
HHNN
TULLYTULLY
LAR
ELA
RE
BO
CK
EY
BO
CK
EY
CONVOYCONVOY
GIL
LILA
ND
GIL
LILA
ND
JJ EE NN NN II NN GG SS DD EE LL PP HHOO SS
FFEE AASSBB YY WW IISS EENNEE RR
EELL MM SSUUGGAA RR
OOLL DD TT IILL EE FFAACCTTOORRYY
MMAAIINN
KKRR
II CCKK
EELL MM SSUUGGAA RR
MMEE
NNTT
ZZEE
RR CC
HHUU
RRCC
HH
J JO OH H
N N B B
R RO O
W WN N
H HO O
A AG G
L LI IN N C C
E EN N
T TE ER R
GERDEMANGERDEMAN
BB RR EE DDEE
II CCKK
DDUU
LLLL
RROO
BBII NN
SSOO
NN
LLIINNCCOOLLNN
FRA
NKL
INFR
AN
KLIN
RE
IDE
NB
AC
HR
EID
EN
BA
CH
STE
MEN
STE
MEN
BA
LLIE
TB
ALL
IET
KKII NN
GGSS
CCHH
UURR
CCHH
SC
OTT
SC
OTT
GGEERRMMAANN CCHHUU RRCCHH
CCOONNVVOOYY
MO
SIE
RM
OS
IER
PAN
CA
KE
PAN
CA
KE
MOHRMOHR
HHAA RRRRIISS OONN CC EENNTT EERR
BRITTSANBRITTSAN
RANKRANK
BA
KE
RB
AK
ER
CH
EN
OW
ITH
CH
EN
OW
ITH
GA
MB
LEG
AM
BLE
HO
AG
LIN
HO
AG
LIN
TAYLORTAYLOR
JJ OOHH
NN YY
OOHH
DDEE
FF II AANN
CCEE
STR
IPE
STR
IPE
AD
AM
SA
DA
MS
BLA
CH
LEY
BLA
CH
LEY
RU
MB
LER
UM
BLE
EMERSONEMERSON
ROBINSONROBINSON
STERLINGSTERLING
WALLACEWALLACE
MCCLEERYMCCLEERY
L LI IT TT TL LE E A A
U UG G
L LA AI IZ ZE E
R RI IV V
E ER R
FOSTER SCHOOLFOSTER SCHOOL
M MI IL LL LE E
R R P P
O OL LI IN N
G G
PALMERPALMER
FLIN
GFL
ING
SH
EN
KS
HE
NK
COLLINSCOLLINS
RIN
GW
ALD
RIN
GW
ALD
GR
EE
NV
ILLE
GR
EE
NV
ILLE
BOWERSBOWERS
KILGOREKILGORE
HATTE
RY
HATTE
RY
SLA
NE
SLA
NE
IRE
LAN
DIR
ELA
ND
MENTZERMENTZER
HO
OK
HO
OK
NACHBARNACHBAR
TUMBLESONTUMBLESON
POEPOE
HARVEYHARVEY
ZOOKZOOK
GALVINGALVINKELTN
ER
KELTNE
R
CARMEANCARMEAN
HU
TCH
INS
ON
HU
TCH
INS
ON
KREISCHERKREISCHER
WALLERWALLER
KIDNERKIDNER
SH
AN
ER
SH
AN
ER
CO
NV
OY-
HE
LLE
RC
ON
VO
Y-H
ELL
ER
UUNNIIOONN PPLL EEAA SSAA NNTT
TERRYTERRY
VVAA
NN HH
OORR
NN
WA
RD
WA
RD
STA
MM
STA
MM
STIR
NST
IRN
RE
IDE
NB
AU
GH
RE
IDE
NB
AU
GH
GE
RM
AN
NG
ER
MA
NN
LEITN
ER
LEITN
ER
SHAWSHAW
OW
EN
SO
WE
NS
DAVISDAVIS
LEHMANLEHMAN
ROUSCHROUSCH
MA
RTZ
MA
RTZ
HESSIANHESSIAN
HEISTHEIST
LL EEAATTHHEERRSS
SPIELESSPIELES
MM OO NN MM OO UU TT HH
PPOOLLLLOOCCKK
FF EEAA SSBBYY WW IISS EENNEERR
CARPENTERCARPENTER
CLA
YW
OR
THC
LAY
WO
RTH
SS LLAACCKK
SPONSELLERSPONSELLER
CCOO
NNVV
EERR
SSEE
RROO
SSEE
LLMM
COOPERCOOPER
VVAANN WW EERRTT-- WWII LLLL SSHHII RREE
WE
RN
ER
WE
RN
ER
GIFFINGIFFIN
MATTHEWSMATTHEWS
KENSLERKENSLERTT UULL LLYY HHAARR RRIISS OONN
WOLFCALEWOLFCALE
FIFEFIFE
MONMOUTHMONMOUTH
SSPP
EENN
CCEE
RRVV
II LLLLEE
DDEE
LLPP
HHOO
SS
CONVOYCONVOY
SID
LESI
DLE
DD II XXOONN CCAAVVEE TTTT
LLIINNCCOOLLNN
HHAA
RRRR
II SSOO
NN WW
II LLLLSS
HHII RR
EE
BR
ICK
NE
RB
RIC
KN
ER
W WAA
LLNNUU
TT
DO
NE
RD
ON
ER
ME
ND
ON
ME
ND
ON
PAY
NE
PAY
NE
HHOO
AAGG
LLII NN
CCEE
NNTT
EERR
DDOO
GG CC
RREE
EEKK
MMII DD
DDLLEE
PPOO
II NNTT
WWEE
TTZZ
EELL
LLII BB
EERR
TTYY
UUNN
II OONN
PPEETT EERR CCOOLL LL IINNSS
CCOO
NNVV
OOYY
HHEE
LLLLEE
RR
BE
RG
NE
RB
ER
GN
ER
DU
STM
AN
DU
STM
AN
CO
LWE
LLC
OLW
ELL
DDOO
GG CC
RREE
EEKK
DO
LTD
OLT
RO
GE
RS
RO
GE
RS
BO
RO
FFB
OR
OFF
OOHH
II OO II NN
DDII AA
NNAA
SSTTAA
TTEE
LLII NN
EE
KLIN
GE
RKL
ING
ER
PPLL EE
II SSCC
HHEE
RR
OOHH
II OO II NN
DDII AA
NNAA
SSTTAA
TTEE
LLII NN
EE
FF EEAA SSBBYY WW IISSEE NNEERR
KKNNIITTTTLL EE
224
RRDD
2255
RR DD GG
RRDD NN--22 55
RRDD HH
RRDD LL
RRDD
HH--2244
RRDD II --11 88
R RD D
2 28 8
RRDD OO--22 22
RRDD NN--22 22
RRDD
UU --22 00
RRDD TT--22 33
RD TRD T
R RD D
2 23 3- -S S
RRDD OO--22 55
RRDD OO
RD
24
RD
24
MA
INM
AIN
RRDD NN
RRDD PP
RRDD SS
RRDD
2233-- MM
RD
23-
QR
D 2
3-Q
RRDD
2244
-- MM
RR DD RR--22 33
RRDD JJ
L LE EH H
M MA A
NN
RRDD
2244
RRDD
2255
RR DD II --2233
RRDD QQ-- 2266
R RD D
2 23 3
RRDD QQ
CEDARCEDAR
RR DD GG--22 44
RRDD NN --2244
RRDD 2 25 5- -P P
RR DD KK --22 22
PLANKPLANK
RRDD
2244
R RD D
2 24 4
RR DD II --22 22R R
D D 2 27 7- -R R
POHLMANPOHLMAN
R RD D
2 27 7
R RD D
2 26 6- -Q Q
RRDD
2233-- LL
R RD D
2 25 5- -M M
RRDD MM
RRDD RR
R RD D
2 25 5- -N N
R RDD
2233--TT
R RD D
2 23 3- -J J
R RD D
2 23 3- -U U
RRDD LL-- 2244
R RD D
2 26 6- -M M
RD
26
RD
26
RD G-22RD G-22
RD
23-
KR
D 2
3-K
127
224
30
RRDD 4422
RRDD 3300
RRDD
1188
77
RR DD 66 00
RRDD 2266
RRDD 55 44
RRDD 44 88
RRDD 11 66
RRDD 11 00 66
RD 86RD 86
R RD D
5 51 1
RRDD
1155
99
RRDD
1199
55
RRDD 11 00 88
R RD D
1 18 83 3RR
DD 55
RRDD 99 88
RRDD
9955
RRDD 99 44
RRDD 22 88
RRDD
5577
RR DD 33 88
RRDD
6677
RRDD 88 88
RRDD
6655
RRDD 1100 22
RRDD
2200
99
RRDD
7755
RRDD 5566
RRDD
2266
33RR
DD 22
6633
RRDD 8822
RRDD 11 22
RRDD 11 22
RRDD 8822
RRDD 77 22
RRDD
117711RD 48RD 48
RRDD 2200
RRDD
11 11
RRDD
2211
RRDD
4499
RRDD 11 0088
RRDD
4477
RRDD
5599
RRDD
11 1133
RRDD
6611
RRDD
115511
RRDD 118811
RRDD 1100 44
RRDD 220055
RRDD
8877
RRDD 88 44
RR DD 66 00
RRDD
3399
RRDD 221155
RRDD
9911
RRDD 1111 00
STA
TES
TATE
RRDD 77 00
RRDD
5555
R RD D
1 17 77 7
RRDD
113311
RRDD
3333
RRDD 220033
RRDD
119977
RRDD
11 11
R RD D
1 19 97 7
RRDD 11 44
RRDD
11
RR DD 88 00
RRDD
11
RRDD
1122
33
RR DD
11 22 55
RRDD
1177
77
R RD D
1 18 87 7
RD
137
RD
137
RRDD
7711
RRDD
1155
55
RRDD
2277
RRDD
2211 11
RRDD
110011
RRDD 44 00
RRDD
9955
RRDD 99 00
RRDD 11 22
RRDD 22 44
RRDD 11 88
RRDD
7799
RRDD
119933
RD
81R
D 81
RRDD
11 1177
RR DD 33 22
RRDD 99 66
RRDD 55 22
RRDD 77 22
RRDD
1177
RRDD
1166
55
RRDD 7722
RRDD
1100
77
RRDD 220077
RRDD
117733
RRDD 77 88
R RD D
1 12 23 3
RR DD 44 88
R RD D
1 11 17 7
104
102
101
116
159
121
115
120
114
95
30
99
158
98
160
106
97
157
108
105
113
16
94
112
93
107
111
155
100
152
92
91
90
141
89 154
86
140
88
85
87
150
156
151
63
29
62
61
153
139
149
65
138
64
137
84
83
136
13582
81
148
28
77
52
60
76
129128
44
75
74147
146
132
134
59
73
80
119
51
118
79
78
166
131
50
57
54
117
49
130
47
133
46
14572
71
56
53
167
48
45
58
55
127
70
144
42
41
126
143
35
39
40
69
68
34
36
165
33
164
32
163
38
125
31
37
67
66
162
9
25
124
14
122
123
23
27
13
22
161
24
26
12
11
87
6
10
1035
21
4
3
20
19
17
2
15
1
18
110
142
43
96
109
\\LAKEFRONT\PROJ\IBR_BLUECREEK_394265\MAPFILES\APPENDIX\NOISE\FIGURE1_SITELOCATIONMAP_D-SIZE_120609.MXD PGRONLI 12/10/2009 10:20:17
FIGURE 1Blue Creek Wind Farm AreaProject Location MapPanel 1 of 1Drawing 1-012Created: December 10, 2009
Notes:1. Base data sources: ESRI Data and Maps (2008) {airports, counties outside Ohio, states}Ohio Department of Transportation (2004){counties, townships, roads, active railroads, cities}Ohio Geographically Referenced Information Program (2005){local roads}
0 0.5 1
Miles
LEGENDProject Area Buffer 5 mile
Project Area Boundary
Supplemental Development Area
Existing 138 kV Transmission LineExisting 345 kV Transmission Line
Proposed Turbine and Turbine ID Number
Proposed 115 kV Electrical Line
Proposed Access Road
Proposed Collection SubstationO&M Building, Interconnection Substation,Temporary Batch Plant, Construction Laydown Area,and Staging Area
Proposed Underground 34.5-kV Collection SystemProposed Aboveground 34.5-kV Collection System
City Boundary
Township Boundary
VICINITY MAP
Indiana
West Virginia
Pennsylvania
Kentucky
Michigan Ontario
Virginia
1 in = 1 mile
NOISE ANALYSIS OF THE BLUE CREEK WIND FARM PROJECT
3
the IEC 61400-11 standard. In addition, a mixed ground factor of G=0.5 was used with a receptor height of 4 meters. These parameters are similar to those recommended by the Ontario Ministry of the Environment, which identifies a ground factor of G=0.7 and receptor height of 4.5 meters. The modeling parameters used in this analysis yielded similar results to hard ground conditions (G=0), with a receptor height of 1.5 meters when the +2 dBA term is not considered. Atmospheric propagation is not strongly dependent on temperature, and the 70 percent relative humidity is a representative of favorable propagation (that is, higher predicted levels). All results are expressed in terms of energy average, Leq.
The combination of the modeling parameters used and the inclusion of the +2 dBA term are expected to result in a reasonable and conservative assessment of the maximum project levels. When winds are slower than those that correspond to maximum noise emissions, the noise levels will be less.
Four Facility substations, each with a maximum noise power level of 100 dBA, were also included in the analysis.
In summary, the following conservative components were incorporated into the analysis to ensure that predicted receptor levels were not minimized:
• Use of maximum noise output of the turbines, even though different conditions will result in lower noise levels
• Inclusion of a 2 dBA margin
• Use of atmospheric conditions conducive to noise propagation
• Use of mixed ground factors and elevated receivers
Construction Noise Levels The noise levels would vary during the construction period, depending on the phase of construction and number and locations of operating construction equipment. Construction activities are not expected to be constant at any individual location throughout the entire construction period. Therefore, some locations may experience a few weeks of significant activity that would then progress to a different portion of the Project area. Although the turbines are located more than 1,200 feet from residential structures, construction of roads and other Facility components will be located at closer distances, but no closer than 624 feet2.
The Roadway Construction Noise Model (RCNM) User’s Guide is one of the most comprehensive guides ever developed in the U.S. (Federal Highway Administration, 2006). Equipment noise levels from Table 1 in the RCNM User’s Guide are shown in Table 1 below. All listed noise levels are maximum A-weighted noise pressure levels at a reference distance of 50 feet. The acoustical usage factor is the fraction of time that the equipment generates noise at the maximum level.
2 Setback distances from other public roads and rights-of-way will be 1.31 times the turbine height (476 feet) for a setback of 624 feet (assuming use of the G-90 turbine).

NOISE ANALYSIS OF THE BLUE CREEK WIND FARM PROJECT
4
TABLE 1 RCNM Construction Equipment Noise Levels
Equipment Description
Acoustical Usage Factor
(%)
Specified Lmax @ 50 ft
(dBA)
Actual Measured Lmax @ 50 ft
(dBA)
No. of Actual Data Samples
(Count)
All Other Equipment > 5 HP 50 85 -- N/A -- 0
Auger Drill Rig 20 85 84 36
Backhoe 40 80 78 372
Bar Bender 20 80 -- N/A -- 0
Blasting -- N/A -- 94 -- N/A -- 0
Boring Jack Power Unit 50 80 83 1
Chain Saw 20 85 84 46
Clam Shovel (dropping) 20 93 87 4
Compactor (ground) 20 80 83 57
Compressor (air) 40 80 78 18
Concrete Batch Plant 15 83 -- N/A -- 0
Concrete Mixer Truck 40 85 79 40
Concrete Pump Truck 20 82 81 30
Concrete Saw 20 90 90 55
Crane 16 85 81 405
Dozer 40 85 82 55
Drill Rig Truck 20 84 79 22
Drum Mixer 50 80 80 1
Dump Truck 40 84 76 31
Excavator 40 85 81 170
Flat Bed Truck 40 84 74 4
Front End Loader 40 80 79 96
Generator 50 82 81 19
Generator (<25kVA, VMS signs) 50 70 73 74
Gradall 40 85 83 70
Grader 40 85 -- N/A -- 0
Grapple (on backhoe) 40 85 87 1
Horizontal Boring Hydr. Jack 25 80 82 6
Hydra Break Ram 10 90 -- N/A -- 0
Impact Pile Driver 20 95 101 11
Jackhammer 20 85 89 133
Man Lift 20 85 75 23
Mounted Impact Hammer (hoe ram) 20 90 90 212
Pavement Scarifier 20 85 90 2

NOISE ANALYSIS OF THE BLUE CREEK WIND FARM PROJECT
5
TABLE 1 RCNM Construction Equipment Noise Levels
Equipment Description
Acoustical Usage Factor
(%)
Specified Lmax @ 50 ft
(dBA)
Actual Measured Lmax @ 50 ft
(dBA)
No. of Actual Data Samples
(Count)
Paver 50 85 77 9
Pickup Truck 40 55 75 1
Pneumatic Tools 50 85 85 90
Pumps 50 77 81 17
Refrigerator Unit 100 82 73 3
Rivet Buster/chipping gun 20 85 79 19
Rock Drill 20 85 81 3
Roller 20 85 80 16
Sand Blasting (Single Nozzle) 20 85 96 9
Scraper 40 85 84 12
Shears (on backhoe) 40 85 96 5
Slurry Plant 100 78 78 1
Slurry Trenching Machine 50 82 80 75
Soil Mix Drill Rig 50 80 -- N/A -- 0
Tractor 40 84 -- N/A -- 0
Vacuum Excavator (Vac-truck) 40 85 85 149
Vacuum Street Sweeper 10 80 82 19
Ventilation Fan 100 85 79 13
Vibrating Hopper 50 85 87 1
Vibratory Concrete Mixer 20 80 80 1
Vibratory Pile Driver 20 95 101 44
Warning Horn 5 85 83 12
Welder / Torch 40 73 74 5
Source: Federal Highway Administration, 2006
Lmax = maximum noise level
As the table shows, the loudest equipment generally emits noise in the range of 80 to 90 dBA at a distance of 50 feet. The closest and loudest equipment dominates noise at any specific receptor. As noted above, the types and numbers of construction equipment near any specific receptor location would vary over time. The construction noise estimates were based on conservative assumptions of multiple pieces of loud equipment operating close to each other. This is believed to be a realistic scenario.
Additional assumptions include the following:
• One piece of equipment generating a reference noise level of 85 dBA (at a distance of 50 feet with a 40 percent usage factor) located 50 feet from the point of reception

NOISE ANALYSIS OF THE BLUE CREEK WIND FARM PROJECT
6
• Two pieces of equipment generating reference 85 dBA noise levels located an additional 50 feet farther away (100 feet from point of reception)
• Two more pieces of equipment generating reference 85 dBA noise levels located 100 feet farther away (150 feet from point of reception)
Table 2 presents construction equipment noise levels at various distances based on the above assumptions. This extrapolation is conservative because it only considers geometric spreading and does not account for atmospheric absorption.
TABLE 2 Construction Equipment Noise Levels versus Distance
Distance from Right of Way or Property Line
(feet) Leq Noise Level
(dBA)
50 83
100 79
200 74
400 69
800 63
1,600 58
3,200 52
6,400 46
Leq = equivalent sound level
Figure 2 plots the data in Table 2. The expected average construction noise levels from proposed construction activities at any particular location may be estimated using this figure. As noted in Table 1, some variation in construction equipment noise levels is to be expected.

NOISE ANALYSIS OF THE BLUE CREEK WIND FARM PROJECT
7
FIGURE 2 Estimated Construction Noise Levels
Construction Noise Level vs Distance
30
40
50
60
70
80
90
0 2,000 4,000 6,000 8,000
Distance from ROW or Property Line, feet
Leq
Noi
se L
evel
, dB
A
It is anticipated that most of the heavy construction activities will be conducted during the day and that the character of the noise would be similar to agricultural or road construction equipment operations, sources with which the communities in the Project area are generally familiar. Therefore, temporary increases in noise levels resulting from construction activities are not anticipated to present a significant impact.
The heavy construction equipment – such as backhoes, cranes, bulldozers, and excavators – will produce noise levels very similar to agricultural equipment such as tractors, combines, and grain dryers, which are all regularly used within the Facility area now.
Project Operating Noise Levels The cumulative level from all turbines and the substation operating at their maximum noise power levels (inclusive of the + 2 dBA turbine noise power level adjustment) is presented in Attachment B. Attachment B contains four sets of information:
• Model results (Table B-1) • Receptor coordinates (identified residential structures, schools, hospitals, nursing homes
or assisted-living and health-care facilities, religious institutions and public libraries) (Table B-1)
• Source coordinates (Table B-2) • Predicted noise level contour maps (Figure B-1)
The range in expected operational noise levels presented in Appendix B varies from less than 30 dBA to 53 dBA. Table 3 summarizes the number of receptors within specific noise pressure level ranges.

NOISE ANALYSIS OF THE BLUE CREEK WIND FARM PROJECT
8
Low Frequency Noise There has been some confusion regarding the presence of significant levels of low frequency noise from modern utility-scale upwind turbines. High levels of low frequency noise can be associated with simple-cycle combustion turbines or natural gas compressor stations. High levels of low frequency noise were common in earlier downwind wind turbines. However, the level of low frequency noise emitted from modern upwind turbines is
significantly less than from other sources. The swishing noise associated with the rotation of turbine blades is often mistaken for low frequency noise. The frequency content of the swish is typically within the 500 to 1,000 hertz range, which is entirely within the audible range and appropriately characterized by the A-weighting.
For wind turbines, the measurement of low frequency noise is complicated by the presence of wind and the resulting wind-induced noise (self-noise) through microphone windscreens. Recent wind tunnel testing of various windscreens (Hessler et al., 2008; Hessler 2009) concludes that:
any casual measurement of sound using a standard windscreen in a windy field will yield ostensibly high levels of low frequency or infrasonic noise—whether a wind turbine is present or not. Such measurements, taken at face value, may be one of the reasons wind turbines are widely, but mistakenly, believed to be significant sources of low frequency noise.
Mitigation Measures The following mitigation measures will be incorporated to minimize construction noise emissions:
• Exhaust mufflers will satisfy manufacturer requirements or be promptly replaced.
• Contractors will be required to comply with federal limits on truck noise and comply with local speed limits.
• To the extent practicable, nighttime construction will be limited to relatively quiet activities. In the event of limited nighttime activities, the surrounding neighbors will be notified in advance.
• Contractors will be required to notify the community in advance of any blasting or pile-driving activity. This activity would only be conducted during the day.
• A telephone number will be established for the public to report any significant undesirable noise conditions associated with the construction of the Facility.
These results are representative of the expected operational noise levels, and an overall reduction in Facility noise levels is expected to be realized through the micro-siting process. An overall reduction is expected to be realized even if a turbine with higher noise power
TABLE 3 Summary of Predicted Project Noise Levels
Noise Level # of Receptors
50 dBA or greater 53
45 - 50 dBA 279
40 - 45 dBA 226
35 - 40 dBA 402

NOISE ANALYSIS OF THE BLUE CREEK WIND FARM PROJECT
9
level, such as the Mitsubishi, is selected. The following mitigation measures will be implemented by Heartland Wind, LLC to minimize operating noise emissions:
• Using 1,200 feet for a minimum residential setback instead of the OPSB-mandated 750 feet.
• Ensuring that any minor adjustments made to turbine positions as part of the standard micro-siting process closer to construction will not result in higher noise levels than presently predicted. Additional modeling of the final layout and turbine selection will be conducted.
• Publishing a phone number for the Plant Manager so area residents can report excessive noise that might be caused by malfunctioning turbines.
• Offering Good Neighbor Agreements to the owners of all residences within one-half mile of a proposed wind turbine to give financial compensation to affected residents. Special efforts will be made to contact residences that will experience predicted noise levels of greater than 50 dBA.

NOISE ANALYSIS OF THE BLUE CREEK WIND FARM PROJECT
10
References Federal Highway Adminstration. 2006. Roadway Construction Noise Model (RCNM) User’s Guide.FHWA-HEP-05-054, DOT-VNTSC-FHWA-05-01). January.
Hessler, G. F., Hessler, D. M., Brandstätt, P., Bay, K. 2008. “Experimental Study to Determine Wind-Induced Noise and Windscreen Attenuation Effects on Microphone Response for Environmental Wind Turbine and Other Applications,” Noise Control Engineering Journal. J.56. July-August.
Hessler, D.M. 2009. “Wind Tunnel Testing of Microphone Windscreen Performance Applied to Field Measurements of Wind Turbines”, Proceedings of the Third International Meeting on Wind Turbine Noise, Aalborg Denmark. 17-19 June.
International Electrotechnical Commission (IEC). 2006. Wind Turbine Generator Systems—Part 11: Acoustic Noise Measurement Techniques – Amendment 1. International Standard 61400-11. Geneva, Switzerland.
International Organization for Standardization (ISO). 1993. Acoustics—Sound Attenuation During Propagation Outdoors. Part 1: Calculation of the Absorption of Sound by the Atmosphere. Part 2: General Method of Calculation. ISO 9613. Switzerland.
Verein Deutscher Ingenieure (VDI). 1988. Outdoor Sound Propagation. VDI 2714, Verlag GmbH, Dussledorf, Beuth Verlag, Berlin, Koln, Germany.

Attachment A


ATTACHMENT A
A-1
Fundamentals of Acoustics It is useful to understand how noise is defined and measured. Noise is defined as unwanted sound. Airborne sound is a rapid fluctuation of air pressure above and below atmospheric pressure. There are several ways to measure noise, depending on the source of the noise, the receiver, and the reason for the noise measurement. Table 1 summarizes the technical noise terms typically discussed in environmental noise analysis.
TABLE 1 Definitions of Acoustical Terms
Term Definitions
Ambient noise level The composite of noise from all sources near and far. The normal or existing level of environmental noise at a given location.
Decibel (dB) A unit describing the amplitude of sound, equal to 20 times the logarithm to the base 10 of the ratio of the measured pressure to the reference pressure, which is 20 micropascals.
A-weighted sound pressure level (dBA)
The sound pressure level in decibels as measured on a sound level meter using the A-weighted filter network. The A-weighted filter de-emphasizes the very low and very high frequency components of the sound in a manner similar to the frequency response of the human ear and correlates well with subjective reactions to noise.
Equivalent Sound Level (Leq)
The Leq integrates fluctuating sound levels over a period of time to express them as a steady-state sound level. As an example, if two sounds are measured and one sound has twice the energy but lasts half as long, the two sounds would be characterized as having the same equivalent sound level.
Day–Night Level (Ldn or DNL)
The Day-Night level (Ldn or DNL) is a 24-hour average Leq, where 10 dBA are added to nighttime levels between 10 p.m. and 7 a.m. For a continuous source that emits the same noise level over a 24-hour period, the Ldn will be 6.4 dB greater than the Leq.
Statistical noise level (Ln)
The noise level exceeded during n percent of the measurement period, where n is a number between 0 and 100 (for example, L50 is the level exceeded 50 percent of the time).
Table 2 depicts the relative A-weighted noise levels of common sounds measured in the environment and in industry for various sound levels.
TABLE 2 Typical Sound Levels Measured in the Environment and Industry
Noise Source At a Given Distance
A-Weighted Sound Level in Decibels Qualitative Description
Carrier Deck Jet Operation 140
130 Pain threshold
Jet takeoff (200 feet) 120
Auto Horn (3 feet) 110 Maximum Vocal Effort
Jet takeoff (2000 feet) Shout (0.5 feet)
100
N.Y. Subway Station Heavy Truck (50 feet)
90 Very Annoying Hearing Damage (8-hour,
continuous exposure)
Pneumatic drill (50 feet) 80 Annoying

ATTADHMENT A
A-2
TABLE 2 Typical Sound Levels Measured in the Environment and Industry
Noise Source At a Given Distance
A-Weighted Sound Level in Decibels Qualitative Description
Freight Train (50 feet) Freeway Traffic (50 feet)
70 Intrusive Telephone Use Difficult
Air Conditioning Unit (20 feet) 60
Light auto traffic (50 feet) 50 Quiet
Living Room Bedroom
40
Library Soft whisper (5 feet)
30 Very Quiet
Broadcasting Studio 20 Recording studio
10 Just Audible
The most common metric is the overall A-weighted sound level measurement that has been adopted by regulatory bodies worldwide. The A-weighting network measures sound in a fashion similar to how a person perceives or hears sound, thereby typically yielding a good correlation in terms of how to evaluate acceptable and unacceptable sound levels.
The measurement of sound is not a simple task. Consider typical sounds in a suburban neighborhood on a normal or “quiet” afternoon. If a short time in history of those sounds is plotted on a graph, it would look very much like Figure 2. In Figure 2, the background, or

ATTACHMENT A
A-3
residential sound level in the absence of any identifiable noise sources, is approximately 45 dB. During roughly three-quarters of the time, the sound level is 50 dB or less. The highest sound level, caused by a nearby sports car, is approximately 70 dB, while an aircraft generates a maximum sound level of about 68 dB. The following provides a discussion of how variable community noise is measured.
One obvious way of describing noise is to measure the maximum sound level (Lmax)—in the case of Figure 2, the nearby sports car at 70 dBA. The maximum sound level measurement does not account for the duration of the sound. Studies have shown that human response to noise involves both the maximum level and its duration. For example, the aircraft in this case is not as loud as the sports car, but the aircraft sound lasts longer. For most people, the aircraft overflight would be more annoying than the sports car event. Thus, the maximum sound level alone is not sufficient to predict reaction to environmental noise.
A-weighted sound levels typically are measured or presented as equivalent sound pressure level (Leq), which is defined as the average noise level, on an equal energy basis for a stated period of time, and is commonly used to measure steady-state sound or noise that is usually dominant. Statistical methods are used to capture the dynamics of a changing acoustical environment. Statistical measurements are typically denoted by Lxx, where xx represents the percentile of time the sound level is exceeded. The L90 is a measurement that represents the noise level that is exceeded during 90 percent of the measurement period. Similarly, the L10 represents the noise level exceeded for 10 percent of the measurement period.
It is critical to understand the difference between a sound pressure level (or noise level) and a sound power level. A sound power level (commonly abbreviated as PWL or Lw) is analogous to the wattage of a light bulb; it is a measure of the acoustical energy emitted by
ATTADHMENT A
A-4
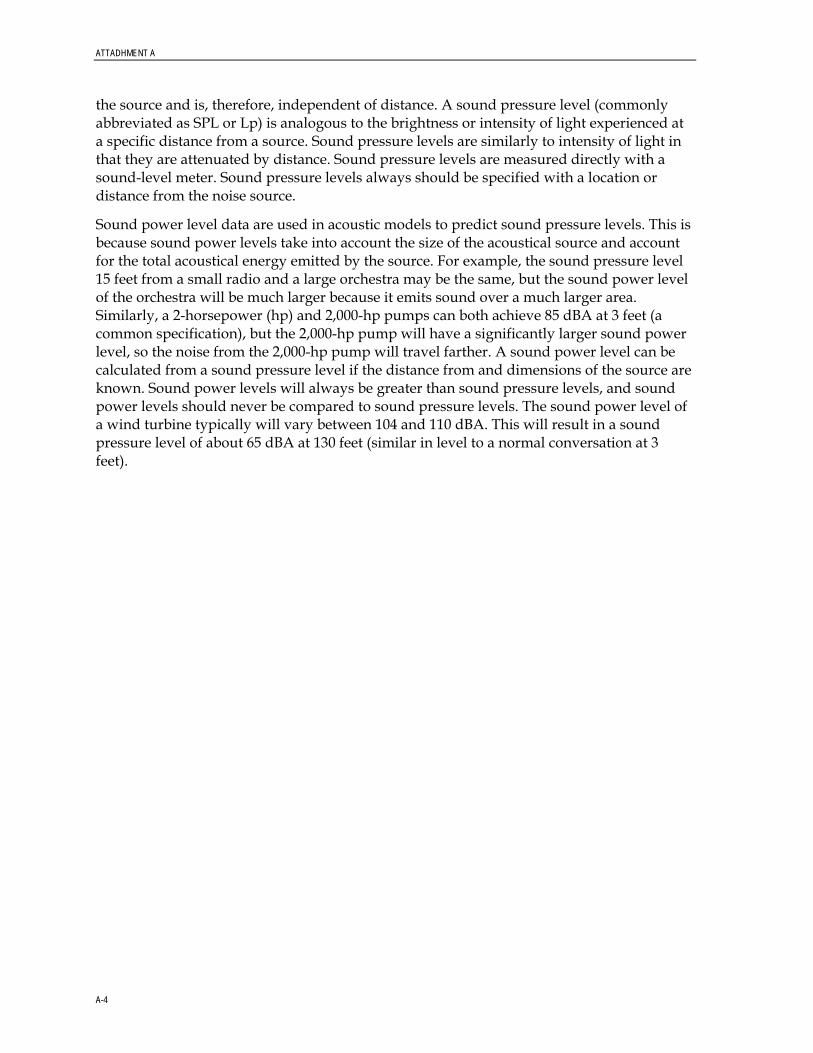
the source and is, therefore, independent of distance. A sound pressure level (commonly abbreviated as SPL or Lp) is analogous to the brightness or intensity of light experienced at a specific distance from a source. Sound pressure levels are similarly to intensity of light in that they are attenuated by distance. Sound pressure levels are measured directly with a sound-level meter. Sound pressure levels always should be specified with a location or distance from the noise source.
Sound power level data are used in acoustic models to predict sound pressure levels. This is because sound power levels take into account the size of the acoustical source and account for the total acoustical energy emitted by the source. For example, the sound pressure level 15 feet from a small radio and a large orchestra may be the same, but the sound power level of the orchestra will be much larger because it emits sound over a much larger area. Similarly, a 2-horsepower (hp) and 2,000-hp pumps can both achieve 85 dBA at 3 feet (a common specification), but the 2,000-hp pump will have a significantly larger sound power level, so the noise from the 2,000-hp pump will travel farther. A sound power level can be calculated from a sound pressure level if the distance from and dimensions of the source are known. Sound power levels will always be greater than sound pressure levels, and sound power levels should never be compared to sound pressure levels. The sound power level of a wind turbine typically will vary between 104 and 110 dBA. This will result in a sound pressure level of about 65 dBA at 130 feet (similar in level to a normal conversation at 3 feet).

Attachment B

TABLE B-1
Noise Results and Receptor Locations
Sound Pressure
Level X Y
Structure
Type
Residence
ID (dBA) (m) (m)
HOME R239 52.7 196647.07 4540680.88
HOME R296 52.6 197156.19 4542271.7
HOME R285 52.5 197749.97 4542097.66
HOME R728 52 197831.68 4541248.8
HOME R238 51.9 197759.96 4540640.92
HOME R234 51.8 198504.99 4540619.85
HOME R301 51.8 196734.64 4542316.4
HOME R211 51.4 193313.36 4539980.49
HOME R317 51.4 194615.41 4542788.31
HOME R167 51.3 197118.63 4539061.67
HOME R230 51.3 197018.19 4540605.38
HOME R237 51.3 197197.16 4540653.63
HOME R375 51.3 196587.75 4543847.09
HOME R378 51.3 199736.21 4543814.26
HOME R386 51.3 197173.8 4543894.06
HOME R45 51.2 192728.42 4536569.18
HOME R107 51.2 190947.7 4538348.17
HOME R374 51.2 200244.84 4543782.71
HOME R44 51 192789.69 4536526.97
HOME R170 51 196918.34 4539068.96
HOME R245 51 193677.51 4540768.08
HOME R212 50.9 191344.22 4540054.71
HOME R318 50.9 197776.22 4542814.92
HOME R447 50.9 194120.71 4545550.02
HOME R334 50.8 199495.46 4543374.16
HOME R166 50.8 192991.65 4539114.23
HOME R186 50.7 190907.84 4539267.07
HOME R273 50.7 199361.09 4541559.53
HOME R316 50.7 194596.38 4542619.08
HOME R236 50.7 193803.78 4540712.97
HOME R310 50.6 190646.91 4542540.71
HOME R331 50.6 194548.13 4543240.68
HOME R110 50.5 191211.05 4538393.91
HOME R112 50.5 191602.23 4538439.44
HOME R181 50.5 190508.14 4539223.2
HOME R307 50.5 199368.99 4542354.39
HOME R459 50.5 199581.71 4545950.98
HOME R172 50.4 195033.03 4539112.79
HOME R87 50.3 191154.32 4537562.84
HOME R217 50.3 196126.45 4540099.68
HOME R221 50.3 197694.18 4540254.34
HOME R160 50.3 192187.45 4539105.41
HOME R168 50.2 196700.25 4539068.24
HOME R153 50.1 196569.09 4539009.44
HOME R222 50.1 196024.83 4540287.09
HOME R283 50.1 190152.02 4542196.85
HOME R436 50.1 193080.92 4545432.59
HOME R182 50.1 192561.41 4539195.02
HOME R152 50.1 192886.22 4539067.02
HOME R113 50 192068.91 4538445.16
HOME R146 50 197362.96 4538974.2
Coordinates (UTM NAD 83 Z17N)
Page 1 of 24

TABLE B-1
Noise Results and Receptor Locations
Sound Pressure
Level X Y
Structure
Type
Residence
ID (dBA) (m) (m)
Coordinates (UTM NAD 83 Z17N)
HOME R175 50 194809.48 4539131.26
HOME R736 50 196651.96 4539066.9
HOME R214 49.9 197650.66 4540036.42
HOME R265 49.9 196104.05 4541251.17
HOME R335 49.9 194617.93 4543503.82
HOME R359 49.9 200369.18 4543726.89
HOME R279 49.8 199430.98 4541705.2
HOME R429 49.8 194670.31 4545022.3
HOME R438 49.8 199001.17 4545378.24
HOME R440 49.8 198757.35 4545392.72
HOME R137 49.7 191220.74 4539037.91
HOME R209 49.7 197976.4 4539831.28
HOME R210 49.7 197645.32 4539855.08
HOME R320 49.7 196216.69 4542933.85
HOME R41 49.7 192702.21 4536307.45
HOME R176 49.7 194743.09 4539133.25
HOME R371 49.6 197815.06 4543812.97
HOME R443 49.6 200780.02 4545403.28
HOME R124 49.5 197631.53 4538511.25
HOME R324 49.5 197782.18 4543065.53
HOME R373 49.5 199485.49 4543796.22
HOME R439 49.5 198855.55 4545390.18
HOME R150 49.5 197437.78 4538981.19
HOME R100 49.4 194264.41 4538091.44
HOME R290 49.4 199458.25 4542127.15
HOME R327 49.4 196167.38 4543166.77
HOME R104 49.4 192770.27 4538268.98
HOME R264 49.3 194478.25 4541272.53
HOME R361 49.3 199433.3 4543758.24
HOME R457 49.3 202145.1 4545856.1
HOME R126 49.2 196067.42 4538562.02
HOME R173 49.2 194663.18 4539126.34
HOME R252 49.2 191450.01 4540880.45
HOME R383 49.2 197910.01 4543858.71
HOME R183 49.1 190035.59 4539250.81
HOME R190 49.1 191467.03 4539331.2
HOME R278 49.1 196180.39 4541723.79
HOME R289 49.1 199556.22 4542129.54
HOME R297 49.1 194605.24 4542313.04
HOME R299 49.1 193981.18 4542333.87
HOME R426 49.1 199550.64 4544811.83
HOME R450 49.1 192407.76 4545626.8
HOME R451 49.1 194598.53 4545593.3
HOME R19 49 192102.39 4535928.92
HOME R23 49 191713.67 4535955.44
HOME R36 49 192133.67 4536007.25
HOME R129 49 194470.24 4538739.19
HOME R177 49 195337.77 4539126.03
HOME R240 49 195968.44 4540706.14
HOME R321 49 198588.22 4542942.28
HOME R424 49 197942.09 4544665.14
Page 2 of 24

TABLE B-1
Noise Results and Receptor Locations
Sound Pressure
Level X Y
Structure
Type
Residence
ID (dBA) (m) (m)
Coordinates (UTM NAD 83 Z17N)
HOME R460 49 199522.64 4546180.09
CHURCH R1177 48.9 189401.6 4544181.15
HOME R96 48.9 194374.92 4537789.09
HOME R98 48.9 194378.08 4537855.66
HOME R198 48.9 197662.46 4539455.85
HOME R269 48.9 196095.39 4541494.16
HOME R358 48.9 199331.36 4543740.78
HOME R33 48.8 192237.77 4535976.93
HOME R184 48.8 190150.44 4539250.03
HOME R243 48.8 194478.11 4540744.33
HOME R298 48.8 194514.36 4542315.66
HOME R404 48.8 189328.31 4544195.49
HOME R738 48.8 188978.78 4538472.49
HOME R131 48.7 194480.07 4538929.15
HOME R163 48.7 193823.05 4539088.1
HOME R332 48.7 198680.68 4543266.66
HOME R377 48.7 195109.91 4543887.51
HOME R389 48.7 196100.29 4543925.16
HOME R266 48.6 191335.21 4541414.3
HOME R425 48.6 197848.69 4544789.04
HOME R732 48.6 194572.4 4542257.68
HOME R109 48.5 189297.62 4538407.93
HOME R117 48.5 195997.39 4538425.29
HOME R200 48.5 194494.88 4539694.37
HOME R268 48.5 191350.41 4541453.39
HOME R430 48.5 199484.04 4545193.41
HOME R135 48.4 194465.22 4538978.85
HOME R164 48.4 197610.96 4539026.29
HOME R311 48.4 189576.14 4542581.75
HOME R102 48.3 189459.96 4538260.63
HOME R121 48.3 190009.08 4538576
HOME R313 48.3 190927.14 4542590.06
HOME R441 48.3 197342.33 4545440.48
HOME R106 48.2 194452.35 4538264.58
HOME R111 48.2 195986.29 4538310.25
HOME R118 48.2 189147.51 4538546.98
HOME R127 48.2 189163.36 4538730.58
HOME R215 48.2 194452.88 4540091.86
HOME R302 48.2 193701.82 4542390.62
HOME R72 48.1 192767.16 4537479.84
HOME R178 48.1 194486.08 4539143.59
HOME R241 48.1 192093.31 4540768.59
HOME R251 48.1 191032.61 4540876.45
HOME R271 48.1 190087.05 4541717.25
HOME R286 48.1 194569.92 4542153.22
HOME R420 48.1 190193.34 4544594.02
HOME R99 48.1 194449.32 4538037.1
HOME R114 48.1 199317.06 4538351.47
SCHOOL R1179 48.1 194412.27 4538987.57
HOME R103 48 189493.51 4538300.53
HOME R115 48 190004 4538509.25
Page 3 of 24

TABLE B-1
Noise Results and Receptor Locations
Sound Pressure
Level X Y
Structure
Type
Residence
ID (dBA) (m) (m)
Coordinates (UTM NAD 83 Z17N)
HOME R123 48 189162.64 4538636.56
HOME R225 48 194464.34 4540463.34
HOME R226 48 194529.99 4540537.71
HOME R306 48 189416.94 4542527.99
HOME R116 48 199305.13 4538361.06
HOME R196 47.9 190047.18 4539525.04
HOME R224 47.9 199316.25 4540342.93
HOME R362 47.9 199037.36 4543769.54
HOME R387 47.9 193607.59 4543953.31
HOME R731 47.9 194422.67 4539484.72
HOME R132 47.9 199781.2 4538871.59
HOME R108 47.8 189998.2 4538368.87
HOME R191 47.8 194040.06 4539306.56
HOME R232 47.8 192477.69 4540707.89
HOME R246 47.8 190965.69 4540828.36
HOME R294 47.8 199932.74 4542177.72
HOME R394 47.8 194962.37 4543971.58
HOME R452 47.8 195932.7 4545569.36
HOME R531 47.8 195739.42 4547191
HOME R35 47.8 192558.45 4535991.28
HOME R88 47.8 192824.28 4537565.45
CHURCH R1181 47.7 188765.31 4538511.63
CHURCH R1183 47.7 199295.5 4538188.77
HOME R50 47.7 191135.22 4536856.08
HOME R52 47.7 191200.45 4537031.03
HOME R55 47.7 189939.33 4537192
HOME R231 47.7 192288.83 4540711.88
HOME R233 47.7 192385.34 4540709.38
HOME R364 47.7 198094.56 4543793.31
HOME R376 47.7 200631.36 4543789.51
HOME R382 47.7 194579.19 4543917.32
HOME R385 47.7 199036.74 4543844.58
HOME R421 47.7 196225.23 4544490.87
HOME R733 47.7 194561.06 4543893.88
HOME R95 47.7 192834.85 4537801.77
HOME R77 47.6 194355.74 4537468.03
HOME R253 47.6 190715.68 4540894.93
HOME R270 47.6 191412.65 4541610.97
HOME R282 47.6 194515.72 4542047.3
HOME R333 47.6 191486.63 4543412.2
HOME R174 47.5 195670.93 4539113.95
HOME R384 47.5 198982.99 4543847.76
HOME R32 47.4 192605.39 4535975.31
HOME R120 47.4 188759.89 4538582.34
HOME R71 47.3 194358.17 4537430.43
HOME R276 47.3 191414.3 4541725.92
HOME R337 47.3 198474.54 4543478.03
HOME R341 47.3 198571.87 4543572.29
HOME R366 47.3 198227.51 4543796.87
HOME R458 47.3 193042.83 4546055.26
HOME R101 47.3 199299.41 4538053.41
Page 4 of 24

TABLE B-1
Noise Results and Receptor Locations
Sound Pressure
Level X Y
Structure
Type
Residence
ID (dBA) (m) (m)
Coordinates (UTM NAD 83 Z17N)
HOME R119 47.2 188718.4 4538575.94
HOME R277 47.2 194564.46 4541698.24
HOME R338 47.2 198291.19 4543486.88
HOME R370 47.2 198265.46 4543800.46
HOME R407 47.2 198384.5 4544078.73
HOME R413 47.2 198443.48 4544127.69
HOME R446 47.2 195659.22 4545504.09
HOME R462 47.2 202773.74 4546271.06
HOME R463 47.2 199586.42 4546372.52
HOME R89 47.1 189962.4 4537616.45
HOME R258 47.1 189014.2 4540977.37
HOME R275 47.1 200090.89 4541562.82
HOME R339 47.1 198339.56 4543519.65
HOME R340 47.1 198476.64 4543568.72
HOME R342 47.1 198376.33 4543590.39
HOME R345 47.1 198277.79 4543617.02
HOME R346 47.1 198530.76 4543630.43
HOME R348 47.1 198293.99 4543670.53
HOME R368 47.1 198317.52 4543805.19
HOME R380 47.1 198320.94 4543843.86
HOME R391 47.1 198331.43 4543903.23
HOME R400 47.1 198374.15 4543989.15
HOME R408 47.1 198431.61 4544078.77
HOME R415 47.1 198508.51 4544157.87
HOME R416 47.1 198585.65 4544158.67
HOME R244 47.1 194973.45 4540743.85
HOME R57 47 189876.28 4537209.42
HOME R242 47 195157.39 4540722.55
HOME R349 47 198337.35 4543680.93
HOME R365 47 198380.68 4543792.02
HOME R369 47 198346.57 4543791.43
HOME R390 47 198385.38 4543877.59
HOME R402 47 198432.48 4544007.95
HOME R403 47 198483.39 4544035.79
HOME R410 47 198523.55 4544075.92
HOME R412 47 198577.95 4544124.11
HOME R417 47 198639.85 4544163.58
HOME R453 47 196184.43 4545575.07
HOME R105 47 199246.86 4538181.84
HOME R414 47 198636.45 4544120.03
HOME R319 46.9 191413.73 4542980.2
HOME R351 46.9 198435.2 4543719.25
HOME R354 46.9 198482.18 4543743.05
HOME R356 46.9 198525.83 4543747.72
HOME R357 46.9 198442.81 4543748.82
HOME R367 46.9 198409.11 4543795.13
HOME R379 46.9 198461.85 4543838.04
HOME R381 46.9 198616.55 4543844.71
HOME R388 46.9 198477.4 4543878.73
HOME R392 46.9 198432.51 4543907.01
HOME R395 46.9 191121.07 4544053.72
Page 5 of 24

TABLE B-1
Noise Results and Receptor Locations
Sound Pressure
Level X Y
Structure
Type
Residence
ID (dBA) (m) (m)
Coordinates (UTM NAD 83 Z17N)
HOME R396 46.9 198476.32 4543939.44
HOME R401 46.9 198517.53 4544003.77
HOME R405 46.9 198628.25 4544038.05
HOME R406 46.9 198522.94 4544053.01
HOME R409 46.9 198629.48 4544072.51
HOME R411 46.9 198587.28 4544098.7
HOME R437 46.9 203936.95 4545265.57
HOME R165 46.9 197992.09 4539027.82
HOME R671 46.9 200304.35 4537239.25
HOME R29 46.8 192755.47 4535955
HOME R31 46.8 192787.95 4535966.45
HOME R53 46.8 189833.74 4537100.8
HOME R61 46.8 189890.1 4537434.13
HOME R91 46.8 189848.37 4537691.85
HOME R93 46.8 189779.36 4537786.84
HOME R248 46.8 190553.25 4540846.68
HOME R393 46.8 198578.85 4543904.37
HOME R398 46.8 198582.06 4543930.83
HOME R399 46.8 198582.28 4543958.62
HOME R444 46.8 195498.59 4545494.76
HOME R30 46.7 192822.88 4535961.72
HOME R59 46.7 194351.4 4537350.86
HOME R192 46.6 188355.54 4539410.67
HOME R461 46.6 197972.99 4546305.39
HOME R122 46.5 188593.27 4538620.12
HOME R343 46.5 191438.06 4543710.98
HOME R445 46.5 195115.38 4545508.45
HOME R448 46.5 197073.23 4545519.17
HOME R449 46.5 196342.62 4545549.97
HOME R97 46.4 188499.86 4537912.31
HOME R260 46.4 200276.72 4540967.72
HOME R454 46.4 191179.91 4545740.36
HOME R125 46.3 188555.31 4538668.77
HOME R262 46.2 190065.96 4541282.64
HOME R220 46 190074.25 4540280.55
HOME R247 46 190318.86 4540836.42
HOME R352 46 191405.79 4543851.58
HOME R143 46 199443.04 4538931.46
HOME R161 46 198275.12 4539011.83
HOME R442 45.9 196728.47 4545461.43
HOME R466 45.9 194650.51 4546655.16
HOME R303 45.8 193249.26 4542412.48
HOME R272 45.7 200285.82 4541544.18
HOME R427 45.7 202711.03 4544795.33
HOME R149 45.7 198395.84 4538962.23
HOME R284 45.6 192950.7 4542165.76
HOME R879 45.6 189822.4 4536585.55
HOME R158 45.6 198388.5 4538998.01
HOME R15 45.5 193239.29 4535888.26
HOME R147 45.5 199325.9 4538930.92
HOME R249 45.4 190103.12 4540852.93
Page 6 of 24

TABLE B-1
Noise Results and Receptor Locations
Sound Pressure
Level X Y
Structure
Type
Residence
ID (dBA) (m) (m)
Coordinates (UTM NAD 83 Z17N)
HOME R274 45.4 189295.86 4541741.38
HOME R434 45.4 204123.32 4545199.65
HOME R13 45.3 192757.08 4535700.24
HOME R254 45.3 188628.66 4540943.12
HOME R256 45.3 190049.65 4540956.86
HOME R511 45.3 196895.55 4547089.74
HOME R713 45.3 201233.48 4546856.59
HOME R140 45.3 199259.55 4538916.67
HOME R151 45.3 200122.4 4538927.73
HOME R159 45.3 198509.06 4538999.98
HOME R148 45.3 198520.66 4538958.4
HOME R28 45.2 193459.74 4535938.73
HOME R288 45.2 200332.42 4542097.04
HOME R154 45.2 199319.3 4538973.61
CHURCH R1178 45.1 193052.78 4542425.25
HOME R250 45.1 189982.55 4540867.82
HOME R397 45.1 193071.65 4544023.74
HOME R1041 45.1 188606.45 4537570.69
HOME R304 45.1 193026.52 4542429.72
HOME R157 45.1 198573.11 4538991.66
HOME R257 45 189903.31 4540959.89
HOME R372 45 201138.23 4543756.91
HOME R464 45 193116.31 4546546.32
HOME R1036 45 188718.05 4537462
HOME R155 45 199257.26 4538974.96
HOME R169 45 199336.68 4539027.92
HOME R259 44.9 189651.34 4540971.43
HOME R305 44.9 191628.65 4542475.41
HOME R145 44.9 198635.71 4538948.68
HOME R156 44.9 198626.41 4538987.99
HOME R672 44.9 200424.6 4537215.63
HOME R56 44.8 194425.56 4537127.75
HOME R467 44.8 199449.49 4546665.05
HOME R500 44.8 201096.14 4546937.43
HOME R134 44.8 198736.99 4538896.44
HOME R94 44.6 197653.72 4537669.93
HOME R144 44.6 198895.46 4538937.55
HOME R469 44.5 199548.21 4546723.29
HOME R497 44.5 201299.46 4546915.26
HOME R1037 44.5 188731.26 4537397.89
HOME R1039 44.5 188820.09 4537351.56
HOME R204 44.5 199359 4539673.99
HOME R674 44.5 199784.1 4537252.89
HOME R70 44.4 196907.71 4537389.54
HOME R128 44.3 188235.24 4538824.13
HOME R308 44.3 188970.17 4542538.56
HOME R465 44.3 193141.08 4546659.95
HOME R180 44.3 200124.69 4539053.15
HOME R673 44.3 199756.18 4537252.89
HOME R336 44.2 201107.68 4543396.77
HOME R468 44.2 198842.12 4546717.08
Page 7 of 24

TABLE B-1
Noise Results and Receptor Locations
Sound Pressure
Level X Y
Structure
Type
Residence
ID (dBA) (m) (m)
Coordinates (UTM NAD 83 Z17N)
HOME R197 44.2 199343.34 4539403.82
HOME R51 44.1 194348.13 4536899.77
HOME R292 44.1 200569.41 4542140.17
HOME R330 44.1 192979.96 4543257.24
HOME R1038 44.1 188729.54 4537353.11
HOME R92 44.1 197652.43 4537578.83
HOME R84 44 195975.02 4537465.02
HOME R300 44 192051.96 4542392.17
HOME R422 44 202708.61 4544480.86
HOME R82 43.9 197260.67 4537430.72
HOME R207 43.9 199756.28 4539750.89
HOME R423 43.9 191355.16 4544679.12
HOME R83 43.9 197299.08 4537437.06
HOME R472 43.8 198839.49 4546789.64
HOME R293 43.7 200660.16 4542141.58
HOME R470 43.7 191426.99 4546889.85
HOME R1040 43.7 188581.77 4537409.98
HOME R85 43.6 195759.93 4537481.87
HOME R473 43.6 198844.4 4546808.7
HOME R474 43.6 198811.28 4546811.4
HOME R80 43.6 197379.78 4537419.18
HOME R189 43.6 200131.99 4539176.41
HOME R60 43.5 195016.04 4537345.75
HOME R312 43.5 188810.6 4542611.93
HOME R326 43.5 201102.65 4543067
HOME R419 43.5 202695.1 4544358.41
HOME R1031 43.5 188842.67 4537222.46
HOME R86 43.5 195481.13 4537491.63
HOME R201 43.4 199893.33 4539662.82
HOME R475 43.4 198861.54 4546844.56
HOME R476 43.4 198887.93 4546847.91
HOME R477 43.4 198947.09 4546848.75
HOME R478 43.4 198903.8 4546846.55
HOME R90 43.4 199206.6 4537503.71
HOME R62 43.3 195959.44 4537336.92
HOME R329 43.3 201169.07 4543104.17
HOME R479 43.3 198808.28 4546859.3
HOME R512 43.3 200440.82 4547031.45
HOME R1032 43.3 188765.69 4537237.12
HOME R471 43.2 202843.22 4546690.11
HOME R490 43.2 201786.56 4546884.82
HOME R1030 43.2 188842.92 4537181.45
HOME R194 43.2 200137.89 4539259.9
HOME R482 43.1 198910.58 4546903.38
HOME R483 43.1 198950.85 4546907.04
HOME R484 43.1 198884.96 4546909.46
HOME R486 43.1 198843.73 4546906.46
HOME R487 43.1 198866.3 4546907.64
HOME R1033 43.1 188764.16 4537203.78
HOME R11 43 192675.15 4535109.9
HOME R485 43 198792.11 4546912.31
Page 8 of 24

TABLE B-1
Noise Results and Receptor Locations
Sound Pressure
Level X Y
Structure
Type
Residence
ID (dBA) (m) (m)
Coordinates (UTM NAD 83 Z17N)
HOME R488 43 198814.45 4546909.5
HOME R510 43 201602.59 4546989.51
HOME R1029 43 188855.41 4537131.66
HOME R69 43 197561.64 4537365.11
HOME R195 42.9 187959.92 4539485
HOME R491 42.9 198945.06 4546946.5
HOME R1034 42.9 188765.56 4537174.2
HOME R47 42.9 194421.65 4536613.74
HOME R418 42.8 202740.19 4544231.63
HOME R432 42.8 204351.86 4545150.63
HOME R492 42.8 198844.33 4546948.68
HOME R494 42.8 198872.76 4546950.08
HOME R495 42.8 198812.44 4546951.08
HOME R496 42.8 198909.91 4546950.92
HOME R498 42.8 198895.39 4546963.05
CHURCH R1176 42.7 204358.66 4545165.37
HOME R576 42.7 196372.79 4547632.31
HOME R868 42.7 189812.56 4536010.63
HOME R208 42.6 200235.12 4539754.38
HOME R501 42.6 198743.29 4546973.33
HOME R519 42.6 199666.91 4547048.89
HOME R1028 42.6 188851.67 4537080.24
HOME R1035 42.6 188776.99 4537117.75
HOME R65 42.6 199262.21 4537312
HOME R291 42.5 200933.47 4542129.57
HOME R363 42.5 202034.15 4543715.54
HOME R504 42.5 198852.94 4547000.82
HOME R505 42.5 199149.34 4547016.73
HOME R517 42.5 199635.89 4547059.08
HOME R1027 42.5 188864.35 4537040.93
HOME R67 42.5 197776.04 4537346.46
HOME R68 42.5 197820.23 4537355.89
HOME R130 42.4 187936.41 4539036.29
HOME R507 42.4 198894.01 4547032.36
HOME R516 42.4 199398.41 4547063.69
HOME R63 42.4 197722.47 4537313.03
HOME R856 42.4 190923.82 4535166.59
HOME R74 42.4 198091.18 4537398.04
HOME R493 42.3 193133.33 4547048.64
HOME R506 42.3 198537.96 4547034.69
HOME R508 42.3 198642.96 4547043.23
HOME R509 42.3 198629.18 4547038.82
HOME R513 42.3 199048.84 4547064.82
HOME R520 42.3 199310.2 4547067.22
HOME R521 42.3 199162.55 4547069.08
HOME R522 42.3 199215.25 4547073.63
HOME R523 42.3 199264.32 4547070.88
HOME R79 42.3 198190.6 4537404.4
HOME R64 42.3 199202.93 4537301.34
HOME R218 42.2 187996.16 4540262.36
HOME R489 42.2 202784.78 4546845.27
Page 9 of 24

TABLE B-1
Noise Results and Receptor Locations
Sound Pressure
Level X Y
Structure
Type
Residence
ID (dBA) (m) (m)
Coordinates (UTM NAD 83 Z17N)
HOME R514 42.2 198966.72 4547065.49
HOME R515 42.2 199011.31 4547066.53
HOME R518 42.2 198989.81 4547068.91
HOME R1026 42.2 188843.73 4537006
HOME R78 42.2 198243.12 4537398.76
HOME R75 42.2 198283.4 4537396.23
HOME R524 42.1 198953.61 4547086.22
HOME R533 42.1 199563.77 4547135.01
HOME R73 42.1 198318.73 4537389.9
HOME R76 42.1 198351.62 4537389.55
HOME R202 42 187862.13 4539858.9
HOME R529 42 199102.31 4547120.13
HOME R1025 42 188844.92 4536964.03
HOME R525 42 197930.13 4547106.91
HOME R81 42 198410.14 4537395.43
HOME R39 41.9 194389.98 4536249.3
HOME R503 41.9 202400.43 4546933.89
HOME R526 41.9 197893.09 4547118.11
HOME R527 41.9 199011.84 4547128.16
HOME R528 41.9 198956.48 4547129.75
HOME R530 41.9 199051.42 4547128.33
HOME R535 41.9 193940.95 4547241.75
HOME R433 41.8 190232.82 4545404.31
HOME R66 41.8 198317.98 4537333.25
HOME R727 41.8 198368.6 4537330.45
HOME R142 41.7 187804.07 4539125.21
HOME R431 41.7 190166.93 4545398.01
HOME R537 41.7 198911.13 4547170.21
HOME R538 41.7 198954.82 4547168.93
HOME R539 41.7 199115.63 4547179
HOME R203 41.6 200483.97 4539650.26
HOME R344 41.6 188154.77 4543781.66
HOME R435 41.6 190235.88 4545478.57
HOME R502 41.6 202850.25 4546918.7
HOME R541 41.6 198915.58 4547188.38
HOME R542 41.6 198896.13 4547191.5
HOME R557 41.6 199546.92 4547228.46
HOME R347 41.5 188144.7 4543810.67
HOME R551 41.4 198865.84 4547226.69
HOME R552 41.4 198813.13 4547227.7
HOME R554 41.4 198957.42 4547227.69
HOME R555 41.4 198917.07 4547229.99
HOME R34 41.3 194307.88 4535954.86
HOME R261 41.3 201025.13 4540965.5
HOME R558 41.3 199157.11 4547258.82
HOME R559 41.3 199106.05 4547263.94
HOME R1024 41.3 188894.95 4536767.72
HOME R58 41.3 199253.52 4537065.89
HOME R162 41.2 187720 4539182.75
HOME R267 41.2 201092 4541289.43
HOME R544 41.2 191960.25 4547315.85
Page 10 of 24

TABLE B-1
Noise Results and Receptor Locations
Sound Pressure
Level X Y
Structure
Type
Residence
ID (dBA) (m) (m)
Coordinates (UTM NAD 83 Z17N)
HOME R560 41.2 198910.67 4547266.77
HOME R561 41.2 198965.99 4547275.58
HOME R548 41.1 192804.01 4547321.57
HOME R564 41 199014.59 4547316.25
HOME R566 41 198913.27 4547321.9
HOME R567 41 198812.92 4547326.55
HOME R568 41 198964.63 4547319.63
HOME R734 41 194314.66 4535891.45
HOME R206 41 200690.83 4539704.43
HOME R26 40.9 194375.62 4535904.71
HOME R171 40.9 187679.63 4539231.31
HOME R235 40.9 187955.23 4540808.98
HOME R569 40.9 199062.04 4547357.21
HOME R179 40.8 187645.06 4539265.72
HOME R570 40.8 199012.38 4547369.31
HOME R571 40.8 198970.38 4547370.46
HOME R572 40.8 198912.16 4547371.99
HOME R866 40.7 189812.53 4535599.86
HOME R54 40.7 199200.21 4536956.99
HOME R48 40.6 196003.21 4536713.89
HOME R228 40.6 201049.96 4540440.7
HOME R263 40.6 188133.97 4541331.79
HOME R532 40.6 191432.2 4547288.79
HOME R573 40.6 199556.8 4547443.78
HOME R693 40.6 204454.7 4545657.95
HOME R883 40.6 189072.25 4536365.9
HOME R188 40.5 187601.96 4539376.54
HOME R536 40.5 191383.86 4547293.78
HOME R185 40.4 187588.13 4539309.6
HOME R223 40.4 201046.17 4540305.95
HOME R534 40.4 191336.48 4547292.29
HOME R546 40.3 191415.27 4547336.66
HOME R870 40.3 189649.04 4535648.1
HOME R880 40.3 189257.23 4536041.11
HOME R882 40.3 189170.11 4536159.72
HOME R14 40.2 194368.45 4535703.79
HOME R187 40.2 187532.98 4539363.08
HOME R355 40.2 202908.75 4543667.7
HOME R575 40.2 199560.34 4547546.2
HOME R867 40.2 189686.53 4535591.53
CHURCH R1180 40.1 201167.67 4540427.3
HOME R550 40.1 191371.89 4547349.33
HOME R871 40.1 189512.13 4535716.87
HOME R872 40.1 189424.32 4535795.28
HOME R556 40 191327.6 4547358.58
HOME R848 40 191709.09 4534382.7
HOME R869 40 189596.02 4535614.05
HOME R881 40 189115.31 4536123.95
HOME R553 39.9 191286.54 4547360.79
HOME R694 39.9 204443.89 4545960.13
HOME R49 39.9 197552.92 4536702.36
Page 11 of 24

TABLE B-1
Noise Results and Receptor Locations
Sound Pressure
Level X Y
Structure
Type
Residence
ID (dBA) (m) (m)
Coordinates (UTM NAD 83 Z17N)
HOME R9 39.8 192695.97 4534521.9
HOME R205 39.8 201029.11 4539694.28
HOME R314 39.8 188025.86 4542650.22
HOME R873 39.8 189419.9 4535741.17
HOME R25 39.8 194772.51 4535905.98
HOME R847 39.7 191814.22 4534323.65
HOME R1023 39.7 188653.92 4536537.45
HOME R1144 39.7 187876.38 4537454.73
HOME R864 39.6 189901.48 4535281.96
HOME R874 39.6 189413.67 4535683.59
HOME R193 39.5 187403.02 4539458.95
HOME R739 39.5 201792.73 4542078.39
HOME R875 39.5 189416.39 4535638.1
HOME R849 39.5 191528.17 4534322.48
HOME R737 39.4 187383.68 4539541.76
HOME R865 39.4 189828.12 4535284.96
HOME R2 39.3 192413.14 4534325.4
HOME R12 39.3 194294.79 4535357.33
HOME R748 39.3 204743.91 4545242.98
HOME R876 39.3 189412.33 4535604.96
HOME R1 39.2 192425.38 4534314.24
HOME R540 39.2 190966.23 4547318.79
HOME R877 39.2 189411.73 4535570.01
HOME R863 39.2 189858.23 4535205.78
HOME R40 39.1 195908.07 4536244.43
HOME R229 39.1 201467.6 4540492.46
HOME R353 39.1 203563.44 4543653.53
HOME R578 39.1 200031.81 4547828.17
HOME R1022 39.1 188459.58 4536547.13
HOME R1160 39.1 187394.05 4538625.57
HOME R17 39 195104.8 4535872.98
HOME R878 39 189407.4 4535521.14
HOME R884 39 188819.2 4536134.33
HOME R1143 39 187815.95 4537287.36
HOME R499 38.9 203975.01 4546885.71
HOME R846 38.9 192478.65 4534262.21
HOME R850 38.9 191140.68 4534355.32
HOME R885 38.9 188778.5 4536133.12
HOME R1016 38.9 188405.61 4536513.1
HOME R735 38.9 195146.69 4535840.15
HOME R323 38.8 202659.88 4542964.95
HOME R886 38.8 188748.04 4536136.19
HOME R931 38.8 188799.3 4536085.73
HOME R1015 38.8 188428.39 4536470.12
HOME R1017 38.8 188377.52 4536505.95
HOME R20 38.7 195331.77 4535879.98
HOME R37 38.7 195920.63 4536110.42
HOME R360 38.7 203784.46 4543655.21
HOME R887 38.7 188717.54 4536136.71
HOME R1014 38.7 188400.85 4536457.88
HOME R1042 38.7 188759.38 4536088.32
Page 12 of 24

TABLE B-1
Noise Results and Receptor Locations
Sound Pressure
Level X Y
Structure
Type
Residence
ID (dBA) (m) (m)
Coordinates (UTM NAD 83 Z17N)
HOME R22 38.6 195396.02 4535890.86
HOME R845 38.6 192536.4 4534221.86
HOME R888 38.6 188685.8 4536139.16
HOME R1018 38.6 188356.33 4536493.6
HOME R1142 38.6 187870.07 4537064.76
HOME R27 38.6 195450.94 4535889.14
HOME R930 38.6 188702.75 4536089.29
HOME R46 38.6 199252.49 4536465.29
HOME R8 38.5 192921.78 4534349.38
HOME R753 38.5 204687.58 4544361.11
HOME R889 38.5 188648.88 4536135.98
HOME R1013 38.5 188366.91 4536443.2
HOME R1019 38.5 188332.56 4536478.75
HOME R24 38.5 195521.97 4535888.07
HOME R21 38.4 195575.86 4535884.7
HOME R199 38.4 187174.96 4539635.77
HOME R428 38.4 188264.58 4545043.98
HOME R890 38.4 188623.44 4536135.14
HOME R891 38.4 188597.39 4536135.59
HOME R929 38.4 188652.55 4536090.15
HOME R1012 38.4 188336.8 4536429.73
HOME R1020 38.4 188309.5 4536468.34
HOME R1140 38.4 187863.35 4536985.5
HOME R1141 38.4 187844.86 4537012.63
HOME R255 38.3 187406.63 4540993.36
HOME R843 38.3 192582.29 4534185.3
HOME R892 38.3 188572.62 4536136.65
HOME R928 38.3 188617.62 4536092.02
HOME R1011 38.3 188310.48 4536414.29
HOME R1021 38.3 188286.45 4536458.56
HOME R675 38.3 201178.64 4537278.87
HOME R893 38.2 188540.23 4536138.47
HOME R926 38.2 188583.99 4536095.77
HOME R927 38.2 188560.54 4536099.35
HOME R1109 38.2 187856.36 4536932.34
HOME R1145 38.2 187387.48 4537817.39
HOME R42 38.2 197603.98 4536232.6
HOME R481 38.1 204262.67 4546801.4
HOME R579 38.1 193100.36 4548047.55
HOME R894 38.1 188506.56 4536139.68
HOME R895 38.1 188488.13 4536140
HOME R932 38.1 188584.25 4536036.65
HOME R896 38 188467.34 4536150.52
HOME R924 38 188495.72 4536100.46
HOME R925 38 188516.05 4536100.11
HOME R934 38 188559.01 4536047.25
HOME R1001 38 188208.84 4536417.94
HOME R1002 38 188247.09 4536387.41
HOME R1010 38 188281.46 4536353.13
HOME R1108 38 187853.59 4536854.09
HOME R1110 38 187792.13 4536939.88
Page 13 of 24

TABLE B-1
Noise Results and Receptor Locations
Sound Pressure
Level X Y
Structure
Type
Residence
ID (dBA) (m) (m)
Coordinates (UTM NAD 83 Z17N)
HOME R16 38 195975.04 4535855.06
HOME R43 38 199235.85 4536292.74
HOME R897 37.9 188448.11 4536141.32
HOME R898 37.9 188422.73 4536143.66
HOME R923 37.9 188472.22 4536101.5
HOME R933 37.9 188580.37 4535995.4
HOME R935 37.9 188537.84 4536036.17
HOME R940 37.9 188553.04 4535995.87
HOME R941 37.9 188516.85 4536035.26
HOME R1000 37.9 188189.62 4536409.37
HOME R1003 37.9 188231.02 4536376.88
HOME R1004 37.9 188214.34 4536368.27
HOME R1111 37.9 187790.44 4536882.7
HOME R1114 37.9 187757.03 4536936.54
HOME R456 37.8 189038.32 4545852.62
HOME R861 37.8 190170.02 4534630.61
HOME R862 37.8 190295.86 4534527.08
HOME R899 37.8 188399.82 4536142.14
HOME R921 37.8 188417.6 4536104.34
HOME R922 37.8 188444.26 4536101.97
HOME R936 37.8 188537.17 4535996.78
HOME R937 37.8 188514.32 4535998.44
HOME R942 37.8 188477.5 4536038.48
HOME R943 37.8 188477.92 4536063.26
HOME R964 37.8 188576.3 4535943.35
HOME R999 37.8 188169.08 4536397.64
HOME R1107 37.8 187839.55 4536806.77
HOME R1113 37.8 187753.79 4536893.34
HOME R1115 37.8 187727.37 4536937.41
HOME R1146 37.8 187326.16 4537759.98
HOME R900 37.8 188378.21 4536142.51
HOME R1112 37.8 187787.22 4536840.92
HOME R10 37.7 194262.85 4534804.87
HOME R695 37.7 204467.83 4546669
HOME R749 37.7 204988.62 4545220.52
HOME R901 37.7 188359.17 4536144.11
HOME R902 37.7 188343.3 4536145.65
HOME R919 37.7 188377.59 4536106.29
HOME R920 37.7 188397.92 4536105.31
HOME R938 37.7 188493.35 4535998.8
HOME R944 37.7 188443.61 4536063.85
HOME R945 37.7 188438.79 4536042.32
HOME R963 37.7 188548.36 4535945.1
HOME R965 37.7 188569.9 4535903.41
HOME R998 37.7 188144.06 4536384.09
HOME R1005 37.7 188181.59 4536348.49
HOME R1078 37.7 187832.72 4536742.17
HOME R1106 37.7 187837.07 4536766.41
HOME R1116 37.7 187695.23 4536939.75
HOME R1124 37.7 187726.89 4536888.43
HOME R138 37.7 201597.36 4538870.68
Page 14 of 24

TABLE B-1
Noise Results and Receptor Locations
Sound Pressure
Level X Y
Structure
Type
Residence
ID (dBA) (m) (m)
Coordinates (UTM NAD 83 Z17N)
HOME R939 37.7 188473.01 4535999.15
HOME R962 37.7 188522.94 4535945.53
HOME R1006 37.7 188163.65 4536340.53
HOME R903 37.6 188324.87 4536145.33
HOME R918 37.6 188352.79 4536105.45
HOME R946 37.6 188400.03 4536042.98
HOME R961 37.6 188499.49 4535949.11
HOME R966 37.6 188543.23 4535905.14
HOME R997 37.6 188121.03 4536375.58
HOME R1007 37.6 188147.66 4536334.45
HOME R1072 37.6 187830.79 4536712.53
HOME R1077 37.6 187833.23 4536730.01
HOME R1105 37.6 187790.69 4536772.21
HOME R1117 37.6 187666.65 4536940.95
HOME R956 37.6 188436.17 4536000.41
HOME R227 37.5 201966.38 4540407.68
HOME R480 37.5 204409.78 4546792.51
HOME R860 37.5 190258.08 4534464.8
HOME R904 37.5 188291.88 4536149.08
HOME R905 37.5 188268.34 4536148.21
HOME R917 37.5 188334.39 4536107.67
HOME R957 37.5 188417.79 4536003.9
HOME R958 37.5 188395.59 4536006.83
HOME R960 37.5 188472.79 4535948.93
HOME R967 37.5 188517.81 4535905.58
HOME R968 37.5 188497.49 4535906.56
HOME R996 37.5 188097.86 4536358.82
HOME R1009 37.5 188376.58 4536042.59
HOME R1070 37.5 187829.73 4536671.43
HOME R1071 37.5 187832.29 4536696.06
HOME R1075 37.5 187789.53 4536725.39
HOME R1076 37.5 187790.55 4536743.25
HOME R1118 37.5 187635.59 4536943.63
HOME R1122 37.5 187663.68 4536892.73
HOME R1123 37.5 187693.62 4536887.22
HOME R1166 37.5 188134.15 4545188.89
HOME R906 37.4 188249.93 4536149.16
HOME R947 37.4 188338.38 4536043.4
HOME R948 37.4 188335.6 4536066.97
HOME R954 37.4 188413.71 4535951.22
HOME R955 37.4 188430.88 4535951.56
HOME R959 37.4 188373.98 4536006.56
HOME R969 37.4 188467.65 4535908.98
HOME R995 37.4 188079.27 4536349.6
HOME R1008 37.4 188104.12 4536316.12
HOME R1067 37.4 187829.71 4536628.88
HOME R1073 37.4 187788.75 4536700.38
HOME R1074 37.4 187787.7 4536681.09
HOME R1119 37.4 187604.49 4536944.16
HOME R1121 37.4 187634.73 4536893.59
HOME R1125 37.4 187693.9 4536841.09
Page 15 of 24

TABLE B-1
Noise Results and Receptor Locations
Sound Pressure
Level X Y
Structure
Type
Residence
ID (dBA) (m) (m)
Coordinates (UTM NAD 83 Z17N)
HOME R1159 37.4 186985.47 4538651.79
HOME R994 37.4 188058.16 4536341.7
HOME R707 37.3 202664.81 4542036.65
HOME R907 37.3 188223.89 4536150.87
HOME R908 37.3 188205.5 4536153.1
HOME R949 37.3 188342.86 4536008.36
HOME R952 37.3 188368.65 4535955.16
HOME R953 37.3 188389.58 4535952.26
HOME R970 37.3 188442.25 4535910.05
HOME R971 37.3 188413.03 4535911.18
HOME R975 37.3 188145.45 4536205.45
HOME R978 37.3 188103.7 4536254.47
HOME R979 37.3 188102.3 4536283.74
HOME R980 37.3 188070.81 4536300.8
HOME R993 37.3 188043.38 4536332.42
HOME R1066 37.3 187825.37 4536605
HOME R1068 37.3 187787.27 4536634.97
HOME R1069 37.3 187784.72 4536653.25
HOME R1126 37.3 187660.74 4536846.3
HOME R1129 37.3 187690.95 4536793.94
HOME R1136 37.3 187574.78 4536942.17
HOME R1147 37.3 187158.4 4537844.64
HOME R842 37.3 197047.34 4535822.9
HOME R38 37.3 199229.6 4536116.1
HOME R676 37.3 201396.59 4537271.36
SCHOOL R1182 37.3 188289.86 4536039.99
HOME R594 37.2 195531.87 4548770.39
HOME R844 37.2 192624.49 4533932.94
HOME R859 37.2 190310.52 4534362.52
HOME R909 37.2 188182.66 4536155.39
HOME R910 37.2 188167.38 4536154.38
HOME R911 37.2 188153.39 4536153.99
HOME R915 37.2 188197.86 4536115.09
HOME R916 37.2 188218.82 4536114.09
HOME R950 37.2 188335.42 4535981.79
HOME R951 37.2 188336.37 4535963.34
HOME R972 37.2 188388.91 4535913.5
HOME R974 37.2 188150.15 4536182.49
HOME R976 37.2 188102.33 4536211.27
HOME R977 37.2 188110.29 4536230.84
HOME R981 37.2 188050.97 4536292.88
HOME R986 37.2 188068.19 4536259.53
HOME R992 37.2 188020.97 4536322.63
HOME R1059 37.2 187837.45 4536558.31
HOME R1060 37.2 187826.4 4536581.74
HOME R1065 37.2 187785.79 4536611.04
HOME R1083 37.2 187744.76 4536658.23
HOME R1084 37.2 187745.36 4536672.52
HOME R1120 37.2 187598.54 4536889.2
HOME R1127 37.2 187632.1 4536844.29
HOME R1128 37.2 187664.45 4536791.53
Page 16 of 24

TABLE B-1
Noise Results and Receptor Locations
Sound Pressure
Level X Y
Structure
Type
Residence
ID (dBA) (m) (m)
Coordinates (UTM NAD 83 Z17N)
HOME R309 37.1 187288.67 4542566.73
HOME R601 37.1 196572.8 4548786.38
HOME R858 37.1 190384.38 4534286.09
HOME R912 37.1 188137.52 4536154.89
HOME R913 37.1 188122.27 4536155.16
HOME R914 37.1 188162.95 4536118.23
HOME R973 37.1 188099.37 4536187.17
HOME R982 37.1 188033.69 4536286.18
HOME R984 37.1 188066.3 4536223.33
HOME R985 37.1 188065.95 4536239.86
HOME R990 37.1 187984.21 4536328.98
HOME R991 37.1 188001.76 4536314.7
HOME R1043 37.1 187956.89 4536357.65
HOME R1057 37.1 187784.28 4536564.94
HOME R1058 37.1 187784.34 4536588.9
HOME R1061 37.1 187822.92 4536524.6
HOME R1080 37.1 187744.44 4536618.54
HOME R1081 37.1 187744.28 4536629.99
HOME R1082 37.1 187744.86 4536643.21
HOME R1087 37.1 187712.59 4536658.42
HOME R1135 37.1 187568.95 4536894
HOME R1137 37.1 187516.98 4536949.23
HOME R1062 37.1 187825.02 4536500.6
HOME R592 37 197171.63 4548712.47
HOME R857 37 190407.92 4534231.5
HOME R983 37 188068.43 4536199.14
HOME R987 37 188005.43 4536268.87
HOME R988 37 187960.8 4536298.23
HOME R989 37 187983.12 4536302.3
HOME R1044 37 187924.6 4536364.88
HOME R1051 37 187824.98 4536477.66
HOME R1055 37 187781.62 4536513.86
HOME R1056 37 187780.57 4536535.69
HOME R1079 37 187745.36 4536588.85
HOME R1086 37 187716.76 4536630.82
HOME R1088 37 187699.74 4536659.71
HOME R1089 37 187685.08 4536659.6
HOME R1094 37 187692.84 4536633.01
HOME R1134 37 187540.02 4536895.92
HOME R1138 37 187485.54 4536950.49
HOME R1148 37 187085.05 4537836.78
HOME R1133 37 187510.71 4536896.42
HOME R455 36.9 188644.22 4545850.3
HOME R580 36.9 199590.1 4548487.41
HOME R1045 36.9 187897.81 4536359.62
HOME R1047 36.9 187926.34 4536327.67
HOME R1048 36.9 187948.6 4536291.05
HOME R1050 36.9 187820.7 4536450.56
HOME R1054 36.9 187779.88 4536495.66
HOME R1085 36.9 187710.54 4536601.6
HOME R1090 36.9 187683.73 4536602.06
Page 17 of 24
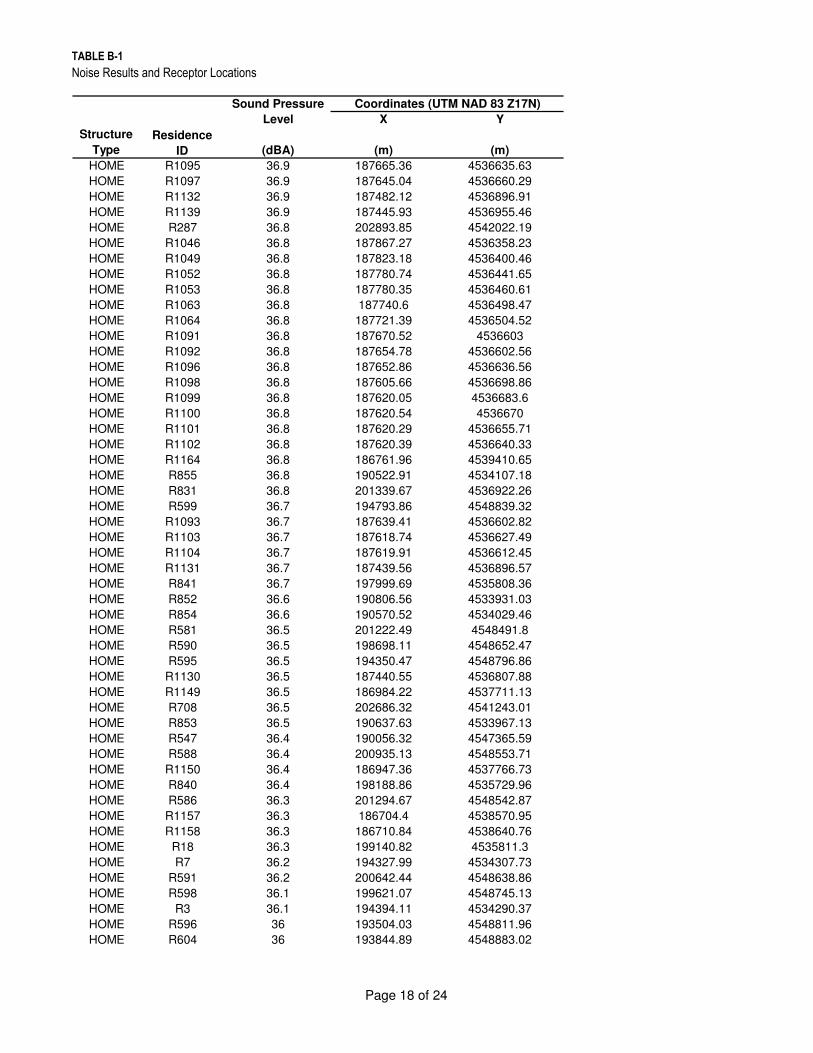
TABLE B-1
Noise Results and Receptor Locations
Sound Pressure
Level X Y
Structure
Type
Residence
ID (dBA) (m) (m)
Coordinates (UTM NAD 83 Z17N)
HOME R1095 36.9 187665.36 4536635.63
HOME R1097 36.9 187645.04 4536660.29
HOME R1132 36.9 187482.12 4536896.91
HOME R1139 36.9 187445.93 4536955.46
HOME R287 36.8 202893.85 4542022.19
HOME R1046 36.8 187867.27 4536358.23
HOME R1049 36.8 187823.18 4536400.46
HOME R1052 36.8 187780.74 4536441.65
HOME R1053 36.8 187780.35 4536460.61
HOME R1063 36.8 187740.6 4536498.47
HOME R1064 36.8 187721.39 4536504.52
HOME R1091 36.8 187670.52 4536603
HOME R1092 36.8 187654.78 4536602.56
HOME R1096 36.8 187652.86 4536636.56
HOME R1098 36.8 187605.66 4536698.86
HOME R1099 36.8 187620.05 4536683.6
HOME R1100 36.8 187620.54 4536670
HOME R1101 36.8 187620.29 4536655.71
HOME R1102 36.8 187620.39 4536640.33
HOME R1164 36.8 186761.96 4539410.65
HOME R855 36.8 190522.91 4534107.18
HOME R831 36.8 201339.67 4536922.26
HOME R599 36.7 194793.86 4548839.32
HOME R1093 36.7 187639.41 4536602.82
HOME R1103 36.7 187618.74 4536627.49
HOME R1104 36.7 187619.91 4536612.45
HOME R1131 36.7 187439.56 4536896.57
HOME R841 36.7 197999.69 4535808.36
HOME R852 36.6 190806.56 4533931.03
HOME R854 36.6 190570.52 4534029.46
HOME R581 36.5 201222.49 4548491.8
HOME R590 36.5 198698.11 4548652.47
HOME R595 36.5 194350.47 4548796.86
HOME R1130 36.5 187440.55 4536807.88
HOME R1149 36.5 186984.22 4537711.13
HOME R708 36.5 202686.32 4541243.01
HOME R853 36.5 190637.63 4533967.13
HOME R547 36.4 190056.32 4547365.59
HOME R588 36.4 200935.13 4548553.71
HOME R1150 36.4 186947.36 4537766.73
HOME R840 36.4 198188.86 4535729.96
HOME R586 36.3 201294.67 4548542.87
HOME R1157 36.3 186704.4 4538570.95
HOME R1158 36.3 186710.84 4538640.76
HOME R18 36.3 199140.82 4535811.3
HOME R7 36.2 194327.99 4534307.73
HOME R591 36.2 200642.44 4548638.86
HOME R598 36.1 199621.07 4548745.13
HOME R3 36.1 194394.11 4534290.37
HOME R596 36 193504.03 4548811.96
HOME R604 36 193844.89 4548883.02
Page 18 of 24

TABLE B-1
Noise Results and Receptor Locations
Sound Pressure
Level X Y
Structure
Type
Residence
ID (dBA) (m) (m)
Coordinates (UTM NAD 83 Z17N)
HOME R1151 36 186851.34 4537703.21
HOME R1152 36 186804.48 4537832.19
HOME R4 36 194485.91 4534298.03
HOME R6 35.9 194549.8 4534299.06
HOME R597 35.9 193451.19 4548829.63
HOME R612 35.9 194749.34 4549071.91
HOME R750 35.9 205351.3 4545202.91
HOME R851 35.9 191219.04 4533621.59
HOME R136 35.9 202192.72 4538855.39
HOME R824 35.9 199136.09 4535680.45
HOME R602 35.8 193583.44 4548882.42
HOME R611 35.8 199700.51 4548872.99
HOME R696 35.8 204500.97 4547268.52
HOME R1153 35.8 186742.3 4537834.06
HOME R1154 35.8 186769.04 4537782.65
HOME R1163 35.8 186482.76 4539412.75
HOME R5 35.8 194645.79 4534297.1
HOME R692 35.7 204345.29 4543066.42
HOME R823 35.7 199912.6 4535707.36
HOME R829 35.7 201390.75 4536536.86
HOME R830 35.7 201399.9 4536561.18
HOME R213 35.6 186458.55 4540218.08
HOME R325 35.6 204296.69 4542986.58
HOME R543 35.6 189696.33 4547350.36
HOME R751 35.6 205416.31 4545222.93
HOME R1155 35.6 186675.36 4537840.04
HOME R216 35.5 186410.75 4540259.18
HOME R133 35.5 202336.57 4538841.78
HOME R219 35.4 186386.89 4540336.22
HOME R574 35.4 204435.77 4547452.71
HOME R582 35.4 202561.16 4548484.55
HOME R1156 35.4 186612.8 4537835.48
HOME R1161 35.4 186346.15 4539494.8
HOME R1165 35.4 186353.32 4539286.08
HOME R1167 35.4 188036.25 4545900.27
HOME R828 35.4 201399.62 4536442.33
HOME R549 35.3 189575.46 4547382.14
HOME R600 35.3 192551.59 4548875.31
HOME R1162 35.3 186341.86 4539400.66
HOME R577 35.1 189980.2 4547847.36
HOME R139 35.1 202512.11 4538857.31
HOME R615 35 194826.16 4549418.55
HOME R281 34.9 186491.04 4542129.17
HOME R606 34.9 192273.95 4548939.46
HOME R740 34.9 205108.94 4546830.89
HOME R141 34.9 202587.46 4538861.65
HOME R709 34.9 202516.5 4538622.2
HOME R607 34.8 192168.64 4548958.06
HOME R697 34.8 204503.89 4547612.4
HOME R1174 34.8 204341.39 4542584.74
HOME R280 34.7 186383.71 4542067.52
Page 19 of 24

TABLE B-1
Noise Results and Receptor Locations
Sound Pressure
Level X Y
Structure
Type
Residence
ID (dBA) (m) (m)
Coordinates (UTM NAD 83 Z17N)
HOME R315 34.7 204273.61 4542428.19
HOME R593 34.7 191558.95 4548812.53
HOME R609 34.7 191971.15 4548967.12
HOME R617 34.7 196390.32 4549639.86
HOME R710 34.7 202586.28 4538636.16
HOME R328 34.6 186495.57 4543335.06
HOME R711 34.6 202498.09 4538230.81
HOME R816 34.6 200662.66 4535619.38
HOME R827 34.6 201378.45 4536124.59
HOME R322 34.4 186433.66 4543205
HOME R350 34.4 186530.35 4543900.35
HOME R545 34.4 189097.03 4547375.95
HOME R605 34.4 191499.24 4548934.91
HOME R1169 34.4 187581.57 4545915.78
HOME R620 34.3 196469.42 4549800.08
HOME R1168 34.3 187475.76 4545834.73
HOME R822 34.3 199978.96 4535295.49
HOME R295 34.2 204327.07 4542143.54
HOME R622 34.2 196469.59 4549842.21
HOME R589 34.1 203538.88 4548533.92
HOME R603 34.1 191224.9 4548924.51
HOME R752 34.1 205784.4 4545131.72
HOME R565 34 188971.86 4547493.17
HOME R624 34 196483.28 4549904.1
HOME R814 34 200664.29 4535407.86
HOME R826 34 201191.57 4535724.04
HOME R691 33.9 204319.16 4541869.76
HOME R712 33.9 202566.65 4537601.54
HOME R832 33.9 201866.88 4536374.91
HOME R815 33.9 200960.29 4535546.12
HOME R626 33.8 196457.4 4550015.79
HOME R757 33.8 205452.11 4543529.72
HOME R613 33.7 191588.62 4549249.64
HOME R563 33.6 188728.4 4547478.83
HOME R587 33.6 203908.35 4548498.58
HOME R623 33.6 199650.95 4549794.03
HOME R821 33.6 199180.71 4534814.5
HOME R585 33.5 204017.58 4548497.19
HOME R618 33.5 201275.27 4549576.8
HOME R628 33.5 197299.59 4550075.03
HOME R1170 33.5 187113.65 4545842.9
HOME R677 33.5 202537.01 4537179.86
HOME R820 33.5 199185.05 4534761.99
HOME R834 33.5 202136.34 4536494.39
HOME R583 33.4 204081.14 4548485.6
HOME R614 33.4 202888.27 4549107.03
HOME R742 33.4 205607.72 4546807.13
HOME R819 33.4 199180.66 4534709.63
HOME R833 33.4 202081.89 4536376.47
HOME R562 33.3 188539.95 4547475.22
HOME R610 33.3 190640.64 4549018.04
Page 20 of 24
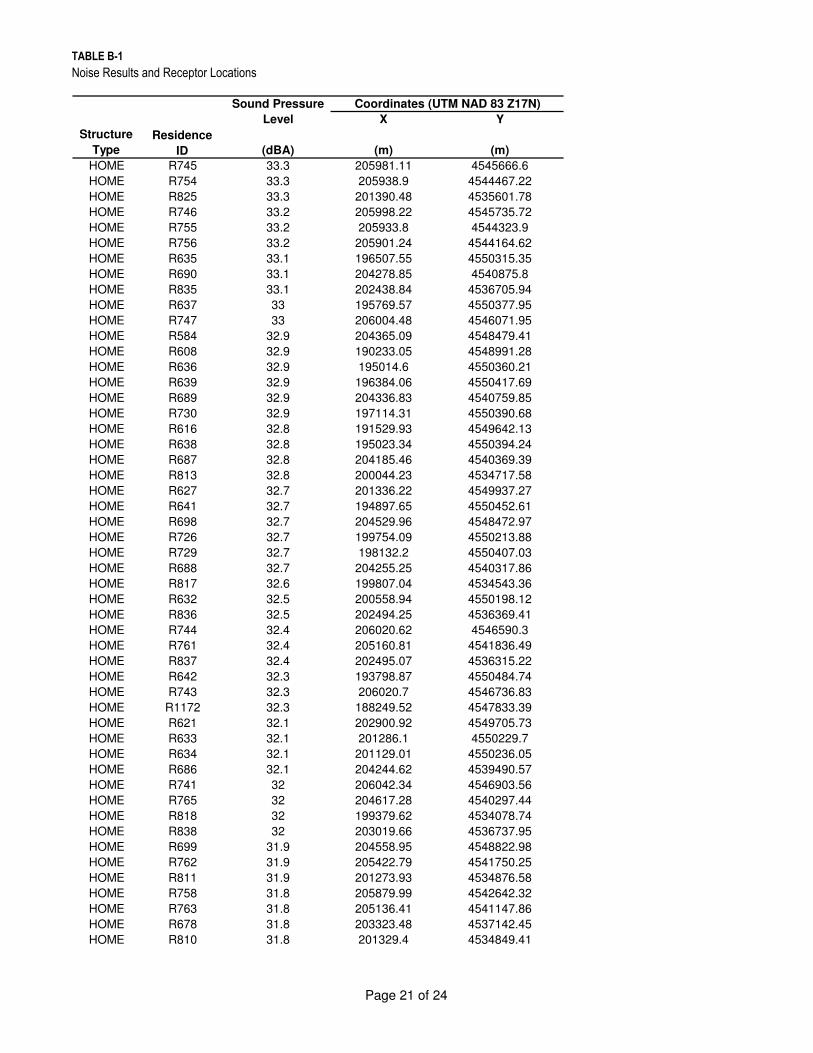
TABLE B-1
Noise Results and Receptor Locations
Sound Pressure
Level X Y
Structure
Type
Residence
ID (dBA) (m) (m)
Coordinates (UTM NAD 83 Z17N)
HOME R745 33.3 205981.11 4545666.6
HOME R754 33.3 205938.9 4544467.22
HOME R825 33.3 201390.48 4535601.78
HOME R746 33.2 205998.22 4545735.72
HOME R755 33.2 205933.8 4544323.9
HOME R756 33.2 205901.24 4544164.62
HOME R635 33.1 196507.55 4550315.35
HOME R690 33.1 204278.85 4540875.8
HOME R835 33.1 202438.84 4536705.94
HOME R637 33 195769.57 4550377.95
HOME R747 33 206004.48 4546071.95
HOME R584 32.9 204365.09 4548479.41
HOME R608 32.9 190233.05 4548991.28
HOME R636 32.9 195014.6 4550360.21
HOME R639 32.9 196384.06 4550417.69
HOME R689 32.9 204336.83 4540759.85
HOME R730 32.9 197114.31 4550390.68
HOME R616 32.8 191529.93 4549642.13
HOME R638 32.8 195023.34 4550394.24
HOME R687 32.8 204185.46 4540369.39
HOME R813 32.8 200044.23 4534717.58
HOME R627 32.7 201336.22 4549937.27
HOME R641 32.7 194897.65 4550452.61
HOME R698 32.7 204529.96 4548472.97
HOME R726 32.7 199754.09 4550213.88
HOME R729 32.7 198132.2 4550407.03
HOME R688 32.7 204255.25 4540317.86
HOME R817 32.6 199807.04 4534543.36
HOME R632 32.5 200558.94 4550198.12
HOME R836 32.5 202494.25 4536369.41
HOME R744 32.4 206020.62 4546590.3
HOME R761 32.4 205160.81 4541836.49
HOME R837 32.4 202495.07 4536315.22
HOME R642 32.3 193798.87 4550484.74
HOME R743 32.3 206020.7 4546736.83
HOME R1172 32.3 188249.52 4547833.39
HOME R621 32.1 202900.92 4549705.73
HOME R633 32.1 201286.1 4550229.7
HOME R634 32.1 201129.01 4550236.05
HOME R686 32.1 204244.62 4539490.57
HOME R741 32 206042.34 4546903.56
HOME R765 32 204617.28 4540297.44
HOME R818 32 199379.62 4534078.74
HOME R838 32 203019.66 4536737.95
HOME R699 31.9 204558.95 4548822.98
HOME R762 31.9 205422.79 4541750.25
HOME R811 31.9 201273.93 4534876.58
HOME R758 31.8 205879.99 4542642.32
HOME R763 31.8 205136.41 4541147.86
HOME R678 31.8 203323.48 4537142.45
HOME R810 31.8 201329.4 4534849.41
Page 21 of 24

TABLE B-1
Noise Results and Receptor Locations
Sound Pressure
Level X Y
Structure
Type
Residence
ID (dBA) (m) (m)
Coordinates (UTM NAD 83 Z17N)
HOME R685 31.7 204205.49 4538821.76
HOME R808 31.7 201429.09 4534852.95
HOME R809 31.7 201394.05 4534848.31
HOME R725 31.6 199669.73 4550758.06
HOME R759 31.6 205649.12 4541941.53
HOME R1171 31.6 186632.94 4546530.94
HOME R630 31.5 191639.41 4550299.92
HOME R648 31.5 194819.64 4551018.42
HOME R684 31.5 204134.63 4538492.14
HOME R803 31.5 202454.05 4535611.45
HOME R760 31.3 205797.64 4541874.84
HOME R767 31.2 204480.09 4538758.06
HOME R812 31.2 201211.15 4534475.65
HOME R683 31.1 204171.45 4537958.87
HOME R805 31.1 201834.4 4534842.52
HOME R629 31 203309.74 4550063.2
HOME R682 31 204185.41 4537884.78
HOME R801 31 202466.44 4535314.11
HOME R681 30.9 204198.3 4537744.13
HOME R644 30.8 191630.77 4550676.59
HOME R764 30.8 205837.54 4541315.07
HOME R1173 30.8 188273.55 4548824.1
HOME R679 30.8 204095.92 4537520.95
HOME R631 30.7 203552.42 4550125.43
HOME R649 30.7 193192.27 4551192.5
HOME R804 30.7 202041.05 4534763.83
HOME R619 30.6 189466.02 4549821.51
HOME R646 30.6 191621.18 4550798.69
HOME R839 30.6 203934.66 4536994.94
HOME R806 30.6 201536.89 4534309.28
HOME R651 30.5 193276.59 4551335.16
HOME R680 30.5 204109.88 4537160.2
HOME R783 30.4 204266.74 4537313.65
HOME R802 30.4 202273.35 4534754.62
HOME R654 30.3 194846.56 4551688.26
HOME R700 30.3 204514.68 4549757.28
HOME R714 30.3 201391.14 4551163.34
HOME R768 30.3 205032.49 4538737.85
HOME R769 30.3 205010.86 4538656.84
HOME R776 30.3 204917.92 4538447.7
HOME R807 30.3 201388.89 4534035.66
HOME R647 30.2 191578.73 4551043.68
HOME R655 30.2 194922.06 4551796.09
HOME R770 30.2 205075.27 4538654.91
HOME R656 30.1 194923.97 4551839.71
HOME R771 30.1 205071.5 4538603.34
HOME R782 30.1 204544.3 4537461.81
HOME R784 30.1 204304.68 4537092.93
HOME R653 30 193286.63 4551643.86
HOME R657 30 196288.75 4551954.61
HOME R766 30 205795.95 4540087.24
Page 22 of 24

TABLE B-1
Noise Results and Receptor Locations
Sound Pressure
Level X Y
Structure
Type
Residence
ID (dBA) (m) (m)
Coordinates (UTM NAD 83 Z17N)
HOME R779 30 204916.71 4538041.78
HOME R780 29.9 204914.99 4537925.13
HOME R659 29.8 195733.58 4552055.36
HOME R660 29.8 195793.99 4552054.22
HOME R777 29.8 205147.69 4538365.81
HOME R772 29.8 205358.98 4538721.52
HOME R774 29.8 205300.03 4538597.64
HOME R778 29.8 205132.92 4538256.66
HOME R775 29.7 205360.22 4538572.17
HOME R1175 29.7 205403.66 4538626.52
HOME R800 29.7 202860.32 4534737.59
HOME R625 29.6 188803.91 4550065.65
HOME R706 29.6 203035.54 4550985.22
HOME R773 29.6 205475.64 4538652.14
HOME R724 29.5 200230.77 4551887.61
HOME R705 29.4 203034.46 4551099.03
HOME R723 29.4 200527.14 4551875.78
HOME R799 29.4 203841.34 4535584.22
HOME R652 29.3 191598.87 4551606.23
HOME R658 29.3 193251.54 4552079.63
HOME R715 29.3 201341.54 4551746.54
HOME R781 29.3 205328.51 4537932.07
HOME R786 29.2 204988.25 4537164.17
HOME R662 29.1 193000.22 4552145.74
HOME R716 29.1 201399.52 4551856.05
HOME R717 29.1 201502.59 4551832.43
HOME R785 29.1 204959.89 4537038.21
HOME R788 29.1 205056.07 4537158.18
HOME R718 29 201689.41 4551822.77
HOME R719 29 201835.43 4551761.57
HOME R722 29 201678.78 4551857.23
HOME R787 29 205093.36 4537047.63
HOME R798 29 202834.31 4534173.09
HOME R661 28.9 192534.3 4552115.37
HOME R720 28.9 201914.37 4551808.98
HOME R721 28.9 201961.61 4551812.2
HOME R640 28.8 188768.71 4550562.22
HOME R789 28.8 205286.56 4537142.78
HOME R790 28.8 204803.12 4536365.47
HOME R791 28.8 204661.15 4536147.04
HOME R643 28.7 188765.3 4550653.86
HOME R669 28.7 192197.16 4552199.11
HOME R703 28.6 202830.93 4551703.42
HOME R704 28.6 202567.89 4551797.9
HOME R794 28.5 203816.65 4534753.73
HOME R702 28.4 202961.92 4551783.94
HOME R645 28.2 188350.46 4550757.05
HOME R793 28.2 204080.35 4534796.88
HOME R792 28.2 204758.92 4535546.36
HOME R663 28.1 191001.55 4552193.64
HOME R797 28.1 203374.51 4533985.9
Page 23 of 24
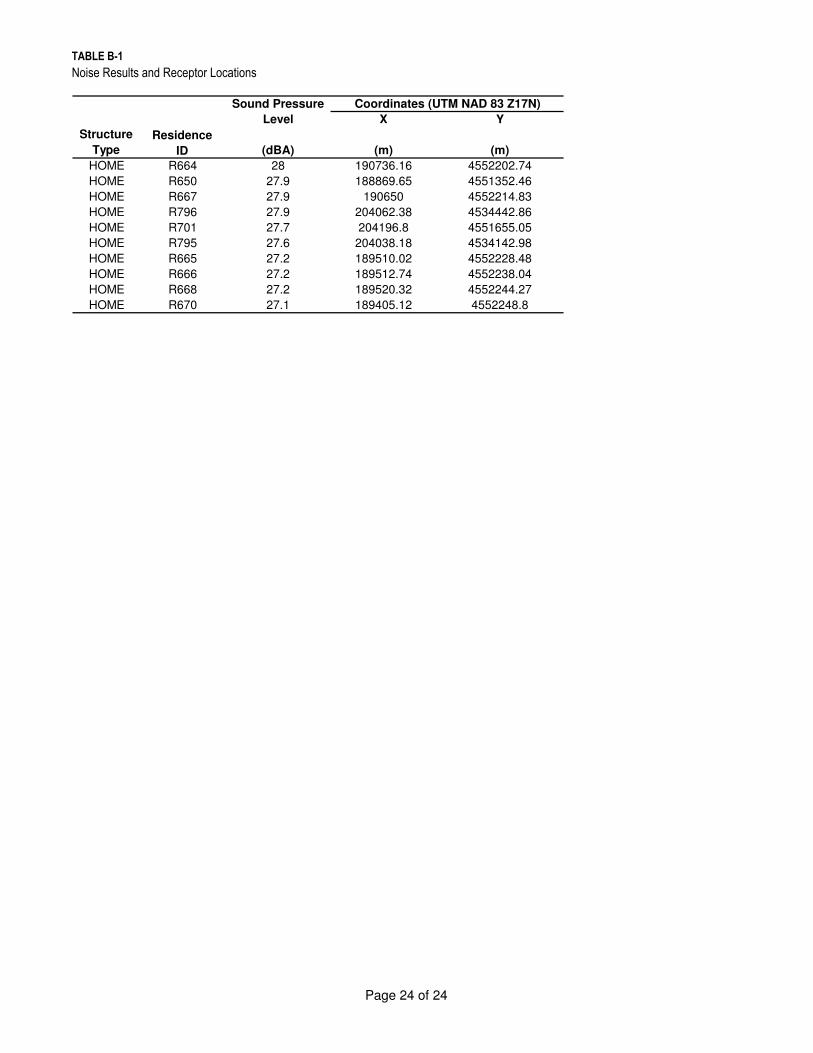
TABLE B-1
Noise Results and Receptor Locations
Sound Pressure
Level X Y
Structure
Type
Residence
ID (dBA) (m) (m)
Coordinates (UTM NAD 83 Z17N)
HOME R664 28 190736.16 4552202.74
HOME R650 27.9 188869.65 4551352.46
HOME R667 27.9 190650 4552214.83
HOME R796 27.9 204062.38 4534442.86
HOME R701 27.7 204196.8 4551655.05
HOME R795 27.6 204038.18 4534142.98
HOME R665 27.2 189510.02 4552228.48
HOME R666 27.2 189512.74 4552238.04
HOME R668 27.2 189520.32 4552244.27
HOME R670 27.1 189405.12 4552248.8
Page 24 of 24

TABLE B-2
Noise Source Locations
Source Sound
Source Power Level Height X Y
ID (dBA) (m) (m) (m)
Substation 1 100 4 198371.8 4538246.86
Substation 2 100 4 192927.35 4538687.54
Substation 3 100 4 200167.4 4537067.41
Substation 4 100 4 200167.4 4537067.41
WTG_1 108.4 100 189115.81 4543882.01
WTG_2 108.4 100 189122.14 4543565.58
WTG_3 108.4 100 189615.91 4542203.14
WTG_4 108.4 100 189794.66 4543933.75
WTG_5 108.4 100 189977.95 4543275
WTG_6 108.4 100 190455.41 4544318.05
WTG_7 108.4 100 190470.43 4543892.22
WTG_8 108.4 100 190497.6 4543603.72
WTG_9 108.4 100 191108.54 4543333.04
WTG_10 108.4 100 190359.09 4542794.82
WTG_11 108.4 100 190526.5 4542186.53
WTG_12 108.4 100 190633.77 4541927.83
WTG_13 108.4 100 190777.05 4541626.53
WTG_14 108.4 100 190914.85 4541399.93
WTG_15 108.4 100 188981.02 4540601.83
WTG_16 108.4 100 188900.81 4539804.84
WTG_17 108.4 100 188953.26 4539545.45
WTG_18 108.4 100 188874.51 4539143.96
WTG_19 108.4 100 188944.02 4538076.36
WTG_20 108.4 100 189134.81 4537941.11
WTG_21 108.4 100 189725.83 4539024.03
WTG_22 108.4 100 190683.04 4539861.48
WTG_23 108.4 100 190732.81 4539604.32
WTG_24 108.4 100 190640.47 4538864
WTG_25 108.4 100 190893.86 4538732.24
WTG_26 108.4 100 190605.93 4538097.21
WTG_27 108.4 100 190655.75 4537839.12
WTG_28 108.4 100 190372.5 4537037.95
WTG_29 108.4 100 190502.65 4536779.3
WTG_30 108.4 100 190551.62 4536523.83
WTG_31 108.4 100 191600.48 4540531.19
WTG_32 108.4 100 191650.52 4540274.9
WTG_33 108.4 100 191749.3 4539877.68
WTG_34 108.4 100 192107.89 4539760.32
WTG_35 108.4 100 192276.5 4539481.31
WTG_36 108.4 100 191817.26 4538750.4
WTG_37 108.4 100 191439.89 4537999.67
WTG_38 108.4 100 191489.81 4537743.87
WTG_39 108.4 100 192221.66 4537984.49
WTG_40 108.4 100 192164.75 4536941.38
WTG_41 108.4 100 192239.06 4536685.45
WTG_42 108.4 100 192289.38 4536428.77
WTG_43 108.4 100 191705.18 4535578.82
WTG_44 108.4 100 191964.24 4535477.14
WTG_45 108.4 100 192971.81 4536883.66
WTG_46 108.4 100 193201.2 4536784.07
WTG_47 108.4 100 193254.28 4536518.5
WTG_48 108.4 100 193147.43 4541381.94
Coordinates (UTM NAD 83 Z17N)
Page 25 of 29

TABLE B-2
Noise Source Locations
Source Sound
Source Power Level Height X Y
ID (dBA) (m) (m) (m)
Coordinates (UTM NAD 83 Z17N)
WTG_49 108.4 100 193416.39 4541334.72
WTG_50 108.4 100 193680.81 4541271.74
WTG_51 108.4 100 193942.96 4541208.91
WTG_52 108.4 100 194156.83 4541028.81
WTG_53 108.4 100 193114.09 4540562.26
WTG_54 108.4 100 193499.01 4540313.75
WTG_55 108.4 100 193075.74 4539690.07
WTG_56 108.4 100 193206.63 4539426.72
WTG_57 108.4 100 193463.73 4539340.56
WTG_58 108.4 100 193039.16 4538542.82
WTG_59 108.4 100 193908.91 4537961.85
WTG_60 108.4 100 194004.21 4537700.43
WTG_61 108.4 100 195015.81 4540047.42
WTG_62 108.4 100 195065.62 4539791.92
WTG_63 108.4 100 195116.57 4539536.61
WTG_64 108.4 100 194885.94 4538763.11
WTG_65 108.4 100 194935.94 4538506.37
WTG_66 108.4 100 191555.32 4546240.72
WTG_67 108.4 100 191605.93 4545981.94
WTG_68 108.4 100 192415.19 4546261.57
WTG_69 108.4 100 192465.8 4546002.79
WTG_70 108.4 100 192731.23 4545140.8
WTG_71 108.4 100 193463.28 4545396.06
WTG_72 108.4 100 193513.89 4545137.28
WTG_73 108.4 100 194208.62 4546183.95
WTG_74 108.4 100 194257.92 4545927.03
WTG_75 108.4 100 194278.88 4545200.96
WTG_76 108.4 100 194299.96 4544933.14
WTG_77 108.4 100 193944.56 4544549.65
WTG_78 108.4 100 193940.44 4544260.41
WTG_79 108.4 100 193986.53 4542967.18
WTG_80 108.4 100 194037.17 4542710.79
WTG_81 108.4 100 194934.14 4543301.55
WTG_82 108.4 100 194984.72 4543044.48
WTG_83 108.4 100 194990.67 4542781.58
WTG_84 108.4 100 195029.06 4542523.61
WTG_85 108.4 100 195579.52 4543685.14
WTG_86 108.4 100 195630.15 4543428.75
WTG_87 108.4 100 195653.66 4546783.48
WTG_88 108.4 100 195703.13 4546527.15
WTG_89 108.4 100 195753.71 4546269.55
WTG_90 108.4 100 195803.18 4546013.23
WTG_91 108.4 100 196464.04 4546662.94
WTG_92 108.4 100 196503.72 4546403.7
WTG_93 108.4 100 196771.02 4544405.32
WTG_94 108.4 100 196820.83 4544147.22
WTG_95 108.4 100 197540.1 4544371.33
WTG_96 108.4 100 197589.92 4544113.23
WTG_97 108.4 100 196834.87 4543560.4
WTG_98 108.4 100 196883.72 4543302.83
WTG_99 108.4 100 196941.88 4543019.39
WTG_100 108.4 100 196424.35 4542538.65
Page 26 of 29

TABLE B-2
Noise Source Locations
Source Sound
Source Power Level Height X Y
ID (dBA) (m) (m) (m)
Coordinates (UTM NAD 83 Z17N)
WTG_101 108.4 100 197294.44 4542857.4
WTG_102 108.4 100 197343.84 4542600.2
WTG_103 108.4 100 197593.14 4542438.21
WTG_104 108.4 100 197391.16 4541976.31
WTG_105 108.4 100 196749.8 4541935.98
WTG_106 108.4 100 196762.36 4541671.41
WTG_107 108.4 100 196453.61 4541112.51
WTG_108 108.4 100 196726.18 4541049.81
WTG_109 108.4 100 197431.92 4541175.2
WTG_110 108.4 100 197483.93 4540916.36
WTG_111 108.4 100 196382.24 4540411.31
WTG_112 108.4 100 196618.19 4540300.09
WTG_113 108.4 100 196669.32 4540044.2
WTG_114 108.4 100 197045.85 4539951.35
WTG_115 108.4 100 197095.26 4539695.24
WTG_116 108.4 100 197145.68 4539437.96
WTG_117 108.4 100 196490.24 4538590.68
WTG_118 108.4 100 196539.69 4538332.41
WTG_119 108.4 100 196590.56 4538076.58
WTG_120 108.4 100 197042.76 4538690.83
WTG_121 108.4 100 197093 4538433.67
WTG_122 108.4 100 197986.87 4538378.96
WTG_123 108.4 100 198084.41 4541855.07
WTG_124 108.4 100 198134.38 4541599.21
WTG_125 108.4 100 198106.52 4540798.81
WTG_126 108.4 100 198175.67 4540398.51
WTG_127 108.4 100 198233.41 4540119.85
WTG_128 108.4 100 199166.55 4543194.22
WTG_129 108.4 100 199215.3 4542936.48
WTG_130 108.4 100 198816.36 4542390.14
WTG_131 108.4 100 198801.74 4541990.87
WTG_132 108.4 100 198851.71 4541735.02
WTG_133 108.4 100 198766.95 4541263.19
WTG_134 108.4 100 198764.24 4540905.64
WTG_135 108.4 100 199672.34 4542584.16
WTG_136 108.4 100 199620.97 4541273.74
WTG_137 108.4 100 199615.56 4541023.11
WTG_138 108.4 100 199676.43 4540712.71
WTG_139 108.4 100 199746.76 4538495.44
WTG_140 108.4 100 199796.33 4538239.41
WTG_141 108.4 100 199846.81 4537983.33
WTG_142 108.4 100 197661.7 4545655.38
WTG_143 108.4 100 198352.15 4545876.47
WTG_144 108.4 100 198403.27 4545613.78
WTG_145 108.4 100 198435.06 4544811.08
WTG_146 108.4 100 199192.93 4545916.51
WTG_147 108.4 100 199260.77 4545659.96
WTG_148 108.4 100 199687.75 4544393.08
WTG_149 108.4 100 199964.52 4544335.74
WTG_150 108.4 100 200012.59 4544080.88
WTG_151 108.4 100 199973.41 4543514.46
WTG_152 108.4 100 200131.87 4543296.88
Page 27 of 29

TABLE B-2
Noise Source Locations
Source Sound
Source Power Level Height X Y
ID (dBA) (m) (m) (m)
Coordinates (UTM NAD 83 Z17N)
WTG_153 108.4 100 200063.27 4545992.55
WTG_154 108.4 100 200159.73 4545733.84
WTG_155 108.4 100 200512.53 4544910.49
WTG_156 108.4 100 200714.74 4544740.47
WTG_157 108.4 100 200971.11 4546364.69
WTG_158 108.4 100 201375.91 4545946.58
WTG_159 108.4 100 201369.98 4545692.61
WTG_160 108.4 100 201340.38 4545136.77
WTG_161 108.4 100 201639 4545023.7
WTG_162 108.4 100 201746.54 4544735.91
WTG_163 108.4 100 202518.09 4545748.56
WTG_164 108.4 100 202567.77 4545491.54
WTG_165 108.4 100 203142.65 4545889.91
WTG_166 108.4 100 203244.45 4545616.59
WTG_167 108.4 100 203766.6 4544915.23
Page 28 of 29

B L U E C R E E KB L U E C R E E K
J A C K S O NJ A C K S O N
P L E A S A N TP L E A S A N TR I D G ER I D G E
T U L L YT U L L Y
L A T T YL A T T Y
U N I O NU N I O N
W A S H I N G T O NW A S H I N G T O N
W A S H I N G T O NW A S H I N G T O NB E N T O NB E N T O N
H A R R I S O NH A R R I S O N
H O A G L I NH O A G L I N
GROVER HILL
HAVILAND
CONVOY
SCOTT
VANWERT
PAULDINGVAN WERT
49
4 9
6 37
6 37
637
114
49114
114
114
B1 B2
A2A1BLAINEBLAINE
RR DD 11 66
55
RR DD 66 55
RR DD 55 77
RR DD 33 88
RR DD 2288
RR DD 99 55
RD 16RD 16
RR DD 44 88
RR DD 33 00
RR DD 2200
RR DD 5566
RR DD 11 33
77
RR DD 11 33
11
RR DD 11 22
33
RR DD 22 66
RR DD 4400
RR DD 4488
RR DD 99 11
RR DD 66 77
RR DD 11 55
55
RR DD 11 00
11
RR DD 11 00
77
RR DD 2244
RR DD 1188
RD 11
7RD
117
RR DD 55 99
RD 15
1RD
151
RR DD 88 77
RR DD 1122
RR DD 1122
RR DD 44 99
RR DD 77 99
RR DD 4488RR DD 4488
RR DD 77 11
NORTHNORTH
PERRYPERRY
HARR
ISON
HARR
ISON
FIRSTFIRST
WAYN
EWA
YNE
VINE
VINE
MONR
OEMO
NROE
WWAAYY NN EE
MCKI
NLEY
MCKI
NLEY
SHER
IDAN
SHER
IDAN
WALNUTWALNUT MAPL
EMA
PLE
SHERMANSHERMAN
FRANKLINFRANKLIN
OAKOAKLINN
LINNPIN
EPIN
E
ELM
ELM
WATERWATER
224
127
30
15
2
17
1920
3
4
21
5
10
6
7
8
11
12
26
24
22
13
27
23
14
25
9
66
67
37
31
38
32
33
36
34
68
69
133
145
127
44
144
126
143
125
43
124
122
30
123
103
110
29
142
96
109
95
104
102
28
101
119
116
121
115
120
114
118
99
98
117
167
106
166
97
165
164
163
108
105
162
161
159
113
158
94
160
157
16
112
93
107
156
111
100
92
91
90
89
18
1
155
152
141
154
150
15186
88
153
139
149
138
85
137
87
63
62
61
65
64
48136
84
83
82
81
52
135
148
60
76
75
74
59
73
80
51
79
78
77
50
57
54
49
47
46
72
71
56
53
45
58
129
128
147
146
55
70
140
132
42
41
35
39
134
131
40
130
EE LL MM SS UU GG AA RR
WOLFCALEWOLFCALE
GIFFINGIFFIN
MARS
HMA
RSH
FFEE AA SS BB YY WW IISS EE NN EE RR
VVAA NN WW EE RRTT PPAAUU LLDD IINN GG CC OO LL II NN EE
BAKE
RBA
KER
POLLOCKPOLLOCK
HESSIANHESSIAN
HH OOAA GG
LL IINN
CC EENN TT
EE RR
CONVOYCONVOY
EELL MM SS UU GGAA RR
MENTZERMENTZER
COLW
ELL
COLW
ELL
FF EEAA SS BB YY WW II SS EENN EE RR
DD IIXX OONN CC AAVV EE TT TT
MEND
ONME
NDON
SLAN
ESL
ANE
CARMEANCARMEAN
TT OOWW
NN CC RR
EE EEKK
SHAWSHAW
CHEN
OWITH
CHEN
OWITH
RUMB
LERU
MBLE
BLAC
HLEY
BLAC
HLEY
JJ OOHH NN
YY OOHH
HOAG
LINHO
AGLIN
DD UUTT CC
HH JJ OO
HH NN
STEM
ENST
EMEN
SCOT
TSC
OTT
DD UULL LL
RR OOBB II
NN SSOO NN
MOSIE
RMO
SIER
MMOO HH RR
FFEE AA SS BB YY WW IISS EE NN EE RR
TAYLORTAYLOR
STERLINGSTERLING
DD EE FF II AA NN CC EE
STRI
PEST
RIPE
PALMERPALMER
FLIN
GFL
ING
BOWERSBOWERS
KILGOREKILGORE
SS MMII TT
HH KK II
TT ZZEE NN
BB AARR GG
EE RR
NACHBARNACHBAR
HARVEYHARVEY
GALVINGALVIN
KELT
NER
KELT
NER
WALLERWALLER
CONV
OY-H
ELLE
RCO
NVOY
-HEL
LER
UU NN IIOO NN PP LL EEAA SS AA NN TT
TERRYTERRY
WARD
WARD
VVAANN WW EE RR TT PPAA UU LLDD II NN GG CC OO LL IINN EE
STAM
MST
AMM
BERG
NER
BERG
NER
LEITN
ERLE
ITNER
CHURCHCHURCH
LINCOLNLINCOLN
RICH
EYRI
CHEY
DD II XX OONN CC AAVV EE TTTT
CONVOYCONVOY
PAYN
EPA
YNE
CC OONN VV
OO YY HH EE
LL LLEE RR
DD UULL LL
RR OOBB II
NN SSOO NN
TULLYTULLY
FIFEFIFE
GG IILL LL
II LLAA NN
DD
LL IIBB EE
RR TTYY
UU NNII OO
NN
JOHN
BROW
NJO
HN BR
OWN
MMII DD
DD LLEE
PP OOII NN
TT WW
EE TTZZ EE
LL
CONVOYCONVOY
KENSLERKENSLER
WETZELWETZEL
BORO
FFBO
ROFF
DONE
RDO
NER
PEARSONPEARSONTULLY HARRISONTULLY HARRISON
DD OO GG CC RR
EE EEKK
HATT
ERY
HATT
ERY
HUTC
HINS
ONHU
TCHI
NSON
\\LAKEFRONT\PROJ\IBR_BLUECREEK_394265\MAPFILES\APPENDIX\NOISE\FIGURE2_NOISECONTOURSFORTURBINELAYOUT_D-SIZE_G1.MXD EKLEIN 12/14/2009 14:08:05
Notes:1. Base data sources: ESRI Data and Maps (2008) {airports, counties outside Ohio, states}Ohio Department of Transportation (2004){counties, townships, roads, active railroads, cities}Ohio Geographically Referenced Information Program (2005){local roads}Ohio Department of Natural Resources (1995){Sound Sensitive Resources}Ohio Department of Natural Resources (1980){Sound Sensitive Resources}3. Sound Contours: Sound contours based on Gamesa 2.0 megawatt G-90 turbine with 100 m hub height.
0 0.25 0.5Miles
LEGEND1:12,000 Grid
Proposed Turbine and Turbine ID NumberReceptor LocationProject Area BoundarySupplemental Development AreaExisting 138 kV Transmission LineExisting 345 kV Transmission LineProposed 115 kV Transmission LineProposed Access RoadProposed Collection SubstationO&M Building, Interconnection Substation, Temporary Batch Plant, Construction Laydown Area, andStaging AreaProposed Underground 34.5-kV Collection SystemProposed Aboveground 34.5-kV Collection System
Predicted Sound Level (dBA)Sound Sensitive Resources
SchoolsHealth Care/Assisted LivingReligious Institutions
VICINITY MAP
Indiana
West Virginia
Pennsylvania
Kentucky
Michigan Ontario
Virginia
1 in = 0.5 mileFIGURE B-1Blue Creek Wind Farm AreaSound Contours forWind Turbine LayoutMap Panel IndexDrawing 18-011Created: December 14, 2009

T U L L YT U L L YU N I O NU N I O N
B E N T O NB E N T O NB L U E C R E E KB L U E C R E E K
VAN WERTPAULDING
114114
114114
114
114114
51
54
47
5354
5453
51
5452
51
52
49
4847
46
44
43
42
41
54
39
38
37
36
54
5352
46 47 48 49
54
53
53
545453
51
5253 54
5453
52
52
38
54535251
54535251
49
48
5352
51
49
48
48
49
515253
43
5453
52
5352
51
5152
5354
54
545352
54
53
5251
545352
545352
54
53
545352
47
46
RD 12
RD 24
RD 4 9
RD 5 9
RD 67
R D 71
R D 79
R D 87
RD 95
RD 26
RD 16
RD 57
R D 65
VAN WERT PAULDING CO LINE
ELM SUGAR
JOH N
BROW
N
L IBE R
TY UN
ION
RICH
EY
COLW
ELL
DULL
ROB
INSO
N
C ON V
OY HE
L LE R
CONV
OY-H
ELLE
R
WARD
1
2
3
4
5
10
6
7
8
11
12
13
9
66
67
68
69
70
71
72
77
78
79
80
73
74
75
76
81
82
83
84
87
85
88
86
89
90R458
R277
R446R453
R319
R395
R444
R343
R445R449
R454
R352
R466
R303
R284
R274
R1178
R397
R304
R464
R305R308
R465
R330
R300
R423
R470
R312
R576
R493
R535
R433R431
R344
R435
R347
R544 R548
R532R536R534
R546R550R556R553
R314
R540
R428
R456
R1166
R455
R547R543
R1167
R545
R1169
R565R563R562
R549
R317
R447
R316R310
R331
R283
R436
R335
R429
R320
R327
R278
R297R299
R450R451
R1177
R269
R298
R404
R377R389
R732
R311 R313
R302
R271
R286
R420
R306
R387 R394
R452
R531
R382
R421
R733
R270
R282
R333
R276
55
50
55
5555
55
55
50
55
50
55
35
55
55
40
55
45
50
50
55
50
55
50
55
55
55
50
55
55
55
55
55
55
55
\\LAKEFRONT\PROJ\IBR_BLUECREEK_394265\MAPFILES\APPENDIX\NOISE\FIGURE2_NOISECONTOURSFORTURBINELAYOUT_D-SIZE_MB1.MXD EKLEIN 12/14/2009 13:48:37
FIGURE B-1Blue Creek Wind Farm AreaSound Contours for Wind Turbine Layout
Notes:1. Base data sources: ESRI Data and Maps (2008) {airports, counties outside Ohio, states}Ohio Department of Transportation (2004){counties, townships, roads, active railroads, cities}Ohio Geographically Referenced Information Program (2005){local roads}Ohio Department of Natural Resources (1995){Sound Sensitive Resources}Ohio Department of Natural Resources (1980){Sound Sensitive Resources}3. Sound Contours: Sound contours based on Gamesa 2.0 megawatt G-90 turbine with 100 m hub height.
0 0.1 0.2Miles
LEGENDReceptor LocationProject Area BoundarySupplemental Development AreaExisting 138 kV Transmission LineExisting 345 kV Transmission LineProposed Turbine and Turbine ID NumberProposed 115 kV Transmission LineProposed Access RoadProposed Collection SubstationO&M Building, Interconnection Substation,Temporary Batch Plant, Construction Laydown Area,and Staging AreaProposed Underground 34.5-kV Collection SystemProposed Aboveground 34.5-kV Collection SystemPredicted Sound Level (dBA)
Sound Sensitive ResourcesSchoolsHealth Care/Assisted LivingReligious Institutions
VICINITY MAP
Indiana
West Virginia
Pennsylvania
Kentucky
Michigan Ontario
Virginia
1 in = 0.2 mile
Panel Drawing 18-011Created: December 14, 2009
A1 of 4 - 1

H O A G L I NH O A G L I NU N I O NU N I O N
B L U E C R E E KB L U E C R E E K
L A T T YL A T T Y
HAVILAND
SCOTT
PAULDINGVAN WERT
114
114114
114
114
114
SCOT
T
BLAC
HLEY
ANDREW COTTERMANHOAG
LIN
VAN WERT PAULDING CO LINE
ELM SUGAR
SLAN
E
H OA G
L IN CE
N TE R
JOHN
YOH
RUMB
LE
48
47
52
54
5453 52
51
4954
52 51
48
47 46
44
43
42
41
39
38
37
36
54
54 53
52 51
49
5453
5453
5251
54
53
52
545352
51
54 53 52 51
54 53 52
51
545352
54
53
49
53
51
54
53
5453
53
545352
5453
5452
49
55
55
55
55
55
50
55
50
55
50
50
55
45
55
55
55
55
55
40
50
55
35
55
55
55GA
RFIEL
D
WASH
INGT
ON
HAVEN
SHERMANWATER
SCOT
TDR
URY
127
RD 24
RD 12
RD 18
RD 13
1
RD 1 1
7
R D 1 0
7
RD 28
BLAINE
RD 13
7
R D 12
3
FIRST
MCKI
NLEY
VINE
HARR
ISON
LOGA
N
SHER
IDAN
MAPLE
JACKSON
NORTHR572
R573
R693
R355
R575
R694
R739
R748
R353
R499
R323
R360
R753
R481
R695
R749
R480
R707 R287
R750
R696
R692
R325
R751
R574
R740
R697
R1174
R315
R295
R752
R691
R757
R742
R745
R754
R746
R755
R756
R747
R744
R365
R743
R741
R762
R758
R759R760
R378 R374
R334
R273
R307
R459
R359
R279
R438R440 R443
R373
R439
R290
R361
R761
R457
R383
R289
R426
R321
R424
R460
R358
R332
R430
R362
R294
R364R376
R385R384
R337
R341
R366
R338
R370
R407R413
R462
R463
R275
R339R340R342R345
R346R348
R380
R391R400
R408
R415R416
R349
R369R390
R402 R403R410
R417R414
R351R354R356
R357R367
R379 R381R388
R392R396
R477
R401 R405R406 R409R411
R437
R393R398
R399
R461
R272
R427
R434
R713
R288
R372
R467
R500
R469
R497
R336
R468
R292
R422
R472
R293
R473R474
R326
R419
R475R478
R329
R479
R512
R471
R490R482 R483R486 R487R485R488
R510R491
R418
R432
R552
R495 R496R498
R1176
R501R519
R291
R363
R505
R517R507
R516R506 R508R509
R513 R520R521R522 R523
R489
R514R515R518
R524
R533R529R525
R503
R527R528 R530R537 R539
R502
R541R542
R557R551 R554R555
R558R559
R560 R561R564R567 R568R569R570R571
151
150
154
152
155
156
157
160
158
159
161
162
163
164
165
166
167
123
124
143
144
145
130
131
132
146
147
128
129
148
135
149
153
\\LAKEFRONT\PROJ\IBR_BLUECREEK_394265\MAPFILES\APPENDIX\NOISE\FIGURE2_NOISECONTOURSFORTURBINELAYOUT_D-SIZE_MB1.MXD EKLEIN 12/14/2009 13:48:37
FIGURE B-1Blue Creek Wind Farm AreaSound Contours for Wind Turbine Layout
Notes:1. Base data sources: ESRI Data and Maps (2008) {airports, counties outside Ohio, states}Ohio Department of Transportation (2004){counties, townships, roads, active railroads, cities}Ohio Geographically Referenced Information Program (2005){local roads}Ohio Department of Natural Resources (1995){Sound Sensitive Resources}Ohio Department of Natural Resources (1980){Sound Sensitive Resources}3. Sound Contours: Sound contours based on Gamesa 2.0 megawatt G-90 turbine with 100 m hub height.
0 0.1 0.2Miles
LEGENDReceptor LocationProject Area BoundarySupplemental Development AreaExisting 138 kV Transmission LineExisting 345 kV Transmission LineProposed Turbine and Turbine ID NumberProposed 115 kV Transmission LineProposed Access RoadProposed Collection SubstationO&M Building, Interconnection Substation,Temporary Batch Plant, Construction Laydown Area,and Staging AreaProposed Underground 34.5-kV Collection SystemProposed Aboveground 34.5-kV Collection SystemPredicted Sound Level (dBA)
Sound Sensitive ResourcesSchoolsHealth Care/Assisted LivingReligious Institutions
VICINITY MAP
Indiana
West Virginia
Pennsylvania
Kentucky
Michigan Ontario
Virginia
1 in = 0.2 mile
Panel Drawing 18-011Created: December 14, 2009
A2 of 4 - 2

T U L L YT U L L Y
U N I O NU N I O N
CONVOY
49
49
49
49
45
55
55
55
55
55
55
55
55
55
55
55
55
55
50
55
50
55
55
5555
55
50
55
50
55
50
55
55
50
40
50
55
50
55
50
40
40
5055
55
50
45
35
36
37
38
41
42
43
49
5152
54
525354
49
5152
54
545251
49
39
52 54
53
5352
51
535251
545352
49
5152
5354
5351
39
47
46
54
54
5352
51
5351
54535251
4951
48
47
54535251
54 5352
5453
52
54
5352
5453
52
5352
54
48
53
53
54
5352
53 52 51
53
5452
54 5352
54
5352
51
54
54
48
49
54
36
37
38
39
41
42
43
44
46
4748
49
5152
53
54
54
53
5251
49
CHER
RY
INDUSTRIAL
ELM
SYCAMORE
HIGH
LINN
LIBER
TYVINE
RACE
FRANKLIN
OAK
OHIO
PETTIT
DEALEY
DULL
ROB IN
S ON
NACHBAR
KILGORE
TULLY
CONVOY
RICH
EY
COLW
ELL
FIFE
POLLOCK
WARD
FRANKLIN
BERG
NER
LI NC OLN
LI BE R
T Y UN
ION
FEASBY WISENER
BOWERS
JOHN
BROW
N
WALLER
CONV
OY HE
L LE R
MENTZER
DIXON CAVETTR178
R241
R251
R99
R1179
R103
R115
R123
R225R226
R196R731
R108
R191
R232
R246
R35
R88
R1181
R50
R52
R55
R231R233
R95
R77
R253
R174
R32
R120
R71
R119
R89
R244
R57
R242
R29R31
R53
R61
R91
R93
R248
R30
R59
R192
R122
R97
R125
R220
R247
R879
R15
R249
R13
R254
R28
R250
R1041
R1036
R56
R1037R1039
R128
R51
R1038
R84R1040
R85
R60
R1031
R86
R62
R1032
R1030R1033
R11
R1029
R195
R1034
R47
R868
R1028R1035
R1027
R130
R856
R218
R1026
R202
R1025
R39
R142
R34
R162
R734R26
R171
R235
R179
R866
R48
R883
R188R185
R870
R880
R882
R14
R867
R871R872
R869
R881
R873
R25
R1023
R1144
R864
R874R875
R865R12
R876R877
R863
R40
R1022
R17
R878
R884
R1143
R885
R1016
R735
R886R931
R1017
R20
R37R887R1042
R22
R1018
R1142
R27
R930
R1013R1019
R24R21
R890
R929
R1012
R1140R1141
R1021
R927
R1109
R932
R924R934
R1001 R1002R1010
R1108
R1110
R16
R897R923
R1111
R922
R937R943
R999
R1113
R10
R901R919
R945
R965
R998R1005
R1078R1106
R1116
R939R962
R918
R961R966
R997
R1007
R1077R1105
R1117
R904R905
R957R958
R968
R996
R1009
R1070
R1076
R1123
R948
R954
R995
R1067
R1073
R1119
R908
R953R970
R1066
R1129
R1136
R1182
R211
R45
R107
R989
R1093 R44
R245
R988
R212
R166
R1101
R987
R186
R983
R236
R110R112
R1062
R181
R1135
R172
R87
R217
R1024R1098
R1096
R1061R1064
R1043
R1063
R991
R1053
R160
R222
R1052
R985
R182
R984
R152
R1046
R113
R175
R973
R137
R914
R41
R1095
R176
R100
R912
R104
R126
R173
R252
R1128
R1085
R183
R1127
R190
R19R23
R1050
R36
R1083
R129
R177
R1048
R240
R992
R96
R1047
R98
R981
R33
R977
R184
R1134
R243
R738
R974
R972
R131
R951
R1089
R163
R109 R117
R200
R1086
R950
R916
R135
R102
R121
R106
R1056
R911
R111
R118
R1104
R127
R1055
R215
R72
30
45
46
20
29
44
22
60
63
33
58
25
19
17
39
5756
24
54
38
31
15
34
42
23
61
26
62
64
30
18
47
53
41
43
40
59
16
36
27
21
37
55
28
35
65
32
\\LAKEFRONT\PROJ\IBR_BLUECREEK_394265\MAPFILES\APPENDIX\NOISE\FIGURE2_NOISECONTOURSFORTURBINELAYOUT_D-SIZE_MB1.MXD EKLEIN 12/14/2009 13:48:37
FIGURE B-1Blue Creek Wind Farm AreaSound Contours for Wind Turbine Layout
Notes:1. Base data sources: ESRI Data and Maps (2008) {airports, counties outside Ohio, states}Ohio Department of Transportation (2004){counties, townships, roads, active railroads, cities}Ohio Geographically Referenced Information Program (2005){local roads}Ohio Department of Natural Resources (1995){Sound Sensitive Resources}Ohio Department of Natural Resources (1980){Sound Sensitive Resources}3. Sound Contours: Sound contours based on Gamesa 2.0 megawatt G-90 turbine with 100 m hub height.
0 0.1 0.2Miles
LEGENDReceptor LocationProject Area BoundarySupplemental Development AreaExisting 138 kV Transmission LineExisting 345 kV Transmission LineProposed Turbine and Turbine ID NumberProposed 115 kV Transmission LineProposed Access RoadProposed Collection SubstationO&M Building, Interconnection Substation,Temporary Batch Plant, Construction Laydown Area,and Staging AreaProposed Underground 34.5-kV Collection SystemProposed Aboveground 34.5-kV Collection SystemPredicted Sound Level (dBA)
Sound Sensitive ResourcesSchoolsHealth Care/Assisted LivingReligious Institutions
VICINITY MAP
Indiana
West Virginia
Pennsylvania
Kentucky
Michigan Ontario
Virginia
1 in = 0.2 mile
Panel Drawing 18-011Created: December 14, 2009
B1 of 4 - 3

H O A G L I NH O A G L I NU N I O NU N I O N
53 52
53
54
5354
525354
54 52
48
49
515254
36
37
38
39
41
4243
44
46
47
48
49
51
52
5354
46
47
48
49
515253
54
46
47
4849
5153
55
50
55
55
55
55
55
50
55
50
55
50
45
40
35
127
224
J OHN
Y OH
WETZEL
FIFE
GIFFIN
FLIN
G
H OA G
L IN CE
NTER
DIXON CAVETT
SLAN
E
RUMB
LE
HOAG
LIN
TAYLOR
FEASBY WISENER
MOHR
CONVOY
HESSIAN
STRI
PE
DEFIA
NCE
GALVIN
SMIT H
KITZE
N BA R
G ER
KELT
NER
HATT
ERY
R140R151
R159R148
R154R157 R155R169
R793
R791
R790
R789
R787R788
R785
R786
R781
R799
R773R1175
R775
R778
R774
R772
R777
R780
R779
R766
R784
R782
R771R770
R776
R769
R768
R783
R680
R839
R679
R681
R792
R801
R682
R805
R683
R767
R803
R684
R809 R808
R685
R810
R678
R811
R838
R765
R686
R837R836
R688R687
R689
R835
R690
R145
R833
R834
R677
R821
R815
R832
R712
R826
R814
R822
R827
R816
R711
R710R709
R141R139
R828
R133
R830R829
R823R824
R136
R18
R234
R840R841
R831
R676
R38
R227
R138
R43
R206
R675
R46
R229
R205
R209
R114
R1180
R223
R228
R54
R116
R58
R203
R727R66
R224
R81
R132
R76R73
R75R78
R1183
R64
R79R74
R65
R101
R825
R208
R194
R90
R201
R189
R207
R105
R165
R197
R673
R180
R674 R671
R143
R204
R144R134
R672
R156R161R149
R158R147
139
122
125
138
126
134
127
141
140
\\LAKEFRONT\PROJ\IBR_BLUECREEK_394265\MAPFILES\APPENDIX\NOISE\FIGURE2_NOISECONTOURSFORTURBINELAYOUT_D-SIZE_MB1.MXD EKLEIN 12/14/2009 13:48:37
FIGURE B-1Blue Creek Wind Farm AreaSound Contours for Wind Turbine Layout
Notes:1. Base data sources: ESRI Data and Maps (2008) {airports, counties outside Ohio, states}Ohio Department of Transportation (2004){counties, townships, roads, active railroads, cities}Ohio Geographically Referenced Information Program (2005){local roads}Ohio Department of Natural Resources (1995){Sound Sensitive Resources}Ohio Department of Natural Resources (1980){Sound Sensitive Resources}3. Sound Contours: Sound contours based on Gamesa 2.0 megawatt G-90 turbine with 100 m hub height.
0 0.1 0.2Miles
LEGENDReceptor LocationProject Area BoundarySupplemental Development AreaExisting 138 kV Transmission LineExisting 345 kV Transmission LineProposed Turbine and Turbine ID NumberProposed 115 kV Transmission LineProposed Access RoadProposed Collection SubstationO&M Building, Interconnection Substation,Temporary Batch Plant, Construction Laydown Area,and Staging AreaProposed Underground 34.5-kV Collection SystemProposed Aboveground 34.5-kV Collection SystemPredicted Sound Level (dBA)
Sound Sensitive ResourcesSchoolsHealth Care/Assisted LivingReligious Institutions
VICINITY MAP
Indiana
West Virginia
Pennsylvania
Kentucky
Michigan Ontario
Virginia
1 in = 0.2 mile
Panel Drawing 18-011Created: December 14, 2009
B2 of 4 - 4


