Download - New Hampshire Housing Finance Authority
New Hampshire Housing Finance Authority Affordable Single-Family Housing Study
Prepared for:
New Hampshire Housing Finance Authority 32 Constitution Drive Bedford, NH 03110 Prepared by:
AECm 13 Water Street Newmarket, NH 03857 In Collaboration with:
Big Spruce Construction 75 Rocky Hill Rd Somersworth, NH 03878

New Hampshire Housing Finance Authority Affordable Single-Family Housing Study August 2018
Page 1 of 54
Disclaimer
This study was initiated by the New Hampshire Housing Finance Authority to establish the feasibility of building affordable single-family homes in the state of New Hampshire.
The study is solely intended to promote discussion and to educate the industry and public. Discussion topics generated from this study may include but are not limited to: more favorable land use regulations, funding, affordability, necessities versus desires, etc. Several industry resources were used to complete this study including publicly accessible data and residential construction and realty professionals.
While best-practice standards were used to obtain relevant and complete data, the New Hampshire Housing Finance Authority and AECm, LLC make no express or implied guarantees as to the accuracy of data presented herein. All presented data, conclusions, and recommendations should be reviewed within the context of the stated objectives.
All costs and pricing presented herein should be reviewed within the context of the time period in which the study was completed. The residential housing market is very dynamic due to supply and demand, fluctuating labor and material costs, and other market influences and trends.

New Hampshire Housing Finance Authority Affordable Single-Family Housing Study August 2018
Page 2 of 54
EXECUTIVE SUMMARY This study evaluates the feasibility of constructing affordable single-family homes in urban, suburban, and rural communities in New Hampshire. It concludes that constructing affordable single-family homes is viable using various construction methods.
With a nationwide trend of diminishing affordable housing, a large population of prospective homeowners are forced to continue renting or relocating to a lower cost housing market. Multi-family housing has been the popular response to this modern issue, however, not all households and locations are well suited for multi-family developments. Increased volume of affordable single-family homes would serve a significant portion of the existing and potential homebuyer market in New Hampshire.
For the purposes of this study the price threshold for an affordable single-family home is $300,000 with a total living area ranging from 800 to 1,500 square feet. This study focuses on the construction and land cost components of newly constructed homes individually. Three modern construction methods were considered including conventional stick-built, panelized systems, and modular systems. Total costs for the three construction methods are similar, therefore, findings with respect to financial feasibility are applicable irrespective of the construction method used.
Understanding that the total cost of a new single-family home is largely influenced by land acquisition costs and zoning regulations, case study analyses of representative housing regions in New Hampshire were completed. Three municipalities were identified as being representative of New Hampshire urban, suburban, and rural regions. The selection also considered demographics including per capita income and median home value. Total costs to construct a 1,000 square foot home using modular systems are $284,715, $264,410, and $237,125 for urban, suburban and rural communities, respectively.
In a competitive housing market, residential developers are more inclined to build larger homes at sale prices that are unaffordable for many buyers. Generally, larger homes priced above median prices yield higher profit margins. Zoning regulations, such as minimum lot sizes, present challenges when constructing an affordable home. Developers have little incentive to construct smaller affordable homes on large land parcels. The variances and approvals required to develop a smaller lot discourage developers due to increased cost, time, and effort.
Additional market incentives, offsetting the total construction cost, will broaden the market for new single-family homes in New Hampshire. Land subsidies including discounted sale of public lands and financing incentives provide the most effective incentives for developers and owners.
The relative cost to construct an affordable single-family home in New Hampshire does not vary substantially by region. There are, however, several factors that vary regionally and influence the total cost of construction: most notably, site infrastructure and skilled labor cost and availability.
Single-Family Home Cost by NH Region Cost Item Urban Suburban Rural Single-Family Lot $80,000 $62,000 $30,000 Modular Construction (1,000 SF)
$204,715 $202,410 $207,125
Total Cost $284,715 $264,410 $237,125 Construction costs include profit, permit, impact fees, and utilities

New Hampshire Housing Finance Authority Affordable Single-Family Housing Study August 2018
Page 3 of 54
TABLE OF CONTENTS 1.0 BACKGROUND & OBJECTIVE............................................................................................. 6
2.0 APPROACH....................................................................................................................... 6 2.1 Industry Resources ..................................................................................................... 7
2.2 Building Codes........................................................................................................... 7
2.3 Homebuyer Expectations............................................................................................ 8
2.4 Zoning Standards....................................................................................................... 9
2.5 Local Building Regulations ......................................................................................... 9
2.6 Construction Methods.............................................................................................. 10
2.7 Constructability of Design ........................................................................................ 10
2.8 Labor Costs.............................................................................................................. 11
2.9 Material Costs and Supply ........................................................................................ 11
2.10 Public Utility Services ............................................................................................... 12
2.11 Energy Conservation ................................................................................................ 12
2.12 Land Acquisition and Development .......................................................................... 13
2.13 Regional Variation.................................................................................................... 13
2.14 Accessibility Standards ............................................................................................. 15
3.0 FINDINGS ....................................................................................................................... 15 3.1 Construction Methods.............................................................................................. 15
3.2 Cost of Construction ................................................................................................ 16
3.3 Development Costs .................................................................................................. 17
3.3.1 Land ................................................................................................................. 18
3.3.2 Planning and Permitting.................................................................................... 20
3.3.3 Design and Permitting Fees ............................................................................... 20
3.3.4 Site Infrastructure ............................................................................................. 20
3.4 Ownership Costs ...................................................................................................... 22
3.5 Economic Incentives................................................................................................. 22
4.0 CONCLUSION ................................................................................................................. 24

New Hampshire Housing Finance Authority Affordable Single-Family Housing Study August 2018
Page 4 of 54
Tables and Figures
Table 1: Annual per capita income and household income for an affordable mortgage payment. ............................................................................................................................................. 14
Table 2: Price demographics of residential home sales in each region. ..................................... 15
Table 3: Building permit and utilities costs by region. .............................................................. 17
Table 4: Discounted regional land values ................................................................................ 18
Table 5: Example of Incentive Bonuses for Site Infrastructure (NH Suburban Community Case Study) ................................................................................................................................... 22
Table 6: Incentive programs in New Hampshire. (DSIRE NC Clean Energy Technology Center 8/21/2018) ............................................................................................................................ 23
Table 7: Advantages and drawbacks of each method of construction in question. .................... 25
Table 8: Quantitative cost evaluation between stick build and panelized construction methods.26
Table 9: Home median value for Urban, Suburban, and Rural developments in NH. ................. 27
Table 10: Minimum lot size requirements & setbacks for Urban, Suburban, and Rural developments in NH. ............................................................................................................. 27
Table 11: Median lot size and price for Urban, Suburban, and Rural developments in NH over the past 5 years. .......................................................................................................................... 27
Table 12: Price and size of vacant land for Urban, Suburban, and Rural developments in NH in 2013 (Left) and 2014 (Right) ................................................................................................... 28
Table 13: Price and size of vacant land for Urban, Suburban, and Rural developments in NH in 2015 (left), 2016 (middle), and 2017 (right).............................................................................. 29
Table 14: Cost matrix of different size modular models. .......................................................... 30
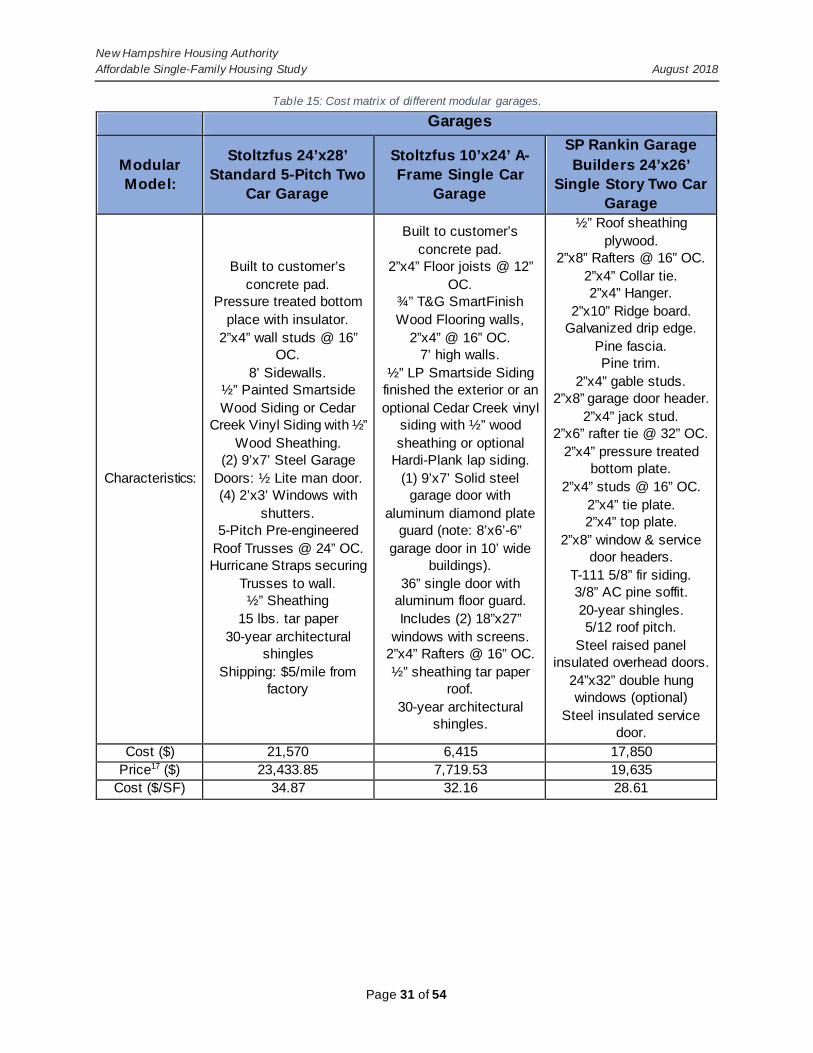
Table 15: Cost matrix of different modular garages. ................................................................ 31
Table 16: Garage building permits and additional costs. .......................................................... 32
Table 17: Pricing demographics for single-family residential sales in Urban, Suburban, Rural developments in NH over the past 5 years. ............................................................................. 32
Table 18: Modular design selection and pricing ...................................................................... 33
Figure 1: Available vacant lots for each region by size and respective price. ............................. 19
Figure 2: Number of land sales for each region in NH over the past 5 years. ............................ 20
Figure 3: Size and price of vacant land for Urban, Suburban, and Rural developments in NH over the past 5 years...................................................................................................................... 35
Figure 4: Median price of single-family residential sales in Urban, Suburban, and Rural developments over the past 5 years........................................................................................ 36

New Hampshire Housing Finance Authority Affordable Single-Family Housing Study August 2018
Page 5 of 54
Figure 5: Median cost of vacant land of an Urban, Suburban, and Rural development in NH over the past 5 years...................................................................................................................... 36
Figure 6: Median acreage of vacant land for an Urban, Suburban, and Rural development in NH over the past 5 years. ............................................................................................................. 37
Figure 7: Median single-family residential home sales over the past 5 years for each region typ37
Appendix
Tables…………………………………………………………………………………………………………………………………….…….25 Figures…………………………………………………………………………………………………………………………………………35 Attachment 1: New England Homes Classic Series Specifications………………………………………………...38 Attachment 2: Pro-Fab US Standard Specifications………………………………………………………………………39 Attachment 3: Additional Specifications………………………………………………………………………………...……43
Attachment 4: NEH Photo Synopsis……………………………………………………………………………………...……..46
Attachment 5: Combination Gas Fired Boiler………………………………………………………………………….…...52 Attachment 6: Floor Plans for Pro-Fab Modular Home Designs…………………………………………….…...53
References…………………………………………………………………………………………………………………………………...54

New Hampshire Housing Finance Authority Affordable Single-Family Housing Study August 2018
Page 6 of 54
1.0 BACKGROUND & OBJECTIVE The diminished availability of affordable housing is a nationwide crisis. The effects of the affordable housing shortage are widespread, threatening our economic vitality and weakening our social fabric. The affordable housing market includes first-time homebuyers, young families, and older populations. Without an adequate supply of affordable single-family housing, these buyers are forced to continue renting or relocating to lower cost housing markets. In suburban and urban locations, multi-family housing has historically been the solution to the housing issue, however, not all households are suited to multi-family living. These developments are less common in rural communities that represent a substantial geographical portion of New Hampshire.
Throughout the country, states have implemented creative housing approaches to preserve and enhance communities. New Hampshire is affected by the nationwide affordable housing shortage with rental vacancies and low market inventories throughout the state.
The New Hampshire Housing Finance Authority has initiated this study to evaluate the feasibility of constructing affordable single-family housing in New Hampshire. This involves an objective and holistic assessment of representative markets and factors that comprise the total cost of ownership for homebuyers.
This study involves evaluations of all modern construction methods including conventional site-constructed stick-built, prefabricated stick-built (panelized), and modular construction.
2.0 APPROACH For this study, the cost threshold for an affordable single-family home in New Hampshire is established at $300,000 (including land) with a total net living area of 800 to 1,500 square feet. Commercial lenders establish loan amounts according to income and they typically assume that 40% of the buyer’s income can be applied toward principal interest, taxes, insurance and any association fees.
Modern construction methods including conventional site-constructed stick-built, prefabricated stick-built (panelized), and modular construction were considered. The methods and environment that a building is constructed
Rendering and floor plan of Effingham Model (courtesy of New England Homes)

New Hampshire Housing Finance Authority Affordable Single-Family Housing Study August 2018
Page 7 of 54
within have a significant effect on long-term durability. The home designs are optimized for efficient use of material and space. Integrity of the building envelope exceeds the typical standard of quality throughout the three methods of construction. Finishes and materials selections consider function and durability.
Construction cost estimates include all building costs including site development. To establish land costs, three municipalities in urban, suburban, and rural locales were selected for case studies. Average lot prices based on historical sales (last five years) were determined and all variables influencing total cost including impact fees and zoning ordinances were evaluated.
In addition to home construction costs, economic assessments should also consider the costs to operate and maintain the home – or the “total cost of ownership”. Initial capital investment for enhanced construction methods and technologies can provide a very quick payback and future cost savings to the homeowner. These enhancements also may allow the homeowner to take advantage of monetary incentives including energy conservation programs.
There are several variables that affect the cost to construct a lower priced or affordable single-family home in New Hampshire. The influence of each factor, as they relate to single-family affordable housing, vary considerably based on location / region and the scale of development. While it is not feasible to quantitatively measure all factors influencing the total cost of construction of single-family homes in New Hampshire, the following are considered in this study.
• Building Codes • Homebuyer Expectations • Zoning Standards • Local Building Regulations • Construction Methods • Constructability of Design • Labor Costs • Material Costs • Public Utility Services • Energy Conservation • Land Acquisition and Development • Regional Variation
2.1 Industry Resources Resources used to establish the basis of variables for this study include residential general contractors, developers, and material suppliers. Information includes construction means and methods, labor wages, materials pricing, and industry trends. Other resources such as historical pricing data were considered as well. Zoning, permitting, and building regulations were evaluated in representative urban, suburban, and rural cities and towns in New Hampshire.
2.2 Building Codes With an increasing awareness on energy conservation, environmental stewardship, indoor air quality, life safety, and building durability building code requirements have become substantially more stringent. While modern codes improve home performance and durability, they require

New Hampshire Housing Finance Authority Affordable Single-Family Housing Study August 2018
Page 8 of 54
higher initial cost. Modern building materials and construction technologies inherently increase costs.
Building rating and certification programs such as the U.S. Green Building Council® (USGBC), Leadership in Energy and Environmental Design (LEED) for Homes® program, and the U.S. Environmental Protection Agency (USEPA) ENERGY STAR® for Homes program have elevated construction standards and homeowner expectations. Modern construction methods and building technologies require a higher level of workmanship and training.
In 2014, the state of New Hampshire adopted the 2009 International Residential Code (IRC). With all neighboring states (Maine, Massachusetts, and Vermont) having adopted the 2015 IRC, New Hampshire may elect to follow suit in the near-term. Some New Hampshire cities and towns have also adopted building codes or standards that exceed minimum code and life safety requirements.
When a new code is adopted in New Hampshire, construction modifications including enhanced thermal values, increased air sealing, mechanical ventilation, and a review of building means and methods must be completed to ensure compliance. Necessary upgrades to satisfy more stringent building codes are currently available through most builders and modular manufacturers, including the models considered herein.
Baseline construction costs presented in this report presume minimum compliance with the 2009 IRC. For compliance with 2015 IRC standards, a premium cost multiplier of 5% to 10% would be applied.
2.3 Homebuyer Expectations Acknowledging that homebuyer expectations are regionally influenced, today’s homebuyers have higher standards when purchasing a new home. With increased accessibility to home design and purchasing websites, most new homebuyers invest significant time researching when planning the construction of a new home.
Various home finishes once considered out-of-reach for typical homeowners are now more attainable. For example, granite countertops and hardwood flooring are replacing laminate and
Rendering and floor plan of Fairview Model (courtesy of New England Homes)

New Hampshire Housing Finance Authority Affordable Single-Family Housing Study August 2018
Page 9 of 54
vinyl as standard finishes. New materials manufacturing technologies have also broadened the market of finish materials.
Smart home system technologies provide the ability to control building systems from web-based smartphone applications. In addition to energy efficiency and quality of life improvements, this enables users to monitor and maintain a more comfortable home environment. This is an additional cost not considered in this study.
Renewable energy systems such as solar photovoltaic and geothermal heating and cooling systems are becoming increasingly popular. Previously an option limited to higher-end homes, these systems are making their way into all home market segments.
2.4 Zoning Standards In most New Hampshire towns and cities, the zoning ordinances restrict best-practice development by modern definition. Large minimum lot sizes, high-density restrictions, and dimensional requirements prohibit compact development where high land and infrastructure costs can be substantially reduced and shared among multiple homeowners.
Obtaining variances, special exceptions and other special permits from local Planning Boards and Zoning Boards of Adjustment (ZBA) is burdensome for developers resulting in increased professional fees and project durations. Developers, who are obligated to manage risk in a volatile and cyclical business environment, are not guaranteed that they will obtain the approvals necessary to maintain an economically viable project.
Several New Hampshire towns and cities have adopted form-based zoning ordinances to promote best-practice development that is consistent with the existing setting (typically defined by architectural style and massing). This offers the opportunity for the developer to creatively plan housing that is consistent with the local master plan without special approvals.
Some zoning ordinances specifically address renewable energy systems including solar photovoltaic and small wind energy systems. The objective is to promote the responsible application of green energy systems. Owners can take advantage of incentives including federal tax credits and utility rebate programs.
2.5 Local Building Regulations Local jurisdiction, code enforcement, life safety, and natural resource protection officials have the authority to mandate requirements that exceed minimum code and regulatory standards. Examples of increased requirements enacted by some New Hampshire towns and cities include fire-suppression (sprinkler systems), enhanced energy conservation (e.g., IRC 2015), and natural resource protections such as increased wetland setbacks.
Enhanced building standards inherently increase the cost of construction. For the purposes of this report, minimum New Hampshire code and regulatory standards are presumed.

New Hampshire Housing Finance Authority Affordable Single-Family Housing Study August 2018
Page 10 of 54
2.6 Construction Methods Most single-family homes in New Hampshire are erected using conventional on-site, stick-built construction methods. Modern off-site fabrication methods including panel systems and modular systems are increasingly popular, especially in urban and suburban areas where market demand is high and skilled labor resources are declining.
On-site stick-built home construction offers several benefits over pre-fabricated systems including adaptation to unforeseen site conditions and design changes. Local developers and contractors typically have working relationships with local planning and zoning boards and code enforcement officials thereby facilitating permitting and inspection processes. On-site construction also contributes to the community economy by employing local labor. However, the availability of skilled labor in many New Hampshire communities is limited.
Generally, off site construction by a reputable manufacturer in close-proximity to the site (less than 150 miles) yields the best value. Because most of the labor is completed in a controlled production facility, modular construction mitigates some of the risks associated with on-site construction and improves quality and schedule. A residential modular project like those considered in this study can be completed in approximately three months from the time of deposit (on a typical lot). Conventional on-site stick-built construction of a similar home typically takes five to eight months.
Construction efficiencies are realized by standardized designs that can be easily replicated. The cost to produce fifty single-family homes using a single basic design configuration is substantially less than custom-home construction. Additional cost-savings are realized in off-site fabrication where a controlled production-line manufacturing process can efficiently replicate house systems. Many off-site fabricators also offer quantity discounts for multiple units.
2.7 Constructability of Design Constructability is defined as the level of complexity and effort associated with a specific design. Detailed house designs typically require increased skill, labor, and materials. For example, a house with multiple roof pitches and projections is less constructible than a house with a
Rendering and floor plan of Meredith model (courtesy of New England Homes)

New Hampshire Housing Finance Authority Affordable Single-Family Housing Study August 2018
Page 11 of 54
symmetrical gable style roof. Constructability is also influenced by site conditions such as proximity to existing infrastructure (e.g. roadways, utility services), terrain, and subsurface conditions (e.g., bedrock).
For the purposes of this evaluation, the level of constructability is high (favorable). This presumes that affordable homes are simple designs constructed on typical building sites with no constraints.
Constructability is affected by the method of construction. The ability to adapt a design in the construction phase allows the builder to mitigate unforeseen site conditions and enable the owner to make design changes as the home is being constructed. For example, moving interior walls or adding windows.
Field modification of panelized systems is limited and doing such may reduce the quality of the system. For example, if a new window opening is added to an exterior wall panel the thermal and air-sealing integrity of the envelope may be compromised.
Modular systems cannot be practically modified during construction. Because the entire home is framed in sections at the manufacturing facility, changes to layout or design cannot be made post-fabrication.
2.8 Labor Costs Wage rates for residential construction skilled labor trades vary throughout the state of New Hampshire. The highest rates occur in the Seacoast, Nashua, Concord, and Manchester metropolitan regions with the lowest rates occurring in the North Country. The current low unemployment rate throughout the state (2.6%1) results in increased wages as more construction companies compete for skilled labor resources.
There are several variables that affect construction costs for each subcontracted skilled trade including labor availability, project site proximity and travel, and competing wages for non-construction employment (manufacturing, technology, etc.). Trending data indicates that the number of young people entering the skilled building trades is declining.
The wage rates used in developing construction cost estimates in this report are based on current industry rates. While wage rates due vary by region, fluctuation does not greatly influence overall development cost and this report is based on statewide averages. For this study, hourly rates are established at $55 for a carpenter, $65 for electricians, and $85 for plumbers.
2.9 Material Costs and Supply Escalating construction materials costs due to economic variables is difficult to predict. Supply and demand imbalances and trade sanctions (including embargoes, tariffs, and quotas)
1 NH Employment Security, Economic & Labor Market Information Bureau, July 26th 2018 (https://www.nhes.nh.gov/elmi/statistics/documents/laus-current.pdf)

New Hampshire Housing Finance Authority Affordable Single-Family Housing Study August 2018
Page 12 of 54
inherently increase the cost of construction materials. All costs presented in this study are based upon construction material pricing indexes at the time of report development.
2.10 Public Utility Services The availability of public utilities influences the cost of construction. Although costs for new electrical services can vary, they are considered negligible within the context of this study. Natural gas services are very limited in New Hampshire and are generally confined to Seacoast communities and the southern-central core of the state (with the exception of some towns/cities with large consumers such as Keene, Berlin, and Lebanon/Hanover). While natural gas is the lowest cost distributed fossil fuel for heating, the availability does not influence the costs presented herein.
Public water and sewer services can significantly influence the cost of construction. The pricing provided herein is distinguished by region based on the common availability of public services (typically urban regions). Costs for water supply well installation and septic system construction are included for regions where public services are not commonly available including suburban and rural regions.
2.11 Energy Conservation While energy conservation and the use of renewable energy resources are vital to sustainable building development, the associated costs are typically not practical for buyers in the affordable housing segment. Therefore, energy conservation measures considered in this study are limited to current residential building code requirements (IRC 2009). Although some New Hampshire communities have adopted IRC 2015 energy code standards, they represent a small percentage of New Hampshire cities and towns.
Energy conservation incentives such as ENERGY STAR® for Homes Certification programs were not considered as most builders are not constructing homes to that standard and the incentives generally do not offset the increased costs of construction. However, payback of these incremental costs is realized in the long-term resulting from reduced energy consumption and maintenance costs.
Homes constructed in a controlled and efficient manufacturing process typically have improved envelope systems resulting in reduced energy consumption compared to a home constructed by conventional means.
Rendering and floor plan of Washington model (courtesy of New England Homes)

New Hampshire Housing Finance Authority Affordable Single-Family Housing Study August 2018
Page 13 of 54
2.12 Land Acquisition and Development Costs for land acquisition and development represent a substantial portion of the total cost of construction for a new home. For affordable homes the land cost must be at or below the median land price regionally. Higher priced lots would likely increase costs above the affordable home threshold.
Programs to donate publicly owned lands can be a substantial incentive for single-family housing initiatives. Other strategies include private ownership (e.g., non-profit) with an owner ground lease agreement to defer land purchase costs either initially or permanently. This approach is most practical for a larger parcel that could be subdivided with numerous lease agreements.
Several variables impact the market value of buildable single-family home parcels. Site work costs can significantly vary based on these factors. Actual development costs for complex building sites often exceed the planned budget. Unidentified permits, land-use restrictions, and difficult site conditions can increase development costs well beyond the affordable housing threshold. Land acquisition and development costs are impacted by the following:
• Location • Size • Subdivision potential • Public services (water and sewer) • Landscape features and terrain (waterfront, wooded, mountainous, etc.) • Accessibility from roadways • Zoning regulations and setback requirements • Proximity to wetlands or other protected natural resources • Easements and rights-of-way • Construction season and weather impacts
2.13 Regional Variation2 Case-studies of urban, suburban, and rural regions in New Hampshire were completed to establish relative differences affecting the feasibility of affordable single-family home construction. This considered population density, median age, per capita income, geography, and housing market activity.
Rural areas are defined by low population density often with a high proportion of land designated as open space. Rural area economics in New Hampshire are typically based on natural resources including agriculture and tourism. Suburban areas are defined as communities having a higher density of housing and some limited commercial businesses. Large housing developments are often densely located in suburban areas. Urban areas are dense, high population areas with a diverse mix of residential and commercial uses. Urban
2 Victoria. "Difference Between Rural and Suburban and Urban." DifferenceBetween.net. April 8, 2011 < http://www.differencebetween.net/language/difference-between-rural-and-suburban-and-urban/ >.

New Hampshire Housing Finance Authority Affordable Single-Family Housing Study August 2018
Page 14 of 54
areas often have political autonomy and tend to have a “center” or hub with public resources including water and sewer.
For each town, annual per capita as well as household income were determined so that an affordable mortgage payment could be established. The presumed threshold for affordable monthly mortgage payment is 40% of the individual or family’s income including insurance, taxes, mortgage principal and interest, and utilities. While annual income per capita are relatively consistent, the annual household incomes do indicate some variance by community. Utilizing 40% of household monthly income for home ownership, a new home construction cost totaling $300,000 is feasible depending upon land acquisition costs. These figures are represented in the table below.
Table 1: Annual per capita income and household income for an affordable mortgage payment. (NH Employment Security, Data from ACS 2012-2016)
Region Annual
Per Capita Income
Monthly Per Capita
Income
40% of Monthly Per
Capita Income
Annual Household
Income
Monthly Household
Income
40% of Monthly
Household Income
Urban $33,637 $2,803 $1,121 $63,096 $5,258 $2,103 Suburban $35,278 $2,940 $1,176 $77,845 $6,487 $2,595
Rural $35,206 $2,934 $1,174 $58,523 $4,876 $1,950
The decision to purchase a new home or an older home largely depends on the homebuyer’s budget. Median home values for the case study markets (urban, suburban, and rural) are $309,750, $236,000, and $212,234, respectively (2017 median sales). For the purposes of this study, the affordable home cost threshold is $300,000. Higher operation and maintenance costs expected of an older home can result a higher total cost of ownership. Therefore, a new home may cost less over the ownership term and it will have a higher market value. Minimum, maximum, and median prices of residential sales for the case study markets are presented in Table 2.
Mortgage Scenario: A 20% down payment on a $300,000 property yields a $240,000 loan. At an interest rate of 4.5%, monthly payments on a 30-year loan would be $1,216. Adding $7,761 in annual property taxes (assuming a tax rate of $25.87/$1,000) and an $800 home insurance premium, the total monthly payments including escrow would be $1,929. While there are many factors to consider on an individual basis, this is an affordable monthly payment as defined by this report and median monthly household incomes tabulated herein.

New Hampshire Housing Finance Authority Affordable Single-Family Housing Study August 2018
Page 15 of 54
Table 2: Price demographics of residential home sales in each region.
Region Year No. of Sales DOM Min Price Max Price Median
Price
Rur
al
2013 67 178 $50,500 $710,000 $175,000 2014 67 96 $47,500 $768,600 $180,000 2015 69 131 $45,000 $949,000 $207,900 2016 71 104 $35,000 $955,000 $175,000 2017 74 78 $30,500 $969,000 $212,234
Urb
an
2013 320 84 $49,500 $962,365 $263,356 2014 332 75 $47,000 $1,325,000 $258,450 2015 347 73 $90,000 $1,611,975 $280,000 2016 377 57 $83,500 $1,275,000 $260,000 2017 346 54 $37,000 $2,835,000 $309,750
Sub
urba
n
2013 75 73 $42,000 $440,000 $185,370 2014 75 63 $44,000 $533,000 $190,000 2015 66 48 $83,500 $435,000 $214,750 2016 88 60 $30,000 $418,000 $222,000 2017 93 39 $100,000 $424,900 $236,000
2.14 Accessibility Standards It is presumed that any new home design can be easily adapted to accommodate disabled persons. Such modifications should comply with applicable accessibility standards as defined by the State of New Hampshire Architectural Barrier-Free Design Committee (ABFDC). Such modifications inherently increase construction costs.
3.0 FINDINGS With the objective of determining the cost affordability of single-family home construction, all variables influencing total costs are evaluated. This includes construction and all associated development costs including permitting and approvals, land acquisition, site infrastructure, and incentives.
3.1 Construction Methods A pricing comparison to determine the most affordable method of construction is presented in Table 8. Table 8 presents vendor’s standard floor plans with similar square footage and specifications offered as kits for stick-building, panelized systems, and modular systems. Qualitative factors were also considered during method selection. Despite costing only two to three dollars more per square foot, the following limitations reduce the feasibility of on-site stick-built construction when compared to off-site fabrication methods:
• Availability and competency of local skilled labor. • Material availability, lead time, and cost increases.

New Hampshire Housing Finance Authority Affordable Single-Family Housing Study August 2018
Page 16 of 54
• Increased duration of construction and risk exposure. • Noise and dust pollution to abutting neighbors. • Reduced material-use efficiency. • Material prone to theft. • Weather impacts (schedule, cost, and quality). • Consistency of construction methods and workmanship.
Considering pricing consistency, schedule, and quality, modular building is advantageous to panelized systems. The greatest disadvantage of modular systems is the fixed design offering little opportunity to modify the layout in the field. Panelized systems offer more flexibility since they can be altered and adapted to mitigate unforeseen site conditions and to accommodate design changes during construction.
Some modular companies offer panelized versions of their models, and if local labor rates for on-site construction are lower than those presumed in this report, then construction costs may be reduced further. It is important to consider all factors when considering this option including the planned construction season, anticipated weather delays, quality variation, and duration of the construction loan. A longer construction schedule escalates construction loan fees and interest charges.
3.2 Cost of Construction Two modular manufacturers serving New Hampshire were considered. New England Homes (NEH) and Pro-Fab offer standard ranch home designs ranging from 850 square feet (2 bedrooms and 1 bathroom) to 1,456 square feet (3 bedrooms and 2 full bathrooms) (Table 14). All homes offer single-story living constructed on full height foundation walls providing the option to finish the basement in the future. Below slab insulation was assumed in foundation pricing. Insulation of the main floor is also included to complete the building envelope for current use. An interior stud wall would be constructed, insulated, and finished with wallboard.
The average unit cost for a NEH house with standard specifications is $179 per square foot which is $23 per square foot less than a Pro-Fab home (Table 14).
Table 14 and Table 15 present the cost to construct five NEH models and two Pro-Fab models with an optional detached garage. The NEH Meredith (850 square feet) is the smallest, least expensive house to construct at a total cost of $173,439 excluding all associated permits and utilities. As the largest evaluated model (1,456 square feet), the NEH Effingham yields the lowest cost per square foot at $158 for a total cost of $230,182. As presented in Table 3, permit and utility costs vary by municipality. Table 18 in the Appendix provides a more detailed accounting of construction costs.
Pricing was derived from historical data and consultation with industry professionals. Confidence in pricing for building construction is relatively high. Land development and site infrastructure costs are the greatest potential cost increase due to highly variable site-specific conditions.

New Hampshire Housing Finance Authority Affordable Single-Family Housing Study August 2018
Page 17 of 54
Table 3: Building permit and utilities costs by region.
Cost Item
Small Modular (800-1,100 SF) Large Modular (1,300-1,500 SF)
NEH Washington/ Cherrydale
NEH Meredith
NEH Meredith (revised
floor plan)
Pro-Fab Waltham
NEH Fairview
NEH Effingham
Pro-Fab Acadia
Urban Building Permit
$1,912 $1,759 $1,906 $2,224 $2,212 $2,327 $2,620
Suburban Building Permit
$325 $280 $340 $338 $428 $462 $429
Rural Building Permit 3 $390 $338 $408 $405 $510 $550 $511
Urban public sewer
connection $2,897 $2,897 $2,897 $2,897 $2,897 $2,897 $2,897
Urban public water
connection $2,274 $2,274 $2,274 $2,274 $2,274 $2,274 $2,274
Suburban public sewer connection
$4,534 $4,534 $4,534 $4,534 $4,534 $4,534 $4,534
Suburban public water connection
$1,500 $1,500 $1,500 $1,500 $1,500 $1,500 $1,500
Urban impact fee $8,895 $8,895 $8,895 $8,895 $8,895 $8,895 $8,895
Suburban impact fee $1,331 $1,331 $1,331 $1,331 $1,331 $1,331 $1,331
Rural impact fee -- -- -- -- -- -- --
Septic System $13,000 $12,000 $12,000 $13,000 $13,000 $13,000 $13,000
Water Well $5,000 $5,000 $5,000 $5,000 $5,000 $5,000 $5,000
3.3 Development Costs The total cost of residential development is determined by several variables. Cost magnitude varies widely based on the variables. For example, site development costs can dramatically increase construction costs. This report only considers items that have a substantial influence on the total cost of development.
3 Includes driveway permit

New Hampshire Housing Finance Authority Affordable Single-Family Housing Study August 2018
Page 18 of 54
3.3.1 Land Pricing and size of buildable lots in the three case study communities in New Hampshire were obtained from the Multiple Listing Service (MLS) data for the past five years (2013-2017). There was a notable spike in available land for the rural region in 2017 relative to previous years. The suburban region represents the fewest number of available land plots while the number of lots in the urban and rural region are consistent (with the exception of 2017).
Prices in the suburban region range from a low of $12,500 to a high of $147,000 with a median price of $72,500. Urban region prices range from a low of $7,900 to a high of $950,000 with a median price of $100,000. Rural region prices range from a low of $4,000 to a high of $339,000.
The pricing evaluation reveals that lot size and lot price are not directly proportional to each other. As expected, landscape and location have the greatest influence on the price. This is especially true in the urban community where the highest price lot is $950,000 (1.41 acres) while another lot comprised of 53 acres of land was valued at $285,000. This is also evident in the rural region with a 145-acre plot of land costing $135,000 compared to a 0.62-acre plot of land costing $339,000.
Large land areas were excluded from the analysis since they may be subdivided into multiple lots thereby skewing the average cost. Additionally, development of larger lots may be restricted and limited due to site-specific constraints including wetlands, deeded rights-of-way, and conservation easements.
Table 4: Discounted regional land values Region Avg. Lot Size Median Value Discount Rate Discounted Value Urban 1.6 $100,000 20% $80,000
Suburban 3.3 $72,500 15% $61,625 Rural 1.5 $33,333 10% $30,000
The cost threshold for “affordable” lots should also be considered. That is, developers and homebuyers of affordable homes will most likely purchase a lot that is below the median market value in the region of interest. Presumably the discounted rate is exponentially relative to the market value within the three regions.
For the purposes of this report, discounts of 20%, 15% and 10% are applied to the respective urban, suburban, and rural regions. Table 12 and Table 13 in the Appendix presents all unadjusted median lot prices and sizes.

New Hampshire Housing Finance Authority Affordable Single-Family Housing Study August 2018
Page 19 of 54
Figure 1: Available vacant lots for each region by size and respective price.
The scatter graph presented as Figure 1 depicts the density of house lots based on lot price and size for each of the case study regions. A more detailed depiction of this data is presented in Figure 3 of the Appendix. Large lots exceeding 10-acres are excluded from the analysis presuming that they may be subdivided into smaller buildable lots.
The urban region is represented by numerous data points, or lot sales, and as expected the mean lot size is relatively small. Suburban lot sales for the case study community are fewer and lot sizes are more evenly distributed while pricing is relatively consistent. Lot sizes for the rural community tend to be smaller with the lowest prices of the three regions. Vacation (secondary) homes are popular in the rural case study community which accounts for the higher density of smaller, lower-priced lots.
$0
$100,000
$200,000
$300,000
$400,000
$500,000
$600,000
$700,000
$800,000
$900,000
$1,000,000
0 10
LOT
PRIC
E
LOT SIZE (ACRES)
SIZ E AND P RIC E O F VAC ANT LAND O VER TH E PAST 5 YEARS
Suburban Urban Rural

New Hampshire Housing Finance Authority Affordable Single-Family Housing Study August 2018
Page 20 of 54
3.3.2 Planning and Permitting Buildable lots are defined by local zoning ordinances. Table 10 presents the zoning ordinances for each of the three case study communities. Minimum lot size for the suburban community in the Medium Density – Residential (R1) is 20,000 square feet. This presumes a permitted use with municipal water and sewer services. For permitted use with municipal water only, the minimum lot size is increased to 60,000 square feet. Minimum lot size with town sewer only is 40,000 square feet.
The minimum lot size in the urban community with no municipal water sewer or sewer services is 30,000 square feet. When only municipal water is provided, the minimum lot requirement is 20,000 square feet.
Minimum lot requirement for all districts in the rural case study community is two acres. Many existing land parcels are below the two-acre minimum indicating that they are non-conforming lots or have received a variance. Non-conforming lots defined prior to the establishment of zoning ordinances are grandfathered. Subdivision regulations often allow for a reduction in lot size when portions of the subdivided land are designated as conservation or community greenspace. Today’s progressive planning practices encourage smaller lots with denser development allowing for more compact layout of utilities and infrastructure.
3.3.3 Design and Permitting Fees Design and permitting fees for architecture and engineering (often referred to as “soft costs”) vary substantially based on the size and style of the home, parcel location, construction delivery method, and municipal regulations including planning board and zoning requirements and approvals processes. Total fees for a typical small affordable single-family home range from 5% to 10% of the total construction cost.
3.3.4 Site Infrastructure Site infrastructure requirements and associated costs vary substantially based on site-specific conditions and constraints. Every site is unique and the costs to develop the necessary infrastructure can vary substantially. These constraints determine where the home can be sited within the lot. The associated costs represent a substantial portion of the total construction cost.
0
5
10
15
20
25
2013 2014 2015 2016 2017
No. o
f Lan
d Sa
les
Year
Number of Land Sales Over the Past 5 Years
Suburban
Urban
Rural
Figure 2: Number of land sales for each region in NH over the past 5 years.

New Hampshire Housing Finance Authority Affordable Single-Family Housing Study August 2018
Page 21 of 54
• Minimum frontage and setback requirements • Site terrain and natural features (forested, mountain-side, water frontage, etc.) • Soil type and subsurface conditions (e.g., bedrock) • Septic systems (if required) • Domestic water well (if required) • Site proximity to public roadway • Abutting property features
Setback requirements in the rural community residential district are a minimum of 75 feet from the roadway4 and 50 feet from property boundaries. Residential buildings must also be setback a minimum of 75 feet from the mean high-water mark of any water course or standing body of water. The urban community specifies that minimum residential structures and parking setbacks from an external lot line shall be 50 feet. Minimum structure and parking setbacks from an external road are 100 feet and the minimum frontage on internal roads is 40 feet. The minimum setbacks for front yard and distance between buildings are 20 feet and 24 feet, respectively.
Dimensional lot requirements for each community type in this case study vary and consider the availability of municipal water and sewer (refer to Table 10 in the Appendix). The suburban community provides incentive bonuses to further reduce the size of each lot. Examples of incentive bonuses include front setback and frontage reductions. All incentive bonuses for the suburban region are presented in Table 5. The urban and rural case study communities currently do not provide density incentives.
Waterfront lots are subject to additional restrictive regulations and permitting requirements. Because affordable homes are typically not constructed on more desirable waterfront lots these regulations are not presented in this study.
4 Setbacks measured from the center line of any road or right-of-way, property line, and mean high water mark at a water course or body of water to the nearest portion or part of any building.

New Hampshire Housing Finance Authority Affordable Single-Family Housing Study August 2018
Page 22 of 54
Table 5: Example of Incentive Bonuses for Site Infrastructure (NH Suburban Community Case Study)
Incentive Bonus Requirement
Front Setbacks: May be reduced up to 50%
(a) Parking is placed to the rear or side of the structure
(b) Shared access drive and parking are established
(c) Sidewalks and/or bicycle paths are proposed along the Town roadway as shown on cross section
Frontage Requirements: May be reduced up to 50%
(a) Parking is placed to the rear or side of the structure
(b) Shared access drive and parking are established
(c) Sidewalk/bike path is proposed along the Town roadway as shown on cross section
Open Space Requirements: May be reduced to 10%
Land of equal or greater size as the required area is donated to the municipality or an appropriate organization
Building Height Requirements: For site plans with lot sizes greater than the minimum required acreage, the height structures may be increased 10 feet per additional acre of lot size, up to a maximum of 100 feet.
3.4 Ownership Costs Operation and maintenance (O&M) costs must be considered when evaluating the total cost of ownership. These costs are inversely related to the quality of construction. That is, lower quality workmanship and materials standards result in higher O&M costs. They also reduce the market value of the home.
The initial cost for a newly constructed house may be considered affordable, however, increased O&M costs may be high thereby reducing the affordability to the homeowner. Costs to replace failed HVAC equipment or repair a leaking roof are significant.
Energy costs for a code-standard house are substantially higher than a house constructed to high-performance standards such as ENERGY STAR® for New Homes. Heating fuel and electric costs can vary dramatically based on the envelope integrity, heating fuel type, equipment type, lighting fixtures, appliances, and systems control. Energy-conscious homeowners can further reduce total consumption.
Construction standards also affect the future market value of homes. Today’s homebuyers generally appreciate enhanced construction standards and “green” home standards. That trend is influenced by more stringent building codes, third-party certification standards (LEED® and ENERGY STAR®), and market valuations that increase appraised values for green home measures. Enhanced construction standards are available in modular home construction, however, the pricing premiums increase costs above the threshold for affordable housing.
3.5 Economic Incentives As presented herein, there are several economic incentives available for new home construction. They include prescriptive and performance-based utility company rebates

New Hampshire Housing Finance Authority Affordable Single-Family Housing Study August 2018
Page 23 of 54
(including the ENERGY STAR® Certification program). Some of these credits are available to the developer and some are provided directly to the homeowner.
These incentives provide a modest initial incentive for homebuyers. Because they are designed to reduce energy consumption and improve indoor air-quality, the long-term benefits are greater. Total cost of ownership is reduced through lower utility costs and future value of the home is increased. Table 6 presents a listing of incentives that are currently available to housing developers and owners.
Table 6: Incentive programs in New Hampshire. (DSIRE NC Clean Energy Technology Center 8/21/2018)
Incentive Type Item Incentive Amount
Energy Efficiency Rebate Program
Lighting Online discounts Room air purifier $40 Room air conditioner $20 Clothes washer $30 Clothes dryer $40 Dehumidifier $25 Refrigerator $20 Refrigerator/freezer recycling $30 New Construction ENERGY STAR Home up to $4,000
Unitil (Electric) Rebate Program Home Performance with ENERGY STAR up to $4,000 Low-Income Home Energy Assistance up to $8,000
Unitil (Gas) Rebate Program
Natural Gas Furnaces $300-$450 Natural Gas Boilers $1,000-$1,500 Condensing Boilers $1,000-$1,500 Indirect Water Heaters $400 Condensing Water Heaters $500 On Demand Tankless Water Heaters $800 Heat Recovery Ventilators $500 Boiler Reset Controls $225 Programmable Thermostats up to $25 Wireless Thermostats up to $100 Home Heating and Water Heating Rebates 50% of costs
Unitil (Electric) Loan Program Maximum Loan $7,500 Other potential incentives include donation or below-market value sale of publicly owned lands in New Hampshire. State and town/city owned lands can be used to incentivize developers and homeowners. This practice offers the most attractive incentive for developers interested in large-scale single-family home developments in all regions of New Hampshire.

New Hampshire Housing Finance Authority Affordable Single-Family Housing Study August 2018
Page 24 of 54
4.0 CONCLUSION Based on the data and information derived from this study, constructing an affordable single-family home in New Hampshire is feasible. Total costs for the three construction methods evaluated are similar. Each method has unique advantages and disadvantages and selection of the most practical method should consider the relevant variables for the specific application. Inherent with the construction process, prefabricated or off-site constructed homes improve quality and reduce overall schedule.
Site infrastructure and land development costs represent a substantial portion of total single-family home cost in New Hampshire. In terms of cost, site development presents the greatest risk due to regulations, unforeseen site conditions, and weather impacts. Due diligence in selecting a building lot is vital when planning the construction of an affordable single-family home.
While the total costs of new construction do not vary significantly by region, the availability of local skilled labor does influence the construction approach. The level of skilled trade experience and training determines schedule and quality (workmanship).
Land acquisition and site infrastructure costs are variable for the evaluated regions including urban, suburban, and rural. Conventional zoning requirements require larger lots although many towns/cities are adopting modern zoning standards that reduce lot sizes and promote higher-density housing development in New Hampshire.
Encouraging developers to construct smaller, affordable single-family homes in New Hampshire during a strong market where larger homes yield greater profits is a challenge. Providing additional incentives through innovative land use controls under RSA 674:21, and including: timing, intensity, and use incentives, inclusionary zoning, and impact fee waivers, would increase low-end market favorability. Additionally, public land grants and subsidized construction loans would keep development costs down and allow for profits that could spur the development of smaller units.

New Hampshire Housing Finance Authority Affordable Single-Family Housing Study August 2018
Page 25 of 54
APPENDICES Tables
Table 7: Advantages and drawbacks of each method of construction in question.
Stick Built Construction Panelized Construction Modular Construction Advantage Disadvantage Advantage Disadvantage Advantage Disadvantage Most familiar
form of construction
Variation in quality and cost
depending on available labor
Ease of repetition Construction not as rapid as modular
construction
Ease of repetition
Access to tight sites are not
possible
Customization occurs late in
design process
Building materials are exposed
during construction
Constructed in climate-controlled factories with tight
quality control
Builders/subcontractors may be
unfamiliar with best practice of finish
work
Constructed in climate-
controlled factories with tight quality
control
Inspections are complicated by enclosed MEP
Material easily maneuvered on tight sites
Slowest construction
method
Buildings can be constructed
independent to foundation work, shortening work
schedule
Frontloaded funding
Buildings can be constructed independent to
foundation work,
shortening work schedule
No ordinance against modular construction in
some neighborhoods
Reduced material efficiency
Prices are independent of local labor rates reducing cost in some regions with no compromise
on quality or schedule
Extremely tight sites can be difficult
to access
Extremely rapid star to finish
with pre-applied finishes and mechanical
systems installed
Builders/ subcontractors are unfamiliar
with construction method
Noise and dust pollution on site
Adjustability is built in to accommodate
foundation work
Reduced material waste
Frontloaded funding
Material prone to theft during construction
No enclosed MEP to complicate building
inspection Replication is
inefficient Disentangled
Electrical/plumbing systems from
building envelope for ease of upgrading
Weather effects schedule, cost,
and quality
Tight/efficient construction reduces
energy cost Lack of
consistency between projects
Reduced material waste

New Hampshire Housing Authority Affordable Single-Family Housing Study August 2018
Page 26 of 54
Table 8: Quantitative cost evaluation between stick build and panelized construction methods.
Quantitative Evaluation of Construction Method
Component5 Method of Construction Stick Built Panelized Modular
Model NEH Fairview
Hancock Sutherlan
d R-11
Unity Xyla 1236
NEH Fairview
Hancock Sutherlan
d R-11
NEH Fairview
Huntington Plainfield
General Conditions 7 ($) 8,000 8,000 $1,5008 6,500 6,500 2,000 2,000
Sitework ($) Full Basement
Full Basement
Full Basement
Full Basement
Full Basement
Full Basement
Full Basement
Foundation ($) 20,000 20,000 22,000 20,000 20,000 20,000
185,000
Shell (insulated building envelope, installed) ($)
39,530 45,268 125,250 37,248 42,498 --
Interior Partitions ($)
98,420
Windows/Doors ($) Insulated Module ($) -- -- -- -- --
Roofing ($) 6,175 6,175 7,000 6,175 6,175 Siding and Exterior Trim ($) 11,000 11,000 15,000 11,000 11,000
Plumbing (including fixtures) ($) 14,000 14,000 10,000 14,000 14,000 Electrical (including fixtures) ($) 8,000 8,000 8,000 8,000 8,000
Interior Walls ($) -- -- -- -- -- Drywall ($) 8,500 8,500 6,000 8,500 8,500
Foundation Prep ($) -- -- -- -- -- 1,500 Interior Trim ($) 3,500 3,500 3,500 3,500 3,50 Included
Paint ($) 4,300 4,300 4,300 4,300 4,300 5,000 Interior Doors ($) 2,365 2,365 2,365 2,365 2,365 Included
Flooring ($) 6,000 6,000 6,000 6,000 6,000 6,000 Appliances ($) 3,000 3,000 3,000 3,000 3,000 3,000
Cabinets, Vanities, and Countertops ($) 5,880 5,880 5,880 5,880 5,880 Included
HVAC ($) -- -- 15,000 -- --
11,420
Complete roofing ($)
-- -- -- -- -- Included
Complete Siding (gable ends) and Trim ($)
Electrical and plumbing Connections ($)
Drywall Repair/Taping ($) Connection Sheathing and
Insulation ($) Sum ($): 150,250 155,988 244,795 146,468 151,718 147,340 187,000
Cost ($/SF) 112 115 176 109 112 110 131
5 Note: assume $55/hour as standard labor rate, $65/hour for electrician, $85/hour for plumbers 6 Upgrades include R-33 wall assemblies, triple-glazed windows, ERV, shell that scores <1 ACH 50 on blower door test 7 Includes permit, engineering, permit drawing set, site supervision, dumpsters, sanitary facilities 8 Includes permit set, engineering in shell

New Hampshire Housing Authority Affordable Single-Family Housing Study August 2018
Page 27 of 54
Table 9: Home median value for Urban, Suburban, and Rural developments in NH.
(NH Employment Security, Data from ACS 2012-2016)
Development Population Age Median
(years) Average Per
Capita Income ($)
Median Home Value
($) Urban 31,150 36 33,640 229,420
Suburban 7,120 40 35,280 231,900 Rural 2,500 47 35,110 221,330
Table 10: Minimum lot size requirements & setbacks for Urban, Suburban, and Rural developments in NH.
Development Lot Area (SF) Front Setback (ft)
Side Setback (ft)
Lot Frontage (ft)
Urban 20,000 20 24 40 Urban9 30,000 20 24 40 Urban10 20,000 20 24 40
Suburban 20,000 40 20 120 Suburban9 80,000 40 20 200 Suburban10 60,000 40 20 150
Rural 87,120 75 25 200
Table 11: Median lot size and price for Urban, Suburban, and Rural developments in NH over the past 5 years.
Size (acres) Price ($) 2013 2014 2015 2016 2017 2013 2014 2015 2016 2017 Total
Urb
an
2.4 1.25 1.08 1.23 2.085 212,500 95,000 97,500 125,000 87,450 100,000
Sub
urba
n
3.6 4.6 1211 1.8 9.55 60,000 45,000 110,000 95,000 85,000 72,500
Rur
al
1.3 1.97 1.375 0.76 2.33 45,500 33,333 21,250 22,700 54,000 33,333
9 Municipal water and sewer not provided. 10 Municipal water provided. 11 High median acreage due to large subdivided land parcel. Number of subdivision unknown.

New Hampshire Housing Authority Affordable Single-Family Housing Study August 2018
Page 28 of 54
Table 12: Price and size of vacant land for Urban, Suburban, and Rural developments in NH in 2013 (Left) and 2014 (Right)
2013 Size (acre) Price ($) 2014 Size (acre) Price ($) Urban
00.65 68,750 Urban
0.04 18,500 1 75,000 1.3 55,000 6.5 99,000 1.15 55,000 1.9 165,000 3.3 60,000 0.6 200,000 0.56 70,000 2.9 225,000 0.81 90,000 0.6 225,000 1.05 95,000 5.8 255,000 0.69 95,000 5312 285,000 0.69 95,000 4 300,000 3 95,100
Suburban
0.13 35,000 2.9 107,000 5.1 60,000 1.1 110,000 3.6 60,000 17.912 125,000 3.1 72,500 2.4 235,000 42.312 75,000 27 308,750
Rural
0.25 9,500 24 450,000 0.31 10,000 Suburban 0.24 17,500 0.6 11,000 5.7 45,000 0.53 12,500 3.5 45,000 2.04 39,900 42.712 147,000 2 45,500 Urban
0.53 7,000
1.3 59,900 0.57 13,000 6.03 65,000 0.77 14,500 17.1312 118,000 0.86 16,000 14512 135,000 0.45 21,500 0.62 339,000 0.51 23,500
1.97 33,333 2 33,333 2 33,334 13.912 61,000 2.02 81,600 2912 105,000 10 139,500 1.8 300,000 2 330,000
12 Large acreage assumed to be a subdivided land parcel of unknown subdivision quantity.

New Hampshire Housing Authority Affordable Single-Family Housing Study August 2018
Page 29 of 54
Table 13: Price and size of vacant land for Urban, Suburban, and Rural developments in NH in 2015 (left), 2016 (middle), and 2017 (right).
2015 Size (acre)
Price ($) 2016 Size (acre)
Price ($) 2017 Size (acre)
Price ($)
Urban 0.23 20,000 Urban 0.29 7,900 Urban 2.55 40,000 0.96 25,000 0.34 95,000 1.03 60,000 1.08 50,000 0.27 104,000 1.19 63,800 2.04 55,000 8.4 125,000 1.62 64,500 1.08 65,000 1.23 140,000 8.9 70,000 1.8 95,000 3.88 320,000 0.21 82,000 0.46 100,000 3.4 410,000 0.91 85,000 0.92 100,000 Suburban 1.8 95,000 2.6 89,900 2.17 102,000 Rural 0.36 4,250 2.7 115,000 1.9 170,000 0.69 5,500 0.4 200,000 4.5 225,000 0.83 7,500 5.00 210,000 0.4 250,000 0.66 8,800 6.4 300,000
Suburban 1.44 12,500 0.45 12,500 12.212 710,000 1412 110,000 0.34 13,500 1.41 950,000 1212 142,500 1.21 17,000 Suburban 0.12 28,000
Rural 1.1 4,000 1.06 20,500 1212 80,000 0.32 7,000 0.51 24,900 22.712 90,000 1.35 8,000 0.51 26,000 7.1 119,000 0.94 11,750 1.01 32,000 Rural 0.62 6,750 0.34 13,250 5.34 34,000 1.34 7,800 0.51 23,500 5.04 35,000 2.76 10,000 1.81 15,000 2.00 47,000 0.56 10,000 0.49 18,500 0.08 5,000 0.7 14,500 0.78 24,000 10.2112 67,500 0.31 15,000 3.02 27,500 2.00 28,400 1.4 41,000 1.63 36,500 6712 67,000 2.33 36,500 5.1 68,500 1.59 37,500 2212 95,000 1.5 43,000 2.00 110,000 22.1612 54,000 31.412 130,000 0.08 55,000
1212 65,000 15.212 72,900 2.4 85,000 32.512 91,250

New Hampshire Housing Authority Affordable Single-Family Housing Study August 2018
Page 30 of 54
Table 14: Cost matrix of different size modular models.
Small End 800-1100 SF Large End 1300-1500 SF M
odul
ar
Mod
el: NEH
Washington13
NEH Meredith
NEH Meredith
14
Pro-Fab Waltham
15
NEH Fairview
NEH Effingham
Pro-Fab Acadia16
Are
a (S
F)
1000 850 1050 1042 1344 1456 1346
# of
B
edro
oms
3 2 2 3 2 3 3
# of
B
athr
oom
s
1 1 1-1/2 1 2 2 2
Cos
t ($)
156,274 143,497 155,618 183,236 181,210 190,701 216,367
Pric
e17
($)
188,736 173,439 188,112 219,862 218,691 230,182 259,457
Cos
t ($/
SF)
189 204 179 211 163 158 193
13 Cherrydale has same SF, different floorplan. 14 Revised floor plan. 15 A $4,000 discount is applied if ordering 5 homes at once. A $5,000 discount is applied if ordering 6-10 homes at once. An air exchange system is included in the price. 16 A $4,000 discount is applied if ordering 5 homes at once. A $5,000 discount is applied if ordering 6-10 homes at once. 17 Including Builder’s fee (5% on modular package, 15% on all other costs), 10% contingency on total marked up price.
New Hampshire Housing Authority Affordable Single-Family Housing Study August 2018
Page 31 of 54
Table 15: Cost matrix of different modular garages.
Garages
Modular Model:
Stoltzfus 24’x28’ Standard 5-Pitch Two
Car Garage
Stoltzfus 10’x24’ A-Frame Single Car
Garage
SP Rankin Garage Builders 24’x26’
Single Story Two Car Garage
Characteristics:
Built to customer’s concrete pad.
Pressure treated bottom place with insulator.
2”x4” wall studs @ 16” OC.
8’ Sidewalls. ½” Painted Smartside Wood Siding or Cedar
Creek Vinyl Siding with ½” Wood Sheathing.
(2) 9’x7’ Steel Garage Doors: ½ Lite man door. (4) 2’x3’ Windows with
shutters. 5-Pitch Pre-engineered
Roof Trusses @ 24” OC. Hurricane Straps securing
Trusses to wall. ½” Sheathing
15 lbs. tar paper 30-year architectural
shingles Shipping: $5/mile from
factory
Built to customer’s concrete pad.
2”x4” Floor joists @ 12” OC.
¾” T&G SmartFinish Wood Flooring walls,
2”x4” @ 16” OC. 7’ high walls.
½” LP Smartside Siding finished the exterior or an optional Cedar Creek vinyl
siding with ½” wood sheathing or optional
Hardi-Plank lap siding. (1) 9’x7’ Solid steel
garage door with aluminum diamond plate
guard (note: 8’x6’-6” garage door in 10’ wide
buildings). 36” single door with
aluminum floor guard. Includes (2) 18”x27”
windows with screens. 2”x4” Rafters @ 16” OC. ½” sheathing tar paper
roof. 30-year architectural
shingles.
½” Roof sheathing plywood.
2”x8” Rafters @ 16” OC. 2”x4” Collar tie. 2”x4” Hanger.
2”x10” Ridge board. Galvanized drip edge.
Pine fascia. Pine trim.
2”x4” gable studs. 2”x8” garage door header.
2”x4” jack stud. 2”x6” rafter tie @ 32” OC.
2”x4” pressure treated bottom plate.
2”x4” studs @ 16” OC. 2”x4” tie plate. 2”x4” top plate.
2”x8” window & service door headers.
T-111 5/8” fir siding. 3/8” AC pine soffit. 20-year shingles. 5/12 roof pitch.
Steel raised panel insulated overhead doors.
24”x32” double hung windows (optional)
Steel insulated service door.
Cost ($) 21,570 6,415 17,850 Price17 ($) 23,433.85 7,719.53 19,635
Cost ($/SF) 34.87 32.16 28.61

New Hampshire Housing Authority Affordable Single-Family Housing Study August 2018
Page 32 of 54
Table 16: Garage building permits and additional costs.
Garages
Modular Model: Stoltzfus 24’x28’ Standard 5-Pitch Two Car Garage
Stoltzfus 10’x24’ A-Frame Single Car
Garage
SP Rankin Garage Builders 24’x26’ Single Story Two Car Garage
Urban Town Building Permit ($) 259.34 102.20 221.35
Suburban Town Building Permit ($) 226.60 97.00 212.20
Rural Town Building Permit (Includes
Driveway Permit) ($) 235.20 84.00 218.40
Sitework ($) 2,00018 1,00018 2,00018 Foundation ($) 2,40019 87019 Included19
Electrical Including Fixtures (need to
connect home runs) ($) 1,700 950 1,700
Table 17: Pricing demographics for single-family residential sales in Urban, Suburban, Rural developments in NH over the past 5 years.
Development Year # of Sales Days on Market
Min. Price ($)
Max. Price ($)
Median Price ($)
Urban
2013 320 84 49,500 962,365 263,356 2014 332 75 47,000 1,325,000 258,450 2015 347 73 90,000 1,611,975 280,000 2016 377 57 83,500 1,275,000 260,000 2017 346 54 37,000 2,835,000 309,750
Suburban
2013 75 73 42,000 440,000 185,370 2014 75 63 44,000 533,000 190,000 2015 66 48 83,500 435,000 214,750 2016 88 60 30,000 418,000 222,000 2017 93 39 100,000 424,900 236,000
Rural
2013 67 178 50,500 710,000 175,000 2014 67 96 47,500 768,600 180,000 2015 69 131 45,000 949,000 207,900 2016 71 104 35,000 955,000 175,000 2017 74 78 30,500 969,000 212,234
18 Allowance for shallow foundation excavation. 19 Price represents thickened slab, if 4’ frost walls are required adjust accordingly.

New Hampshire Housing Authority Affordable Single-Family Housing Study August 2018
Page 33 of 54
Table 18: Modular design selection and pricing Small End 800-1100 SF Large End 1300-1500 SF
Modular Model: NEH Washington
NEH Meredith
NEH Meredith (revised)
Pro-Fab Waltham
NEH Fairview
NEH Effingham
Pro-Fab Acadia
Characteristics: 1000 SF, 3 bed 1 bath
850 SF, 2 bed 1 bath
1050 SF, 2 bed 1 1/2
bath 1042 SF, 3 bed 1 bath.
1344 SF, 3 bed 2
bath 1456 SF, 3 bed 2 bath
1346 SF, 3 bed 2
bath Cost ($) 156,274 143,497 155,618 183,236 181,210 190,701 216,367
Price (excludes permit, utilities, and impact fees)17 ($)
188,736 173,439 188,112 219,862 218,691 230,182 259,457
Cost ($/SF) 189 204 179 211 163 158 193 General Conditions
($) 5,000 5,000 5,000 5,000 5,000 5,000 5,000
Urban Building Permit ($) 1,912 1,759 1,906 2,224 2,212 2,327 2,620
Suburban Building Permit ($) 325 280 340 338 428 462 429
Rural Building Permit (includes
driveway permit) ($) 390 338 408 405 510 550 511
Urban Impact Fees ($) 8,895 8,895 8,895 8,895 8,895 8,895 8,895
Suburban Impact Fees ($) 1,331 1,331 1,331 1,331 1,331 1,331 1,331
Rural Impact Fees None None None None None None None Clearing ($) 10,000 10,000 10,000 10,000 10,000 10,000 10,000
Excavation/ Drains/ Grading ($) 12,000 10,200 12,600 12,504 16,128 17,472 16,152
Driveway20 ($) 3,800 3,800 3,800 3,800 3,800 3,800 3,800 Urban Public Sewer
Connection ($) 2,897 2,897 2,897 2,897 2,897 2,897 2,897
Urban Public Water Connection ($) 2,274 2,274 2,274 2,274 2,274 2,274 2,274
Suburban Public Sewer Connection
($) 4,534 4,534 4,534 4,534 4,534 4,534 4,534
Suburban Public Water Connection
($) 1,500 1,500 1,500 1,500 1,500 1,500 1,500
Septic System21 ($) 13,000 12,000 12,000 13,000 13,000 13,000 13,000 Well22 ($) 5,000 5,000 5,000 5,000 5,000 5,000 5,000
Trenching for Utilities ($) 1,000 1,000 1,000 1,000 1,000 1,000 1,000
Loam and Seed ($) 6,000 6,000 6,000 6,000 6,000 6,000 6,000
20 Assuming 40-foot driveway, price varies by length 21 If public sewer is not available 22 If public water is not available

New Hampshire Housing Authority Affordable Single-Family Housing Study August 2018
Page 34 of 54
Continuation of Table 18
Modular Model: NEH Washington
NEH Meredith
NEH Meredith (revised)
Pro-Fab Waltham
NEH Fairview
NEH Effingham
Pro-Fab Acadia
Foundation 12,854 11,387 13,103 13,075 15,609 16,564 15,617
Foundation prep (girder, lally columns) ($)
1,200 1,200 1,500 included 1,500 1,500 included
Insulated Modules ($)
81,370 73,500 79,500 108,467 95,823 100,500 129,518
Interior Partitions ($)
Installed Windows/Doors ($)
Roofing ($) Siding and trim ($)
Plumbing and Electrical Including
Fixtures ($) Interior Walls ($)
Drywall ($) Interior trim Included Included Included Included Included Included Included
Paint (Finish) ($) 4,800 4,300 4,900 4,200 5,000 5,500 5,000 Interior Doors Included Included Included Included Included Included Included Flooring ($) 4,500 3,825 4,300 6,240 6,050 6,550 8,500
Cabinets, Vanities, and Countertops Included Included Included Included Included Included Included
Appliances ($) 2,500 2,500 2,500 2,500 3,000 3,500 3,500 HVAC ($) 2,950 2,950 2,950 2,950 3,450 3,450 3,450
Complete Roofing ($)
8,300 7,835 8,465
included by button up
crew
8,850 9,865
included by button up crew
Complete Siding (gable ends) and
Trim ($)
included by button up
crew
included by button up crew
Electrical and Plumbing
Connections ($) 5,220 5,330
Drywall Repair/Taping ($) 2,280 3,500
Connection Sheathing and
Floor Insulation ($)
included by button up
crew
included by button up crew

New Hampshire Housing Authority Affordable Single-Family Housing Study August 2018
Page 35 of 54
Figures
Figure 3: Size and price of vacant land for Urban, Suburban, and Rural developments in NH over the past 5 years.
$0.00
$100,000.00
$200,000.00
$300,000.00
$400,000.00
$500,000.00
$600,000.00
$700,000.00
$800,000.00
$900,000.00
$1,000,000.00
0 20 40 60 80 100 120 140 160
LOT
PRIC
E
LOT SIZE (ACRES)
SIZ E AND P RIC E O F VAC ANT LAND O VER TH E PAST 5 YEARS
Suburban Urban Rural

New Hampshire Housing Authority Affordable Single-Family Housing Study August 2018
Page 36 of 54
Figure 4: Median price of single-family residential sales in Urban, Suburban, and Rural developments over the past 5
years.
Figure 5: Median cost of vacant land of an Urban, Suburban, and Rural development in NH over the past 5 years.
$0
$50,000
$100,000
$150,000
$200,000
$250,000
$300,000
$350,000
2013 2014 2015 2016 2017
Pric
e
Time (Years)
Median Single-Family Residential Sales Over the Past 5 Years
Rural
Urban
Suburban
$0.00
$50,000.00
$100,000.00
$150,000.00
$200,000.00
$250,000.00
2013 2014 2015 2016 2017
Med
ian
Pric
e of L
and
Time (years)
Median Price of Vacant Land Over the Past 5 Years
Suburban
Urban
Rural

New Hampshire Housing Authority Affordable Single-Family Housing Study August 2018
Page 37 of 54
Figure 6: Median acreage of vacant land for an Urban, Suburban, and Rural development in NH over the past 5
years.
Figure 7: Median single-family residential home sales over the past 5 years by region
0
2
4
6
8
10
12
14
2013 2014 2015 2016 2017
Med
ian
Size
of L
and
(acr
es)
Time (Years)
Median Acreage of Vacant Land Over the Past 5 Years
Suburban
Urban
Rural
$0
$50,000
$100,000
$150,000
$200,000
$250,000
$300,000
$350,000
2013 2014 2015 2016 2017
Pric
e
Time (Years)
Median Single-Family Residential Sales Over the Past 5 Years
Rural
Urban
Suburban

New Hampshire Housing Authority Affordable Single-Family Housing Study August 2018
Page 38 of 54
Attachments Attachment 1: New England Homes Classic Series Specifications

New Hampshire Housing Authority Affordable Single-Family Housing Study August 2018
Page 39 of 54
Attachment 2: Pro-Fab US Standard Specifications

New Hampshire Housing Authority Affordable Single-Family Housing Study August 2018
Page 40 of 54

New Hampshire Housing Authority Affordable Single-Family Housing Study August 2018
Page 41 of 54

New Hampshire Housing Authority Affordable Single-Family Housing Study August 2018
Page 42 of 54

New Hampshire Housing Authority Affordable Single-Family Housing Study August 2018
Page 43 of 54
Attachment 3: Additional Specifications

New Hampshire Housing Authority Affordable Single-Family Housing Study August 2018
Page 44 of 54

New Hampshire Housing Authority Affordable Single-Family Housing Study August 2018
Page 45 of 54

New Hampshire Housing Authority Affordable Single-Family Housing Study August 2018
Page 46 of 54
Attachment 4: NEH Photo Synopsis 1. The photo below depicts raw material to be cut and sent to the framing station
2. Floor systems are framed, sheathed and then slid into the center of the framing station.

New Hampshire Housing Authority Affordable Single-Family Housing Study August 2018
Page 47 of 54
3. Walls are framed over drywall, which is then attached with a 2-part adhesive. Walls are lifted into place on the floor system with an overhead gantry crane.
4. Ceilings are framed, lifted into place, then modules are slid into the area where electricians and plumbers rough them in on air pressurized castors.

New Hampshire Housing Authority Affordable Single-Family Housing Study August 2018
Page 48 of 54
5. Plumbing and electrical systems are roughed in, and the module then slides over to the insulation, sheathing, and window installation area.

New Hampshire Housing Authority Affordable Single-Family Housing Study August 2018
Page 49 of 54
6. Modules are insulated with dense pack cellulose, sheathed, wrapped, and windows and doors installed. The Drywall is also taped, mudded and primed.
7. As an option, trim can be finish coated in the spray booth.

New Hampshire Housing Authority Affordable Single-Family Housing Study August 2018
Page 50 of 54
8. Modules slide into the next station for installation of interior trim, plumbing and electrical fixtures, cabinets and vanities. If the home receives laminate counters they are installed here, solid surface countertops are templated for field installation.
9. Modules slide in front of the overhead doors where siding and exterior trim is applied. They are then jacked up so that plumbing drains can be connected, and trailers backed under for transport to the jobsite. The modules are shrink wrapped for protection during transport.

New Hampshire Housing Authority Affordable Single-Family Housing Study August 2018
Page 51 of 54
10. When modules arrive on site, a crane lifts them onto the prepped foundation. Marriage walls are tied together, building wrap and roofing stitched, and structural connections made. Completion of the siding at gable ends, roof trim, scribing sheathing to foundation, plumbing and electrical home runs, floor insulation, finish painting, and finish floor installation are all completed on site by the local builder.

New Hampshire Housing Authority Affordable Single-Family Housing Study August 2018
Page 52 of 54
Attachment 5: Combination Gas Fired Boiler WMB-80C for houses up to 1000 SF WMB-120C for houses ranging from 1000-1456 SF

New Hampshire Housing Authority Affordable Single-Family Housing Study August 2018
Page 53 of 54
Attachment 6: Floor Plans for Pro-Fab Modular Home Designs Pro-Fab Acadia
Pro-Fab Waltham

New Hampshire Housing Authority Affordable Single-Family Housing Study August 2018
Page 54 of 54
References
Difference between Urban, Suburban, and Rural
http://www.differencebetween.net/language/difference-between-rural-and-suburban-and-urban/


![[XLS] · Web viewMississippi Regional Housing Authority No. IV MS030 Mississippi Regional Housing Authority No. V MS040 Mississippi Regional Housing Authority No. VIII MS047 The Housing](https://cdn.vdocuments.site/doc/165x107/5ab7689f7f8b9ad3038b901d/xls-viewmississippi-regional-housing-authority-no-iv-ms030-mississippi-regional.jpg)


