
Natural capital to support the European Green Deal
Water resources and aquatic ecosystems in Europe:
past trends, future scenarios and resilience
Bruna Grizzetti
EurAqua Webinar - Water challenges in the European Green Deal, 11 June 2020

• EU Green Deal (December 2019):
Proposal for a European climate law (March 2020) ensure a climate neutral
European Union by 2050
New Biodiversity Strategy (May 2020) protect our fragile ecosystem and natural
resources
Farm to Fork Strategy (May 2020) make food systems more sustainable
Zero Pollution Strategy eliminate pollution and protect citizens health
Leave no one behind fair and inclusive transition
The European Green Deal

Article The Guardian 14th May 2020: How coronavirus
is reshaping Europe in dangerous ways
The “pandemic is accelerating tensions that could
unravel the EU”: deglobalisation, nation-first politics,
tighter borders, green backlash, east-west and
north-south tensions

Editorial Nature 14th May 2020: Embed nature in
strategies to reboot economies
“Every nation’s economic plans and policies are
rightly pivoting to dealing with COVID-19 and its
effects. But as economies are revived, now is the
right time to make up for past omissions — and
rebuild them in a way that takes nature’s true
value into account”

Freshwater ecosystems in Europe:
1. Pressures, condition and ecosystem services - Why investing in
natural capital can support the Green Deal?
2. State, trends and knowledge gaps - What is the state of freshwater
ecosystems in the EU?
3. Impacts of policy measures (scenarios of nutrient pollution reduction)
- What could be achieved by EU policy measures?
4. Nature-based solutions and natural capital resilience - Which ways to
reach the goals of the Green Deal?
Outline

1. Pressures, condition & ecosystem services
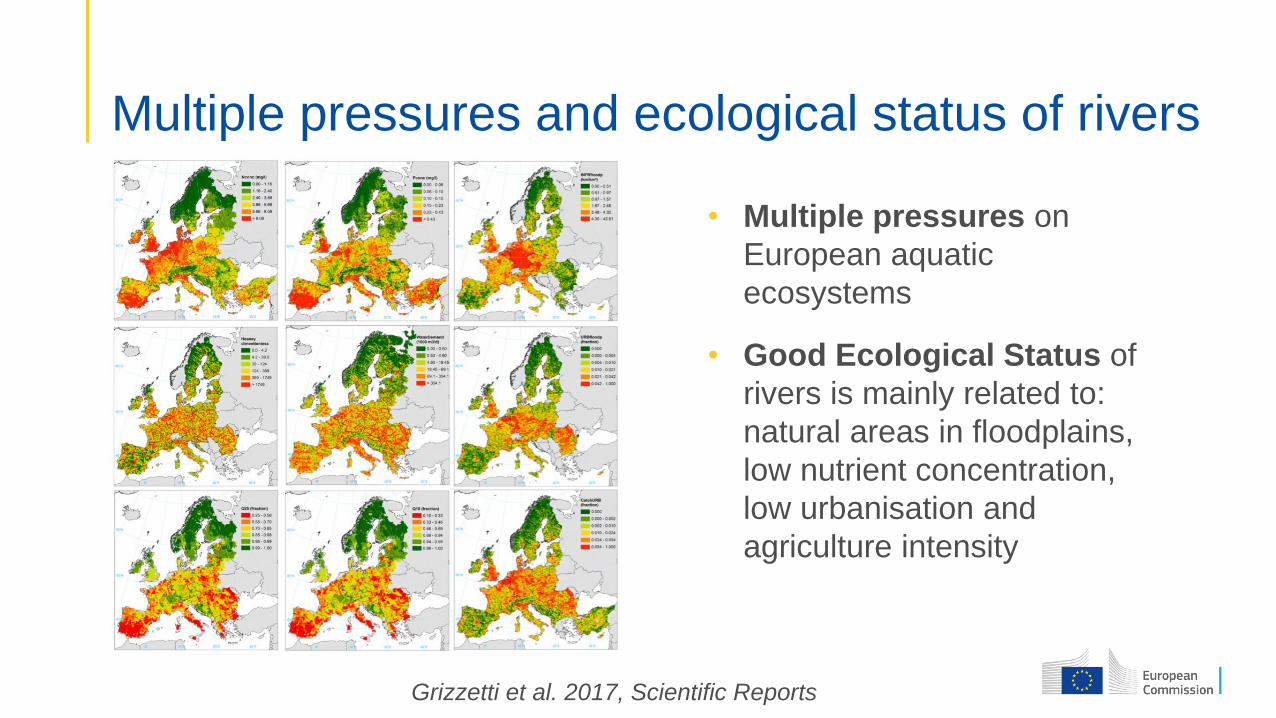
Multiple pressures and ecological status of rivers
• Multiple pressures on
European aquatic
ecosystems
• Good Ecological Status of
rivers is mainly related to:
natural areas in floodplains,
low nutrient concentration,
low urbanisation and
agriculture intensity
Grizzetti et al. 2017, Scientific Reports

Aquatic ecosystems condition and services
• Higher ecosystem service
delivery is mostly correlated
to better Ecological Status
• Relevance of protecting
and restoring aquatic
ecosystems
Grizzetti et al. 2019, STOTEN

2. State, trends and knowledge gaps

Mapping and Assessment of Ecosystems and their Services: An EU wide
ecosystem assessment in support of the EU biodiversity strategy (Maes et
al. JRC Science and Policy Report, upcoming June 2020)
State and trends of ecosystems in EU (MAES)
“This assessment concluded that Europe’s ecosystems are, on average, in
poor or degraded condition. There is no evidence for improvements.
Reducing pressures, better implementation of existing legislation and
ecosystem restoration are necessary to put ecosystems on a recovery
path and to increase the capacity of ecosystems to continue delivering a
whole range of ecosystem services essential to the prosperity of the
European Union and the well-being of its citizens”.
Maes et al. JRC Science and Policy Report (upcoming)

Trends in the state of rivers and lakes
PRESSURES
Indicator
Short-term
trend
(change)
Long-term
trend
(change)
Land take in rivers and lakes
Land take in potentially flooded areas
Change in water temperature Unresolved Unresolved
Atmospheric nitrogen deposition
Gross nutrient balance (nitrogen)
Gross nutrient balance (phosphorus)
Consumption of pesticides Unresolved Unresolved
Waste water - population treated at least at
secondary level
Domestic emissions of N, P and BOD Unresolved Unresolved
Gross Water abstractions
Fish catches (t/y) (in freshwater) Unresolved Unresolved
Number of annual introductions (number/y) Unresolved Unresolved
Pressure by invasive alien species of Union
concern on rivers and lakesUnresolved Unresolved
CONDITION
Indicator
Short-term
trend
(change)
Long-term
trend
(change)
Failing good Chemical status Unresolved
Water quality BOD Unresolved
Water quality N-NH4 Unresolved
Water quality N-NO3 Unresolved
Water quality P-PO4 Unresolved
Water quality TP Unresolved
River fraction with mean TN < 4 mg N/l Unresolved Unresolved
River fraction with mean TP < 0.1 mg P/l Unresolved Unresolved
River fraction with mean BOD < 5 mg O2/l Unresolved Unresolved
Poor bathing water quality
Low flow alteration Unresolved Unresolved
Water exploitation index > 0.20 Unresolved Unresolved
Share of artificial areas in riparian land Unresolved
Share of agricultural areas in riparian land Unresolved
Share of natural areas in riparian land Unresolved
Infrastructure density riparian land Unresolved Unresolved
Dam interception of streamflow Unresolved Unresolved
Fraction of accessible network Unresolved Unresolved
Good ecological status Unresolved
Biological quality elements Unresolved Unresolved
Proportion of rivers and lakes covered by Natura 2000 Unresolved
Proportion of rivers and lakes covered by nationally designated
areasUnresolved
Proportion of rivers and lakes not covered by nature regulation Unresolved
Threatened freshwater related habitats Unresolved Unresolved
Conservation status of species of community interest Unresolved Unresolved
EU population status and trends of bird species Unresolved Unresolved
Unresolved trend could not be defined
Significant positive change resulting in improvement
Stable trend (not significantly different from 0% per decade)
Significantly negative change resulting in degradation
Vigiak et al. (Chapter 3.6 Rivers and Lakes, in Maes et al. upcoming)
Key messages:
• Long term trends of indicators of most pressures show
improvements, but an important share remained unresolved and it
is likely to hide increasing pressures
• Long term trends of indicators of ecosystem condition pointing at
improvement are balanced by indicators that are not changing or
unresolved, but urbanization in riparian land has increased
• Apparent lag of response between the reduction of pressures and
improvement in condition
Trends in the state of rivers and lakes
Vigiak et al. (Chapter 3.6 Rivers and Lakes, in Maes et al. upcoming)

The implementation of the WFD
delivered major improvements in the
knowledge of freshwater ecosystem
conditions.
It is too early in the data collection to
see trajectories, but the knowledge
basis will continue to improve in the
future (in the second RBMP reporting
round more extensive data collection
and to methodological improvements).
Knowledge gaps (EU scale)
• Climate change
• Water temperature
• Chemicals
• Hydro-morphological alterations
• Biodiversity (Fisheries
conditions, alien species,
habitats and bird population)
Vigiak et al. (Chapter 3.6 Rivers and Lakes, in Maes et al. upcoming)

3. Impacts of policy measures (scenarios)
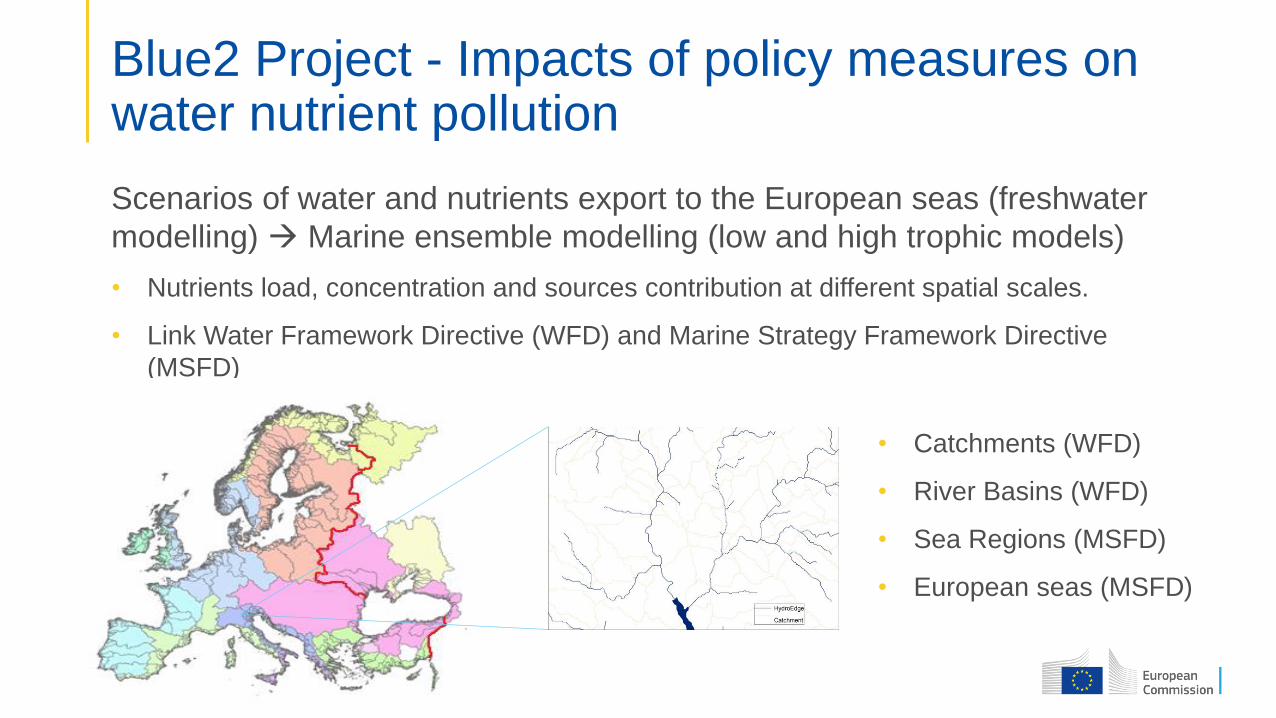
Scenarios of water and nutrients export to the European seas (freshwater
modelling) Marine ensemble modelling (low and high trophic models)
• Nutrients load, concentration and sources contribution at different spatial scales.
• Link Water Framework Directive (WFD) and Marine Strategy Framework Directive
(MSFD)
Blue2 Project - Impacts of policy measures on water nutrient pollution
• Catchments (WFD)
• River Basins (WFD)
• Sea Regions (MSFD)
• European seas (MSFD)
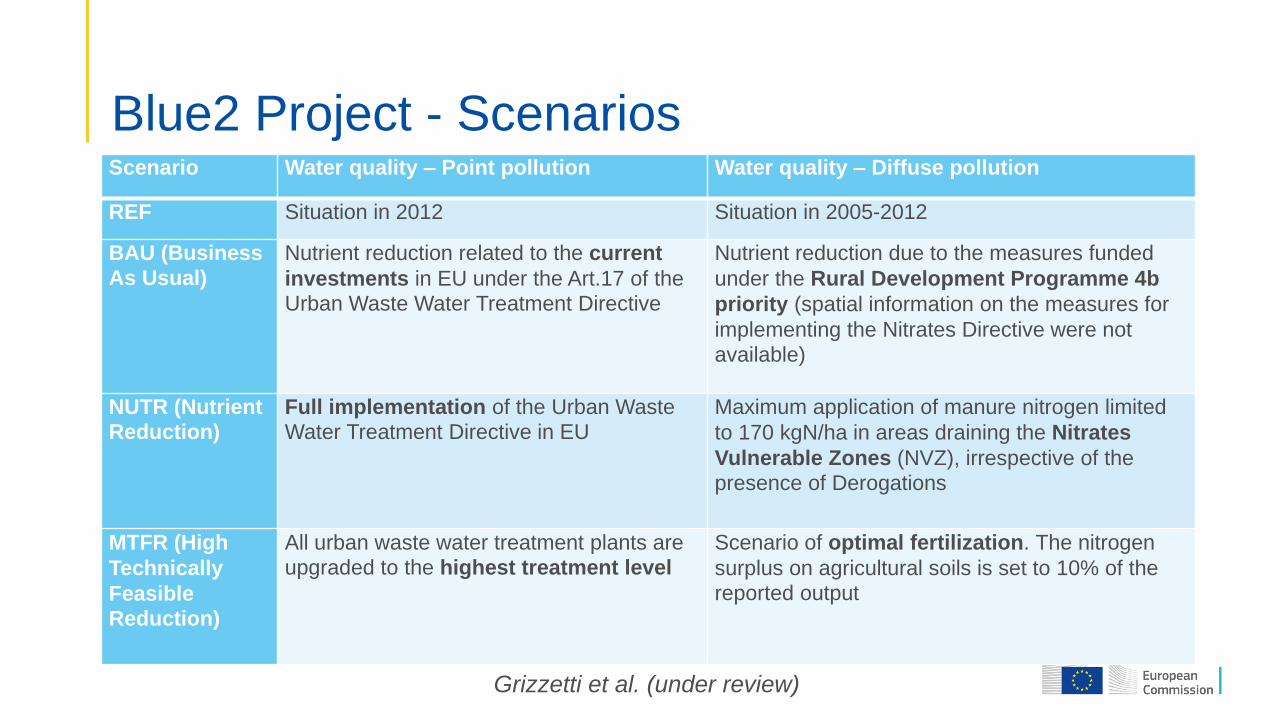
Scenario Water quality – Point pollution Water quality – Diffuse pollution
REF Situation in 2012 Situation in 2005-2012
BAU (Business
As Usual)
Nutrient reduction related to the current
investments in EU under the Art.17 of the Urban Waste Water Treatment Directive
Nutrient reduction due to the measures funded
under the Rural Development Programme 4b
priority (spatial information on the measures for
implementing the Nitrates Directive were not available)
NUTR (Nutrient Reduction)
Full implementation of the Urban Waste Water Treatment Directive in EU
Maximum application of manure nitrogen limited
to 170 kgN/ha in areas draining the Nitrates
Vulnerable Zones (NVZ), irrespective of the presence of Derogations
MTFR (High
Technically
Feasible Reduction)
All urban waste water treatment plants are upgraded to the highest treatment level
Scenario of optimal fertilization. The nitrogen
surplus on agricultural soils is set to 10% of the reported output
Blue2 Project - Scenarios
Grizzetti et al. (under review)
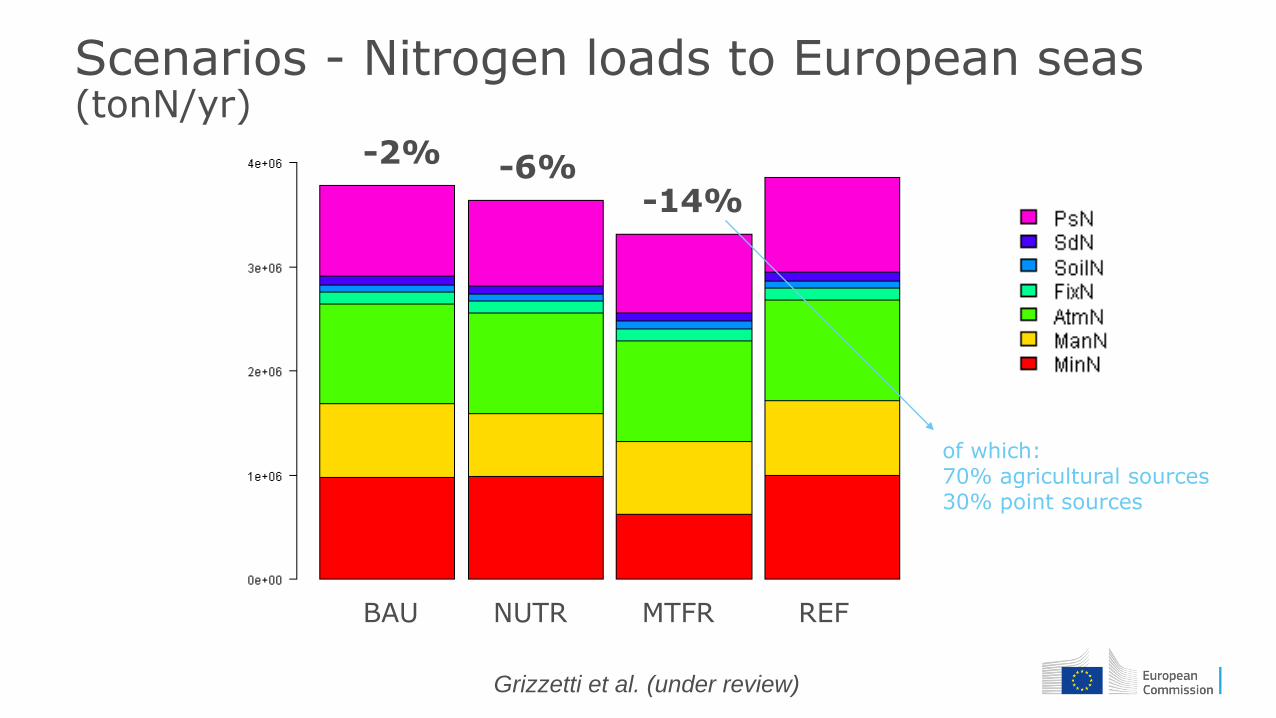
Scenarios - Nitrogen loads to European seas (tonN/yr)
BAU NUTR MTFR REF
-2% -6%-14%
of which:70% agricultural sources30% point sources
Grizzetti et al. (under review)

Scenarios – Phosphorus loads to European seas (tonP/yr)
BAU NUTR MTFR REF
-3% -8%
-20%
of which:16% agricultural sources84% point sources
Grizzetti et al. (under review)

Key findings:
• EU policy measures could decrease the nutrient export to the
seas up to 14% for nitrogen and 20% for phosphorus,
• improving the ecological status of rivers and lakes,
• but widening the nutrient unbalance in coastal ecosystems,
affecting eutrophication.
• Further nutrient reductions could be possible by a combination
of measures especially in the agricultural sector.
Blue2 Project - Results freshwater nutrients
Grizzetti et al. (under review)

4. Nature-based solutions & natural capital resilience
Which ways to reach the goals of the Green Deal?
• Understand the effectiveness of nature-based solutions
• Invest in natural capital resilience
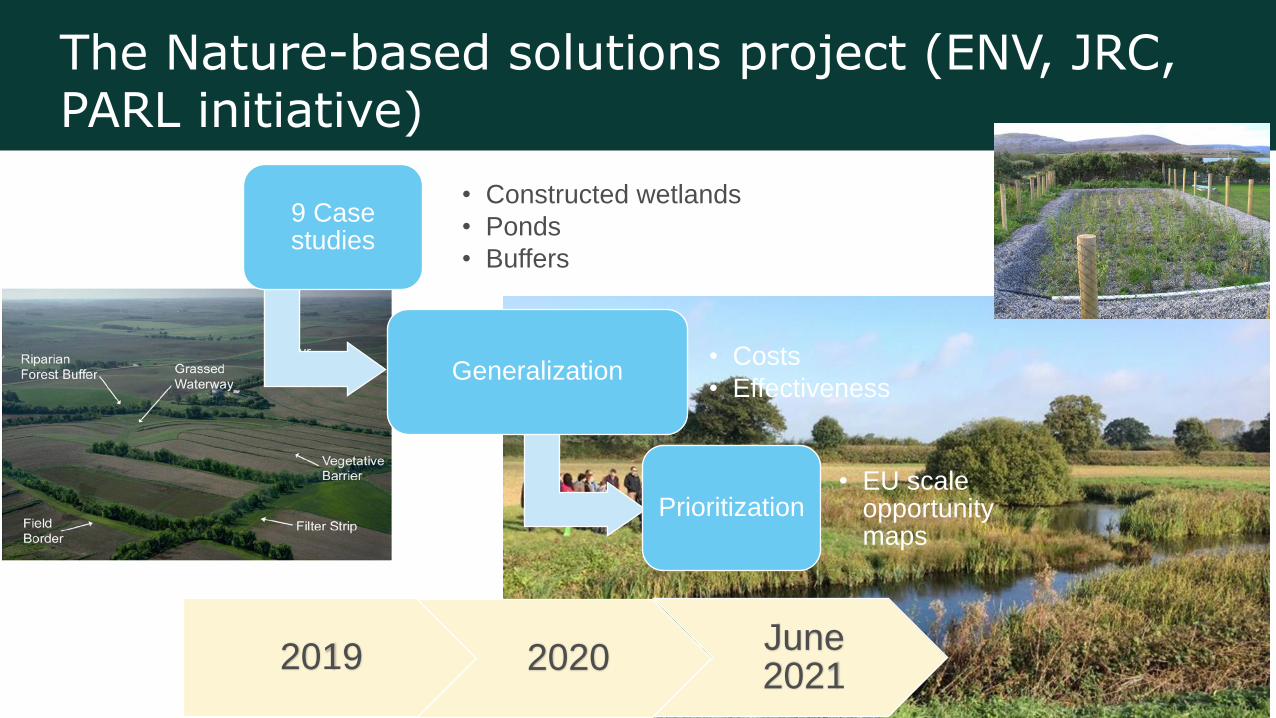
The Nature-based solutions project (ENV, JRC, PARL initiative)
9 Case studies
• Constructed wetlands
• Ponds
• Buffers
Generalization• Costs
• Effectiveness
Prioritization • EU scale
opportunity maps
2019 2020June 2021

• Quantify resilience of
natural resources, also
under future climate
extremes
• Annual production
resilience indicator
(applied to vegetation,
water resources,
agricultural production)
Resilience of vegetation primary production
Zampieri et al. 2019, Remote Sensing; Zampieri et al. 2020, STOTEN

Olga Vigiak, Matteo Zampieri, Alberto Pistocchi, Joachim Maes, Angel
Udias, Faycal Bouraoui, Ad De Roo, Alberto Aloe, Michela Zanni, Chiara
Dorati
Contributors
Special Issue in Remote Sensing journal
“Remotely Sensed Data and Climate Resilience”https://www.mdpi.com/journal/remotesensing/special_issues/climate_remote_sensing
(deadline papers submission February 2021)

Grizzetti, B., Liquete, C., Pistocchi, A., Vigiak, O., Zulian, G., Bouraoui, F., De Roo, A., Cardoso, A.C., 2019.
Relationship between ecological condition and ecosystem services in European rivers, lakes and coastal
waters. Sci. Total Environ. 671, 452–465. https://doi.org/https://doi.org/10.1016/j.scitotenv.2019.03.155
Grizzetti, B., Pistocchi, A., Liquete, C., Udias, A., Bouraoui, F., Van De Bund, W., 2017. Human pressures and
ecological status of European rivers. Sci. Rep. 7. https://doi.org/10.1038/s41598-017-00324-3
Grizzetti B., Vigiak O., Udias A., Aloe A., Zanni M., Bouraoui F., Pistocchi A., Dorati C., Friedland R., De Roo A.,
Benitez Sanz C., Leip A., Bielza M. How EU policies could reduce nutrient pollution in European inland and
coastal waters? (under review)
Maes et al., Mapping and Assessment of Ecosystems and their Services: An EU wide ecosystem assessment in
support of the EU biodiversity strategy. JRC Science and Policy Report (upcoming).
Zampieri, M., Grizzetti, B., Meroni, M., Scoccimarro, E., Vrieling, A., Naumann, G., Toreti, A., 2019. Annual
green water resources and vegetation resilience indicators: Definitions, mutual relationships, and future climate
projections. Remote Sens. 11. https://doi.org/10.3390/rs11222708
Zampieri, M., Weissteiner, C.J., Grizzetti, B., Toreti, A., van den Berg, M., Dentener, F., 2020. Estimating
resilience of crop production systems: From theory to practice. Sci. Total Environ. 735.
https://doi.org/10.1016/j.scitotenv.2020.139378
References

EU Science Hub: ec.europa.eu/jrc
@EU_ScienceHub
EU Science Hub – Joint Research Centre
EU Science, Research and Innovation
Eu Science Hub
Keep in touch

Thank you
© European Union 2020
Unless otherwise noted the reuse of this presentation is authorised under the CC BY 4.0 license. For any use or reproduction of elements that are not owned by the
EU, permission may need to be sought directly from the respective right holders.
References for figures and content are provided in the slides


