May 28, 2020
BSE Limited
Phiroze Jeejeebhoy Towers,
Dalal Street,
Mumbai 400 001
Security Code: 500878
National Stock Exchange of India Limited
Exchange Plaza,
Bandra Kurla Complex, Bandra (East),
Mumbai 400 051
Symbol: CEATLTD
CP Listing ISIN INE482A14932, INE482A14940,
INE482A14957, INE482A14965, INE482A14973,
INE482A14981
Dear Sirs /Madam,
Sub: Investors Presentation – Q4FY2020 results call
In continuation of our letter dated May 25, 2020, please find enclosed herewith Investor’s Presentation
for the period ended March 31, 2020, for the Results Earnings call scheduled on Friday, May 29, 2020 at
4:00 p.m. IST, dial-in details of which are reproduced below for ready reference:
Dial-in Details:
Mumbai +91 22 6280 1214
India (Universal) +91 70456 71221
Location Toll Number
USA +13233868721
UK +442034785524
Singapore +6531575746
Hong Kong +85230186877
We request you to kindly take the above on record.
Thanking you,
Sincerely,
For CEAT Limited
Vallari Gupte
Company Secretary & Compliance Officer
Encl: as above

An Group Company
Q4 FY20 – Investor Presentation | 28th May, 2020

This presentation may include statements which may constitute forward-looking statements. All statements that address expectations or projections about thefuture, including, but not limited to, statements about the strategy for growth, business development, market position, expenditures, and financial results, areforward looking statements. Forward looking statements are based on certain assumptions and expectations of future events. The Company cannot guaranteethat these assumptions and expectations are accurate or will be realized. The actual results, performance or achievements, could thus differ materially fromthose projected in any such forward-looking statements.
The information contained in these materials has not been independently verified. None of the Company, its Directors, Promoter or affiliates, nor any of its ortheir respective employees, advisers or representatives or any other person accepts any responsibility or liability whatsoever, whether arising in tort, contractor otherwise, for any errors, omissions or inaccuracies in such information or opinions or for any loss, cost or damage suffered or incurred howsoever arising,directly or indirectly, from any use of this document or its contents or otherwise in connection with this document, and makes no representation or warranty,express or implied, for the contents of this document including its accuracy, fairness, completeness or verification or for any other statement made orpurported to be made by any of them, or on behalf of them, and nothing in this document or at this presentation shall be relied upon as a promise orrepresentation in this respect, whether as to the past or the future. The information and opinions contained in this presentation are current, and if not statedotherwise, as of the date of this presentation. The Company undertake no obligation to update or revise any information or the opinions expressed in thispresentation as a result of new information, future events or otherwise. Any opinions or information expressed in this presentation are subject to changewithout notice.
This presentation does not constitute or form part of any offer or invitation or inducement to sell or issue, or any solicitation of any offer to purchase orsubscribe for, any securities of CEAT Limited (the “Company”), nor shall it or any part of it or the fact of its distribution form the basis of, or be relied on inconnection with, any contract or commitment therefore. Any person/ party intending to provide finance / invest in the shares/businesses of the Company shalldo so after seeking their own professional advice and after carrying out their own due diligence procedure to ensure that they are making an informeddecision. This presentation is strictly confidential and may not be copied or disseminated, in whole or in part, and in any manner or for any purpose. No personis authorized to give any information or to make any representation not contained in or inconsistent with this presentation and if given or made, suchinformation or representation must not be relied upon as having been authorized by any person. Failure to comply with this restriction may constitute aviolation of the applicable securities laws. The distribution of this document in certain jurisdictions may be restricted by law and persons into whose possessionthis presentation comes should inform themselves about and observe any such restrictions. By participating in this presentation or by accepting any copy of theslides presented, you agree to be bound by the foregoing limitations.
Disclaimer

Section 1: RPG Group Overview
Section 3: Operational & Financial Overview
Section 2: Business Overview
5-6
20-27
8-18
Table of Contents
Section 1: RPG Group Overview

KEC International
World leader in Power
TransmissionEPC space
CEAT
One of India’s leading
manufacturer of automobile tyres
ZensarTechnologies
Softwareservices provider spread across 20
countries,400+ customers.
RPG Life Sciences
Pharma company with
wide range medicines in
global generics and synthetic
APIs.
Raychem RPG
Engineering products and
servicescatering to
infrastructure segment
of the economy.
Harrisons Malayalam
One of India’s largest plantation companies with tea, rubber and
other agro products.
RPG Enterprises was founded in 1979. The group currently operates in various
industries - Infrastructure, Technology, Life Sciences, Plantations and TyreManufacturing. The group has a history of business dating back to 1820 AD in
banking, textiles, jute and tea. The Group grew in size and strength with several
acquisitions in the 1980s and 1990s. CEAT became a part of the RPG Group in 1982,which is now one of India’s fastest growing conglomerates with 20000+ employees,
presence in 100+ countries and annual gross revenues of over $3 Bn.
RPG Group: Powered by Passion, Driven by Ethics
UNLEASHTALENT
TOUCHLIVES
OUTPERFORM
AND☺
5

FY15-19 CAGR: EBITDA 9.8% PAT 10.4%
Note:1) ROCE is calculated by taking EBIT*(1-ETR) divided by Capital Employed2) ROE is calculated by taking PAT divided by Net-worth3) Market Cap updated till 30th April 2020
FY15-19CAGR: 5.6%
RPG Group: Key Financials
6
19,183 19,271 20,05221,766
23,833
FY15 FY16 FY17 FY18 FY19
Gross Total Income (Rs Cr.)
1,668
2,014 2,0452,218
2,423
739879 980 1,031 1,099
FY15 FY16 FY17 FY18 FY19
EBITDA PAT
4,6115,260
6,0666,925
7,723
16.0%
16.7% 16.2% 14.9% 14.2%
10.6%11.6% 12.3% 12.0% 11.0%
0.0%
5.0%
10.0%
15.0%
20.0%
25.0%
30.0%
35.0%
40.0%
-
1,000.00
2,000.00
3,000.00
4,000.00
5,000.00
6,000.00
7,000.00
8,000.00
9,000.00
FY15 FY16 FY17 FY18 FY19
Net Worth ROE ROCE
11,105
3,258
5,016
1,910 -
5,00 0
10,0 00
15,0 00
20,0 00
25,0 00
May-19 Jun-19 Jul-19 Aug-19 Sep-19 Oct-19 Nov-19 Dec-19 Jan-20 Feb-20 Mar-20 Apr-20
Market Cap
Group CEAT KEC ZENSAR

Section 4: Business OverviewSection 2: Business Overview

Harsh Vardhan GoenkaChairman, Non Executive Director
Anant GoenkaManaging Director
Arnab BanerjeeCOO and Whole Time Director
Atul C. ChokseyNon Executive Independent Director
Mahesh S. GuptaNon Executive
Independent Director
Paras K. ChowdharyNon Executive
Independent Director
Punita LalNon Executive
Independent Director
Ranjit PanditNon Executive
Independent Director
Vinay BansalNon Executive
Independent Director
Board of Directors
Haigreve KhaitanNon Executive
Independent Director
8
Pierre E. CohadeNon Executive
Non Independent Director

Anant Goenka
Managing Director Chief Financial Officer
Arnab Banerjee
Chief Operating Officer
Dilip Modak Vijay Gambhire
Senior Vice President – Manufacturing
Managing Director – CEAT Specialty, Senior Vice President – QBM
Kumar Subbiah
9
Leadership Team
Milind Apte
Senior Vice President – Human Resources
Peter Becker
Senior Vice President – R&D and Technology
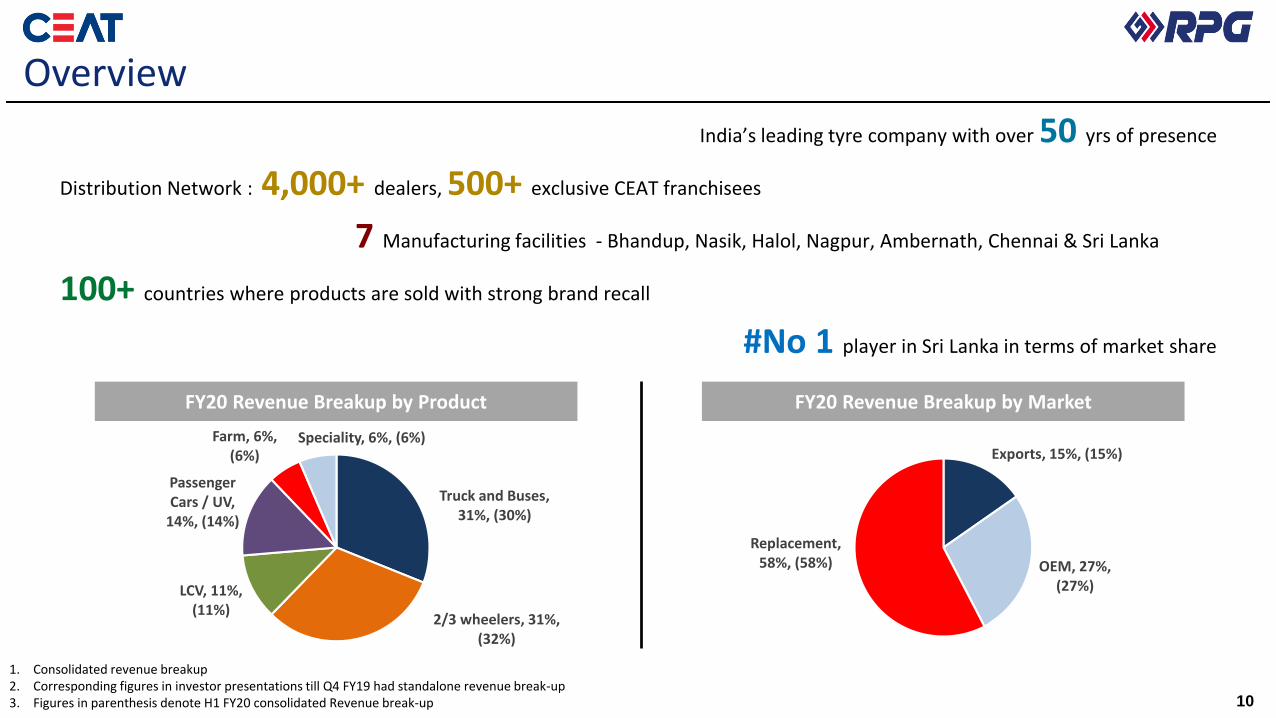
India’s leading tyre company with over 50 yrs of presence
Distribution Network : 4,000+ dealers, 500+ exclusive CEAT franchisees
7 Manufacturing facilities - Bhandup, Nasik, Halol, Nagpur, Ambernath, Chennai & Sri Lanka
100+ countries where products are sold with strong brand recall
#No 1 player in Sri Lanka in terms of market share
FY20 Revenue Breakup by Product FY20 Revenue Breakup by Market
10
Overview
1. Consolidated revenue breakup2. Corresponding figures in investor presentations till Q4 FY19 had standalone revenue break-up3. Figures in parenthesis denote H1 FY20 consolidated Revenue break-up
Truck and Buses, 31%, (30%)
2/3 wheelers, 31%, (32%)
LCV, 11%, (11%)
Passenger Cars / UV,
14%, (14%)
Farm, 6%, (6%)
Speciality, 6%, (6%)Exports, 15%, (15%)
OEM, 27%, (27%)
Replacement, 58%, (58%)

11
Strategy
Global Reach
Strong Brand
OEM RelationshipsDifferentiated Product
Extensive Distribution
World Class R&D

12
Differentiated Products1
Key developments
▪ Focus on OEM, recent entries in new models –Honda Activa(BSVI), Honda CB Shine SP (BSVI), Hero MotoCorp Splendor iSmart(BSVI), Hero MotoCorp HF Deluxe (BSVI), Hero Dare 125, Hero Duet E, Maruti Suzuki Alto VXI+, Hero Glammer Refresh, Mahindra Jeeto Z Series, Tata Intra
▪ Recent entries into OEM’s existing models – JBM CNG Bus, Mahindra Scorpio S3, Honda Bikes till 125 CC, Yamaha FZ 150 CC, Suzuki Gixxer 150 CC, Ashok Leyland Truck 1618, Daimler BSVI Trucks, Piaggio Aprilia 150 CC
▪ Platforms like Fuelsmart, Gripp,Mileage X3, SecuraDrive etc.
New Entries and Supplier to OEM’s

13
Strong Brand2
CEAT’s colourful Limited Edited CEAT Zoom Rad Tubless tyres
CEAT’s ode to the Unsung HeroesTruckers and Fleets
CEAT products:providing superior performance across segments and terrains

14
Extensive Distribution3
CEAT Shoppe Shop in Shop (SIS) Multi Brand Outlet CEAT Bike Shoppe
4000+Dealers &
Channel Partners
300+2W Distributors
500+ CEAT Franchisees
35,000+ Sub-dealers
400+ MBO / SIS
600+Districts

15
Deep OEM Partnerships4
TATA Motors Ashok Leyland VECV Escorts
Mahindra Daimler Eicher SML Isuzu
AMW TAFE
JBM Group
Maruti Suzuki TATA Motors Mahindra HyundaiRenault
Force Motors Datsun Skoda VolkswagenPeugeot
Honda Royal Enfield Bajaj Yamaha Hero
Piaggio LML Tunwal Okinawa Scooters
Hero ElectricSuzuki
Tork Kawasaki
KIA
Morris Garage

16
World Class R&D5
State-of-the-Art R&D Center, Halol R&D Office, Germany
▪ Significant investment on tyre testing infrastructure like Anechoic Chamber, Flat Track Test Machine
▪ Focus on upcoming technologies like Electric Vehicle, Sustainability and Smart Tyres

Expanding Global Reach
▪ Exports to 90+ Countries in 7 clusters
▪ Sri Lanka: Manufacturing facility and Leadership position in the market and with 50+% market share
▪ Focused product and distribution strategy for select clusters and countries
Far East 1 Cluster
Africa
Cluster
LATAM
Cluster
Middle East
Cluster
Europe Cluster
US Cluster
Emerging markets
Key Export Clusters
Far East 2 Cluster
6
17

Expanding Global Reach6
18
CEAT commissioned its Greenfield facility at Chennai

Section 5: Operational & Financial Overview
Section 3: Operational & Financial Overview
20
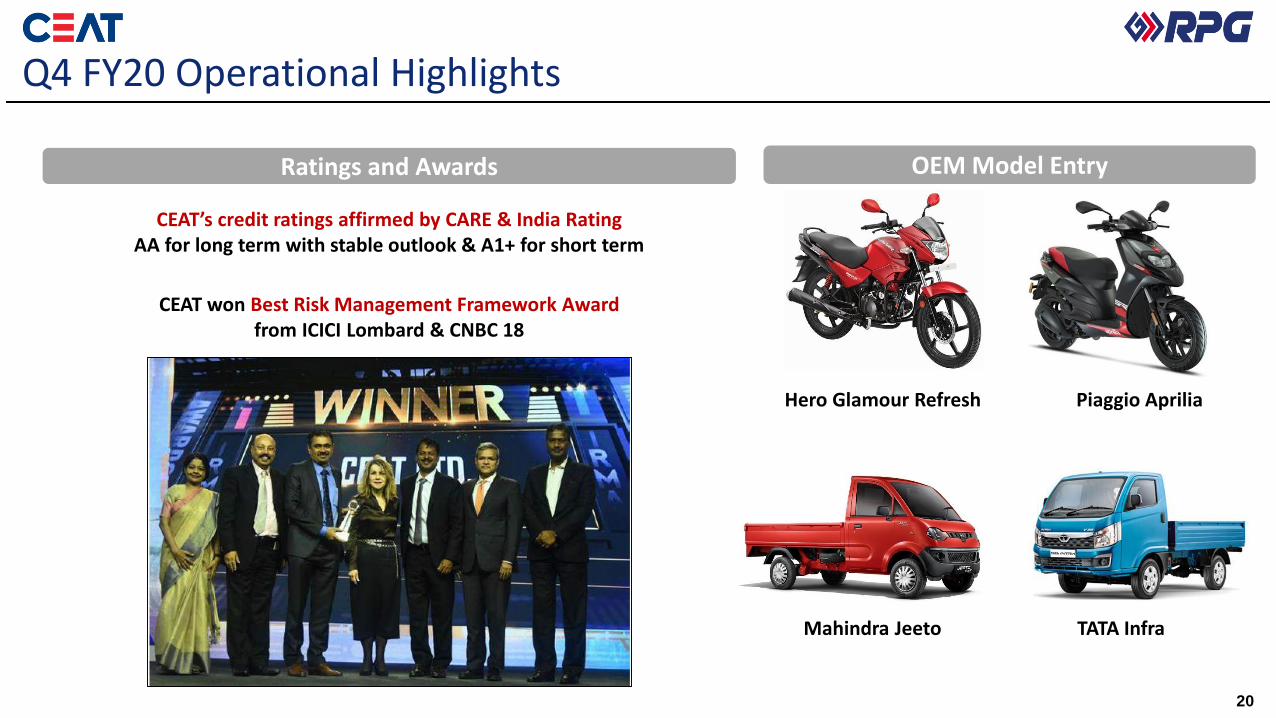
Q4 FY20 Operational Highlights
OEM Model EntryRatings and Awards
CEAT’s credit ratings affirmed by CARE & India Rating AA for long term with stable outlook & A1+ for short term
Hero Glamour Refresh Piaggio Aprilia
Mahindra Jeeto TATA Infra
CEAT won Best Risk Management Framework Award from ICICI Lombard & CNBC 18

Q4 FY20 v/s Q3 FY20 (Q-o-Q)
▪ Net revenue from operations declined by 10.7% at INR
1,573 Crs from INR 1,762 Crs
▪ Gross margin expanded to 45.6% from 43.0%
▪ EBITDA stood at INR 203 Crs compared to INR 188 Crs;
margins at 12.9% from 10.7%
▪ PAT stood at INR 52 Crs compared to INR 53 Crs
▪ Debt / equity at 0.66x compared to 0.65x
21
Consolidated: Q4 FY20 Financial Highlights
Q4 FY20 v/s Q4 FY19 (Y-o-Y)
▪ Net revenue from operations declined by 10.6% at INR
1,573 Crs from INR 1,760 Crs
▪ Gross margin expanded to 45.6% from 39.3%
▪ EBITDA stood at INR 203 Crs compared to INR 166 Crs;
margins at 12.9% from 9.4%
▪ PAT stood at INR 52 Crs compared to INR 64 Crs
▪ Debt / equity at 0.66x compared to 0.54x
Rev
en
ue
gro
wth
Mar
gin
tre
nd
s
22
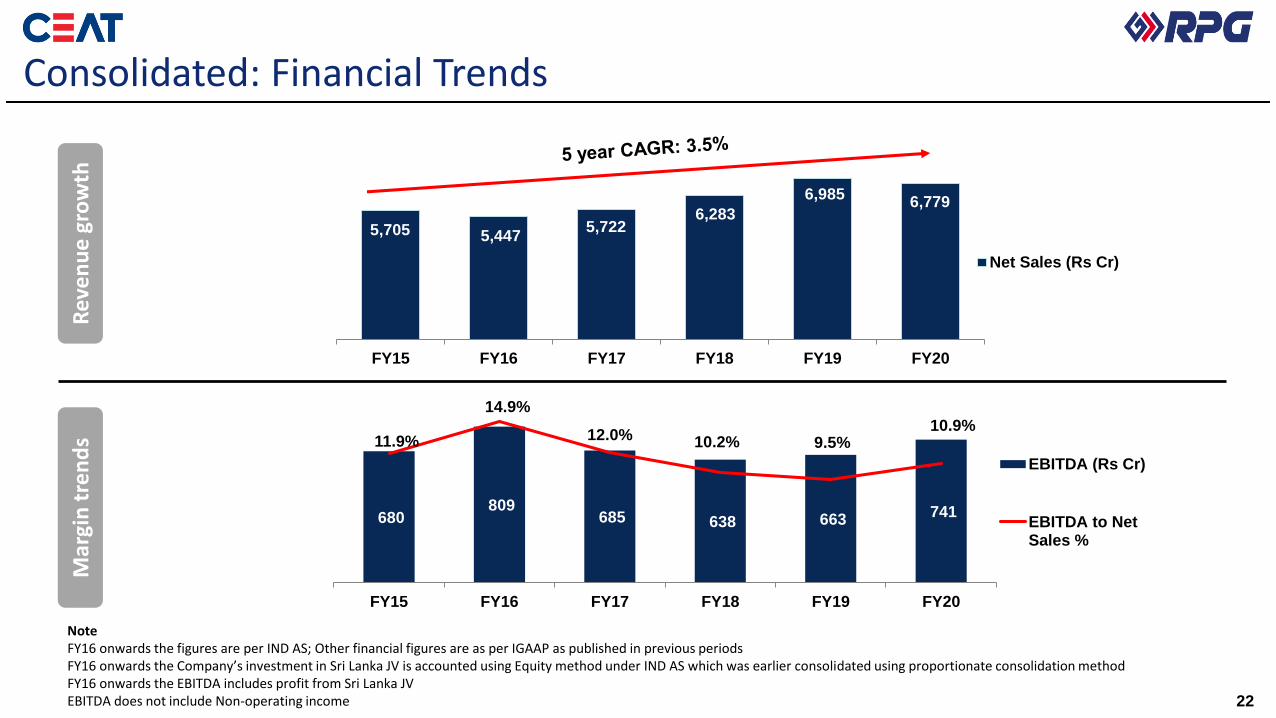
Consolidated: Financial Trends
NoteFY16 onwards the figures are per IND AS; Other financial figures are as per IGAAP as published in previous periodsFY16 onwards the Company’s investment in Sri Lanka JV is accounted using Equity method under IND AS which was earlier consolidated using proportionate consolidation methodFY16 onwards the EBITDA includes profit from Sri Lanka JVEBITDA does not include Non-operating income
5,705 5,722 6,283
6,985 6,779
FY15 FY16 FY17 FY18 FY19 FY20
Net Sales (Rs Cr)
5,447
680 809
685 638 663 741
11.9%
14.9%
12.0% 10.2% 9.5%10.9%
0.0%
2.0%
4.0%
6.0%
8.0%
10.0%
12.0%
14.0%
16.0%
FY15 FY16 FY17 FY18 FY19 FY20
EBITDA (Rs Cr)
EBITDA to NetSales %

PAT
tre
nd
s
NotesFY16 onwards the figures are per IND AS; Other financial figures are as per IGAAP as published in previous periods 23
Consolidated: Financial Trends
317
438 361
233 251 230
5.6%
8.0%
6.3%
3.7%3.6%
3.4%
0.0%
1.0%
2.0%
3.0%
4.0%
5.0%
6.0%
7.0%
8.0%
9.0%
-
50
100
150
200
250
300
350
400
450
500
FY15 FY16 FY17 FY18 FY19 FY20
PAT (Rs Cr)
PAT to NetSales%

24
Consolidated: Q4 FY20 Financials
NotesFigures are as per IND AS Company’s investment in Sri Lanka JV is accounted using Equity method under IND AS which was earlier consolidated using proportionate consolidation methodGross margin includes impact of non-material cost movement of inventory (FG + SFG)EBITDA includes profit from Sri Lanka JVEBITDA does not include Non-operating income
All figures in INR Cr
Parameter Q4 FY19 Q3 FY20 Q4 FY20 QoQ YoY FY19 FY20 YoY
Net Revenue from operations 1,760.5 1,761.8 1,573.4 -11% -11% 6,984.5 6,778.8 -3%
Raw Material 1,069.2 1,004.7 855.2 -15% -20% 4,181.8 3,915.1 -6%
Gross margin 691.3 757.0 718.3 -5% 4% 2,802.7 2,863.8 2%
Gross margin % 39.3% 43.0% 45.6% 268 bps 638 bps 40.1% 42.2% 212 bps
Employee Cost 127.8 144.3 141.8 -2% 11% 530.1 541.8 2%
Other Expenses 401.2 429.6 376.1 -12% -6% 1,630.1 1,598.1 -2%
EBITDA 165.6 187.9 202.9 8% 23% 662.7 741.1 12%
EBITDA % 9.4% 10.7% 12.9% 223 bps 349 bps 9.5% 10.9% 144 bps
Finance Cost 26.9 38.0 40.7 7% 51% 88.0 150.9 71%
Depreciation 50.8 70.5 74.5 6% 47% 192.7 276.5 43%
Operating PBT 87.9 79.3 87.7 11% 0% 382.0 313.6 -18%
Exceptional expense 40.5 0.3 28.2 -30% 44.8 29.8 -33%
Non-Operating income 30.6 3.6 3.5 -2% -89% 39.0 20.5 -47%
PBT 78.0 82.6 63.1 -24% -19% 376.2 304.3 -19%
PAT 64.3 52.5 51.7 -1% -20% 251.1 230.1 -8%

De
bt
bre
aku
pLe
vera
ge r
atio
s
Total Debt (INR Cr)
775 663 872
25
Consolidated: Leverage / coverage Profile
NoteFY16 onwards the figures are per IND AS; Other financial figures are as per IGAAP as published in previous periodsCompany’s investment in Sri Lanka JV is accounted using Equity method under IND AS which was earlier consolidated using proportionate consolidation methodEBITDA includes profit from Sri Lanka JV; EBITDA does not include Non- operating incomeLong Term debt also includes the ‘Current Maturities’ component of the long term debt
924 1498 1929
272 34 58 196 224 236
503630 866 676
1274
1693
0.460.32 0.38 0.33
0.540.66
0
200
400
600
800
100 0
120 0
140 0
160 0
180 0
FY 15 FY 16 FY 17 FY18 FY19 FY20
LT Debt (Rs Cr)
ST Debt (Rs Cr)
D/E
680
809685 638 663
741
1.1 0.8 1.3 1.4 2.32.6
5.28.5 8.4
6.67.5 4.9
FY 15 FY 16 FY 17 FY18 FY19 FY20
EBITDA (Rs Cr)
Debt / EBITDA (x)
EBITDA / Interest (x)
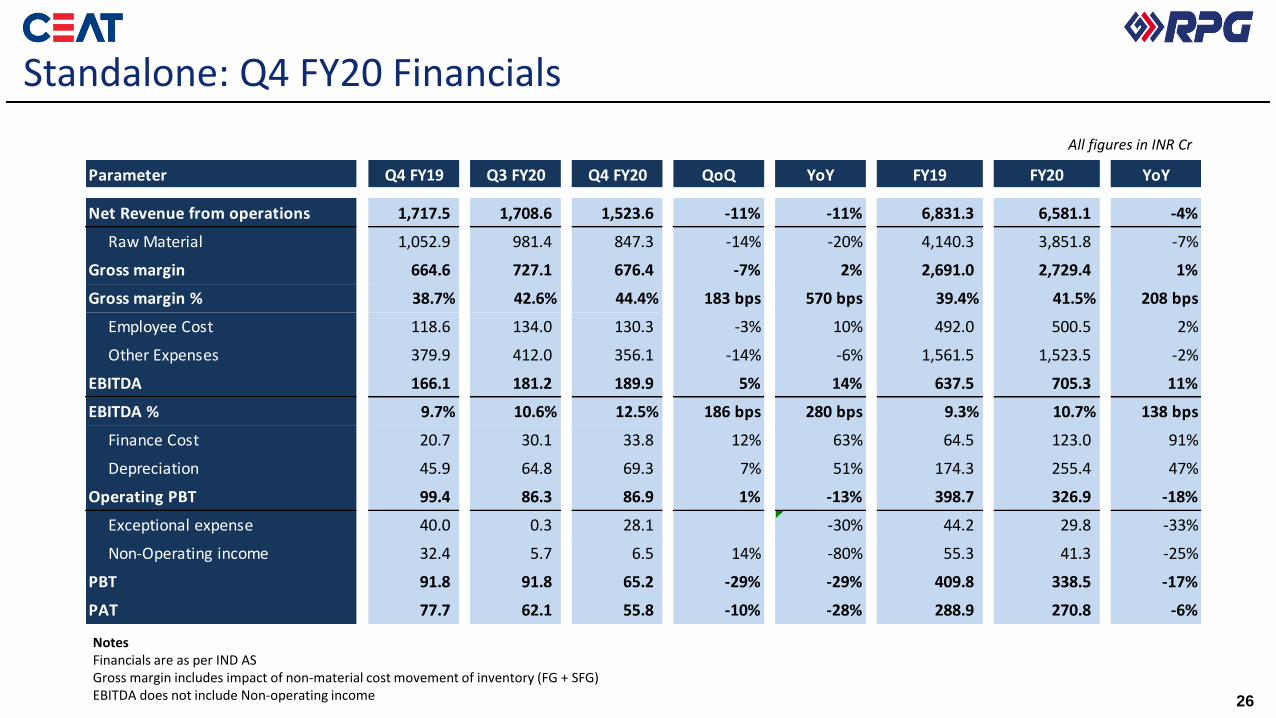
NotesFinancials are as per IND ASGross margin includes impact of non-material cost movement of inventory (FG + SFG)EBITDA does not include Non-operating income 26
Standalone: Q4 FY20 Financials
All figures in INR Cr
Parameter Q4 FY19 Q3 FY20 Q4 FY20 QoQ YoY FY19 FY20 YoY
Net Revenue from operations 1,717.5 1,708.6 1,523.6 -11% -11% 6,831.3 6,581.1 -4%
Raw Material 1,052.9 981.4 847.3 -14% -20% 4,140.3 3,851.8 -7%
Gross margin 664.6 727.1 676.4 -7% 2% 2,691.0 2,729.4 1%
Gross margin % 38.7% 42.6% 44.4% 183 bps 570 bps 39.4% 41.5% 208 bps
Employee Cost 118.6 134.0 130.3 -3% 10% 492.0 500.5 2%
Other Expenses 379.9 412.0 356.1 -14% -6% 1,561.5 1,523.5 -2%
EBITDA 166.1 181.2 189.9 5% 14% 637.5 705.3 11%
EBITDA % 9.7% 10.6% 12.5% 186 bps 280 bps 9.3% 10.7% 138 bps
Finance Cost 20.7 30.1 33.8 12% 63% 64.5 123.0 91%
Depreciation 45.9 64.8 69.3 7% 51% 174.3 255.4 47%
Operating PBT 99.4 86.3 86.9 1% -13% 398.7 326.9 -18%
Exceptional expense 40.0 0.3 28.1 -30% 44.2 29.8 -33%
Non-Operating income 32.4 5.7 6.5 14% -80% 55.3 41.3 -25%
PBT 91.8 91.8 65.2 -29% -29% 409.8 338.5 -17%
PAT 77.7 62.1 55.8 -10% -28% 288.9 270.8 -6%

▪ Market Price (May 27th, 2020): INR 760.8/share
▪ Face Value : INR 10/share
▪ Market Cap (May 27th, 2020): INR 3,077 Cr
Shareholding Pattern as onMarch 31, 2020 Market Information
Source : Capitaline. The above data is updated till 31st March 2020
27
Equity Shareholding & Price trends
-
500,000
1,000,000
1,500,000
2,000,000
2,500,000
3,000,000
-
200
400
600
800
1,000
1,200
Apr-19 May-19 Jun-19 Jul-19 Aug-19 Sep-19 Oct-19 Nov-19 Dec-19 Jan-20 Feb-20 Mar-20
Share Price (INR) Total Volume
46.7%
28.2%
6.1%
7.8%
11.2%Promoters
FII/FPI
Mutual Funds
Ins., Fin. Inst. & OtherCorp.Public/Others

Y O UT H A N K


